the Creative Commons Attribution 4.0 License.
the Creative Commons Attribution 4.0 License.
Development of an integrated analytical platform for clay mineral separation, characterization and K–Ar dating
Marie Gerardin
Gaétan Milesi
Julien Mercadier
Michel Cathelineau
Danièle Bartier
Isotopic dating is a valuable method to constrain the timing of lithospheric processes: geodynamic episodes, ore deposition and geothermal regimes. The K–Ar dating technique has the main advantage of being applied to ubiquitous K-bearing minerals that crystallize at various temperatures, from magmatic to low temperatures. Clays are of significant interest among all K-bearing minerals, as they crystallize during various hydrothermodynamic processes. Nonetheless, the dating of illites by the K–Ar method is not straightforward. K–Ar dates on illite usually rely on a mixed isotopic signal referring to various illitic populations that might have experienced isotopic resetting or recrystallization processes. Therefore, reliable K–Ar dates on illite depend on (1) the grain size separation of large numbers of clay fractions; (2) the study of the morphology, mineralogy and crystallography; (3) the determination of precise K–Ar dates on each clay size fraction; and (4) the meaningful interpretation of ages using either end-member ages or the illite age analysis (IAA) method. This paper describes the instrumentation and methods recently developed at the GeoRessources laboratory of the University of Lorraine to obtain valuable ages on illite mixtures.
- Article
(2005 KB) - Full-text XML
- BibTeX
- EndNote
The K–Ar dating method is based on the principle of the natural radioactive decay of the parent element 40K to the daughter element 40Ar. Potassium is an abundant element in the lithosphere. Its half-life of 1.248±0.004 Ga (Grau Malonda and Grau Carles, 2002; Steiger and Jäger, 1977) is optimal for dating events over a wide range of geological times, from the early Precambrian to the Holocene (Dalrymple and Lanphere, 1969; Renne, 2000). Its abundance allows detectable radiogenic argon to be accumulated after only several thousands of years. Argon is a noble gas, thus weakly bound to the mineral structure, but is retained in minerals because of its large atomic size (McDougall and Harrison, 1988, 1999). After sample melting, argon is measured by mass spectrometry, which was greatly developed after Nier's pioneering work in the 1950s (Aldrich and Nier, 1948; Nier, 1940, 1950). The application to many rock-forming minerals, the large range of geological times explored, and the reliability of the quantitative determination of K and 40Ar make K–Ar a popular dating technique developed worldwide. The early development of the K–Ar dating technique is extensively detailed by Schaeffer and Zähringer (1966) and by Dalrymple and Lanphere (1969). More recently, Guillou et al. (2021) provided an extensive review of the protocol and method along with its 40Ar 39Ar-derived version (fully described by McDougall and Harrison, 1988). Although the fundamentals of the method are not reiterated here, some key considerations are highlighted for a clear understanding of this work.
The method relies on several assumptions. It is assumed that (1) the decay of the parent nuclide, 40K, is not affected by temperature or pressure changes; (2) the 40K K ratio (0.01167 %) is constant over geological times; (3) the total amount of radiogenic 40Ar measured in the mineral is produced by the decay of 40K; (4) the isotopic ratios of atmospheric argon remained unchanged over geological times (Renne et al., 2009); and (5) the mineral or rock evolved as a closed system that did not lose or gain potassium or radiogenic argon (other than by radioactive decay). The latter might be false if the system has a complex geological and thermal history, but the resulting age can still provide valuable information on the thermal history, especially by using the Ar–Ar step-heating technique (McDougall and Harrison, 1988) (more details about the comparison of K–Ar and Ar–Ar ages on illite can be found in Clauer et al., 2012). Given these assumptions, the age calculated indicates the length of time the daughter element has remained trapped in the mineral. This age relates to the crystallization event in the case of fast cooling (e.g., unaltered volcanic rocks), the closure time for slow-cooling rocks (e.g., plutonic, metamorphic) or recrystallization during more recent geological hydrothermal or thermal episodes.
The main advantage of the K–Ar method is its application to K-rich minerals like phyllosilicates or feldspars, which crystallize in a wide range of temperatures from low (100–300 °C) to magmatic temperatures. Clay-type phyllosilicates are of particular interest considering their ubiquity at the scale of the Earth system (Fig. 1). Since their chemistry depends on physical conditions (pressure and temperature) and on the type of host rocks, clay minerals are helpful markers of low-temperature geological processes such as basin diagenesis (Meunier et al., 2004; Perry, 1974), low-temperature metamorphism (Akker et al., 2021; Reuter and Dallmeyer, 1989), brittle fault deformation (Kralik et al., 1987; Monié et al., 2023) and hydrothermalism (Brockamp and Clauer, 2013; Zwingmann et al., 1998). The study of clay minerals, including their geochronology, is a powerful tool to constrain physical and chemical processes occurring at the micro- and nanoscale, improving our understanding of the evolution of the Earth system (Fig. 1).
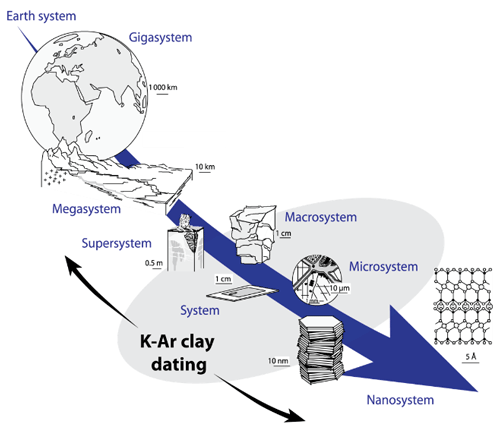
Figure 1Potential of K–Ar clay dating for the understanding of geological processes at different scales, modeled on Velde and Meunier (2008).
One of the main concerns about dating clay minerals is the interpretation of their ages, since the data often result from a mixture of different clay populations (broadly mentioned in Clauer's work (Clauer, 2020a, b, for the latest), which could be affected by partial isotopic and chemical resetting or by a recurrent crystallization history. As clearly explained in the latest reviews of Clauer (2020a) and Hueck et al. (2022), K–Ar dating should only be performed on illite fractions properly separated by grain size. Mineralogical, morphological, crystallographic and geochemical information is also required prior to dating to interpret the ages. Those conditions substantiate the need to develop an integrated method coupling efficient clay separations and characterization with K–Ar dating.
This paper presents the platform developed at the GeoRessources laboratory (University of Lorraine) to date clay minerals using the K–Ar method. It includes (1) a detailed description of the argon extraction line and its technical characteristics, along with the methodology to quantify radiogenic argon, and (2) the specificity of the separation protocol and the characterization steps necessary to obtain valuable ages on illites. Finally, the method to extrapolate ages from mixed populations of illite is presented and discussed in light of the literature data.
2.1 Age calculation
The K–Ar age calculation is based on two separately determined analytical values: the content of potassium (40K, radioactive parent) and the content of radiogenic argon (40Ar*, radiogenic daughter). Both analyses are destructive; therefore, two separate aliquots from the same sample are used. The homogeneity of these aliquots is granted by (1) preparing the two aliquots on the same day (same temperature and humidity conditions) and (2) using a large mass of aliquots to neglect the mineral heterogeneities. Classically, 100 mg is required for %K2O determination by absorption spectroscopy, regardless of the age or potassium content. For argon measurements, the mass minimum depends on the argon content (i.e., potassium concentration and age). A minimum of 1 to 3 mg is required for the clay fractions (< 2 µm), and 20 mg is required for materials with larger particle sizes (see Appendix A for details about mass accepted in the extraction line).
The equation to calculate the age is derived from the fundamental law of radioactive decay and is expressed as follows:
where t is the age expressed in million years (Ma) (Nomade, 2017), is the number of 40Ar* atoms per gram of sample at a time t, is the number of radioactive 40K atoms per gram of sample at a time t and λ is the total decay constant of 40K equal to (see Table 1 listing the values and descriptions of constants used for the age calculation). If not specified, all errors reported in this paper are expressed as 1 standard deviation.
2.2 Measurement of the K2O content
The potassium content is determined by optical emission spectrometry (ICP-OES) at the Service d'Analyse des Roches et des Minéraux (SARM) of the CRPG laboratory in Nancy, France. The reliability of their measurements is based on repeatable experiments on standard materials. The uncertainty on K2O expressed in weight percent in the 1 %–10 % quantity range (typical of micas) is about 1.5 % (2σ) for 100 mg samples.
2.3 Description of the extraction line for argon quantification
Argon release is performed on an extraction–purification noble gas line. Preparation line specifications depend on each laboratory (Boulesteix et al., 2020; Cattani et al., 2019; Charbit et al., 1998; Gillot and Cornette, 1986; Morgan et al., 2011; Phillips et al., 2017; Rouchon et al., 2008) but commonly comprise an induction furnace connected to a gas purification zone connected to a mass spectrometer. A schematic diagram of the ultra-high vacuum line developed at GeoRessources is shown in Fig. 2.
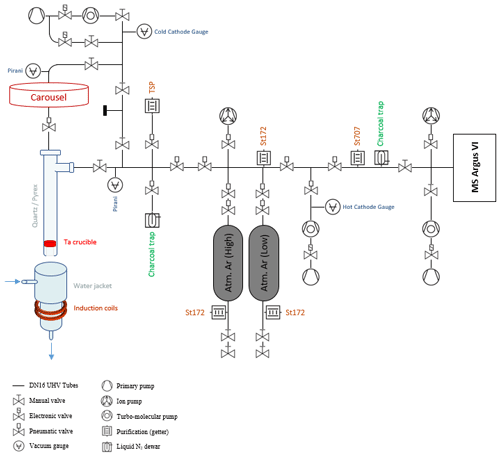
Figure 2Schematic representation of the argon extraction line from the induction furnace to the mass spectrometer.
Aliquots of samples are packed in a bending consisting of a 99.95 % pure copper foil. They are placed under vacuum in individual pits of the carousel above the furnace. The samples are vacuum-pumped using a turbo-molecular pump for 24 h. This procedure was found to be equivalent to 24 h backing at 105 °C to remove adsorbed water from the sample (see Appendix B).
Each of the 10 pits connects to the furnace aperture by manual rotation of the carousel, dropping the sample by gravity into the Ta crucible. The carousel is isolated from the furnace by a UHV gate valve during heating.
The heating–melting setup is identical to the one originally settled in LSCE (Guillou et al., 2021) and in GEOPS (Gillot and Cornette, 1986) (Paris, France) for K–Ar dating. The samples are heated using a high-frequency furnace, with the induction coil ringing a quartz tube containing a Ta crucible mounted on a Mo stool (to avoid direct contact with the quartz tube).
Gases other than argon that are released during sample melting could be water vapor, hydrogen, oxygen, nitrogen, hydrocarbons, carbon dioxide and rare gases such as helium or krypton. The purification line next to the furnace is designed to trap all these gases in order to introduce only purified argon into the mass spectrometer. The purification process is a two-stage one: extracted gases are firstly exposed to a Ti sublimation pump and secondly to a GP50 SorbAC coupled to an St707 cartridge from SAES getters operating at room temperature (see performance in Guillou et al., 2021). A charcoal trap cooled at −196 °C (liquid nitrogen temperature) is used to transfer the gas from the furnace through the purification line. This cold trap is also useful for gas separation, since H and He are not physio-sorbed on the charcoal surface. The efficiency of the purification is checked for each sample (see Sect. 2.5).
After 45 min of gas cleanup, Ar isotopes 36, 38 and 40 are simultaneously analyzed using an ARGUS VI multi-collector mass spectrometer; that is, a magnetic mass sector with a Nier-type source designed for operation in static mode (Mark et al., 2009). The ARGUS VI spectrometer has five Faraday detectors and one CDD detector. Argon 40 is measured on the H2 Faraday cup fitted with a 1011 ohm resistor. Argon isotopes 36 and 38 are measured on the AX and the L2 cups respectively, both amplified with 1012 ohm resistors. All collectors are cross-calibrated by scanning the 40Ar signal onto each cup. To compare one analysis to another, the analyzed volume has to be fixed and comprises the analyzing chamber of the mass spectrometer and the adjacent volume containing a Zr–Al getter and a charcoal trap. For argon analysis, the trap current is set at 170 µA with an electron potential of 60 eV. The acceleration potential is 4.5 kV.
2.4 Signal corrections
Figure 3 shows the signal measured on the H2 cup (40Ar) of a dose of atmospheric argon entering the mass spectrometer at t0. The gas equilibrium state is achieved 8 s after t0. An exponential regression is performed on the signal integrated over a period of 120 s to determine the signal at t0.
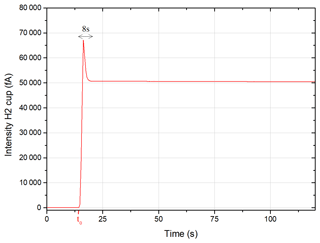
Figure 3Intensity measured on the H2 cup (40Ar) of 1DE (atmospheric argon) entering the mass spectrometer.
The sensitivity of the spectrometer depends on the ionization capacities of the source (Loveless and Russell, 1969; Werner, 1974; Holst et al., 1999; Rüedenauer, 1972), on the gas pressure inside the analyzing chamber (Burnard and Farley, 2000) and on the detector type (Turrin et al., 2010). The intensity I(xAr) then has to be corrected for the gas pressure effect.
The pressure dependence is assessed via the analysis of the increasing number of calibrated air doses, named “dose equivalent” (DE) (Charbit et al., 1998). One DE is determined as the total amount of atmospheric argon contained in one aliquot expanded from an air container into the mass spectrometer (see Appendix C for details about the air container). The intensity of isotope 40 and the ratio measured by the spectrometer from 1 to 5 accumulated DE (replicated) are shown in Fig. 4. Note that the depletion of the container for five doses is negligible considering isotopic measurement errors.
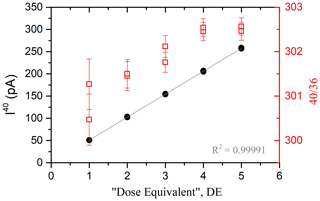
Figure 4Signal of 40Ar (black dots) and 40Ar 36Ar (red squares) as a function of the number of the accumulated DE sampled from the air container. The gray line is the linear fit applied to the experimental data. The maximum number of the DE is chosen considering the saturation value of the cups (400 pA for the 40Ar cup and 40 pA for the 38Ar and 36Ar cups) and the experimental handling capacities.
According to Fig. 4, the pressure dependence in the mass spectrometer is linear. The relation between the number of the DE and the 40Ar signal is given by the following equation:
Note that this equation is valid when I(40Ar) > 0.01 pA, corresponding to the lowest signal measurable in the mass spectrometer (see the blank measurements in Sect. 2.6, Blank measurements). The mass discrimination due to the ionization capacities of the electronic source does not significantly depend on the argon pressure. Considering uncertainties, the ratio of atmospheric argon measured by the mass spectrometer (see Fig. 4) is considered to be constant at 302±1.
2.5 Analysis procedure
The method applied here is based on the unspiked technique described by Cassignol and Gillot (1982). The argon measurement procedure is based on two independent analyses. The first is the measurement of the total 40Ar released from the sample (Fig. 5a). The ratio RS of the 40Ar to 36Ar and the DES ( corrected from the pressure effect) are calculated. The second analysis is the measurement of a calibrated aliquot of atmospheric argon for the quantitative determination of the number of 40Ar* atoms released from the sample (Fig. 5b). During this step, the atmospheric 40Ar 36Ar ratio is measured by the mass spectrometer. This ratio is used directly to calculate the proportion of radiogenic argon . Also, the DEP ( corrected from the pressure effect) is calculated.
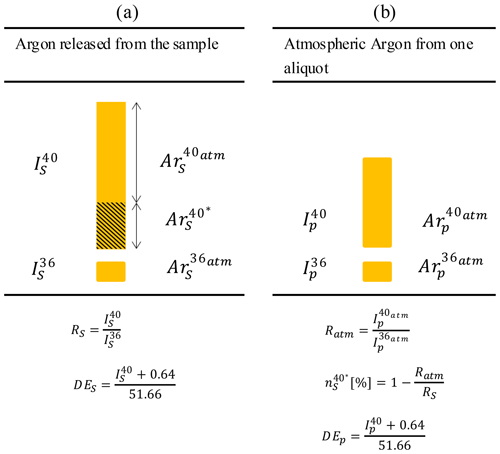
Figure 5The two-step protocol for measuring radiogenic argon from rock samples (schematic representation derived from Gillot et al., 2006). R is the ratio of the 40 to 36, is the proportion of radiogenic argon in the sample and DE is the number of the dose equivalent deduced from the pressure calibration.
The number of 40Ar* atoms released from sample per gram is then
where m is the mass (g) and nDE is the number of atoms of 40Ar contained in 1 DE, which is calculated from the analysis of standard minerals. Here, this calculation relies on the analysis of seven splits of HD-B1 (biotite from the Bergell granodiorite (Italy) (Fuhrmann et al., 1987; Schwarz and Trieloff, 2007), split , grain size 200–500 µm). We recalculated the number of 40Ar* atoms per gram of HD-B1 using the value of %K2O determined by SARM following our protocol (K2O = 9.52±0.01 %, deviation of 0.6 % from the published value; see Table 3) and the published age of Ma. nDE was determined with an uncertainty of 0.5 % achieved from the analysis of seven HD-B1 samples. This standard is periodically analyzed (1 out of 10 unknown samples) to evaluate the deviation of nDE relative to the time. Also, the pressure calibration is reiterated twice a year because of the depletion of the air container after the successive sampling of air aliquots.
The final check performed to validate an analysis is the verification of the efficiency of the gas cleanup. A mass scan over oxygen pics is performed for each sample using the ARGUS VI mass spectrometer. Validation is made if the oxygen peak is equal to or lower than that obtained when analyzing an aliquot of air.
2.6 Blank measurements
Blank measurements are periodically performed (1 out of 10 samples) to verify that their argon composition is equivalent to the atmospheric one (i.e., the absence of radiogenic argon or any hydrocarbons or HCl remaining in the system). The protocol for blank measurement is exactly the same as for sample analyses. The results of the latest blank measurement are listed in Table 2. 40Ar blank values are about 37 times less than those of 1 DE. The 40Ar value of the unknowns is usually 10 times higher than the procedural blank. Table 2 also presents the electronic blank of the ARGUS VI mass spectrometer (signals on the H2, AX and L2 faraday detectors during pumping in the analyzing chamber). Because the composition of this blank is atmospheric, there is no need to deduce it from the signal of the sample. This means that our measurement of the proportion of radiogenic argon ( is reduced. Our measurements so far lead to an underestimation from 1 % to 10 % of the proportion of the radiogenic argon initially contained in the sample. The underestimation of this value depends on the 40Ar intensity ratio between the blank and the sample.
2.7 Reference materials
To our knowledge, no clay material is used as a reference material for K–Ar dating. Three phyllosilicates (muscovite and glauconite) of different ages were chosen instead to validate the protocol for measuring potassium and argon:
-
GL-O, the glauconite of Odin from the Cauville cliff (France) (Boulesteix et al., 2020; Odin, 1982);
-
B/Mus2, a muscovite from the Bärhalde granite in the Black Forest (Germany) (Rittmann, 1984), used as an in-house standard by Schwarz and Trieloff (2007);
-
PANXVII-3, large muscovite selvage of quartz vein from Panasqueira (Portugal), with in-house reference material dated by K–Ar (Snee et al., 1988) and more recently by Ar Ar (Carocci et al., 2020).
Table 3 compares the ages obtained at GeoRessources to those from the literature of the three micas. The deviation from the literature of ages is less than 0.6 %, which is lower than the uncertainty of the individual ages. These results validate the protocol used to measure potassium and radiogenic argon at GeoRessources.
Clay fractions often contain a mixture of various illite polytypes (Bailey, 1966), possibly from different origins (detrital and authigenic) and generations (Clauer, 2013). Common illite polytypes are 1Md, 1M and 2M1 (Reynolds and Thomson, 1993). In sedimentary units, the 2M1 illite polytype is regarded as a detrital component due to its inert behavior in anchizonal to epizonal conditions (Bailey, 1966; Środoń and Eberl, 1984). It generally forms thicker platy crystallites shaped with irregular edges from being subjected to some dissolution and erosional processes since crystallization (Clauer, 2013). The 1Md and 1M illite polytypes are regarded as authigenic products formed under diagenetic to anchimetamorphic conditions (Grathoff and Moore, 1996). They are generally platy to fibrous or lath-shaped (Peltz et al., 2022).
The separation of illite polytypes of different origin and generations is commonly attempted by separating illites by their particle size. XRD analyses and SEM observations are then performed on each size fraction with the main objective of relating mineralogical, crystallographic and morphological characteristics of the various illite populations to their crystallization ages.
3.1 Separation
A large amount of clay material is needed to perform XRD and K–Ar dating (see Sect. 2.1). The following procedure is adapted from conventional separation techniques, enabling the production of large amounts of datable clay.
The sample material is first gently crushed using a mortar or different grinding machines depending on the stiffness of the sample. The crushed sample is added to deionized water for disaggregation in an ultrasonic bath for approximately 30 min. Firstly, the coarse fractions (typically < 2 µm, 2–5 and 5–10 µm) are separated using gravity sedimentation based on Stokes' law. For this, the disaggregated sample is poured into 2 L cylinders placed in a thermostatically controlled water tank. The GeoRessources laboratory owns two in-house-designed water tanks that can carry six 2 L cylinders each. Both are fitted with a tube system that connects the cylinders to a water pump so as to minimize the vibrations during sampling. To increase the efficiency of the separations and the yield of the suspensions (especially < 2 µm), sampling of the same size fraction is performed several times on (1) the remaining solution and (2) the sampled solution. The < 2 µm fraction is used to separate smaller fractions down to at least < 0.1 µm, using a Beckman Coultier Avanti J-26S XP centrifuge fitted with a JCF-Z continuous-flow rotor coupled to a calibrated peristaltic pump. This system allows the direction separation of fractions during centrifugation. The time required for the procedure depends only on the volume of the solution to be separated. For example, the separation of 4 L of solution generally lasts around 20 min; that is, much faster than the several days needed with a classical separation technique (Poppe et al., 2001).
Fractions of 1–2, 0.5–1 and < 0.5 µm were separated using the following parameters derived from Viola et al. (2018): 3000 RPM and 350 mL min−1 for the < 1 µm, 1270 RPM and 250 mL min−1 for the < 0.5 µm, 6000 RPM and 230 mL min−1 for the < 0.2 µm, and 10 000 RPM and 160 mL min−1 for the < 0.1 µm. Supernatants were then collected by centrifugation using the same centrifuge fitted with a JA-10 rotor with the following parameters: 6000 RPM and 10 min for 1–2 µm, 7000 RPM and 10 min for 0.5–1 µm, and 9000 RPM and 20 min for all fractions below 0.5 µm. The remaining excess of water was removed by air drying for a few days.
The efficiency of this separation protocol was monitored using a laser particle sizer and SEM observations. An example of the particle size proportion estimated in each separated fraction is shown in Appendix D. As expected, a clear reduction in particle size is observed in the finer fraction.
Coupling the large capacities of the Stokes benches to the centrifuge fitted with the continuous-flow rotor increases our ability to collect large numbers of fractions, especially for the finest particles. For example, 200 mg of the < 0.5 µm fraction was isolated from a 55 g sample of fault gouge. Thus, this device and its associated separation protocol provide sufficient material for carrying out mineralogical characterization by XRD and K–Ar geochronology.
3.2 Structural and mineralogical characterization
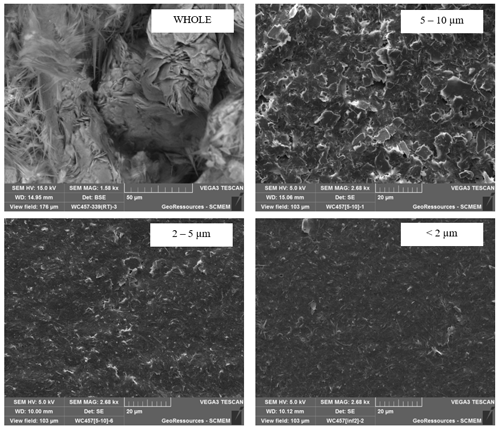
SEM observations are performed on a TESCAN VEGA3 equipped with an energy-dispersive spectrometer (EDS) at the Service Commun de Microscopies Electroniques et de Microanalyses (SCMEM) at GeoRessources. Firstly, thin sections, chips or polished sections of the whole rock are observed to obtain some structural and textural information. Secondly, the separated fractions are observed to (1) verify the size of the particles and (2) identify the morphology in each fraction. In the example given in Appendix D, particles of the coarse fractions are platy and hairy in the finer fractions. One can assume at this stage that the sample contains two different polytypes of illite, possibly formed during successive geological events.
The different clay minerals are characterized by XRD using a Bruker D2 PHASER equipped with a copper tube (35 kV, 40 mA). Firstly, oriented mounts of the < 2 µm fractions are prepared following the methods of Moore and Reynolds (1997) and scanned over a range of 2 to 40° 2θ with a step size of 0.02° 2θ and a 1 s count time per step. The identification of clay minerals is performed by comparing the diffractograms obtained under air dry (AD), ethylene glycol solvation (EG) and heating (H) at 490 °C. The comparison between (1) the AD and EG XRD diffractograms allows the identification of the illite/smectite mixed layer, and the comparison between (2) the AD and H allows kaolinite identification (Holtzapffel, 1986). The values of the illite crystallinity are expressed by the Kübler index (KI) (Kübler, 1966). Randomly oriented powders are also mounted using an Si-low background sample holder with a 0.5 mm sample cavity. The sample holder is filled by the side as recommended by Grathoff and Moore (1996). The orientation randomness is checked by the ratio of the (002) (020) illite peaks, which should be low for non-oriented samples. This preparation is scanned over a range of 16 to 38° 2θ with a step size of 0.01° 2θ and a 3 s count time per step.
The peaks corresponding to the polytypes of illite (i.e., 2M1, 1M and 1Md) are identified using the approach proposed by Grathoff and Moore (1996). The proportions of the 2M1 and 1M polytypes are determined by obtaining the ratio of the area (or the height) of each polytype peak to the area of the peak at 2.58 Å, which is common to all illite polytypes. If the sum of 2M1 and 1M is smaller than 100 %, the difference could be attributed either to the presence of the 1Md polytype or to a slight preferential orientation. The obtained percentages of polytypes are cross-checked by comparing the experimental XRD diagram with the XRD patterns modeled by the Wildfire© software. If kaolinite is present in the clay fraction, the randomly oriented powder mount is heated to 550 °C to prevent the kaolinite peak from interfering with the hkl peak at 2.56 Å and is re-scanned.
3.3 Dating interpretation
3.3.1 Methods
Each separated fraction is dated by the K–Ar method using the procedure described in Sect. 2.5. As each fraction contains a mixture of illite polytypes, individual ages have little geological meaning. As mentioned in Hueck et al. (2022), two strategies can be applied to decipher geochronological information from the set of K–Ar ages.
The first is the limit age interpretation, generally applied when polytype quantification is not available. The date obtained on the finest fraction that most likely contains authigenic material represents the maximum age of the illite authigenesis. Conversely, the date obtained on the coarsest fraction, most likely containing inherited material, represents the minimum age of the oldest illitization (detrital illite in the case of sedimentary units).
The second approach is the illite age analysis (IAA) method developed by Pevear (1992), in which end-member ages are determined by extrapolating the set of individual dates. Assuming that the sample contains a mixture of two illite populations, the end-member dates reflect the ages of the oldest and youngest geological events. The proportion of the two populations of illite must be determined so as to evaluate the dates at 0 % and 100 % of one population (100 % and 0 % of the other). The extrapolation of end-member dates is generally performed using an error-weighted linear regression based on the least-squares method applied to the set of individual dates (van der Pluijm et al., 2001). The 90 % confidence intervals are also calculated to define the error on the extrapolated ages. To consider the non-linearity of the age equation, some authors prefer to fit the data expressed as eλt−1 (van der Pluijm et al., 2001; Ylagan et al., 2000; Haines and van der Pluijm, 2023; Song and Sim, 2021), since it is a linear function with the ratio of radiogenic argon to potassium.
3.3.2 Application
To validate the IAA method applied at GeoRessources, two sets of dates published in the literature were used: (1) the set of dates of synthetic mixtures of two pure illite fractions, 2M1 (Wards: 428.0±9.0 Ma) and 1M (RM-30: 24.8±0.6 Ma) prepared by Ylagan et al. (2002) and (2) the set of dates of metapelites from the Rhenish massif from the recent study of Hueck et al. (2022). The ages obtained by fitting either the set of nominal dates or the exponential terms are presented in Fig. 6 along with the literature data (measured and extrapolated ages). R2 is also shown in the figure and in the number of dates available for the fit.
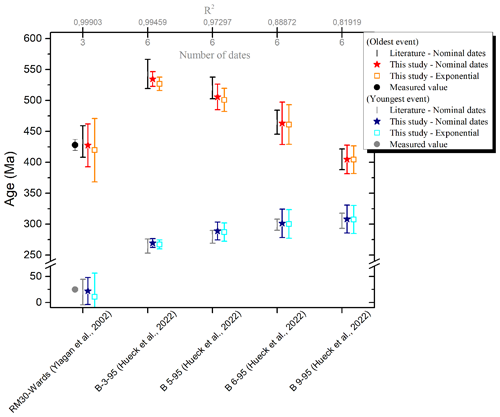
Figure 6Comparison of extrapolated ages obtained by IAA between the literature data and this study. The ages of the RM-30 and Wards samples measured by Ylagan et al. (2002) are also shown.
Considering the uncertainties, one can reasonably state that the extrapolated ages calculated in this work are similar to those from the literature. Most notably, this present work successfully outputs the ages of the two pure illite fractions of Ylagan et al. (2002). Also, fitting the data using the exponential term does not significantly change the ages, as expected according to Ylagan et al. (2000).
In this work, fits are weighted by instrumental error (, with σ being the individual date error). Consequently, the uncertainties will be reduced when fitting precise dates (sample B-3-95). Larger uncertainties than the published ones can be explained either by a limited set of dates; by high individual uncertainties on the dates (see samples B-6-95 and B-9-95; Hueck et al., 2022); or by the difference in the level of the confidence interval, 90 % in this work and that of Ylagan and 68 % for Hueck's study. Thus, to obtain valuable extrapolated ages, we recommend the following considerations:
-
The fit should be weighted by the instrumental error;
-
The level of confidence should be 90 %;
-
The data set should contain at least four dates (i.e., four separated fractions), and, ideally, they will be distributed between 0 % to 100 % of one polytype.
Finally, it is essential to remember that the IAA method assumes that only two different polytypes are present in the illitic mixture. Also, the 2M1 illite must either be inherited or authigenic, and the 1M 1Md illite must be authigenetic (Hueck et al., 2022). For the successful application of the IAA, those assumptions must be validated by complementary chemical, morphological and crystallographic data. More than two populations of illite might be detected either by the complementary analyses or by the difficulty in obtaining a proper linear regression on the set of dates obtained on the separated fractions (if each population relates to distinct geological events considering the precision of K–Ar dating).
Deciphering the origin of illites in a mixture of clays relies on (1) a proper separation of the clay material (at least four granulometric fractions) containing various proportions of illite material (ideally distributed between 0 % to 100 %); (2) a precise characterization of the mineralogy and the morphology by SEM, EDS and XRD of each size fraction; (3) the determination of a precise age of each size fraction by the K–Ar method; and (4) the interpretation of the ages obtained by the IAA method enabling the identification of two geological events. Each of these four critical points was addressed in this paper in order to validate the method and protocols developed with the novel platforms of GeoRessources, which include the clay-separation laboratory for large quantities and the K–Ar method.
This integrated method offers a powerful tool to provide constraints of various physical and chemical processes occurring at the micro- and nanoscale, improving our understanding of the evolution of the Earth system.
Sample masses are measured on a Mettler XSU105DU with a resolution of 0.00001 g in the 0–41 g range, which is calibrated every year by a certified company. The absolute error on the mass is set at 0.02 mg.
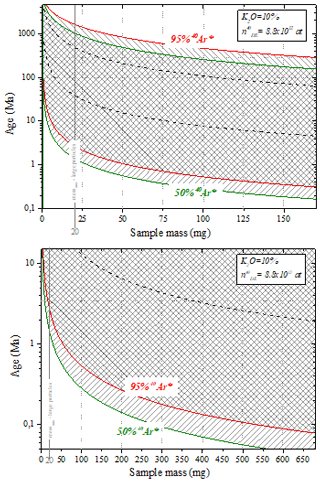
The following plots illustrate the sample mass range accepted in the extraction line depending on age. Simulations are performed considering (1) the range of pressure accepted in the mass spectrometer and (2) the K2O proportion of 10 % (mica). For example, the mass of a large particle-sized sample with an expected age of about 500 Ma should range between 20 and 50 mg. For a sample of an expected age of about 1 Ma, the mass minimum should be 50 mg.
This wide range of masses and ages accepted in the extraction line is possible using three protocols implying additional gas expansion steps (when the argon pressure is high). The dotted black lines separate the areas of application of each protocol.
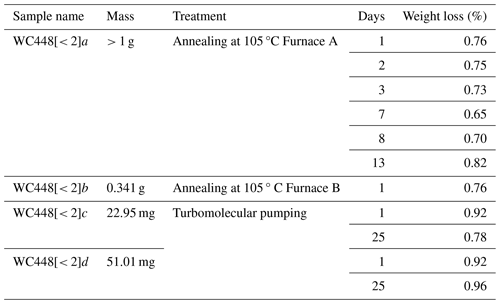
This experiment was carried out on aliquots of < 2 µm clay particles. Aliquots (a to d) were weighed before and after annealing at 105 °C under air or vacuum pumping. Storage under vacuum or in the furnace lasts from 1 to 25 d. The loss of mass of the samples is presented in Table B1. Independently of the mass of the aliquots, the furnace (A or B) and the storage duration, the weight losses after 105 °C annealing and after vacuum pumping are close: around 0.76 % under annealing and 0.92 % under vacuum.
A similar experiment was performed on GL-O (Odin's standard glauconite) (Odin, 1982). The weight loss after a few days of vacuum pumping lies between 2.51 % and 3.14 % (eight samples studied), in agreement with Zimmermann and Odin (1979), who found a weight loss of about 3 % by dehydration of the glauconite. The weight loss measured after vacuum storage of the samples is then due to the pumping of adsorbed gas and dehydration of samples.
Besides uncertainties, the slightly higher weight loss values found on the clay aliquots stored under vacuum could be explained by the dehydration of clay that might be more efficient under vacuum than in a furnace at 105 °C. Also, loss-on-ignition (LOI) experiments performed at atmospheric pressure report the oxidation of Fe2+ that causes a slight weight increase, competing with weight loss by dehydration (Vandenberghe et al., 2010).
The calibration sector consists of a dried-air container connected to an expansion valve. The amount of argon in the expansion valve after the individual dose i taken from the container (ni) is given by
where n0 is the amount of argon in the first dose, v is the volume of the expansion valve (approximated), Vb is the volume of the container and nB is the initial amount of argon in the container (after filling).
Before filling the air container, the amount of argon expected in the expansion valve was calculated so as to obtain a DE signal comparable to that of the samples. According to Eq. (C1), the amount of argon required in the expansion valve determines the amount of air to introduce into the container. Thus, the calibrated container was specifically designed for the ARGUS VI mass spectrometer measurements tuned with specific source parameters.
The desired pressure of air in the container is calculated as follows:
where Ialiquot(40Ar) (fA) is the intensity measured by the mass spectrometer of 40Ar from the air aliquot, S (pA at−1) is the sensitivity of the mass spectrometer, %(Ar) is the proportion of argon in air and %(40Ar) is the proportion of the isotope 40 of argon.
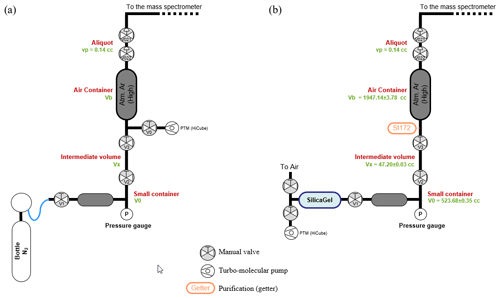
To fill the container with this desired air pressure, a protocol of successive expansions and pumping was established using a set of two volumes, Vo and Vx. Following this protocol, the air pressure in the container is
Note that this pressure is too low to be measured by the manometers available in the laboratory. The two volumes V0 and Vx were designed with the objective of minimizing the number of expansions, thereby minimizing the error on the container pressure. Volumetric measurements yield values of 523.68±0.35 cc for V0 and 47.20±0.03 cc for Vx. The volume of the container was determined by pressure measurement of nitrogen expanded from V0+Vx to Vb (see Fig. C1a for a scheme of the experimental setup). Successive measurements allow a precise determination of Vb of 1947.1±3.8 cc. The scheme of the experimental setup for filling the air container is presented in Fig. C1b. Note that the replacement of the valve V0 by the SAES getter St172 does not significantly change the volume of the container (the volume difference is in the uncertainty).
Granulometric analyses are performed at Chrono-environnement (Besançon, France) on the LS230 Beckman Coulter laser particle size analyzer. An example of the particle size proportion estimated in each separated fraction is shown in Fig. D1. In the tested samples, only large clay particles were present, from 10 µm down to < 0.5 µm (an insignificant amount of clay was present in the < 0.2 µm fraction). The proportion of fine particles increases in the finer fractions to 75 % of particles below 0.5 µm in the so-called < 0.5 µm fraction. However, in the so-called 2–5 µm fraction, 90 % is above 2 µm, with 50 % above 5 µm.
The results of the laser diffraction are based on calculations using the Mie's theory hypothesis (Eremin, 2005), which considers spherical particles, isotropic and homogeneously distributed. Since clay minerals are platy to hairy, the calculation of the particle size is naturally biased. Granulometric analysis based on laser diffraction is then not used for clay size measurements but rather for controlling the separation step.
SEM observations were performed on the whole rock of a fault gouge sample and on separated 5–10, 2–5 and < 2 µm fractions. The separated fractions were observed after dropping the fractions diluted with ethanol on an SEM pad. Two morphologies can be identified on the whole rock: platy and hairy illites. The platy illite is dominant in the 5–10 µm fraction, and the hairy is dominant in the finer fraction. The 2–5 µm fraction seems to contain the two morphologies, including platy illite with a smaller size than in the 5–10 µm fraction.
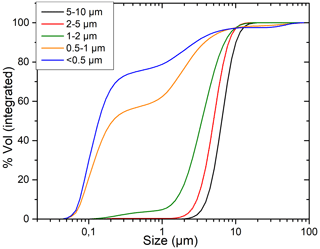
Figure D1Particle size distribution in each separated fraction calculated by Mie's theory on laser diffraction data.
Raw data are available upon request from the contact author, marie.gerardin@univ-lorraine.fr.
MG: project administration, data curation, formal analysis, investigation, methodology, validation, visualization and writing (original draft preparation). GM: investigation, methodology and writing (original draft preparation). JM: funding acquisition, resources and supervision. MC: funding acquisition, conceptualization, resources and supervision. DB: formal analysis, investigation, methodology and writing (original draft preparation).
The contact author has declared that none of the authors has any competing interests.
Publisher's note: Copernicus Publications remains neutral with regard to jurisdictional claims made in the text, published maps, institutional affiliations, or any other geographical representation in this paper. While Copernicus Publications makes every effort to include appropriate place names, the final responsibility lies with the authors.
We want to acknowledge the important work of Pascal Robert (University of Lorraine) in his initial contribution on the development of the argon extraction line. We thank Winfried Schwarz (University of Heidelberg) for the discussions and the HD-B1 and B/Mus2 reference materials. We thank Giulio Viola (University of Bologna) and Roelant Van der Lelij (NGU, Norway) for discussing clay mineral separation, notably using the centrifuge. We thank Marguerite Perrey (Chrono-environnement, Besançon) for the laser diffraction analyses and discussion about the size calculations. We thank Norbert Clauer (University of Strasbourg) for the discussion about the dating of clay minerals by the K–Ar method and for commenting on this work. We also thank Hervé Guillou (LSCE, CEA Saclay) for the donation of his induction furnace and small Ti ceramic furnaces and for all the discussions about K–Ar dating. Finally, a special thanks is addressed to Jean-Claude Lefèvre (GEOPS, Université Paris-Saclay) for the numerous discussions and meetings and for his significant technical help in the development of the argon extraction line.
This research has been supported by the LabEx RESSOURCES21 project of the University of Lorraine and by the Carnot and ERA-MIN “MOSTMEG” funding programs.
This paper was edited by Günter Kargl and reviewed by Jesús Solé and Marek Tulej.
Akker, I. V., Berger, A., Zwingmann, H., Todd, A., Schrank, C. E., Jones, M. W. M., Kewish, C. M., Schmid, T. C., and Herwegh, M.: Structural and chemical resetting processes in white mica and their effect on K-Ar data during low temperature metamorphism, Tectonophysics, 800, 228708, https://doi.org/10.1016/j.tecto.2020.228708, 2021.
Aldrich, L. T. and Nier, A. O.: Argon 40 in Potassium Minerals, Phys. Rev., 74, 876–877, https://doi.org/10.1103/PhysRev.74.876, 1948.
Bailey, S. W.: The Status of Clay Mineral Structures, Clay. Clay Miner., 14, 1–23, https://doi.org/10.1346/CCMN.1966.0140101, 1966.
Boulesteix, T., Solé, J., Pi, T., and Cathelineau, M.: Reappraisal of the GL-O Reference Material for K-Ar Dating: New Insight from Microanalysis, Single-Grain and Milligram Ar Measurements, Geostand. Geoanalytical Res., 44, 287–306, https://doi.org/10.1111/ggr.12306, 2020.
Brockamp, O. and Clauer, N.: Hydrothermal and unexpected diagenetic alteration in Permian shales of the Lodève epigenetic U-deposit of southern France, traced by K–Ar illite and K-feldspar dating, Chem. Geol., 357, 18–28, https://doi.org/10.1016/j.chemgeo.2013.08.009, 2013.
Burnard, P. G. and Farley, K. A.: Calibration of pressure-dependent sensitivity and discrimination in Nier-type noble gas ion sources: TECHNICAL BRIEF, Geochem. Geophy. Geosy., 1, 1022, https://doi.org/10.1029/2000GC000038, 2000.
Carocci, E., Marignac, C., Cathelineau, M., Truche, L., Poujol, M., Boiron, M.-C., and Pinto, F.: Incipient Wolframite Deposition at Panasqueira (Portugal): W Rutile and Tourmaline Compositions as Proxies for the Early Fluid Composition, Econ. Geol., 116, 123–146, https://doi.org/10.5382/econgeo.4783, 2020.
Cassignol, C. and Gillot, P.-Y.: Range and Effectiveness fo Unspiked Potassium-Argon Dating: Experimental Groundwork and Applications, John Wiley NY, 1982.
Cattani, F., Gillot, P.-Y., Quidelleur, X., Hildenbrand, A., Lefèvre, J.-C., Boukari, C., and Courtade, F.: In-situ K-Ar dating on Mars based on UV-Laser ablation coupled with a LIBS-QMS system: Development, calibration and application of the KArMars instrument, Chem. Geol., 506, 1–16, https://doi.org/10.1016/j.chemgeo.2018.12.010, 2019.
Charbit, S., Guillou, H., and Turpin, L.: Cross calibration of K–Ar standard minerals using an unspiked Ar measurement technique, Chem. Geol., 150, 147–159, 1998.
Clauer, N.: The K-Ar and 40Ar 39Ar methods revisited for dating fine-grained K-bearing clay minerals, Chem. Geol., 354, 163–185, https://doi.org/10.1016/j.chemgeo.2013.05.030, 2013.
Clauer, N.: How Can Technical Aspects Help Improving K-Ar Isotopic Data of Illite-Rich Clay Materials into Meaningful Ages? The Case of the Dominique Peter Uranium Deposit (Saskatchewan, Canada), Geosciences, 10, 285, https://doi.org/10.3390/geosciences10080285, 2020a.
Clauer, N.: The post-Variscan tectonic-thermal activity in the southeastern metalliferous province of the French Massif Central revisited with K-Ar ages of illite, Ore Geol. Rev., 117, 103300, https://doi.org/10.1016/j.oregeorev.2019.103300, 2020b.
Clauer, N., Zwingmann, H., Liewig, N., and Wendling, R.: Comparative 40Ar 39Ar and K–Ar dating of illite-type clay minerals: A tentative explanation for age identities and differences, Earth-Sci. Rev., 115, 76–96, https://doi.org/10.1016/j.earscirev.2012.07.003, 2012.
Dalrymple, G. B. and Lanphere, M. A.: Potassium-argon dating: principles, techniques and applications to geochronology, Freeman, San Francisco, 1969.
Eremin, Y. A.: SCATTERING | Scattering Theory, in: Encyclopedia of Modern Optics, edited by: Guenther, R. D., Elsevier, Oxford, 326–330, https://doi.org/10.1016/B0-12-369395-0/00682-5, 2005.
Fuhrmann, U., Lippolt, H. J., and Hess, J. C.: Examination of some proposed K-Ar standards: 40Ar / 39Ar analyses and conventional K-Ar data, Chem. Geol. Isot. Geosci. Sect., 66, 41–51, https://doi.org/10.1016/0168-9622(87)90027-3, 1987.
Garner, E. L., Murphy, T. J., Gramlich, J. W., Paulsen, P. J., and Barnes, I. L.: Absolute isotopic abundance ratios and the atomic weight of a reference sample of potassium, J. Res. Natl. Bur. Stand. Sect. Phys. Chem., 79, 713, https://doi.org/10.6028/jres.079A.028, 1975.
Gillot, P.-Y. and Cornette, Y.: The Cassignol technique for potassium – Argon dating, precision and accuracy: Examples from the Late Pleistocene to Recent volcanics from southern Italy, Chem. Geol. Isot. Geosci. Sect., 59, 205–222, 1986.
Gillot, P.-Y., Hildenbrand, A., Lefevre, J.-C., and Albore-Livadie C.: The K Ar dating method: principle, analytical techniques, and application to Holocene volcanic eruptions in Southern Italy, Acta Vulcanol., 18, 55–66, 2006.
Grathoff, G. H. and Moore, D. M.: Illite Polytype Quantification using WILDFIRE© Calculated X-Ray Diffraction Patterns, Clays Clay Miner., 44, 835–842, https://doi.org/10.1346/CCMN.1996.0440615, 1996.
Grau Malonda, A. and Grau Carles, A.: Half-life determination of 40 K by LSC, Appl. Radiat. Isotopes, 56, 153–156, https://doi.org/10.1016/S0969-8043(01)00181-6, 2002.
Guillou, H., Nomade, S., and Scao, V.: The 40K 40Ar and 40Ar 39Ar Methods, in: Paleoclimatology, edited by: Ramstein, G., Landais, A., Bouttes, N., Sepulchre, P., and Govin, A., Springer International Publishing, Cham, 73–87, https://doi.org/10.1007/978-3-030-24982-3_5, 2021.
Haines, S. H. and van der Pluijm, B. A.: Fault Gouge Dating in the Spanish Pyrenees: Fault Ages, Thrust Propagation Sequence, Wall-Rock Provenance, and Thermal Constraints, Tectonics, 42, e2022TC007251, https://doi.org/10.1029/2022TC007251, 2023.
Holst, B., Buckland, J. R., and Allison, W.: Spatial mapping in the electron-impact ion-source of a residual gas analyser, Vacuum, 53, 207–210, https://doi.org/10.1016/S0042-207X(98)00388-1, 1999.
Holtzapffel, T.: Minéraux argileux lattes: les smectites du domaine atlantique, Université d'Angers, 1986.
Hueck, M., Wemmer, K., Ksienzyk, A. K., Kuehn, R., and Vogel, N.: Potential, premises, and pitfalls of interpreting illite argon dates – A case study from the German Variscides, Earth-Sci. Rev., 232, 104133, https://doi.org/10.1016/j.earscirev.2022.104133, 2022.
Kralik, M., Klima, K., and Riedmüller, G.: Dating fault gouges, Nature, 327, 315–317, https://doi.org/10.1038/327315a0, 1987.
Kübler, B.: La cristallinite de l Illite et les zones tout a fait superieures du metamorphisme., Étages Tecton. Colloq. Neuchâtel 1966 Baconniere Neuchâtel, 105–121, 1966.
Lee, J.-Y., Marti, K., Severinghaus, J. P., Kawamura, K., Yoo, H.-S., Lee, J. B., and Kim, J. S.: A redetermination of the isotopic abundances of atmospheric Ar, Geochim. Cosmochim. Ac., 70, 4507–4512, https://doi.org/10.1016/j.gca.2006.06.1563, 2006.
Loveless, A. J. and Russell, R. D.: A strong-focussing lens for mass spectrometer ion sources, Int. J. Mass Spectrom. Ion Phys., 3, 257–266, https://doi.org/10.1016/0020-7381(69)85009-6, 1969.
Mark, D. F., Barfod, D., Stuart, F. M., and Imlach, J.: The ARGUS multicollector noble gas mass spectrometer: Performance for 40Ar 39Ar geochronology, Geochem. Geophys. Geosy., 10, Q0AA02, https://doi.org/10.1029/2009GC002643, 2009.
McDougall, I. and Harrison, T. M.: Geochronology and Thermochronology by the 40Ar 39Ar Method, Oxford University Press, 1988.
McDougall, I. and Harrison, T. M.: Geochronology and Thermochronology by the 40Ar 39Ar Method, Second Edition., Oxford University Press, Oxford, New York, 282 pp., 1999.
Meunier, A., Velde, B., and Zalba, P.: Illite K-Ar dating and crystal growth processes in diagenetic environments: a critical review, Terra Nova, 16, 296–304, https://doi.org/10.1111/j.1365-3121.2004.00563.x, 2004.
Monié, P., Münch, P., Milesi, G., Bonno, M., and Iemmolo, A.: 40Ar 39Ar geochronology of crustal deformation, CR Géosci., 356, 1–29, https://doi.org/10.5802/crgeos.209, 2023.
Moore, D. M. and Reynolds, R. C.: X-Ray Diffraction and the Identification and Analysis of Clay Minerals, Oxf. Univ. Press, https://doi.org/10.1017/S0016756898501501, 1997.
Morgan, L. E., Postma, O., Kuiper, K. F., Mark, D. F., van der Plas, W., Davidson, S., Perkin, M., Villa, I. M., and Wijbrans, J. R.: A metrological approach to measuring 40Ar* concentrations in K-Ar and 40Ar 39Ar mineral standards, Geochem. Geophys. Geosy., 12, A0AA20, https://doi.org/10.1029/2011GC003719, 2011.
Nier, A.: A Mass Spectrometer for Routine Isotope Abundance Measurements, Rev. Sci. Instrum., 11, 212–216, https://doi.org/10.1063/1.1751688, 1940.
Nier, A.: A Redetermination of the Relative Abundances of the Isotopes of Carbon, Nitrogen, Oxygen, Argon, and Potassium, Phys. Rev., 77, 789–793, https://doi.org/10.1103/PhysRev.77.789, 1950.
Nomade, S.: Recommandation sur l'utilisation des unités de temps en sciences de la terre, Quaternaire, 28, 137–139, https://doi.org/10.4000/quaternaire.7972, 2017.
Odin, G. S.: Interlaboratory Standards for Dating Purposes, in: Numerical dating in stratigraphy, 123–148, 1982.
Peltz, M., Jacob, A., Grathoff, G. H., Enzmann, F., Kersten, M., and Warr, L. N.: A FIB-SEM Study of Illite Morphology in Aeolian Rotliegend Sandstones: Implications for Understanding the Petrophysical Properties of Reservoir Rocks, Clay. Clay Miner., 70, 84–105, https://doi.org/10.1007/s42860-022-00174-9, 2022.
Perry, E. A.: Diagenesis and the K-Ar Dating of Shales and Clay Minerals, Geol. Soc. Am. Bull., 85, 827, https://doi.org/10.1130/0016-7606(1974)85<827:DATKDO>2.0.CO;2, 1974.
Pevear, D. R.: Illite age analysis, a new tool for basin thermal history analysis, International symposium on water-rock interaction, 1251–1254, 1992.
Phillips, D., Matchan, E. L., Honda, M., and Kuiper, K. F.: Astronomical calibration of 40Ar 39Ar reference minerals using high-precision, multi-collector (ARGUSVI) mass spectrometry, Geochim. Cosmochim. Ac., 196, 351–369, https://doi.org/10.1016/j.gca.2016.09.027, 2017.
Poppe, L. J., Paskevich, V. F., Hathaway, J. C., and Blackwood, D. S.: A Laboratory Manual for X-Ray Powder Diffraction. Procedures – Separation of the silt and clay fractions by centrifugation, USGS, https://pubs.usgs.gov/of/2001/of01-041/htmldocs/methods/centrifu.htm (last access: 8 October 2024), 2001.
Renne, P. R.: K-Ar and 40Ar 39Ar Dating, in: Quaternary Geochronology, American Geophysical Union (AGU), 77–100, https://doi.org/10.1029/RF004p0077, 2000.
Renne, P. R., Cassata, W. S., and Morgan, L. E.: The isotopic composition of atmospheric argon and 40Ar 39Ar geochronology: Time for a change?, Quat. Geochronol., 4, 288–298, https://doi.org/10.1016/j.quageo.2009.02.015, 2009.
Reuter, A. and Dallmeyer, R. D.: K-Ar and 40 Ar/ 39 Ar dating of cleavage formed during very low-grade metamorphism: a review, Geol. Soc. Lond. Spec. Publ., 43, 161–171, https://doi.org/10.1144/GSL.SP.1989.043.01.10, 1989.
Reynolds, R. C. and Thomson, C. H.: Illite from the Potsdam Sandstone of New York: A Probable Noncentrosymmetric Mica Structure, Clay. Clay Mineral., 41, 66–72, https://doi.org/10.1346/CCMN.1993.0410107, 1993.
Rittmann, K. L.: Argon in Hornblende, Biotit und Muskovit bei der geologischen Abkühlung – 40Ar 39Ar – Untersuchungen, Université de Heidelberg, https://lgrbwissen.lgrb-bw.de/argon-hornblende-biotit-muskovit-bei-geologischen-abkuehlung-40ar39ar-untersuchungen (last access: 8 October 2024), 1984.
Rouchon, V., Lefèvre, J.-C., Quidelleur, X., Guérin, G., and Gillot, P.-Y.: Nonspiked 40Ar and 36Ar quantification using a quadrupole mass spectrometer: A potential for K–Ar geochronology, Int. J. Mass Spectrom., 270, 52–61, https://doi.org/10.1016/j.ijms.2007.11.009, 2008.
Rüedenauer, F. G.: Gas Scattering as a Limit to Partial-Pressure Sensitivity, J. Vac. Sci. Technol., 9, 215–215, https://doi.org/10.1116/1.1316557, 1972.
Schaeffer, O. A. and Zähringer, J.: Potassium argon dating, Springer-Verlag, 278 pp., 1966.
Schwarz, W. H. and Trieloff, M.: Intercalibration of 40Ar–39Ar age standards NL-25, HB3gr hornblende, GA1550, SB-3, HD-B1 biotite and BMus/2 muscovite, Chem. Geol., 242, 218–231, https://doi.org/10.1016/j.chemgeo.2007.03.016, 2007.
Snee, L. W., Sutter, J. F., and Kelly, W. C.: Thermochronology of economic mineral deposits; dating the stages of mineralization at Panasqueira, Portugal, by high-precision 40 39 Ar age spectrum techniques on muscovite, Econ. Geol., 83, 335–354, https://doi.org/10.2113/gsecongeo.83.2.335, 1988.
Song, Y. and Sim, H.: Illite-Age-Analysis (IAA) for the Dating of Shallow Faults: Prerequisites and Procedures for Improvement, Minerals, 11, 1162, https://doi.org/10.3390/min11111162, 2021.
Środoń, J. and Eberl, D. D.: Illite, in: 12. ILLITE, vol. 13, Micas. Rev. Mineral, 495–544, https://doi.org/10.1515/9781501508820-016, 1984.
Steiger, R. and Jäger, E.: Subcommission on geochronology: convention on the use of decay constants in geo-and cosmochronology, Earth Planet. Sc. Lett., 36, 359–362, 1977.
Turrin, B. D., Swisher, C. C., and Deino, A. L.: Mass discrimination monitoring and intercalibration of dual collectors in noble gas mass spectrometer systems, Geochem. Geophy. Geosy., 11, Q0AA09, https://doi.org/10.1029/2009GC003013, 2010.
Vandenberghe, R. E., de Resende, V. G., da Costa, G. M., and De Grave, E.: Study of loss-on-ignition anomalies found in ashes from combustion of iron-rich coal, Fuel, 89, 2405–2410, https://doi.org/10.1016/j.fuel.2010.01.022, 2010.
van der Pluijm, B. A., Hall, C. M., Vrolijk, P. J., Pevear, D. R., and Covey, M. C.: The dating of shallow faults in the Earth's crust, Nature, 412, 172–175, https://doi.org/10.1038/35084053, 2001.
Velde, B. and Meunier, A.: The Origin of Clay Minerals in Soils and Weathered Rocks, Springer Berlin Heidelberg, Berlin, Heidelberg, https://doi.org/10.1007/978-3-540-75634-7, 2008.
Viola, G., Torgersen, E., Mazzarini, F., Musumeci, G., Lelij, R., Schönenberger, J., and Garofalo, P. S.: New Constraints on the Evolution of the Inner Northern Apennines by K-Ar Dating of Late Miocene-Early Pliocene Compression on the Island of Elba, Italy, Tectonics, 37, 3229–3243, https://doi.org/10.1029/2018TC005182, 2018.
Werner, H. W.: A study on mass discrimination in a magnetic sector mass spectrometer, Int. J. Mass Spectrom., 14, 189–203, https://doi.org/10.1016/0020-7381(74)80007-0, 1974.
Ylagan, R. F., Pevear, D. R., and Vrolijk, P. J.: Discussion of “Extracting K-Ar ages from shales: a theoretical test”, Clay Miner., 35, 599–604, https://doi.org/10.1180/000985500546918, 2000.
Ylagan, R. F., Kim, C. S., Pevear, D. R., and Vrolijk, P. J.: Illite polytype quantification for accurate K-Ar age determination, Am. Mineral., 87, 1536–1545, https://doi.org/10.2138/am-2002-11-1203, 2002.
Zimmermann, J.-L. and Odin, G. S.: Cinétique de la libération de l'argon de l'eau et des composés carbonés dans le matériel de référence glauconite GL-O, Bull. Minéralogie, 102, 48–55, https://doi.org/10.3406/bulmi.1979.7250, 1979.
Zwingmann, H., Clauer, N., and Gaupp, R.: Timing of fluid flow in a sandstone reservoir of the north German Rotliegend (Permian) by K-Ar dating of related hydrothermal illite, Geol. Soc. Lond. Spec. Publ., 144, 91–106, 1998.
- Abstract
- Introduction
- Description of the argon extraction line and methodology
- Characterizing and dating illite
- Conclusions
- Appendix A: Mass ranges accepted in the extraction line depending on expected ages
- Appendix B: Comparison of clay weight loss during annealing and vacuum pumping
- Appendix C: Filling the calibrated air container
- Appendix D: Laser diffraction analyses and SEM observations of the separated fractions
- Data availability
- Author contributions
- Competing interests
- Disclaimer
- Acknowledgements
- Financial support
- Review statement
- References


