the Creative Commons Attribution 4.0 License.
the Creative Commons Attribution 4.0 License.
Distance of flight of cosmic-ray muons to study dynamics of the upper muosphere
Hiroyuki K. M. Tanaka
The Earth can be divided by main layers, including the atmosphere, geosphere (solid Earth), and biosphere, depending on its predominant component. In this work, the layer of the Earth which constantly contains a high concentration of muons ( muons) and its upper border are respectively defined as the muosphere and muopause. The altitude of the muosphere spans from the lower stratosphere to the upper crust of the Earth. In order to study its dynamics, the muopause height was spatiotemporally studied with a new kind of technique called the distance of flight (DOF), which utilizes variations in the muon's decay length. In this work, (A) numerical modeling was performed, and it was clarified that seasonal variations in the cosmic muon flux are predominantly ruled by muopause dynamics; (B) the muon data were compared with the balloon-based measurement results, and it was confirmed that muopause dynamics are closely related to lower-stratospheric height variations. Since the muopause is the region spanning the area between the upper troposphere and the lower stratosphere, the potential of the current distant of flight (DOF) approach needs to be further investigated by cross-comparing related case studies and other atmospheric climate datasets.
- Article
(2724 KB) - Full-text XML
- BibTeX
- EndNote
Muons are secondary particles generated in the Earth's atmosphere as a result of hadronic interactions between the incident primary cosmic rays (primaries) and atmospheric nuclei such as nitrogen and oxygen. These primaries rarely interact with matter within the top region of the Earth's atmosphere due to the low number density of atmospheric nuclei. However, as primaries' injection depth increases, the density of the atmosphere increases, and these primaries increasingly interact with nuclei, producing mesons such as charged pions and kaons which eventually decay into muons. Once these mesons decay into muons, there will generally be no further interaction to generate new particles; muons do not strongly interact with matter since muons undergo only electromagnetic and weak interactions but not strong nuclear interactions. Therefore, muons are extensively produced within particular altitude regions of the atmosphere. The muon production rate increases as a function of the atmospheric depth such that <0.01 %, ∼0.2 %, ∼2 %, ∼30 %, and ∼80 % of all the muons observed at sea level are generated up to an atmospheric depth of 5, 10, 50, 100, and 200 hPa, respectively, and almost all muons are generated up to an atmospheric depth of 300 hPa (Particle Data Group, 2022; Boezio et al., 1999, 2000). On the other hand, due to their strong penetration power, the muons also exist in the geosphere with a rock and water depth up to ∼5 and ∼10 km. Consequently, muons are predominant in the region defined by altitude coordinates as ranging from 30 and −10 km, which also partly overlaps with regions of the humanosphere. This region (from +30 to −10 km from sea level) is defined here as the muosphere. Accordingly, the muopause is defined as the upper boundary of the muosphere (as with the tropopause defining the upper boundary of the troposphere), which is located at 30 km a.s.l. The key characteristics of the muons within the muosphere are (A) an abundance of muons1 with muons km−3 constantly present in the muosphere, (B) muons generated in the muosphere every second, and (C) muons arriving at sea level every second. The exception to this would be neutrino-induced muons which exist throughout the geosphere (Particle Data Group, 2022), but the number of these neutrino-induced particles within the geosphere is too small ( muons km−3) to categorize them as being part of the muosphere.
The thickness of the muosphere spatiotemporally fluctuates due to processes near the surface of the Earth, mainly crustal deformation and land temperature variations. Crustal deformation alters the density of the shallow crust and local topography. When this occurs, the underground depth threshold for muons to reach will be altered; hence the position of the bottom part of the muosphere is regionally altered, but the timescale of this change is very long (over millennia). On the other hand, the near-surface temperature variations will alter the isobaric surface height near the muopause on much shorter timescales.
Since muopause height variations are closely related to the upper-tropospheric and lower-stratospheric isobaric surface height variations, studying muopause dynamics has the potential to contribute to research in this field. For example, it was reported that the 2020 and 2021 ozone holes were both associated with large decreases in polar lower-stratospheric heights (Yook et al., 2022). Sudden stratospheric warming (SSW) is characterized by large isobaric surface height rises at the pole (Kretschmer et al., 2018). The 2022 Hunga Tonga–Hunga Ha'apai volcano eruption resulted in a substantial injection of water vapor into the upper atmosphere (Millán et al., 2022; Vömel et al., 2022). Such changes in the atmospheric composition should have had a noticeable impact on the muopause.
Established muographic imagery techniques have been applied to natural phenomena such as volcanoes (Tanaka et al., 2014), cultural heritage (Morishima et al., 2017), tropic cyclones (Tanaka et al., 2022a), meteotsunami (Tanaka et al., 2022b), and contraband detection (Gnanvo et al., 2011). These techniques take advantage of known properties of muon transmission and scattering through matter. In this work, the distance of flight (DOF) technique is added, and it will be shown that the muopause height variations can be measured with this technique based on the quantitative analysis of time-sequential muon data. Since muons are leptons with a lifetime at rest of 2.2 µs, the actual lifetime as observed from the detector, and therefore the path traveled, is much longer by the relativistic time dilation factor, and the latter depends on energy. Consequently, the sea level muon flux will decrease or increase as the muopause is uplifted or lowered. This is the basic principle of the DOF approach. In this work, the aim is to show that balloon-based lower-stratospheric height variations are well reproduced by applying the DOF approach to time-sequential muon observation data.
There are a number of reports exploring barometric and temperature effects in the muon flux (Tanaka et al., 2022a; Tilav et al., 2010; COSINE-100 Collaboration, 2020; Myssowsky and Tuwim, 1926; Blackett, 1938; The IceCube Collaboration, 2019; Tramontini et al., 2019; Dmitrieva et al., 2011). However, many of these works focus on either the tropospheric barometric effect or stratospheric temperature effect. In this work, the DOF approach was modeled and applied to 1044 d of time-sequential muon data to compare with the Japan Meteorological Agency's balloon data.
As a result, the following two major characteristics were identified: (A) seasonal variations in the muon flux due to the isobaric surface height effect are much larger than seasonal variations due to the barometric effect, and therefore (B) the isobaric surface height derived by the DOF technique is consistent with the balloon-based upper-atmosphere isobaric surface height measurement results. In this paper, a detailed description of the process to arrive at these results is provided. A brief discussion of its current limitations and potential improvements is also presented.
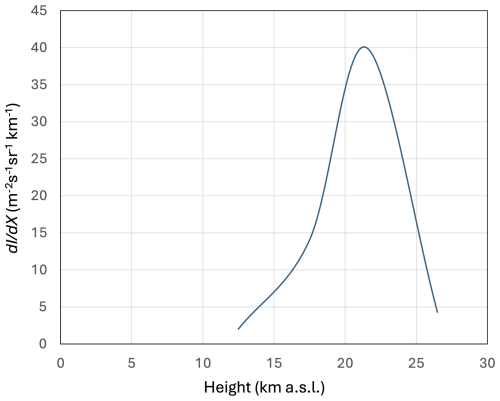
If the abundant muon flux is defined as ≥10 muons m−2 s−1 sr−1, the abundant muon flux is available within the altitude region between 24.5 km a.s.l. (above sea level) and 20 m below the ground surface or 40 m b.s.l. (below sea level). This space is hereafter defined as the “middle muosphere”. The region where muons exist above the middle muosphere is called the upper muosphere, and the region where muons exist below the middle muosphere is called the lower muosphere. The muon fluxes available in the middle muosphere and the lower muosphere on the Earth are summarized in Table 1. Vertical classification of the muosphere is shown in Fig. 1 as a function of the available muon flux. The muopause is defined as the altitude region with the highest muon generation rate per unit atmospheric depth (, where I is the muon flux, and X is the atmospheric depth). The maximum is ∼21.5 km a.s.l., where a muon flux increases by ∼40 m2 s−1 sr−1 every 1 km of atmospheric depth (Fig. 2). This peak is defined as the specific muopause. If the width of the muopause is defined as the region where m−2 s−1 sr−1 km−1 (half maximum), the muopause spans from 18 to 24.5 km a.s.l. This muopause is defined as the full-width half-maximum (FWHM) muopause. The middle muosphere contains both atmospheric and geospheric layers.
Table 1Available muon flux in the middle muosphere and the lower muosphere on the Earth. The data were taken from the Particle Data Group (2022).
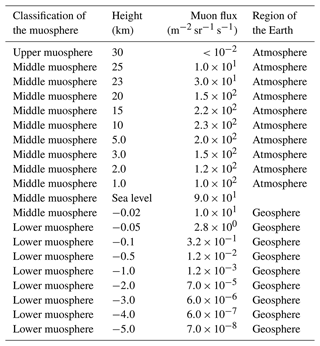
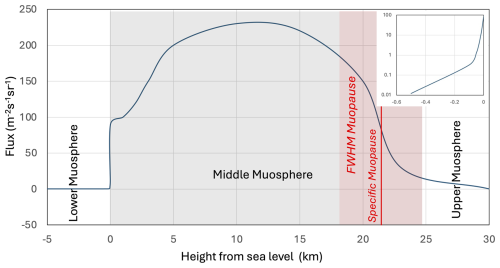
Figure 1Configuration of the muosphere. The gray and red shaded areas respectively indicate the middle muosphere and the FWHM muopause. The vertical red line indicates the location of the specific muosphere. The inset indicates a magnified view in the vicinity of the interface between the middle muosphere and the lower muosphere.
The proposed DOF technique is similar to ground-based atmospheric lidar in terms of scanning the upper atmosphere. Muons are generated almost extensively at the muopause that spans from the upper troposphere to the lower stratosphere. If the tropopause shifts upward, this density gradient shifts upward accordingly; accordingly, the muopause shifts upward, and then the muon's travel distance increases. The current technique measures the height of where muons are extensively generated; hence the height of the tropopause is determined by measuring the muon's DOF. For this aspect, the DOF technique measures the dynamic (PV) tropopause height variations indirectly. (UV lidar measures the O3 tropopause, and visible light lidar measures the cirrus cloud.) Due to the muon's strong penetrating capability, the DOF technique is not influenced by cloud existence.
Atmospheric cascades of secondary pions and kaons are developed as a result of the competition between hadronic collisions of mesons with nuclei and the decay process of the mesons in the atmosphere. Therefore, muons are not generated at a specific altitude, but instead they are generated within a certain altitude range (Boezio et al., 1999, 2000).
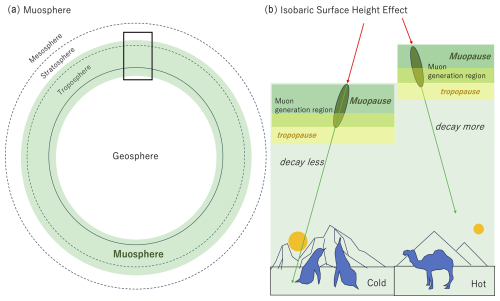
Figure 3Definition of the muosphere and the principle of the DOF technique. The span of the muosphere is shown along with other layers of the Earth (a). The black box indicates the muosphere for the region shown in (b). Red arrows and green arrows respectively indicate the primary cosmic rays and muons. Additionally, (b) shows an example of the contrast between the average height of the muopause above a colder surface temperature and the height of the muopause above a warmer surface temperature. Dark green ovals indicate the muon production regions. As indicated with yellow-filled boxes, the tropopause and the muopause do not exactly overlap with each other.
Figure 3 shows the layer span of the muosphere on the Earth and the principle of the DOF technique. As shown in Fig. 3a, the muosphere covers the region of the lower stratosphere and troposphere as well as the shallow region of the geosphere (shallow crust and ocean). Topography of the muopause is determined by the isobaric surface height distribution of the upper atmosphere and is generally related to the height of tropopause. However, the tropopause region does not usually overlap with the muopause region. The isobaric surface height is high when the surface temperature is high and low when the surface temperature is low since the larger vertical temperature gradient causes deeper convection in the troposphere, pushing the isobaric surface upwards; hence seasonally varied. More detailed descriptions can be found later in the “Balloon-based studies near the muopause” section. As shown in Fig. 3b, variations in the height of the muopause will affect the muon generation point and hence the muon's DOF. The number of muons decreases when the muopause is uplifted. If the isobaric surface height effect is comparable to or stronger than the barometric effect on the muon flux, the spatiotemporal variations in the muopause can be measured by using local barometric data. Detailed descriptions of two essential aspects of the DOF technique, (1) modeling of the seasonal barometric effect on the muon flux and (2) modeling of the seasonal isobaric surface height effect on the muon flux, are given in the following subsections.
There are three effects that influence the muon flux: (A) variations in the muon's range due to barometric variations, (B) variations in the muopause height due to variations in mass exchange between the upper troposphere and the lower stratosphere and hence variations in the muon's distance of flight between the muopause and sea level, and (C) variations in hadronic interaction mean free paths due to stratospheric temperature variations. There are three effects in total. Effect (C) comes from the competition between the pion and kaon hadronic interaction mean free path (MFP) and decay length. If the stratospheric temperature increases, the air thermally expands, and thus the hadronic interaction MFP increases. However, this effect is much smaller than the other two effects since this factor is only relevant for muon flux in the energy region above 50 GeV (The IceCube Collaboration, 2019) where the integrated muon intensity is lower by more than 2 orders of magnitude. Effect (A) includes variations in the muon's stopping power due to variations in their energy loss rate in the atmosphere and variations in the muon's decay length due to variations in their deceleration rate in the atmosphere. While there have been several works investigating the Earth's atmosphere using muons, using effect (A) (Tanaka et al., 2022b; Tramontini et al., 2019), these previous works focused on gauging areal density variations (convertible to temperature and pressure) of the atmosphere, which is conceptually close to muographic imagery. On the other hand, the DOF technique inversely using effect (B) has never been attempted.
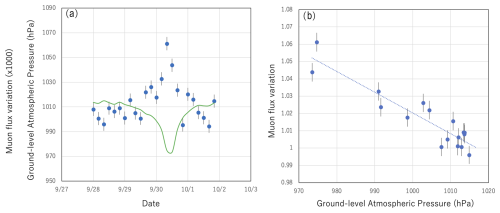
Figure 4Variations in the muon flux induced by ground-level atmospheric pressure variations. The muon flux variations (filled blue circles) are compared with the ground-level atmospheric pressure variations (solid green lines) induced by the 2018 typhoon no. 24 (a). The muon flux variations (filled blue circles) are shown as a function of the ground-level atmospheric pressure. The numbers on the vertical axis indicate the muon flux variation times 1000. The dotted line indicates the linear function fitted to these data points (b).
4.1 Modeling of the seasonal barometric effect on muon flux
The cosmic muon flux is also influenced by ground-level barometric variations because the amount of muon energy loss depends on the total areal density along their trajectories. In this work, I took advantage of muon flux variations associated with the presence of a cyclone to derive variations in the muon counts in the detector as a function of the ground-level pressure in the city of Kagoshima. The advantage of using the cyclone data is that since the cyclone moves quickly (typically within 24 h) and will dramatically alter the ground-level atmospheric pressure (sometimes by more than 40 hPa), barometric muon flux variations can be evaluated without being influenced by the longer-timescale isobaric surface height effect. According to Tanaka et al. (2022a), the barometric correction of the muon flux can be reasonably performed by using the tropic cyclone passage events. Their reported flux drop rate is 0.0016 hPa−1 (theory) and 0.001–0.002 hPa−1 (observation). This flux drop rate includes (A) the flux drop due to the higher rate of muon absorption into the atmosphere (stop and decay) and the flux drop due to an increase in the in-flight decay of muons (since they lose their energy more). Figure 4a compares the temporal variations in the muon flux and the temporal variations in the ground-level atmospheric pressure induced by the 2018 typhoon no. 24. Figure 4b shows the relationship between the muon flux and the atmospheric pressure (both measured in Kagoshima). The metrological data in Fig. 4a were taken from the Japan Metrological Agency (2023). The data points in Fig. 4b were fitted by a linear function, and the result is shown in the following equation:
This result indicates that the muon flux varies by 1.2 % if the ground-level atmospheric pressure changes by ΔP=10 hPa (with respect to 1000 hPa). Since the detector used for measuring this cyclone effect on the muon flux is identical to that used for the DOF measurements, the external factors, including the zenith angular dependence of the muon flux and geometrical acceptance of the detector, are canceled out. The fractions of the number of data points are respectively 60 %, 82 %, and 100 % for deviations of ≤1σ, ≤1.5σ, and ≤2σ from the estimated line. The SD of the data points from the estimated line () is close to the statistical error associated with the data points (–). The R2 value (coefficient of determination) for this fitting was 0.85. The current result (0.00055–0.00185 hPa−1) is in agreement with the flux drop rate reported in the prior work (0.001–0.002 hPa−1) within the error bars. The difference between them (0.0037) can be the fitting uncertainty, which adds an uncertainty of ∼18 m in estimation of the muopause height (see below). Equation (1) was used for the barometric correction to the muon flux in the current work.
With Eq. (1), seasonal variations of the muon flux caused by variations in the ground-level atmospheric pressure (P-driven muon flux variations) were evaluated. Figure 5a shows seasonal variations in the ground-level atmospheric pressure measured at the Kagoshima Meteorological Observatory in the period between August 2017 and August 2020. Figure 5b shows the corresponding P-driven muon flux variations based on Eq. (1).
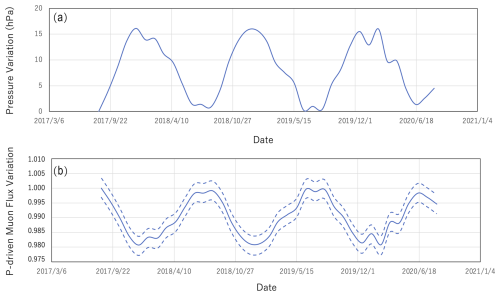
Figure 5Seasonal variations in the ground-level atmospheric pressure (a) and estimated variations of muon flux due to variations in the ground-level atmospheric pressure (b) based on Eq. (1). The data are shown in the period between August 2017 and August 2020. The ground-level atmospheric pressure data were taken from the Japan Metrological Agency (2023). The area between the dashed lines in panel (b) indicates the barometric modeling error (1 SD). The error values associated with the barometric data are not published by the Japan Metrological Agency.
4.2 Balloon-based studies of the isobaric surface height near the muopause
The Japan Meteorological Agency launches a balloon from Kagoshima twice a day (09:00 and 21:00 JST) to monitor the isobaric surface height of the upper atmosphere. The monthly isobaric surface height measurement results acquired in 2018 and 2019 are shown in Fig. 6. As shown in this figure, the altitude of the muopause varies (ΔH∼500 m), reflecting seasonal variations (i.e., altitude that increases in the summertime) of the muopause. While the muon generation depth has a certain span (50–300 hPa), as can also be seen in this figure, the isobaric surface height closely corresponds to the variations in this span. Therefore, I can conclude that the isobaric structure of the upper muosphere is simply pushed further from sea level in summer and pushed closer to sea level in winter (dark green ovals in Fig. 3b). Consequently, it is expected that variations in the muon survival rate at sea level are a function of the muopause height.
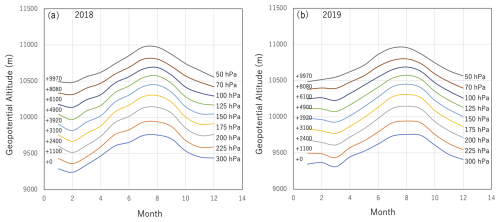
Figure 6Seasonal changes in the isobaric surface height of the upper troposphere and the lower stratosphere. The data acquired in 2018 (a) and the data acquired in 2019 (b) are shown. The data were taken from the Japan Metrological Agency survey (Japan Metrological Agency, 2023). The numbers on the left side of each panel indicate the offset of the altitude in units of meters.
4.3 Modeling of the seasonal isobaric surface height effect on the muon flux
As described in the previous subsection, the isobaric surface height variation ΔH(H) is independent from H in this span. The modeling procedure is summarized as follows.
- A.
The zenith-angular-dependent open-sky muon spectrum data points are taken from various prior experimental works (Allkofer et al., 1985; L3 Collaboration, 2004).
- B.
These muon spectrum data points are interpolated to derive I0(E,θ) by using the Thompson and Whalley analytical formula (Thompson and Whalley, 1977).
- C.
Calculations of the angular-dependent muon flux are done based on the following formula:
where E and θ are respectively the muon's energy, τ is the muon's decay constant, the arrival angle from zenith at sea level, I0(E,θ) is the reference muon flux, and γ is the Lorentz factor. In Eq. (2b), the reduction of E is calculated by assuming a fixed atmospheric pressure (1013 hPa), and the effect of temporal barometric variations on was neglected since the decay effect coming from the muon's energy loss variations due to temporal barometric variations is already incorporated into ΔN. Moreover, this decay effect in seasonal variations is small. For example, there is 15 hPa of barometric variation between winter and summer (Fig. 3), and these variations induce variations in energy loss of 30 MeV (in vertical), which extend and contract the muon's decay length by 190 m (in vertical); this is smaller than the muopause height variations by a factor of 3 (Fig. 6). Radiative processes (i.e., bremsstrahlung, direct pair production, and photonuclear interactions) in were neglected due to relatively long radiation length in air. Figure 7 plots Eq. (2a) for ΔH=0 m (Fig. 7a) and m (Fig. 7b). The data points are overlaid on this plot. Although it is difficult to estimate ΔH when these data were gathered, it is assumed that ΔH=0. It is important to note that in the current work, the quantity to be evaluated is the variation in H, not H itself. The positive and negative signs attributed to ΔH respectively indicate upward variations and downward variations. If θ approaches the value of 90°, (cos θ)−1 will diverge, so in this case, the spherical curvature of the Earth has to be considered (for θ∼90°).
- D.
Calculate the number of muons recorded by the detector with
where θ0, θ1, φ0, and φ1 are respectively the detector's zenith (θ0–θ1) and azimuth (φ0–φ1) angular acceptance. Equation (3) was used for the isobaric correction to the muon flux in the current work.
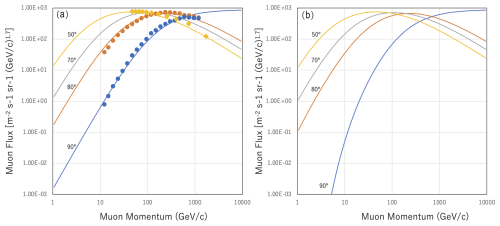
Figure 7Differential muon flux for different isobaric surface altitudes. The spectra calculated for the reference isobaric surface altitude (ΔH=0 m) are shown in (a) and for the case when the isobaric surface is uplifted by 500 m in (b) for various muon arriving angles: 90° (blue), 80° (orange), 70° (gray), and 50° (yellow). Only slanted muons are shown due to the geometrical configuration of the current detector setup (see below). Filled circles and filled rhombuses are respectively the data points taken from Allkofer et al. (1985) and L3 Collaboration (2004).
With Eq. (2a), seasonal variations of the muon flux due to the isobaric surface height effect (H-driven muon flux variations) were calculated. Figure 8a shows the balloon-based ΔH value averaged over the altitudes which ranged between 50 and 300 hPa. Figure 8b shows the corresponding H-driven muon flux variations based on Eq. (2a). In order to match the angular acceptance of the tracker (described in the next section), the zenith angular integration range of Eq. (2a) was set to be 50–90°. It was assumed that the muon's arriving angles are azimuthally isotropic. These results are subsequently used for the muon flux modeling process, which will be described in the following subsection. As can be compared between Figs. 5 and 8, the seasonal isobaric surface height effect (up to 8 %) is much larger (by a factor of 4) than the seasonal barometric effect (up to 2 %).
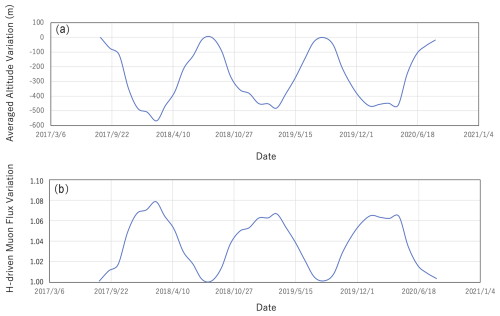
Figure 8Balloon-based isobaric height variations averaged over the altitudes between 50 and 300 hPa (a) and H-driven variations of the muon flux without the barometric correction (b). The data are shown for the period between August 2017 and August 2020. The balloon-based isobaric height data were taken from Japan Metrological Agency (2023). The error values associated with the balloon data are not published by the Japan Metrological Agency.
The muon tracker used in this study consisted of 90 scintillator strip detectors. Each scintillator strip detector consisted of a plastic scintillator (Eljen EJ-200) strip connected to a photomultiplier tube (PMT; Hamamatsu R7724) via an acrylic light guide. The typical pulse height outputted from the PMTs was 3–5 V, while the threshold level of the discriminator was set to be 50 mV so that the counting rate would not be easily influenced by the drift of the PMT gain and the discriminator's threshold level caused by variations in ambient temperature. The width and length of the plastic scintillator strip were respectively 100 and 1500 mm. These strips were arranged vertically and horizontally to form three position-sensitive detectors (PSDs). Three PSDs were vertically arranged with a spacing of 60 cm. In order to reject electromagnetic components, such as positrons and electrons, a 10 cm thick lead slab concealed inside a 1.5 cm thick stainless-steel case (totaling 3 cm in thickness) was inserted into each interval between the PSDs. A stainless-steel case is needed to protect the lead for the following reasons: (A) lead is soft, and for long-time measurements, it can be deformed, so it has to be supported by the stainless-steel case, and (B) lead is poisonous, and its use is not allowed in outdoor environments without coverage, so it has to be covered by the stainless-steel box.
The best way to check the long-term detector stability is to use the IBE (inverse barometric effect). Barometric variations in the muon flux are compensated for by the tidal height variations since the total areal density above the detector will be constant as long as the detector is located under water so that the local fluctuations due to barometric variations can be intrinsically removed from the data without any artificial actions. According to data taken at the Trans-Tokyo Bay Aqua Line undersea tunnel, Japan, variations in the lunar daily muon rate were ∼0.0028 (SD) including statical errors of ∼0.001 (SD) for half-year measurements (Tanaka et al., 2021). The detector had the same configuration used in this work (R7724 and EJ200).
Each resultant PSD consists of a segmented plane with 15×15 segments having a 1.5×1.5 m2 active area with a spatial resolution of 10 cm. Since the distance between the uppermost stream detector and the lowermost stream detector is 120 cm, the angular resolution of this detector is 83 mrad. This angular resolution is equivalent to the spatial resolution of 830 m at a location 10 km from the tracker, but it is reduced to 8.3 km at a location 100 km from the tracker. The elevation and azimuth angular acceptance are respectively 0–51° and ±51°. However, since the active area is drastically reduced for muons injecting at higher angles with respect to PSD planes (e.g., for muons arriving at an elevation angle of 51° and an azimuth angle of 51°, the tracker's active area is reduced to ), for practicality, a much smaller angular region (14–32° for the elevation angular region and ±28° for the azimuthal angular region) was employed. For tracking, all vertices are examined, but only the vertices that are aligned (along a straight line) are counted as an event to ensure that only muons were selected. Lead and stainless-steel shields within the detector decrease the background noise, but they also increase the possibility of muon-scattering events. However, these scattering angles (10–20 mrad) are considered to be negligible in comparison to the current tracker's angular resolution (>80 mrad). The muon tracker used in the current experiment was located in Kagoshima, Japan, and it was pointed towards the southern direction. The measurement period was between 20 August 2017 and 30 June 2020 (1044 d).
Figure 9 shows the seasonal variation in the muon flux data acquired in the period between 20 August 2017 and 30 June 2020. As was expected, the muon flux showed a negative correlation between the ambient temperature and the muon flux, indicating that the isobaric surface height effect is predominant in seasonal variations in the muon flux. In this period there were not any specific extraterrestrial events (such as a Forbush decrease) that could have affected the primary flux. The muon counts in each bin (bin width = 3 d) ranged between 7×10⁵ and 7.4×10⁵. The muon flux variations were normalized to the value observed on 20 August 2017. The muon flux modeling results with barometric and isobaric corrections are overlaid on this plot (solid red lines in Fig. 9). The root mean square (rms) of the deviation between the theoretical values and the observational values is 0.987 %. The measured seasonal variation in the muon flux is well explained by combining the current barometric and isobaric correction models.
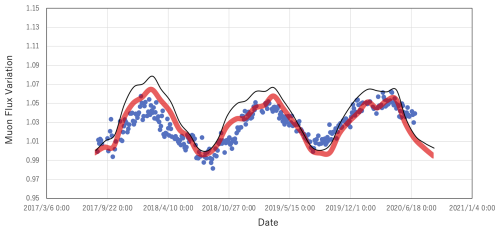
Figure 9Seasonal variation in the muon flux data acquired in the period between 20 August 2017 and 30 June 2020. The observation values (filled blue circles) and theoretical values (solid red lines) are shown. The statistical errors associated with each data point fit within the size of the circles. The barometric modeling errors are within the width of the solid red lines. Solid black lines indicate the predicted flux without the barometric correction.
The rms deviation of the observed muon flux variations from the DOF modeling results (∼1 %) induces an error of ∼60 m in the estimation of the muopause height with the DOF technique. The DOF time resolution is 3 d. These characteristics, the accuracy and time resolution, are both significantly lower than the accuracy and the time resolution that can be attained with the GPS-loaded balloons (∼5 m and 1 s). This is the main limitation of the DOF approach in its current stage of development. These limitations mainly come from (A) the statistics and (B) the modeling accuracy. Regarding factor (A), the detector size needs to be enlarged to record more muon events. In order to confirm this detector size effect, as the first step, the detector size will be increased to a double size (4.5 m2) to verify whether precision really scales by 20.5, which would be proof that statistical limitation dominates over modeling uncertainty. Regarding factor (B), more precise modeling developments with Monte Carlo (MC) simulations such as CORSIKA and Geant4 may improve the accuracy. The current work is based on the assumption that the muons travel straight forward without experiencing scattering; however, it must be noted that after the muons are generated near the tropopause, they travel through a material with a thickness equivalent to 20–40 m w.e. (water equivalent); the muons arriving from an elevation angular region between 14–32° have a tendency to scatter and cause longer track lengths in the troposphere. This effect must be taken into account in future work to make improvements to factor (B). The discrepancy between the balloon position and the muon generation region may also influence how closely the compared datasets match. The muospheric layer thickness seasonally oscillates, but its amplitude is likely to depend on the location of the measurement on the Earth since the near-surface temperature varies regionally. If the surface temperature is different between the location underneath the balloon and the location underneath the region of interest of the muopause, the muopause height in this region and the balloon-based isobaric surface altitude will not coincide. Since the balloon's trajectory is random, and it is difficult to control it, the next step in development is to compare the DOF data with satellite-based stratospheric sensing data.
In conclusion, a new muographic technique called DOF was proposed, and with this technique, it was found that the muopause height interlocks with the isobaric surface height in the upper troposphere and lower stratosphere. This work defined (A) the position of the muopause and the layer span of the muosphere on the Earth; additionally, it was shown that (B) the muopause is located in the lower stratosphere, (C) seasonal variations in the muon flux are predominantly ruled by muopause dynamics, (D) muopause dynamics can be visualized with DOF muography by taking advantage of the directional patterns of cosmic-ray muon survival probabilities, and (E) muopause dynamics are closely related to isobaric surface height variations in the lower stratosphere.
Muopause dynamics have the potential to contribute to research focused on upper-tropospheric and lower-stratospheric dynamics. In future studies, the potential of DOF muography for application to studying the dynamical processes occurring in the upper troposphere and lower stratosphere will be further investigated by performing related case studies and making specific comparisons with other atmospheric climate datasets. The next step would be spatiotemporal mapping of the muopause that would reflect spatiotemporal variations in tropospheric convection depth.
The datasets used and/or analyzed during the current study are available from the corresponding author on reasonable request.
The author is a member of the editorial board of Geoscientific Instrumentation, Methods and Data Systems. The peer-review process was guided by an independent editor, and the author also has no other competing interests to declare.
Publisher's note: Copernicus Publications remains neutral with regard to jurisdictional claims made in the text, published maps, institutional affiliations, or any other geographical representation in this paper. While Copernicus Publications makes every effort to include appropriate place names, the final responsibility lies with the authors.
This paper was edited by Francesco Soldovieri and reviewed by three anonymous referees.
Allkofer, O. C., Bella G., Dau, W. D., Jokisch, H., Klemke, G., Oren, Y., and Uhr, R.: Cosmic ray muon spectra at sea-level up to 10 TeV, Nucl. Phys. B, 259, 1–18, 1985.
Blackett, P. M. S.: On the instability of the Barytron and the temperature effect of cosmic rays, Phys. Rev., 54, 973–974, https://doi.org/10.1103/PhysRev.54.973, 1938.
Boezio, M., Carlson, P., Francke, T., Weber, N., Suffert, M., Hof, M., Menn, W., Simon, M., Stephens, S. A., Bellotti, R., Cafagna, F., Castellano, M., Circella, M., de Marzo, C., Grimani, C., Finetti, N., Papini, P., Piccardi, S., Spillantini, P., Ricci, M., Casolino, M., de Pascale, M. P., Morselli, A., Picozza, P., Sparvoli, R., Barbiellini, G., Bravar, U., Schiavon, P., Vacchi, A., Zampa, N., Mitchell, J. W., Ormes, J. F., Streitmatter, R. E., Golden, R. L., and Stochaj, S. J.: New Measurement of the Flux of Atmospheric Muons, Phys. Rev. Lett., 82, 4757, https://doi.org/10.1103/PhysRevLett.82.4757, 1999.
Boezio, M., Carlson, P., Francke, T., Weber, N., Suffert, M., Hof, M., Menn, W., Simon, M., Stephens, S. A., Bellotti, R., Cafagna, F., Circella, M., de Marzo, C., Finetti, N., Papini, P., Piccardi, S., Spillantini, P., Ricci, M., Casolino, M., de Pascale, M. P., Morselli, A., Picozza, P., Sparvoli, R., Barbiellini, G., Schiavon, P., Vacchi, A., Zampa, N., Grimani, C., Mitchell, J. W., Ormes, J. F., Streitmatter, R. E., Bravar, U., Golden, R. L., and Stochaj, S. J.: Measurement of the flux of atmospheric muons with the CAPRICE94 apparatus, Phys. Rev. D, 62, 032007, https://doi.org/10.1103/PhysRevD.62.032007, 2000.
COSINE-100 Collaboration: Measurement of the cosmic muon annual and diurnal flux variation with the COSINE-100 detector, arxiv [preprint], https://doi.org/10.48550/arXiv.2005.13672, 2020.
Dmitrieva, A. N., Kokoulin, R. P., Petrukhin, A. A., and Timashkov, D. A.: Corrections for temperature effect for ground-based muon hodoscopes, Astropart. Phys., 34, 401–411, 2011.
Gnanvo, K., Benson, B., Bittner, W., Costa, F., Grasso, L., Hohlmann, M., Locke, J. B., Martoiu, S., Muller, H., Staib, M., Tarazona, A., and Toledo, J.: Imaging of high-Z material for nuclear contraband detection with a minimal prototype of a muon tomography station based on GEM detectors, Nucl. Instrum. Meth. A, 652, 16–20, 2011.
Japan Metrological Agency: Past Metrological Data, https://www.jma.go.jp/jma/indexe.html (last access: 15 January 2025), 2023.
Kretschmer, M., Cohen, J., Wendt, V., and Runge, J.: The different stratospheric influences on cold extremes in Eurasia and North America, npj Clim. Atmos., 1, 44, https://doi.org/10.1038/s41612-018-0054-4, 2018.
L3 Collaboration: Measurement of the atmospheric muon spectrum from 20 to 3000 GeV, Phys. Lett. B, 598, 15–32, 2004.
Millán, L. F., Santee, M. L., Lambert, A., Livesey, N. J., Werner, F., Schwartz, M., Pumphrey, H. C., Manney, G. L., Wu, L., Read, W. G., Froidevaux, L., and Wang, Y.: The Hunga Tonga – Hunga Ha'apai Hydration of the Stratosphere, Geophys. Res. Lett., 49, e2022GL099381, https://doi.org/10.1029/2022GL099381, 2022.
Morishima, K., Kuno, M., Nishio, A., Kitagawa, N., Manabe, Y., Moto, M., Takasaki, F., Fujii, H., Satoh, K., Kodama, H., Hayashi, K., Odaka, S., Procureur, S., Attié, D., Bouteille, S., Calvet, D., Filosa, C., Magnier, P., Mandjavidze, I., Riallot, M., Marini, B., Gable, P., Date, Y., Sugiura, M., Elshayeb, Y., Elnady, T., Ezzy, M., Guerriero, E., Steiger, V., Serikoff, N., Mouret, J-B., Charlès, B., Helal, H., and Tayoubi, M.: Discovery of a big void in Khufu's Pyramid by observation of cosmic-ray muons, Nature, 552, 386–390, https://doi.org/10.1038/nature24647, 2017.
Myssowsky, L. and Tuwim, L.: Unregelmäßige Intensitätsschwankungen der Höhenstrahlung in geringer Seehöhe, Z. Phys., 39, 146–150, https://doi.org/10.1007/BF01321981, 1926.
Particle Data Group: The Review of Particle Physics, Prog. Theor. Exp. Phys., 2022, 083C01, https://doi.org/10.1093/ptep/ptac097, 2022.
Tanaka, H. K. M., Kusagaya, T., and Shinohara, H.: Radiographic visualization of magma dynamics in an erupting volcano, Nat. Commun., 5, 3381, https://doi.org/10.1038/ncomms4381, 2014.
Tanaka, H. K. M., Aichi, M., Bozza, C. Coniglione, R., Gluyas J., Hayashi, N., Holma, M., Kamoshida, O., Kato, Y., Kin, T., Kuusiniemi, P., Leone, G., Lo Presti, D., Matsushima, J., Miyamoto, H., Mori, H., Nomura, Y., Oláh, L., Steigerwald, S., Shimazoe, K., Sumiya, K., Takahashi, H., Thompson, L. F., Yokota, Y., Paling, S., and Varga, D.: First results of undersea muography with the Tokyo-Bay Seafloor Hyper-Kilometric Submarine Deep Detector, Sci. Rep., 11, 19485, https://doi.org/10.1038/s41598-021-98559-8, 2021.
Tanaka, H. K. M., Gluyas, J., Holma, M., Joutsenvaara, J., Kuusiniemi, P., Leone, G., Lo Presti, D., Matsushima, J., Oláh, L., Steigerwald, S., Thompson, L. F., Usoskin, I., Poluianov, S., Yokota, Y., and Varga, D.: Atmospheric muography for imaging and monitoring tropic cyclones, Sci. Rep., 12, 16710, https://doi.org/10.1038/s41598-022-20039-4, 2022a.
Tanaka, H. K. M., Aichi, M., Balogh, S. J., Bozza, C., Coniglione, R., Gluyas, J., Hayashi, N., Holma, M., Joutsenvaara, J., Kamoshida, O. Kato, Y., Kin, T., Kuusiniemi, P., Leone, G., Lo Presti, D., Matsushima, J., Miyamoto, H., Mori, H., Nomura, Y., Oláh, L., Steigerwald, S., Shimazoe, K., Sumiya, K., Takahashi, H., Thompson. L.F., Tokunaga, T., Yokota, Y., Paling, S., and Varga, D.: Periodic sea-level oscillation in Tokyo Bay detected with the Tokyo-Bay seafloor hyper-kilometric submarine deep detector (TS-HKMSDD), Sci. Rep., 12, 6097, https://doi.org/10.1038/s41598-022-10078-2, 2022b.
The IceCube Collaboration: Seasonal variation of atmospheric muons in IceCube, PoS (ICRC2019) 894, https://pos.sissa.it/358/894/pdf (last access: 15 January 2025), 2019.
Thompson, M. G. and Whalley, M. R.: The sea-level muon spectrum and charge ratio and their relationship with high-energy accelerator data, J. Phys. G, 3, 97, https://doi.org/10.1088/0305-4616/3/1/011, 1977.
Tilav, S., Desiati, P., Kuwabara, T., Rocco, D., Rothmaier, F., Simmons, M., and Wissing, H.: Atmospheric variation as observed by IceCube, arXiv [preprint], https://doi.org/10.48550/arXiv.1001.0776, 2010.
Tramontini, M., Rosas-Carbajal, M., Nussbaum, C., Gibert, D., and Marteau, J.: Middle-Atmosphere Dynamics Observed With a Portable Muon Detector, Earth Space Sci., 6, 1865–1876, 2019.
Vömel, H., Evan, S., and Tully, M.: Water vapor injection into the stratosphere by Hunga Tonga-Hunga Ha'apai, Science, 377, 1444–1447, 2022.
Yook, S., Thompson, D. W. J., and Solomon, S.: Climate Impacts and Potential Drivers of the Unprecedented Antarctic Ozone Holes of 2020 and 2021, Geophys. Res. Lett., 49, e2022GL098064, https://doi.org/10.1029/2022GL098064, 2022.
(1.6×10² m−2 s−1) [averaged muon flux] × (5×10¹⁴ m2) [Earth's surface area] × (3.0×10⁴ m) [thickness of the muosphere] / (3×10⁸ ms−1) [speed of muons].
distance of flight of cosmic-ray muons, for sensing the height of the layer of the Earth where cosmic-ray muons are generated, called the muopause, which is closely related to the height of the tropopause and lower stratosphere.
distance of flight of cosmic-ray muons, for...


