the Creative Commons Attribution 4.0 License.
the Creative Commons Attribution 4.0 License.
 | 12 Jun 2025
Humidity measurements in carbon dioxide with Sensirion SHT85 humidity sensors under simulated Martian atmospheric conditions
Andreas Lorek
Stephen Patrick Garland
Humidity sensors that function under extreme conditions are needed in experimental chambers in which the atmospheric conditions near the surface of Mars are simulated, as well as for in situ measurements of humidity on the surface of Mars. Experimental setups with such sensors have already been constructed at the German Aerospace Center (DLR) and published. However, the SHT75 sensors from Sensirion used at that time are no longer in production and have been replaced by a new generation of sensors: SHT85. The SHT85 sensors are more precise than their predecessors, have a new sensor chip, and feature a PTFE membrane over the humidity-sensitive layer to protect the sensor from dust and liquids. The data interface to the I2C bus has also changed. Due to these significant changes, it was necessary to verify the sensor's capabilities under extreme conditions. For this purpose, the sensors were tested under the same conditions and in parallel to the calibration of the MEDA HS sensor from the Finnish Meteorological Institute (FMI), on board NASA's Mars 2020 rover. The results show that the SHT85 is, as its predecessor SHT75, suitable for measurements under Martian atmospheric conditions when the relative humidity is in the range > 5 %.
- Article
(7739 KB) - Full-text XML
- BibTeX
- EndNote


The SHT85 sensors from Sensirion AG are polymer-based capacitive humidity sensors. This kind of sensor can work under extreme conditions, leading to applications for in situ humidity measurements on Mars (Gómez-Elvira et al., 2012; Witte et al., 2022; Zent et al., 2016) and in Mars simulation chambers (Jensen et al., 2008). An overview of the performance of a capacitive polymer sensor (MEDA HS) under Martian conditions is published in Hieta et al. (2022). In the Planetary Analogue Simulation Laboratory (PASLAB) at the German Aerospace Institute (DLR) such sensors are used in an experiment chamber for Mars exposure simulations (Lorek and Majewski, 2018). Up until now SHT75 sensors from Sensirion AG were used inside the chamber; however due to the termination of the production of the SHT75 and the good experience with this sensor (Lorek, 2014; Lorek and Majewski, 2018), the SHT85 was considered as a replacement. The SHT85 has significant changes compared to SHT75 (Anon, 2018) (Fig. 1) such as a PTFE membrane, new humidity sensitive chip, higher precision, and a new data interface.
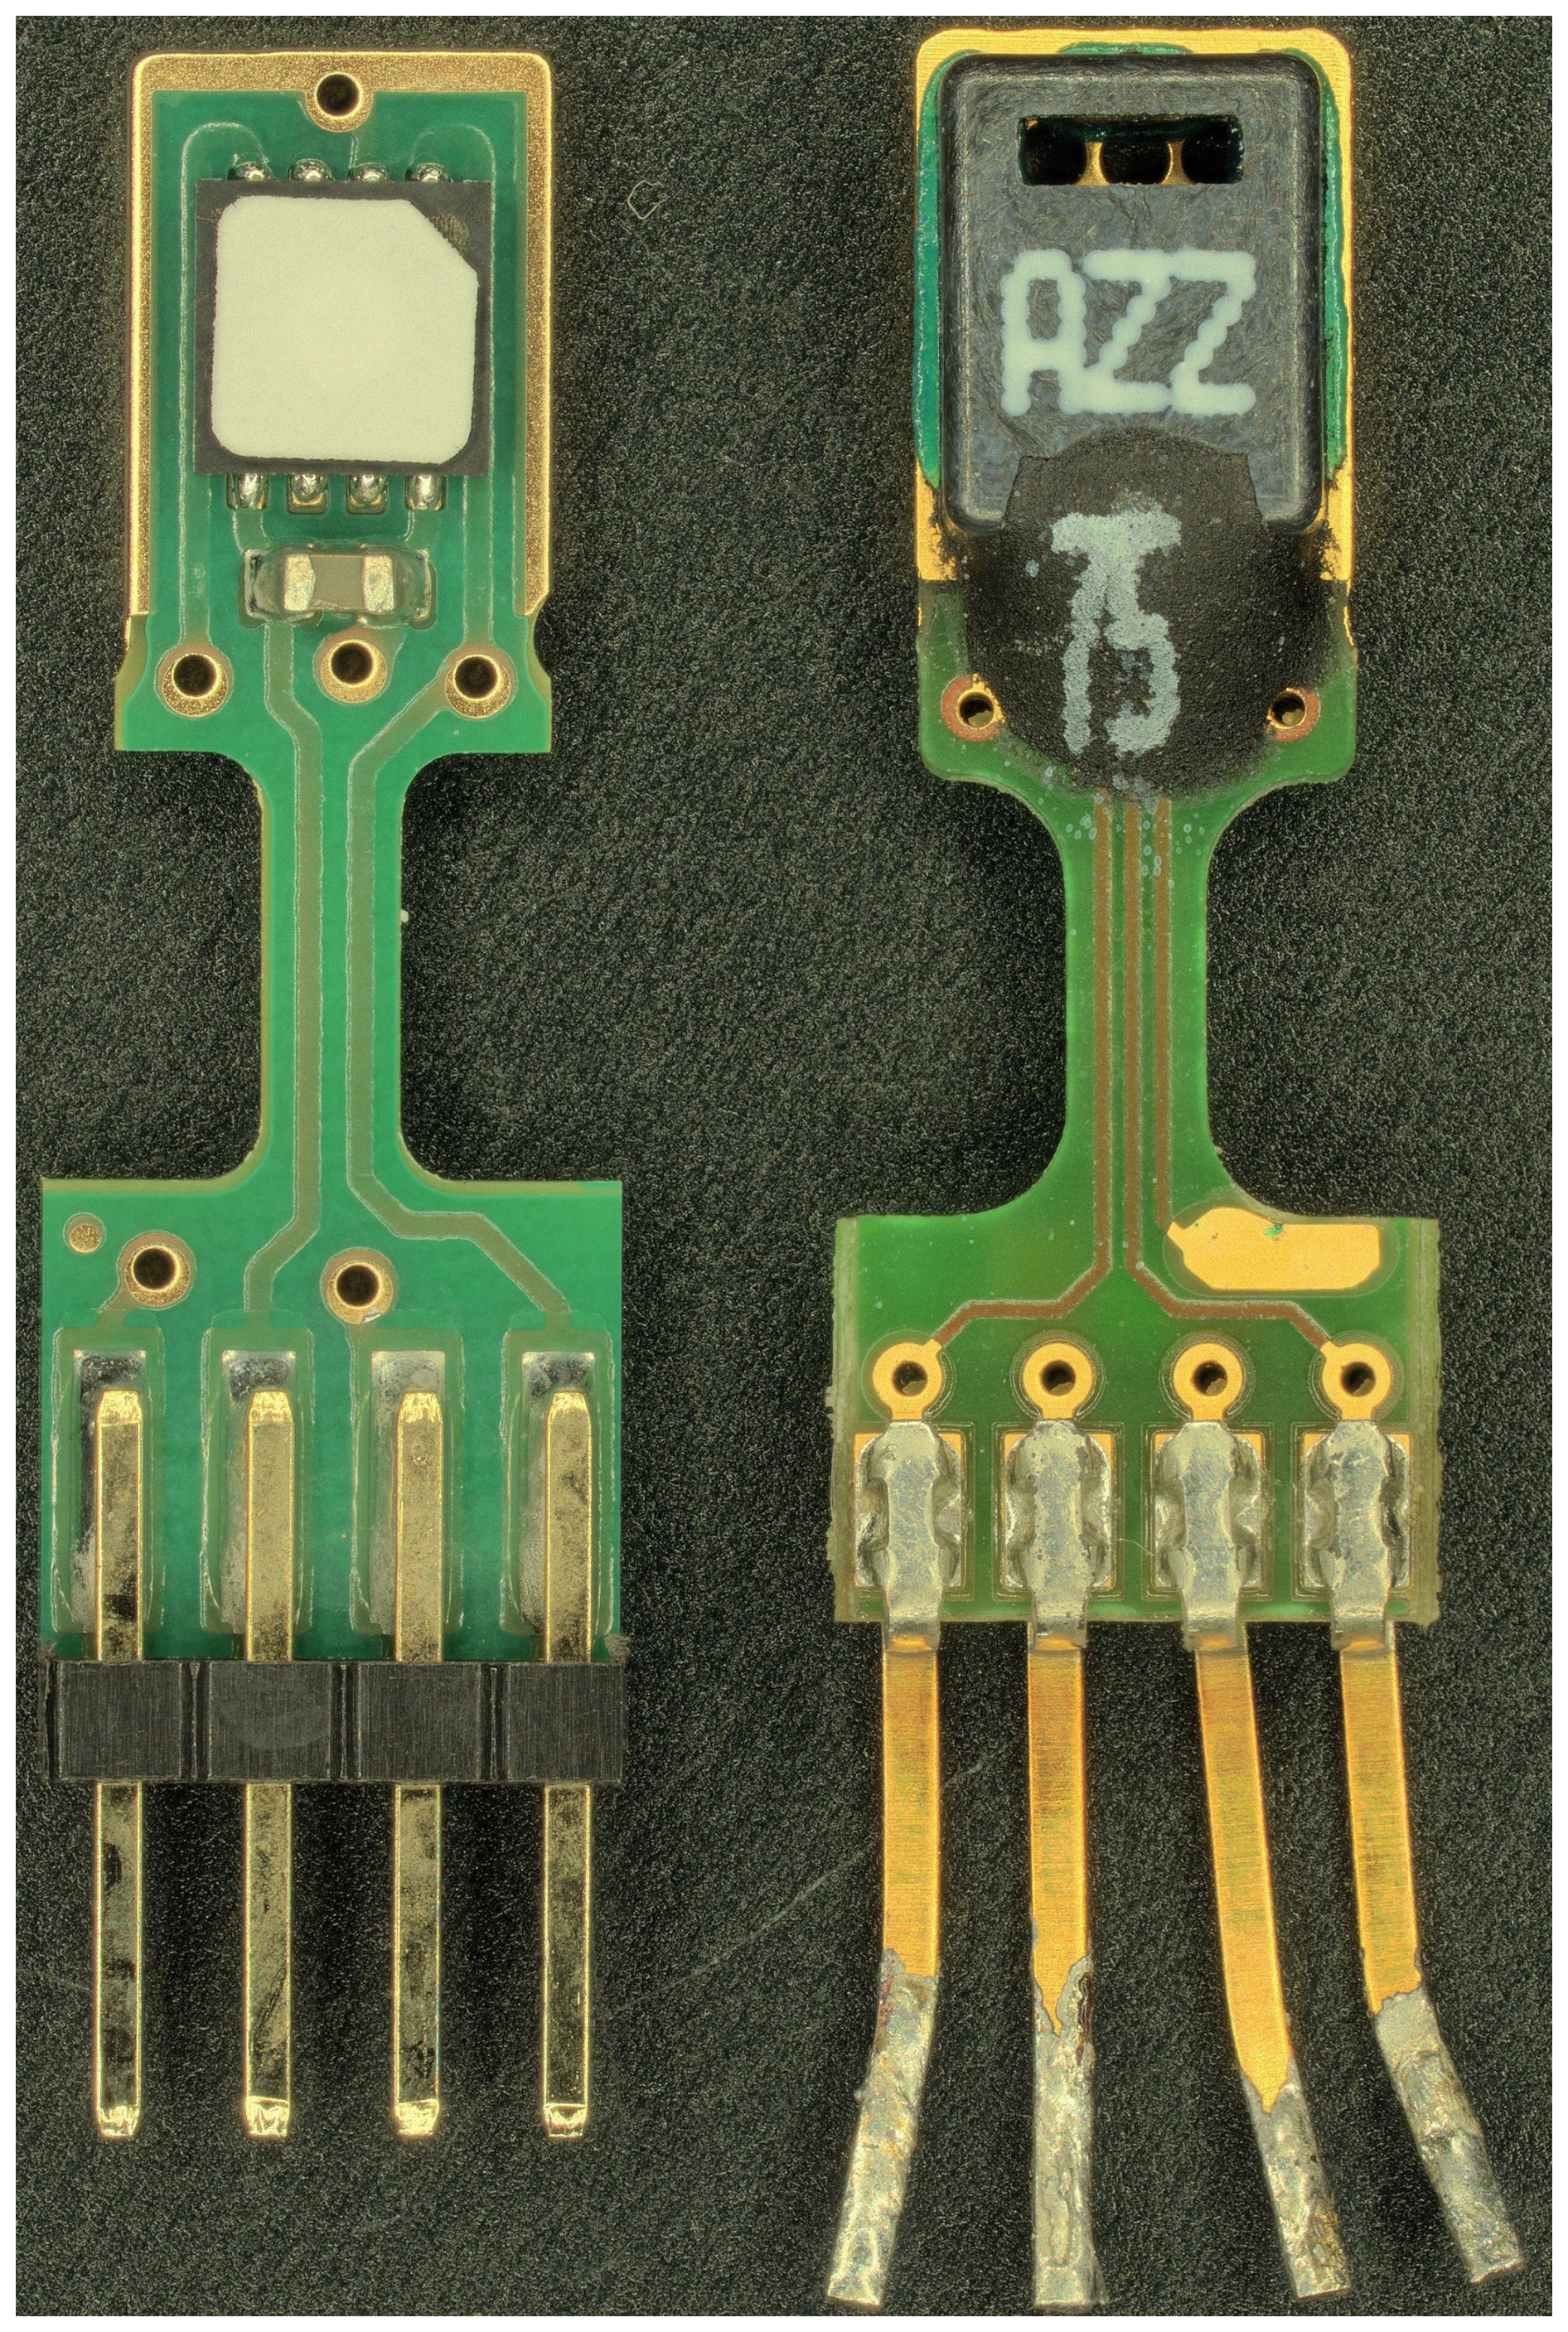
Figure 1SHT85 (left) and SHT75 (right) (Lorek et al., 2024).
With the SHT75 extensive experiments in air and CO2 were made in the temperature range from −70 to 10 °C, pressure range from 10 to 1000 hPa, and relative humidity (Uw,i – w,i signifying water, ice) range from around 5 % to 95 % (Lorek, 2014; Lorek and Majewski, 2018).
The Finnish Meteorological Institute (FMI) successful calibrated its MEDA HS, REMS-H, and METEO-H sensors (Hieta et al., 2022, 2024) at PASLAB in 2020/21. In parallel to this calibration campaign, and under the same conditions, six SHT85 sensors were tested to evaluate their performance under extreme conditions compared to the SHT75.
Experiments were conducted at the humidity sensor calibration facility at PASLAB, DLR Berlin. An overview of the experimental setup is shown in Fig. 2. Generally, CO2 was used for the experiments, apart from a few where air was used. In both cases, dry gas was mixed with precisely humidified gas using mass flow controllers (MFCs) in the gas mixing system. The resulting gas, with a defined water content, flowed via stainless steel tubing through two MFC outputs to the measurement cells housing the sensors and over a third to the reference humidity measurement: a dew point mirror (MBW 373LX). The measurement cells were mounted in a temperature test chamber (Weiss KWP 240). The measurement cell was made from stainless steel and comprised two measurement chambers (see Lorek, 2014, and Lorek and Majewski, 2018, for more details). A Pfeiffer Vacuum CMR 361 pressure sensor was used to measure pressure inside the measurement cell. After passing through the chambers the gas flow was directed to a vacuum pump (VACUUBRAND MV10 Vario) which was used to set the pressure in the chambers.
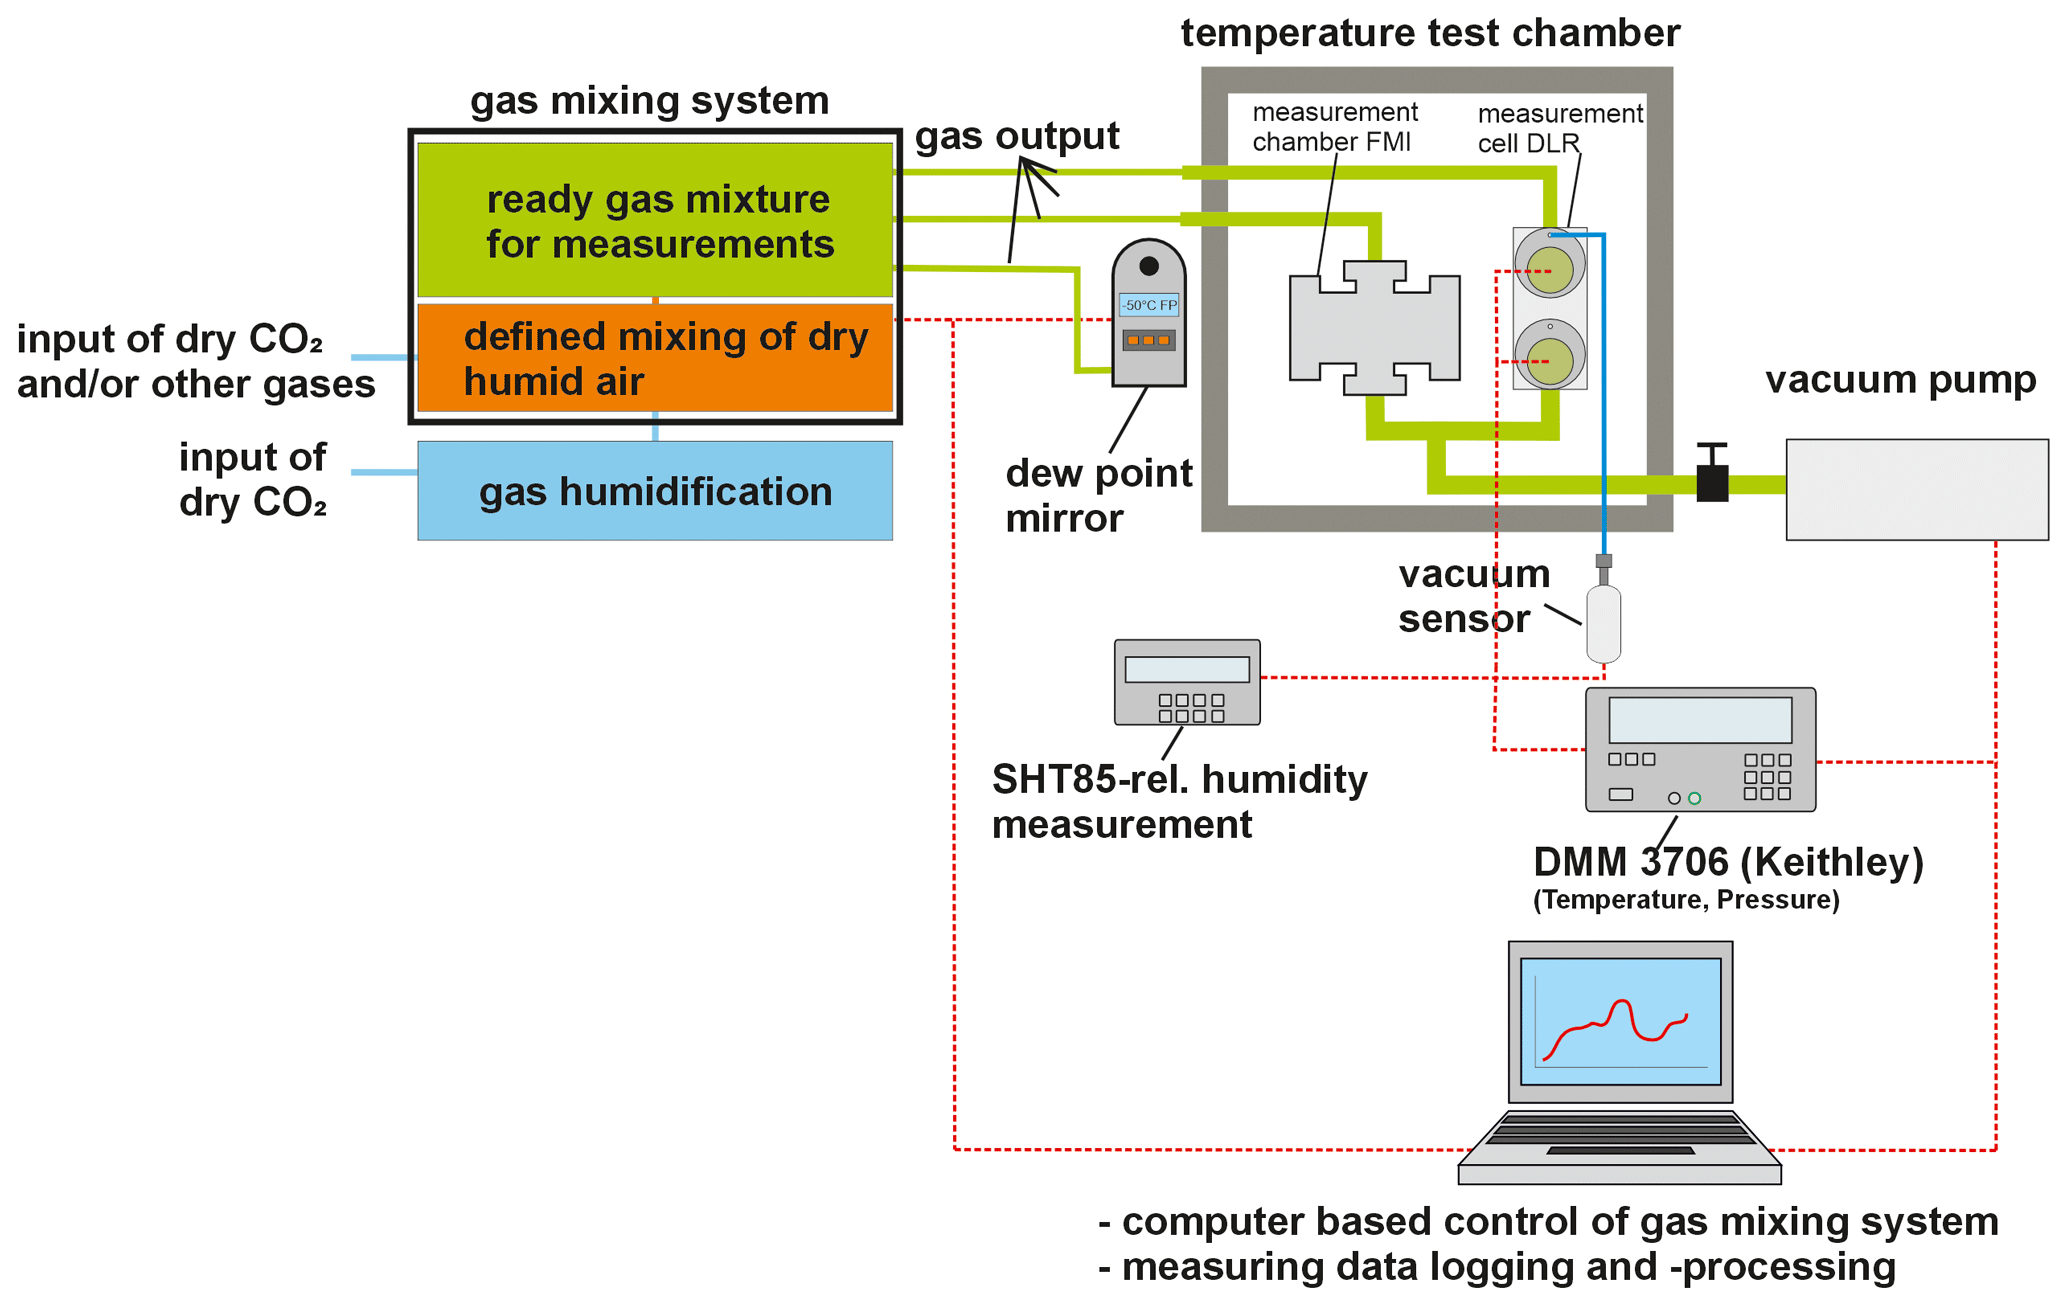
Figure 2This figure of the experiment setup is based on Fig. 9a from Hieta et al. (2022).
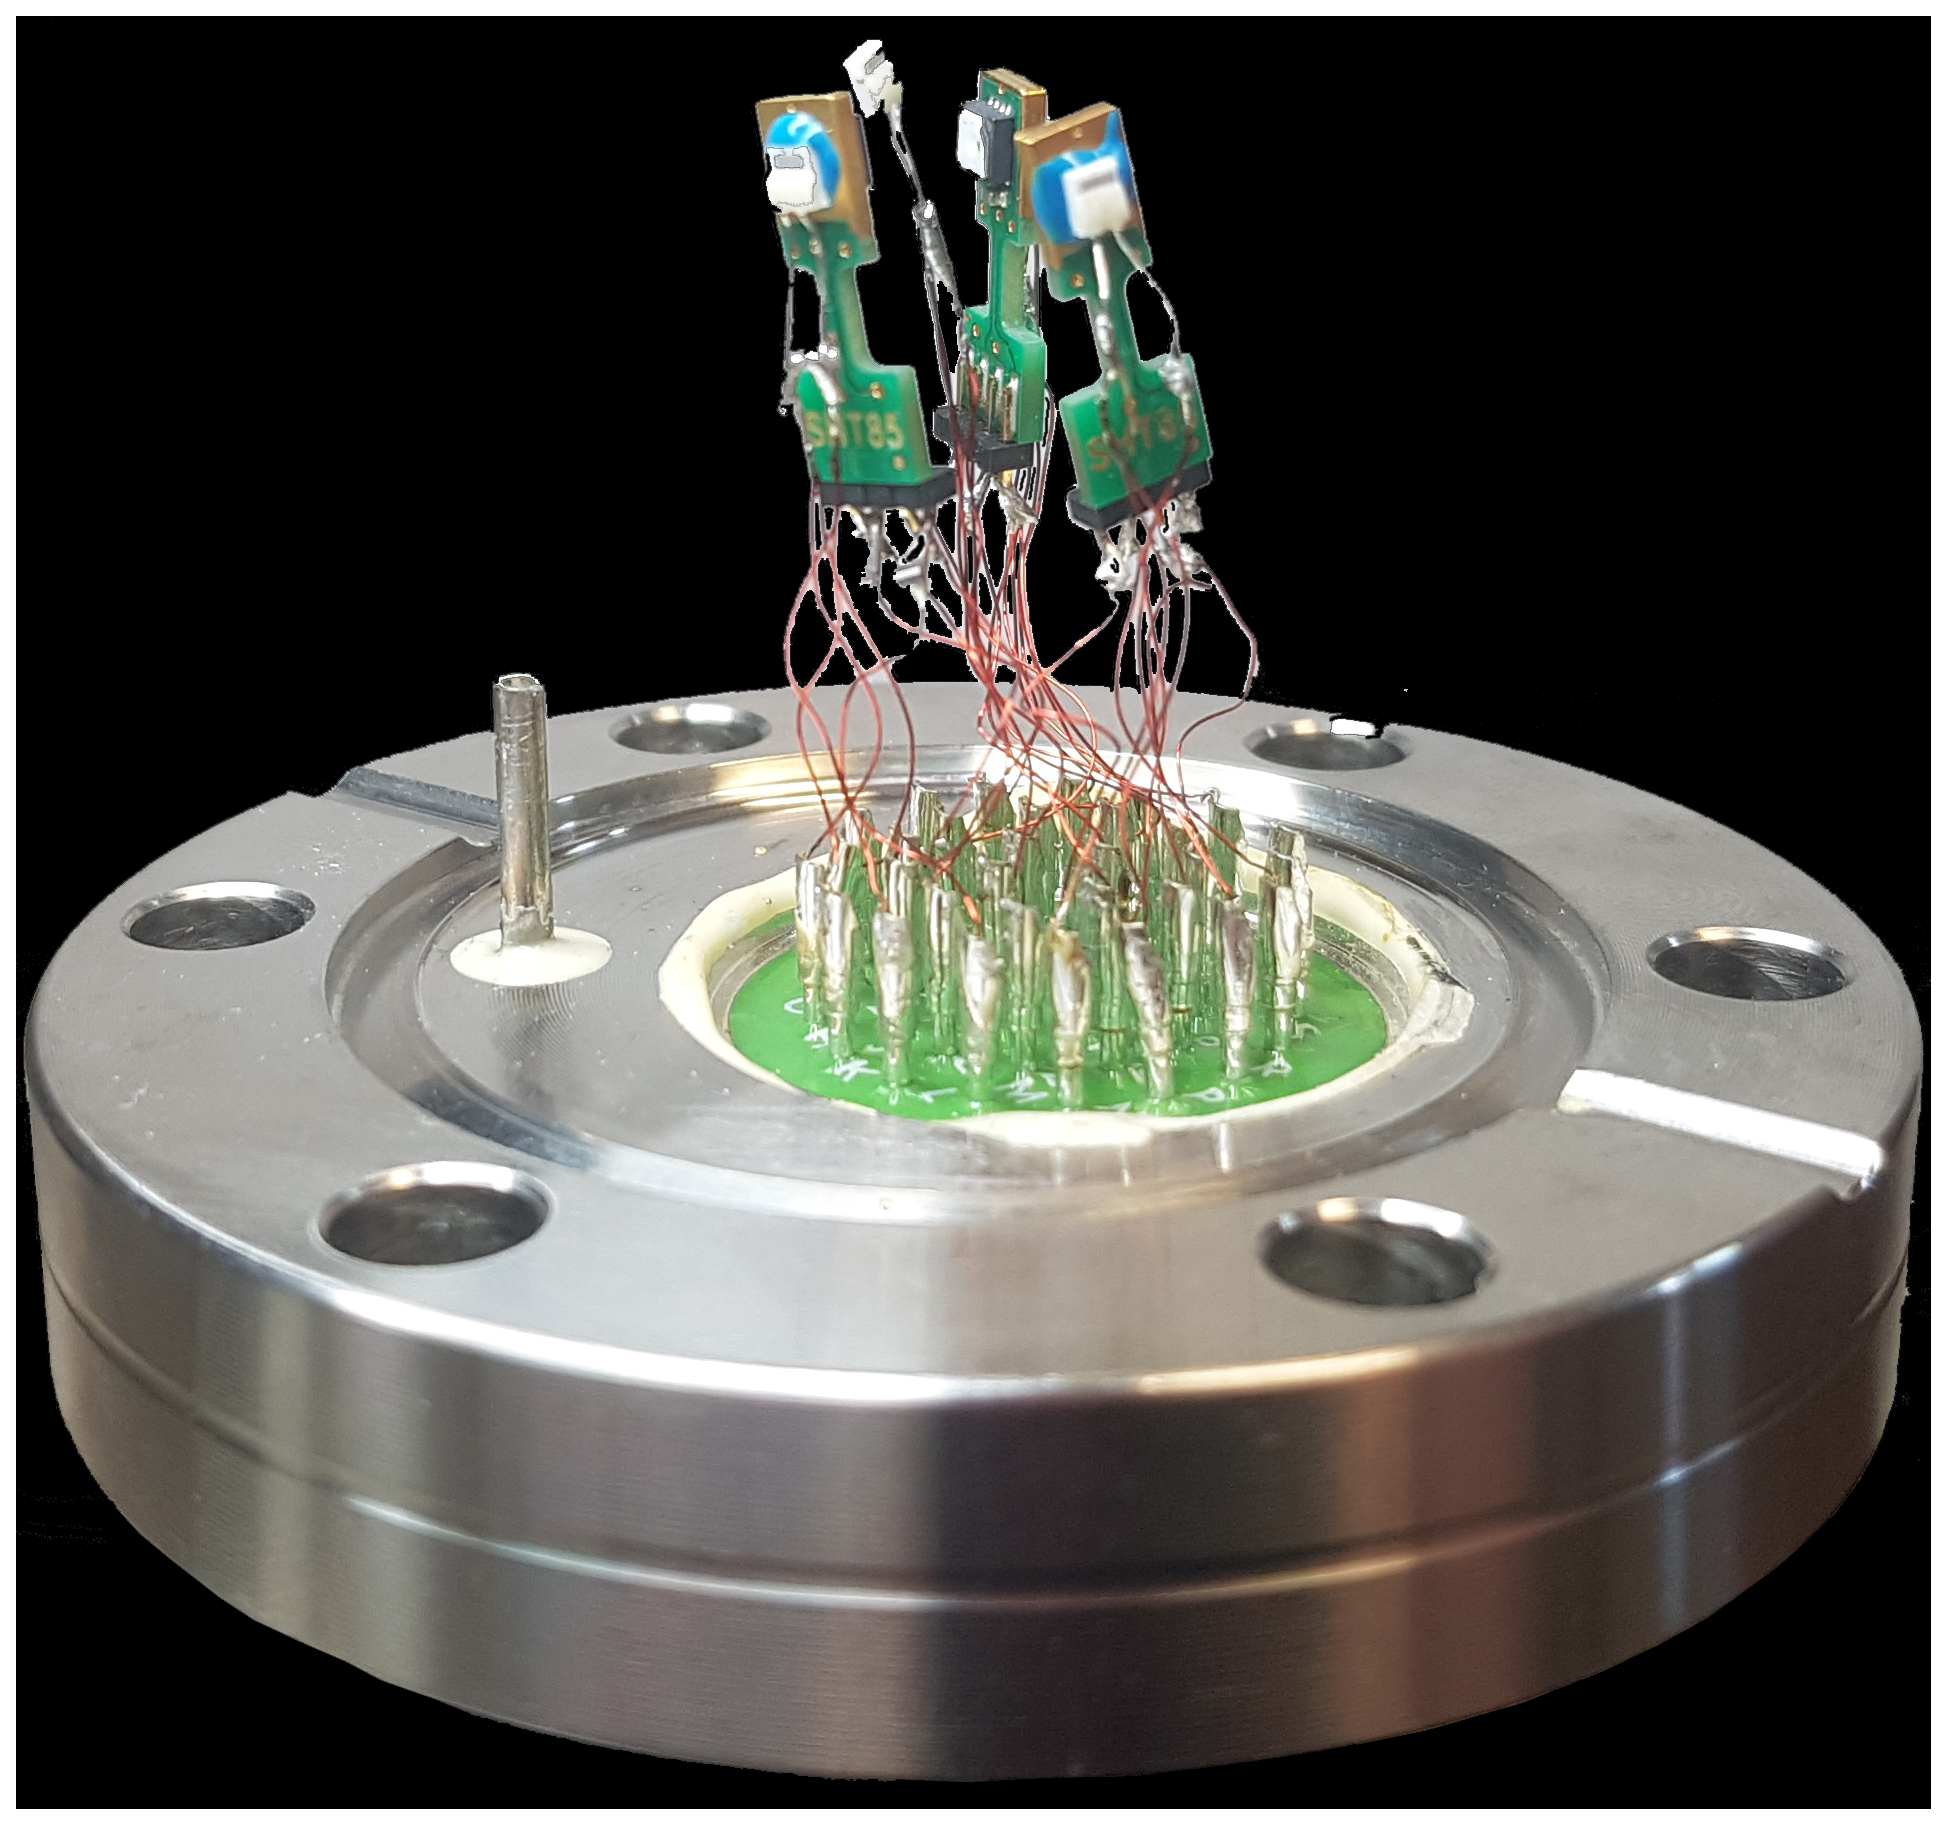
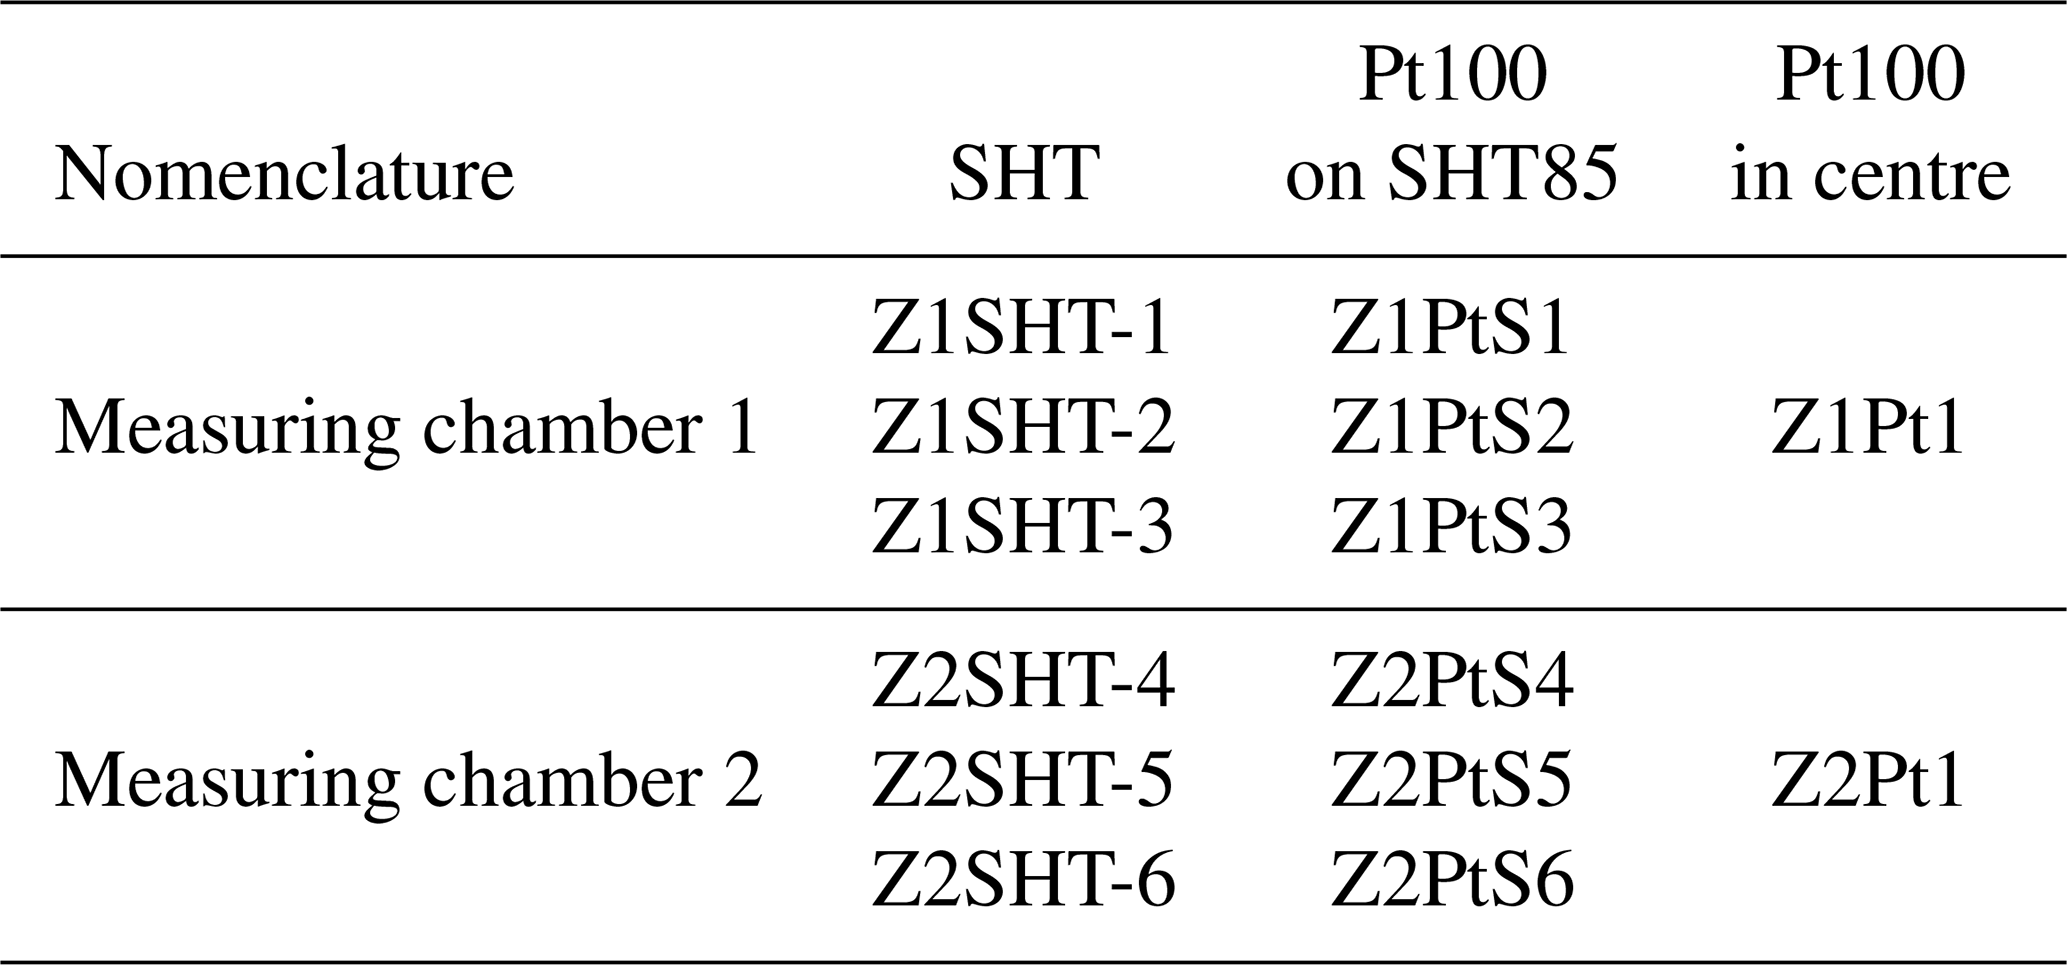
The sensor measurement head is shown in Fig. 3. Three SHT85 and four Pt100 (POK1.232.6W.Y.007 IST AG) sensors were placed in each of the measuring chambers comprising the measuring cell. As in the previous experiments (Lorek, 2014), a Pt100 was glued onto the back of each SHT85 sensor since the measuring limit for the SHT85 temperature sensor is −40 °C and temperatures down to −70 °C were set during experiments. The fourth Pt100 was centred between the SHT85/Pt100 combined sensors. Table 1 shows the naming convention for each sensor used in this paper.
The ranges of the relative humidity for every temperature–pressure combination used during the experiments are listed in Table 2. Test runs began at the driest humidity points and increased in steps of 5 %, from 10 % to 20 % Ui,w. At each step the humidity was kept stable over several hours. After reaching the highest humidity, the humidity was lowered again in the same way (Fig. 7). The main procedure of the experiment is described in Hieta et al. (2022), Lorek (2014), and Lorek and Majewski (2018).
Table 2Range of the relative humidity in air and CO2 under investigation for the different temperature and pressure conditions. Relative humidity is calculated with respect to water Uw or ice Ui (marked by brackets).
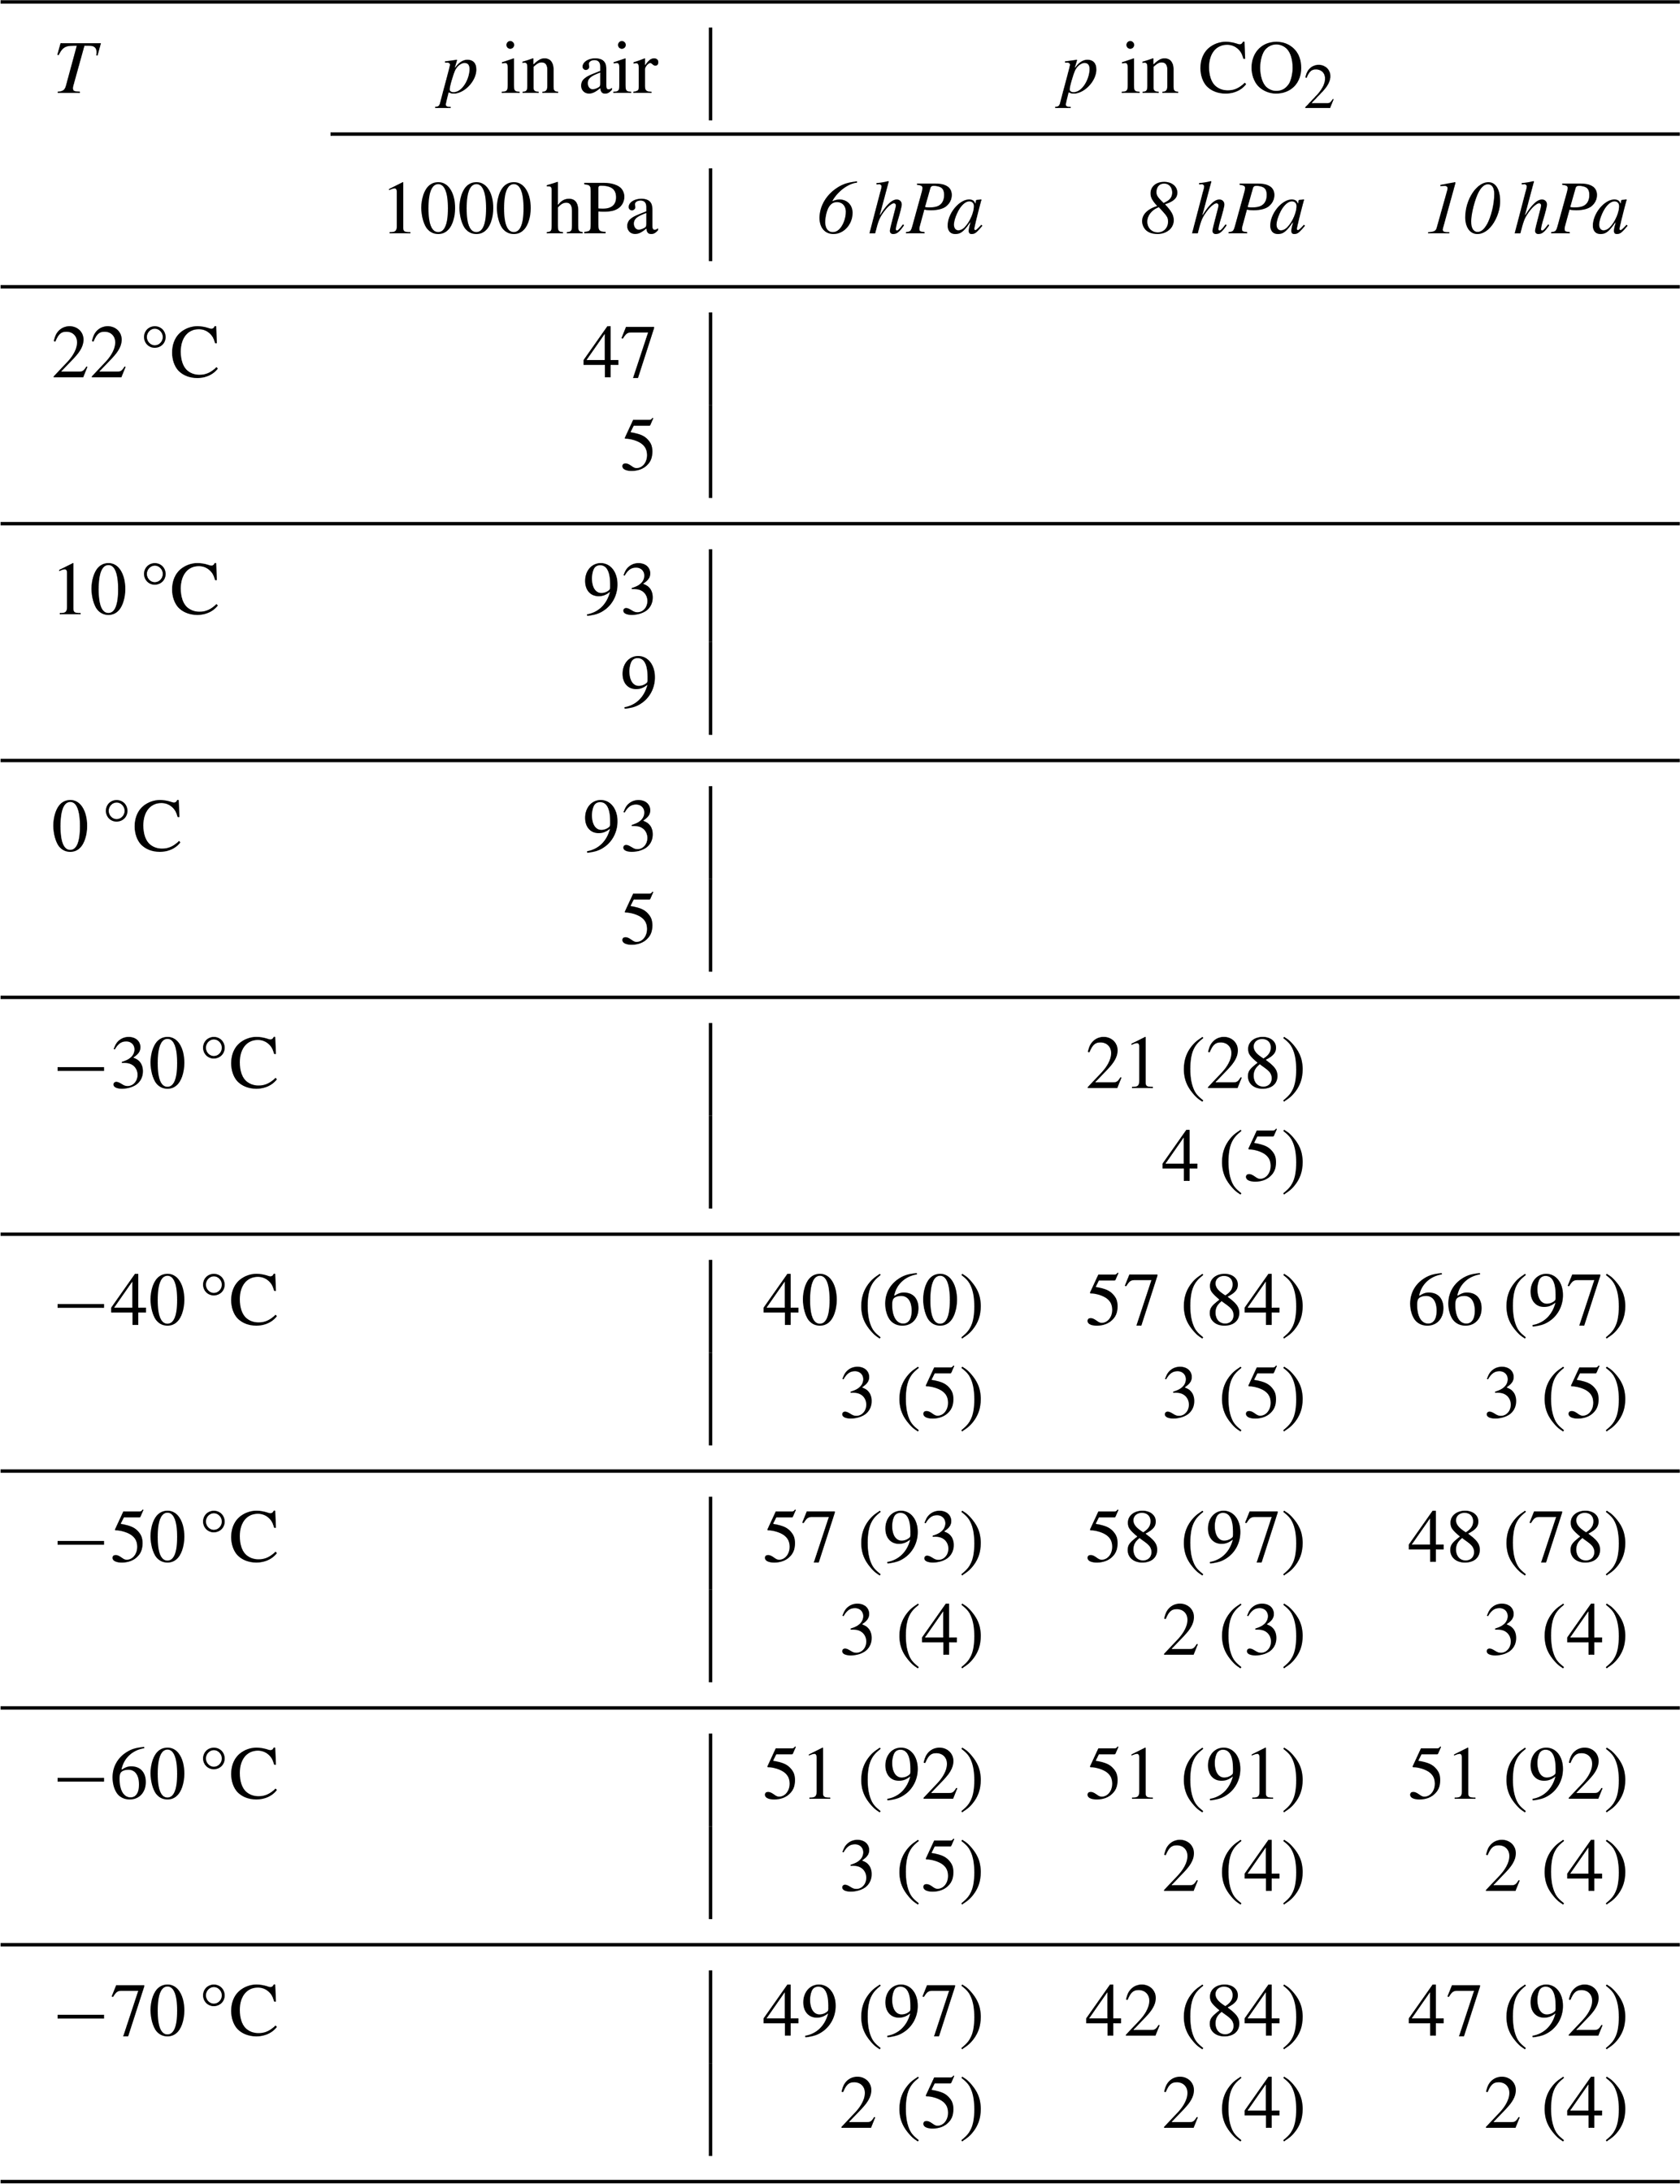
The measurement at −30 °C and 8 hPa was for orientation only. Due to the construction of the gas mixing and humidification system the highest reachable humidity is approximately 10 to 11 °C dew point at 1 atm pressure. This leads to a Ui of approximately 30 % of the maximum at −30 °C and 8 hPa, which was deemed insufficient for a complete fit over the full relative humidity range. For this reason, the measurements were not repeated at 6 and 10 hPa.
The relative humidity is given as U, with Uw for temperatures > 0 °C and Ui for temperatures ≤0 °C. The calculation is based on Eqs. (1)–(3) (Anon, 2012) as used in Lorek (2014). In addition, the parameters are the water vapour partial pressure, e (hPa), and the saturation vapour pressure under saturation conditions above a planar water or ice surface, ew (hPa) and ei (hPa), respectively, at total pressure p (hPa), temperature T (K), and T1=273.16 K (triple point temperature of water).
Equation (2) is valid in the temperature range from 0 to 100 °C:
Equation (3) is valid in the temperature range from −100 to 0 °C:
Table 3Linear fit equations of the data from Fig. 9 for each temperature in the pressure range from 6 to 10 hPa.
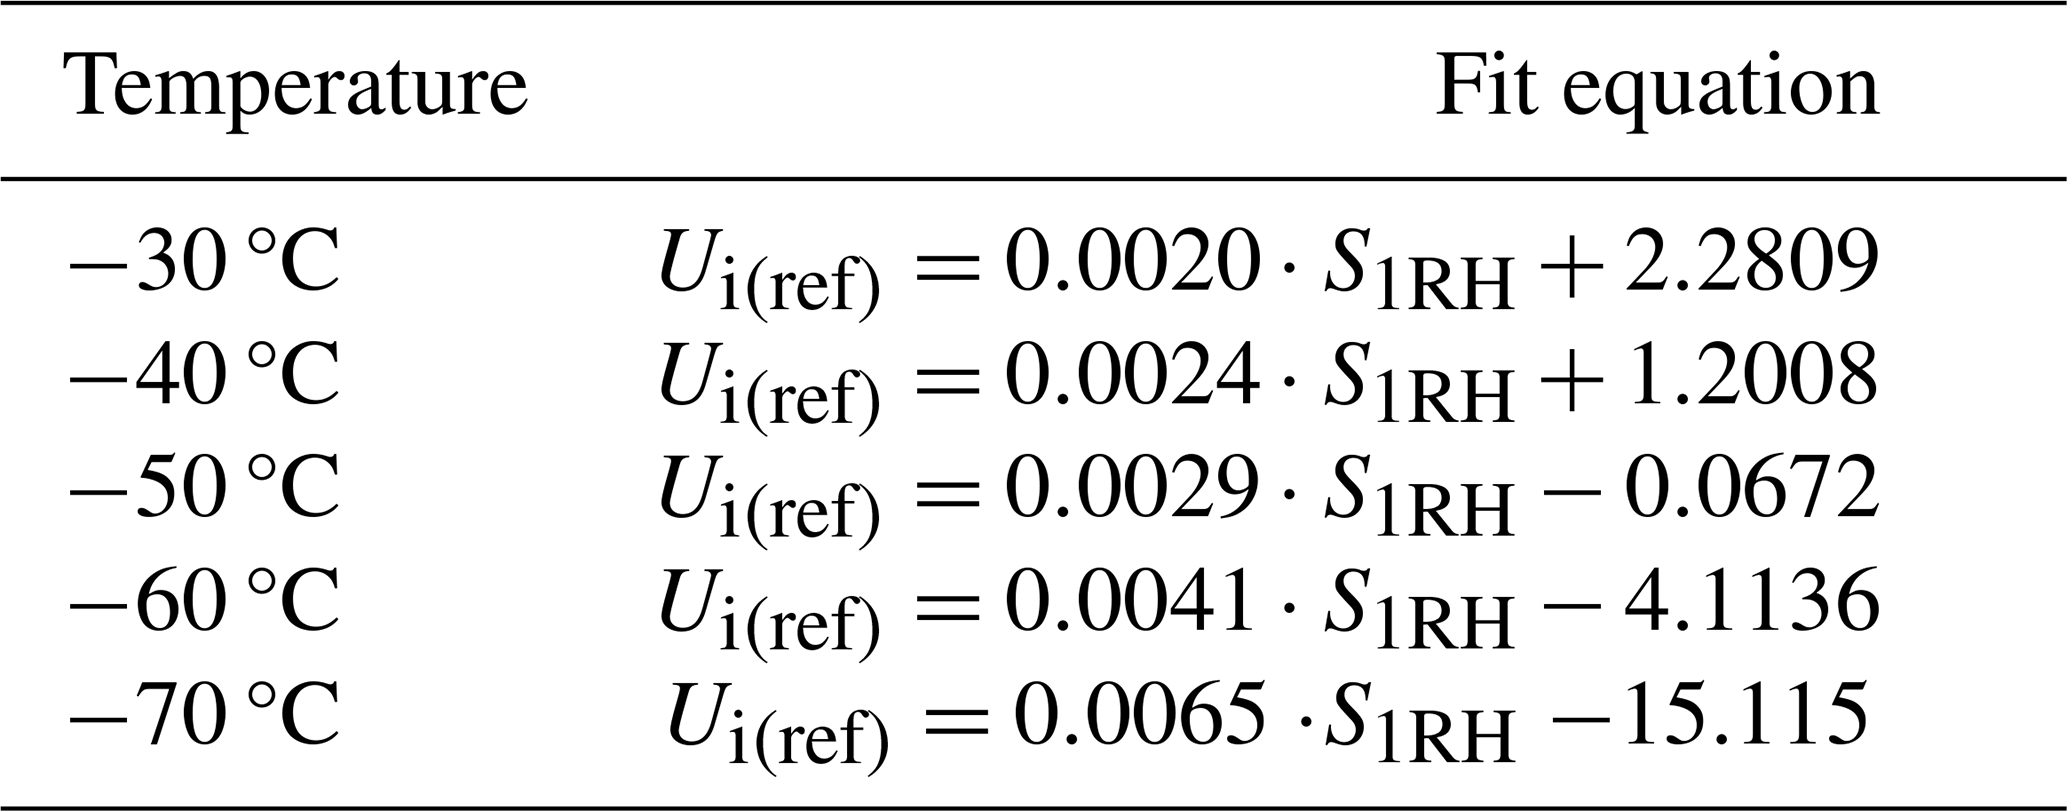
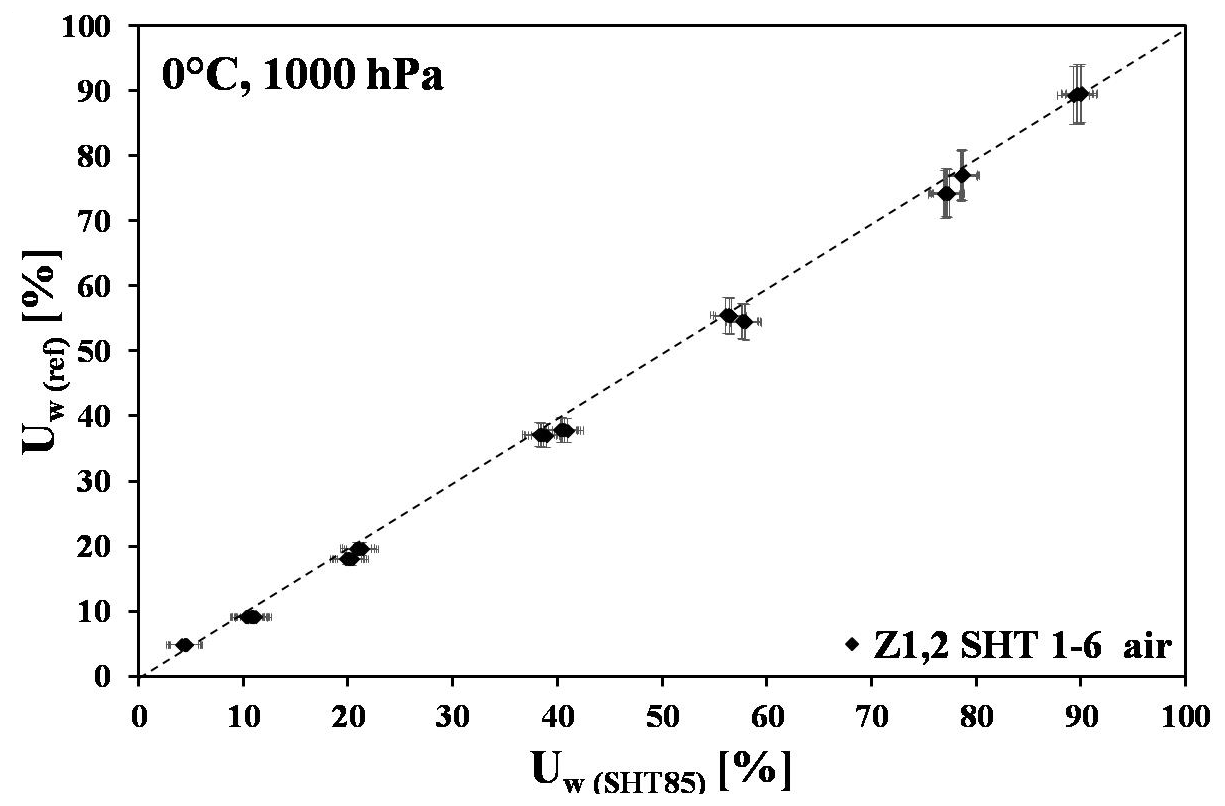
Figure 4The relative humidity values from the reference system (air, 0 °C, 1000 hPa) as a function of the humidity values of all six SHT85 sensors calculated using Eq. (4).
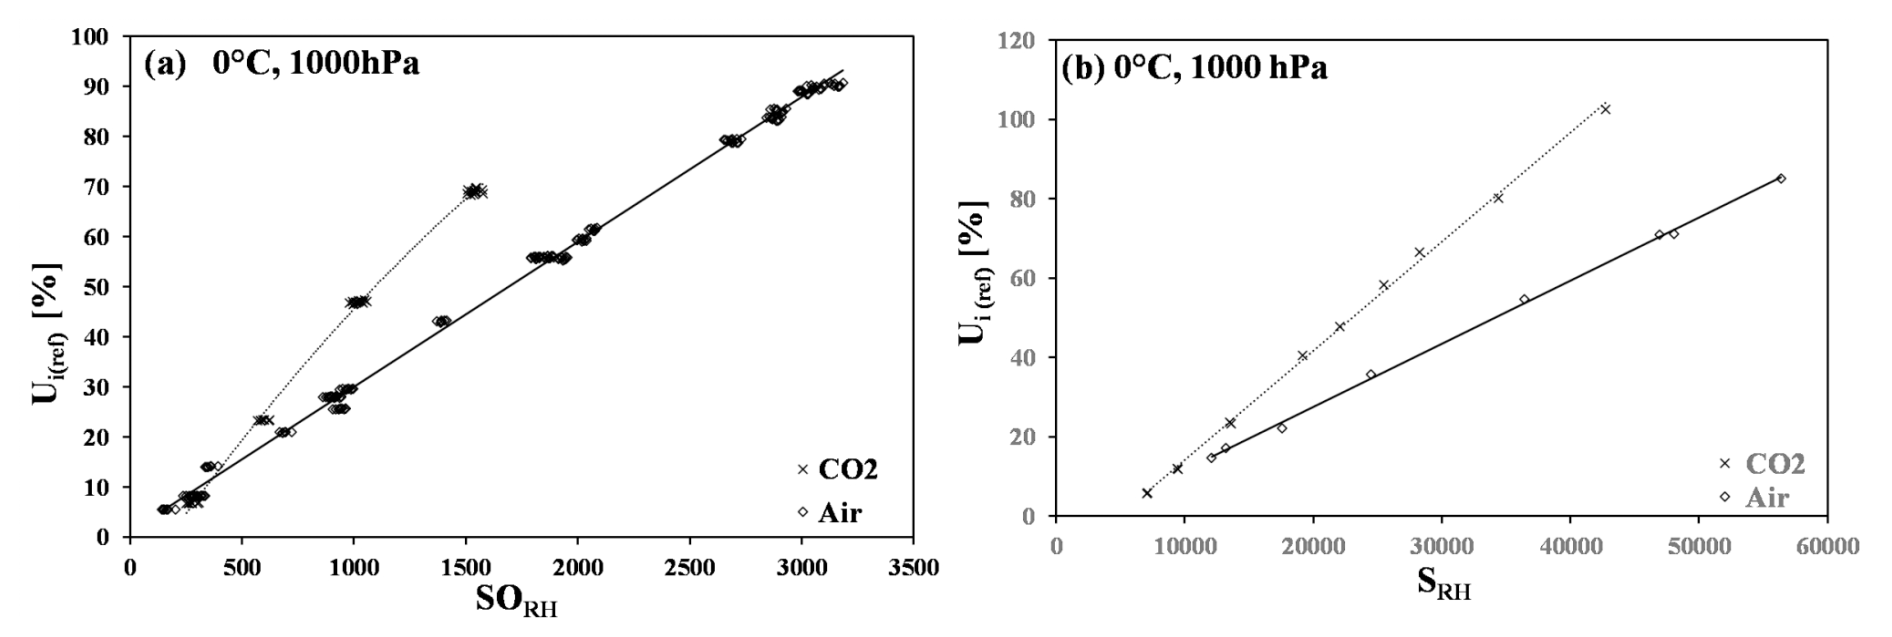
Figure 5Reference humidity as a function of (a) SHT75 raw output values (SORH) (Lorek and Majewski, 2018) and (b) SHT85 raw output values (SRH) at 0 °C and atmospheric pressure with air and CO2.
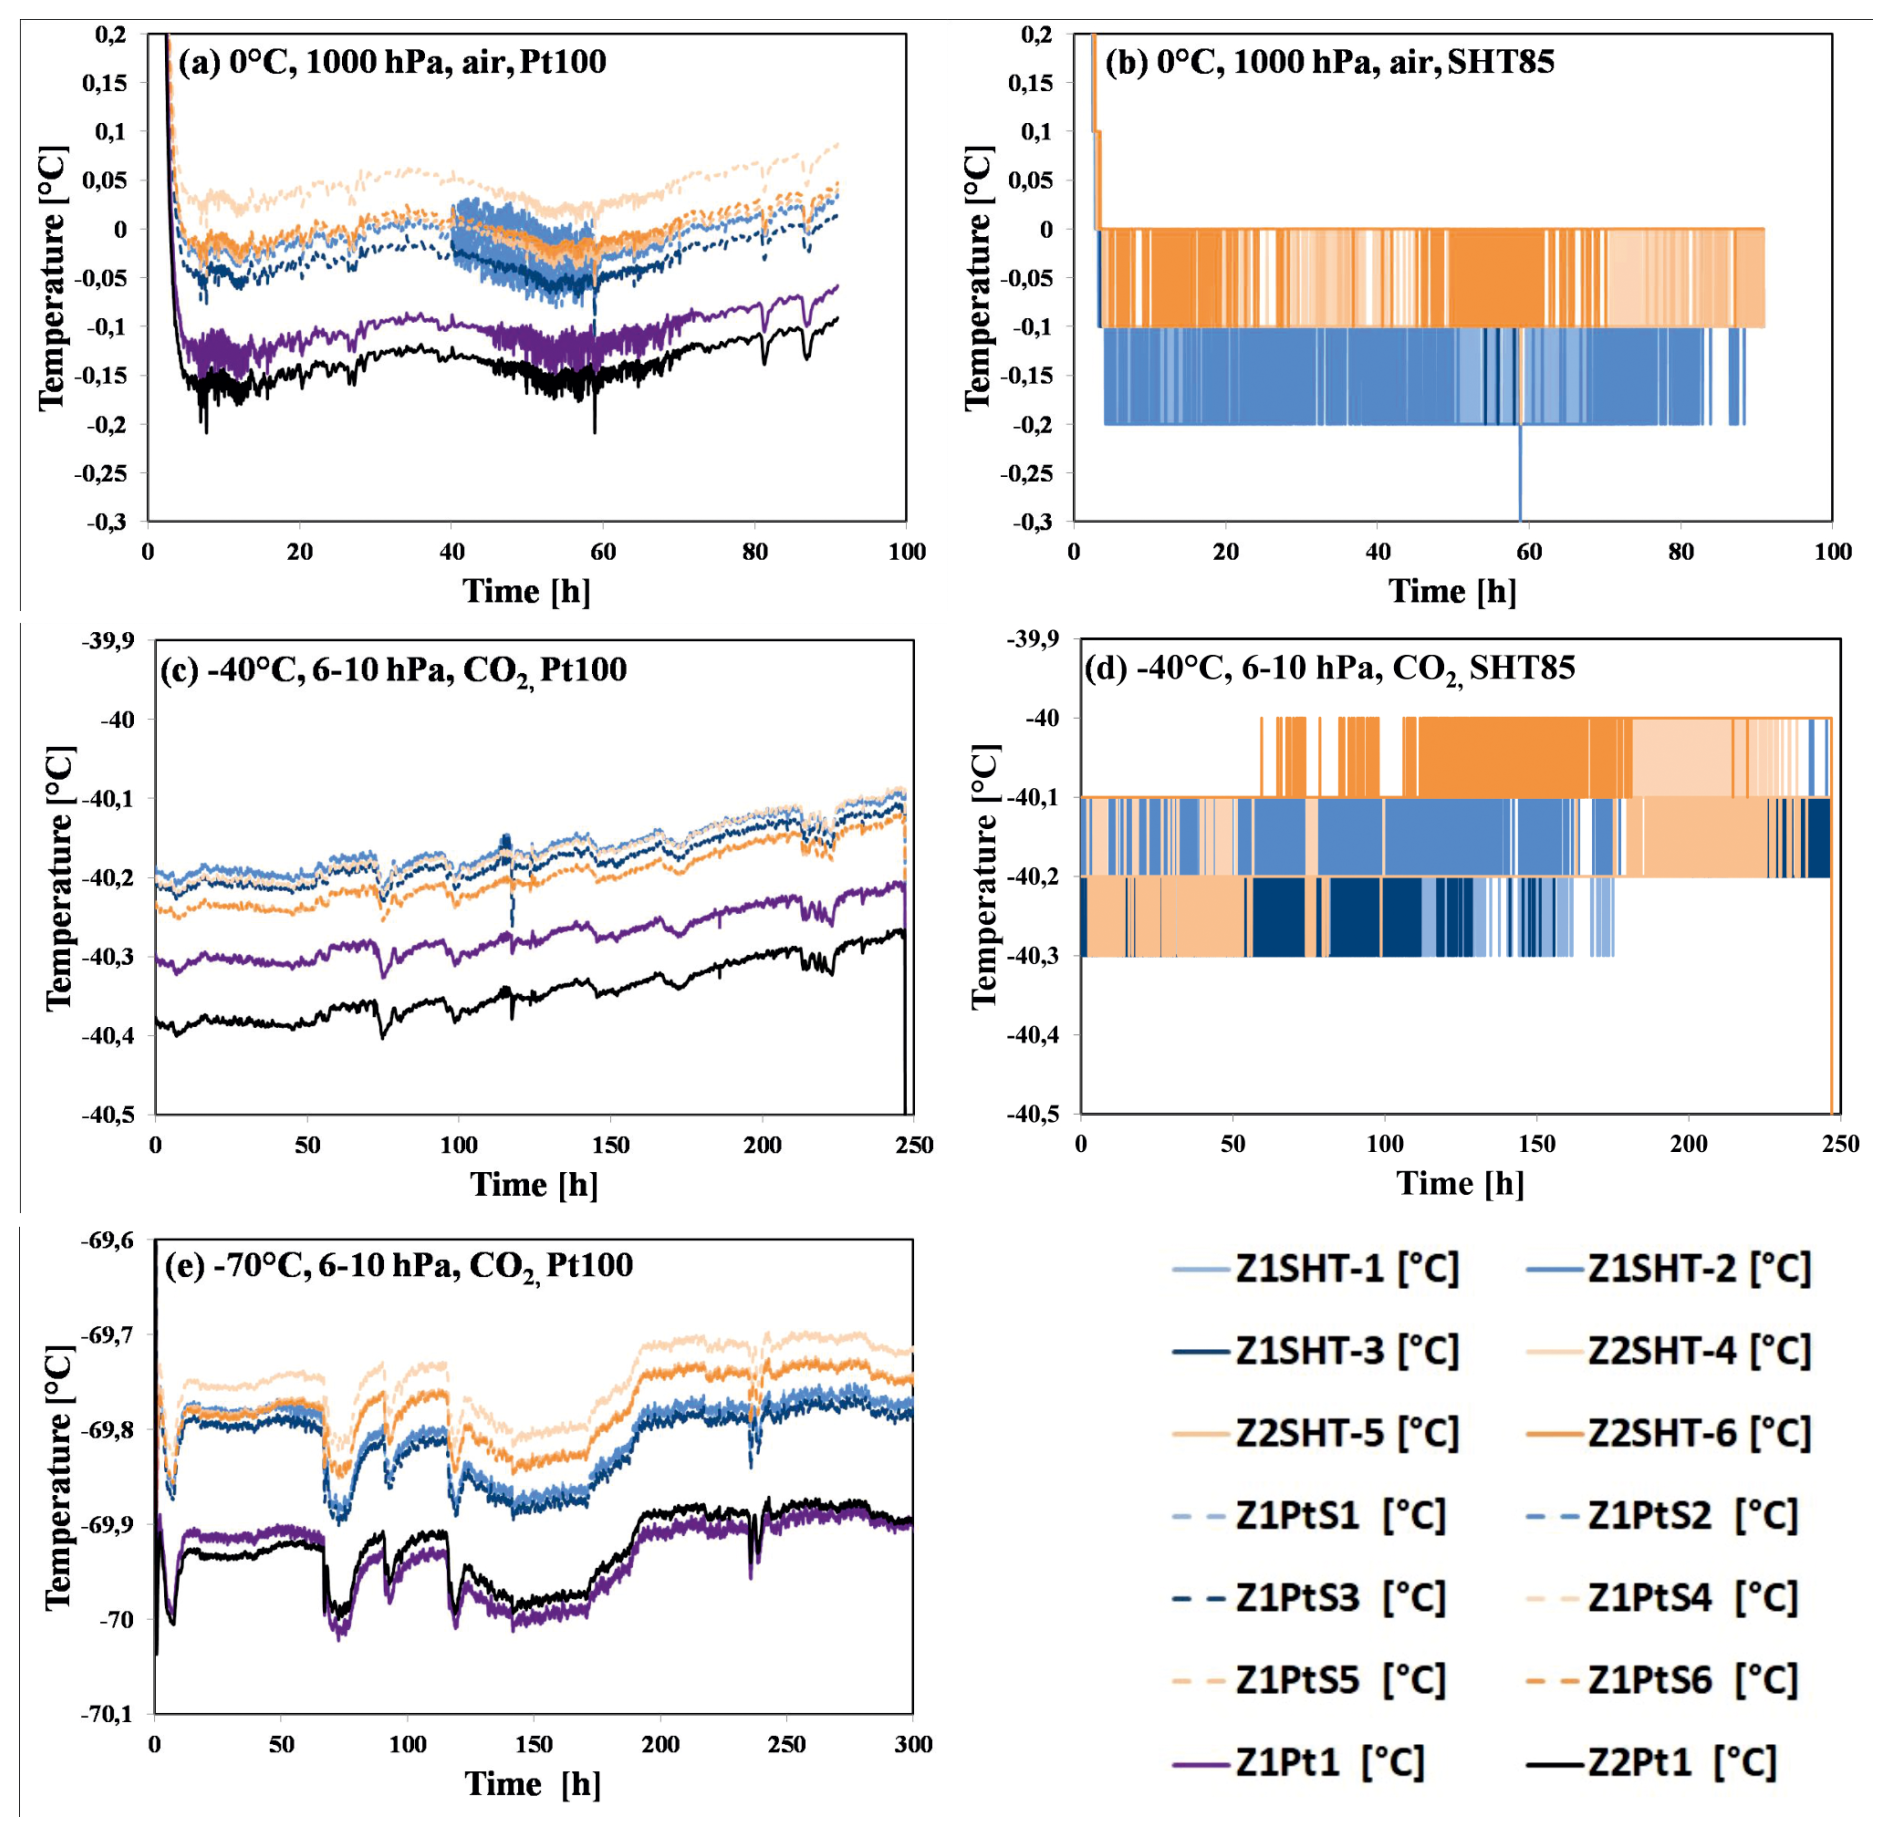
Figure 6(a, c, e) Temperature curves of the adhered Pt100 (Z1PtS1–Z1PtS6) and the free-floating Pt100s (Z1Pt1, Z2Pt1). (b, d) The temperature readout from the SHT85 at different chamber temperatures.
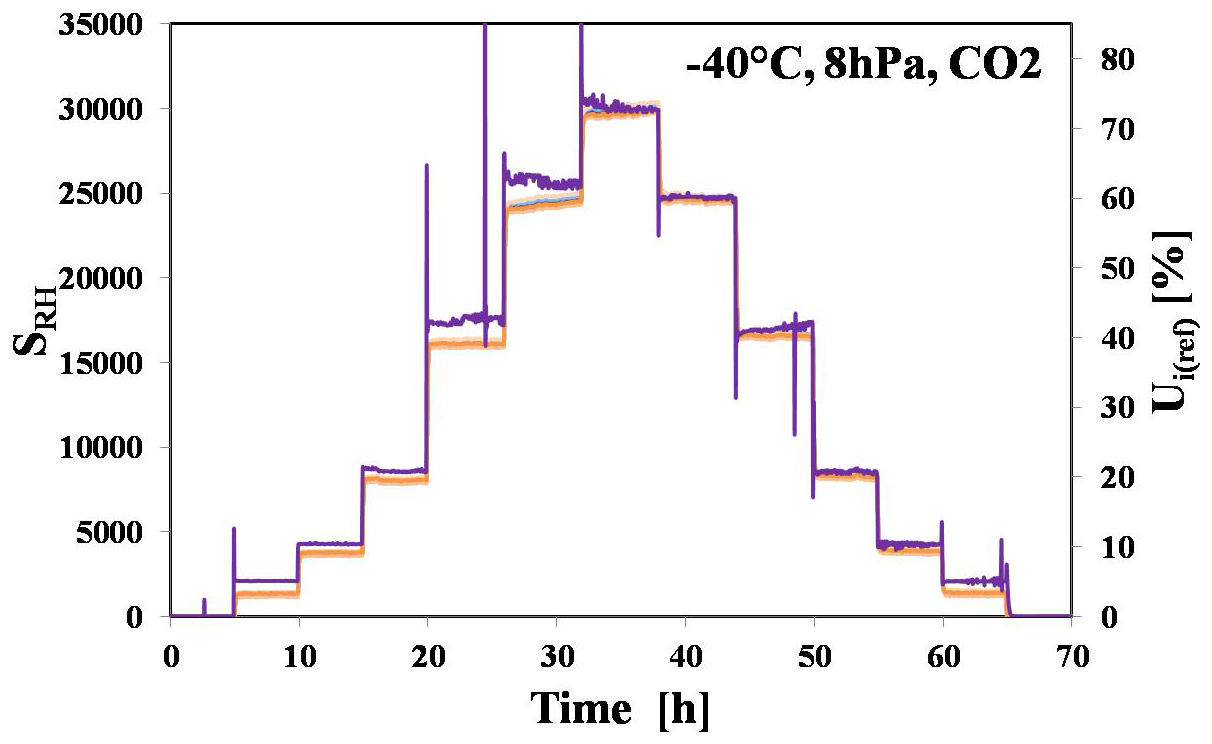
Figure 7A typical experimental run (conditions CO2, −40 °C, 8 hPa): the lilac line is the Ui (ref) values, and other lines represent the SRH values of the six SHT85 sensors.
3.1 Comparison with manufacturer's data of the SHT85 in air
Figure 4 shows the relative humidity of the SHT85 versus the derived relative humidity of the reference system (Ui,w (ref)), which consists of the dew point mirror, the pressure sensor, and the free-standing Pt100. The relative humidity values of the SHT85 (Uw SHT85) are calculated from Eq. (4).
where SRH is the raw digital sensor output of the SHT85.
The error bar for the x axis is ± 1.5 % Uw (SHT85) (Anon, 2021). For the y axis, the estimated error bar is ± 5 % of the measurement value Uw (ref) based on a 2σ error estimate for the CMR 361 pressure sensor of 0.2 % of the measurement value, 0.3 °C of the Pt100, and 0.1 °C of the MBW 373LX dew point mirror.
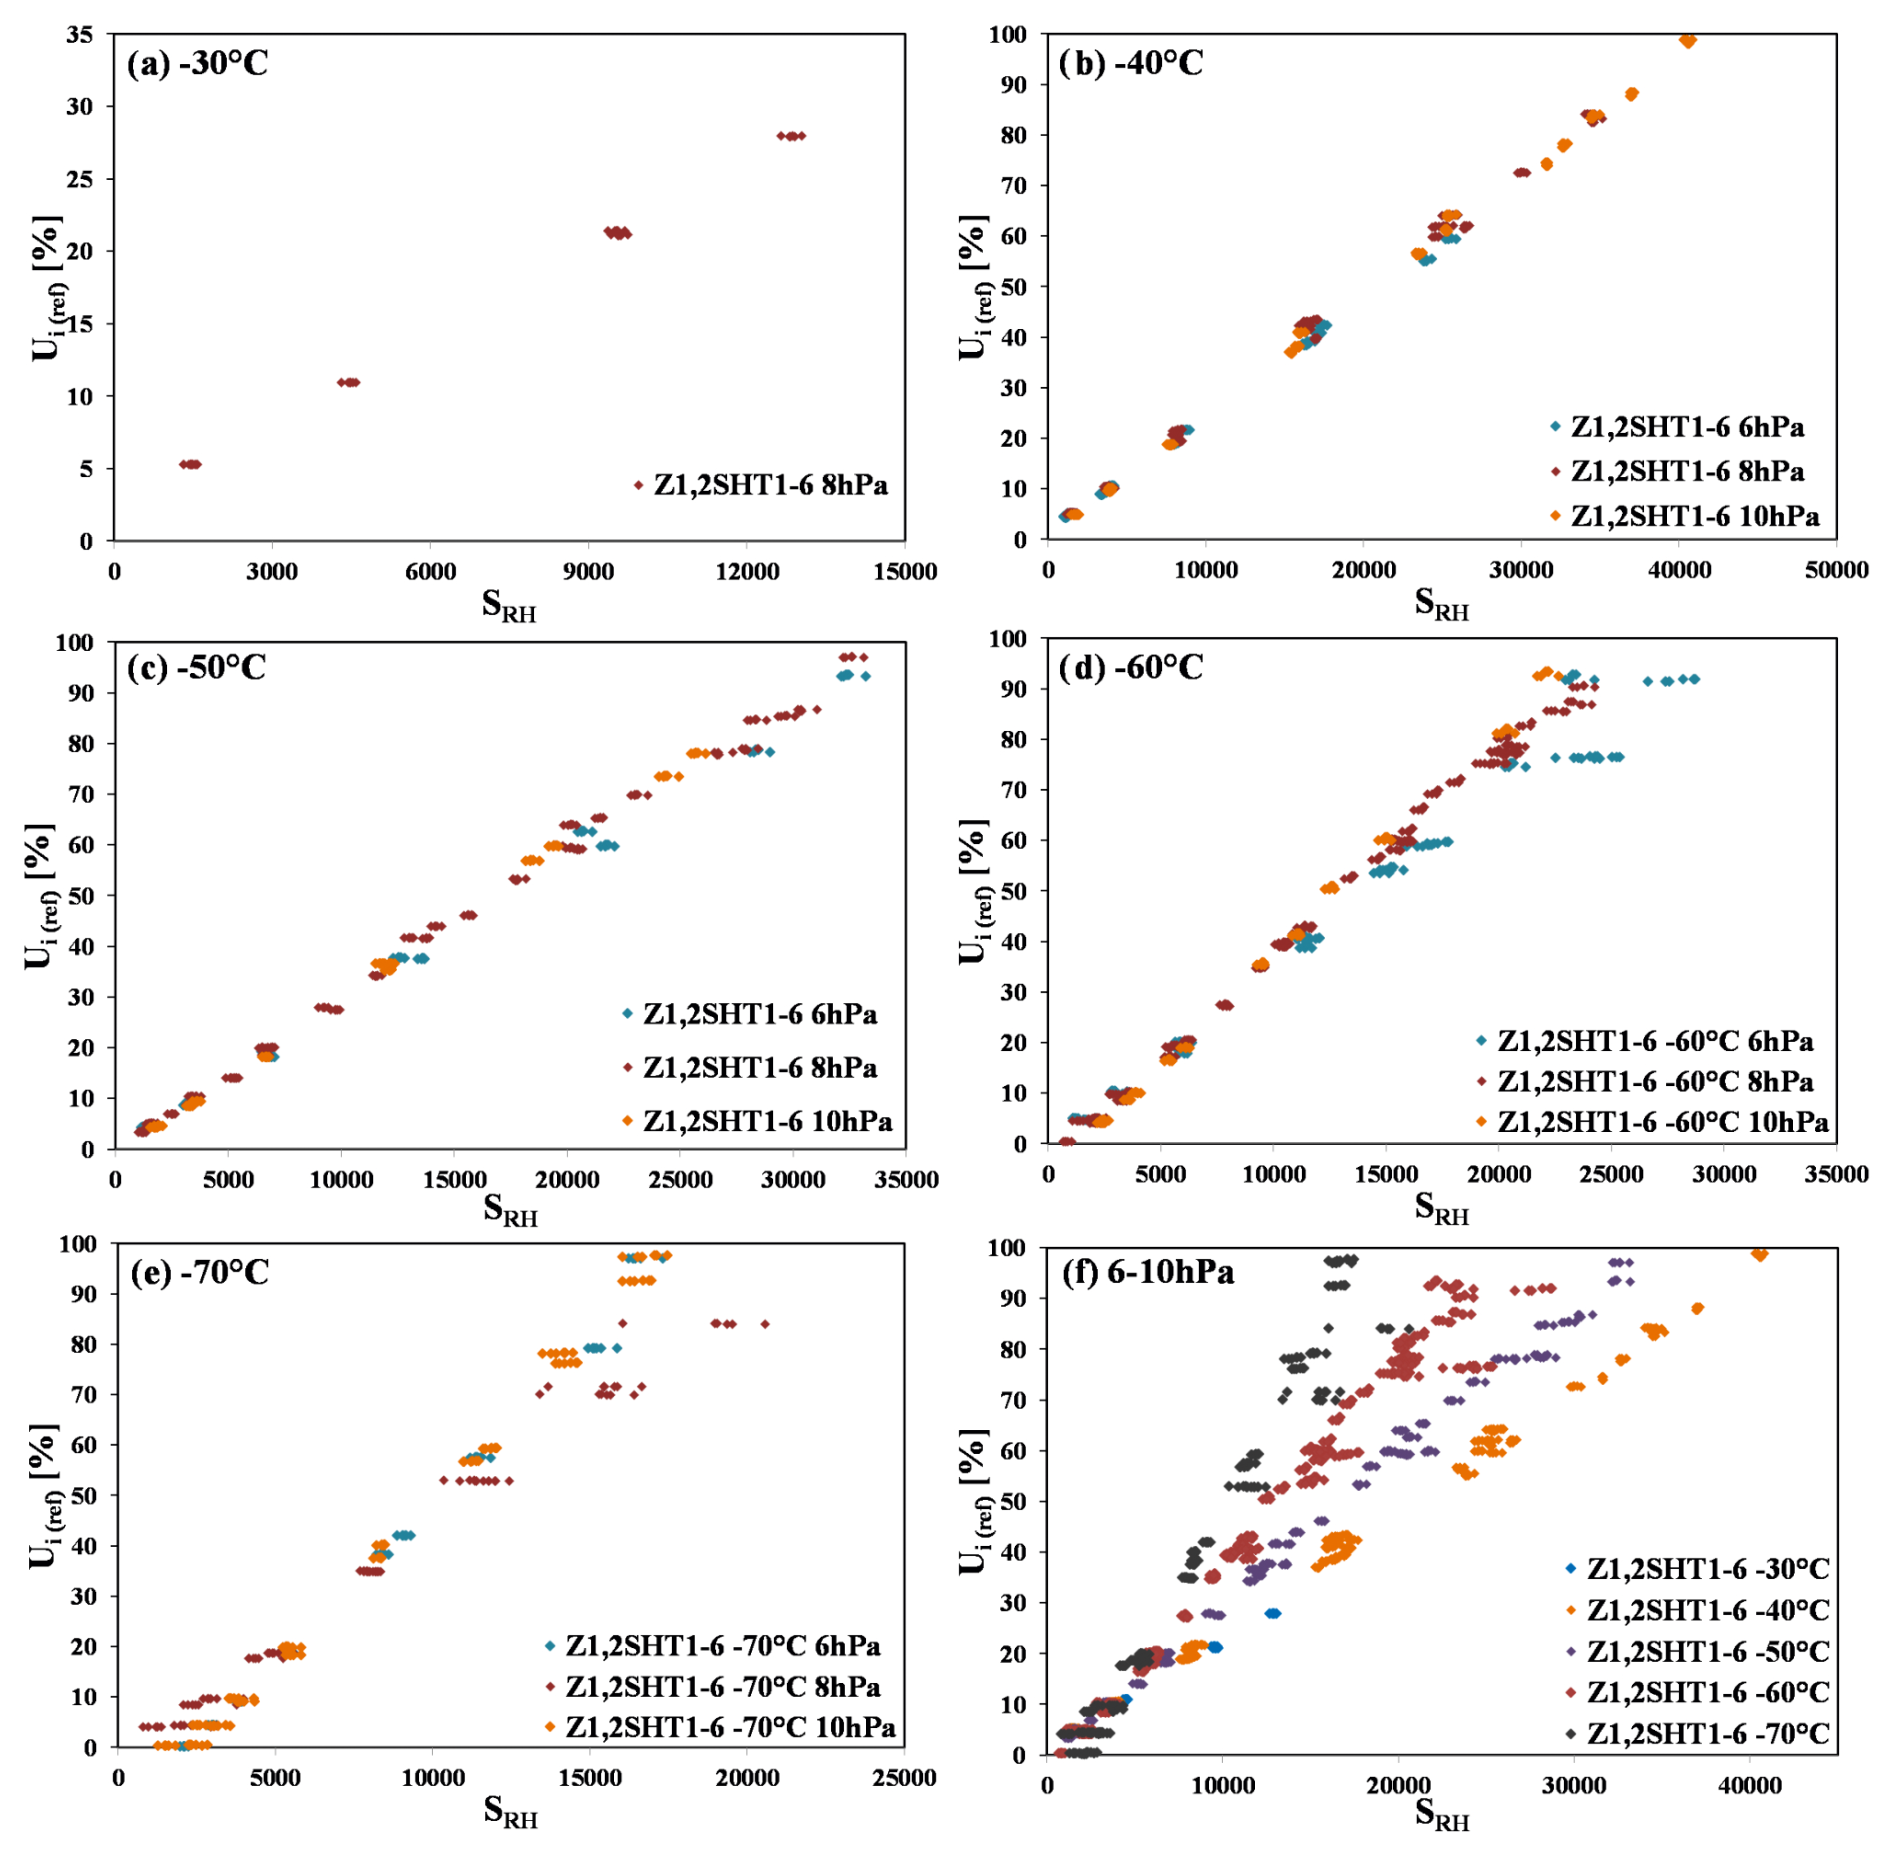
Figure 8(a–e) The independently measured relative humidity, Ui(ref), as a function of the sensor raw output, SRH, at constant temperatures for pressures of 6, 8, and 10 hPa. In (f) all the data are displayed together for temperatures in the range from −30 to −70 °C.
All Uw values from the SHT85 lie, to within the error bars, on the dotted line, which represents a 1:1 agreement of Uw (SHT85) and Uw (ref). This indicates that the adhesion of a Pt100 temperature sensor to the back of the SHT85 does not significantly affect their performance.
3.2 Comparison of the SHT75 and SHT85 data in air and CO2
Comparing Fig. 5a (SHT75 data) with Fig. 5b (SHT85 data), it can be seen that both sensors behave similarly. Both sensors show a strong cross-sensitivity to CO2, whereby the SHT75 in Fig. 5a has a more non-linear calibration function in CO2 compared to the SHT85.
3.3 Comparison of the SHT85 temperature measurement with independent Pt100 measurements
Figure 6 shows the temperature measurements from the SHT85 along with the independent measurement from Pt100 sensors at different temperatures and pressures. The pressures (6, 8, 10, and 1000 hPa) were held stable, whilst temperature was varied stepwise within an experimental run. Figure 6a shows the reaction of the six adhered Pt100s (Z1PtS1–Z2PtS6) and the two free-floating Pt100s (Z1Pt1 and Z2Pt1) (see Table 1 and Fig. 3). The free-floating Z1Pt1 and Z2Pt1 sensors measure a temperature approximately 0.15 °C lower than the adhered Pt100. This lies within the 2σ error of 0.3 °C, similar to the previous observations (Lorek, 2014). The cause for this is probably self-heating of the SHT85. The internal SHT85 temperatures displayed in Fig. 6b show a comparable temperature under the same conditions as Fig. 6a (0 °C, 1000 hPa, air). A similar behaviour (Fig. 6c compared to Fig. 6d) is observable at −40 °C and 6 to 10 hPa in CO2. At −70 °C (Fig. 6e) only the Pt100 values are displayed because the lowest measurable temperature for the SHT85 is −45 °C. In all cases the difference between Z1Pt1 and Z2Pt1 and the adhered Pt100 Z1PtS1–Z2PtS6 is approximately 0.15 °C, which is within the nominal error range quoted by the manufacturers for these sensors.
3.4 Comparison of the SHT85 humidity measurement in CO2 as a function of temperature
The experiments were performed with CO2 in the Martian-relevant pressure range from 6 to 10 hPa. Separate experimental runs were performed for the pressures of 6, 8, and 10 hPa. For each pressure the temperatures −40, −50, −60, and −70 °C (Table 2) were set. For the temperature of −30 °C, measurements were made only at 8 hPa. Figure 7 shows an example for a typical experimental run for the six SHT85 sensors. In this case the conditions were 8 hPa, −40 °C, and CO2.
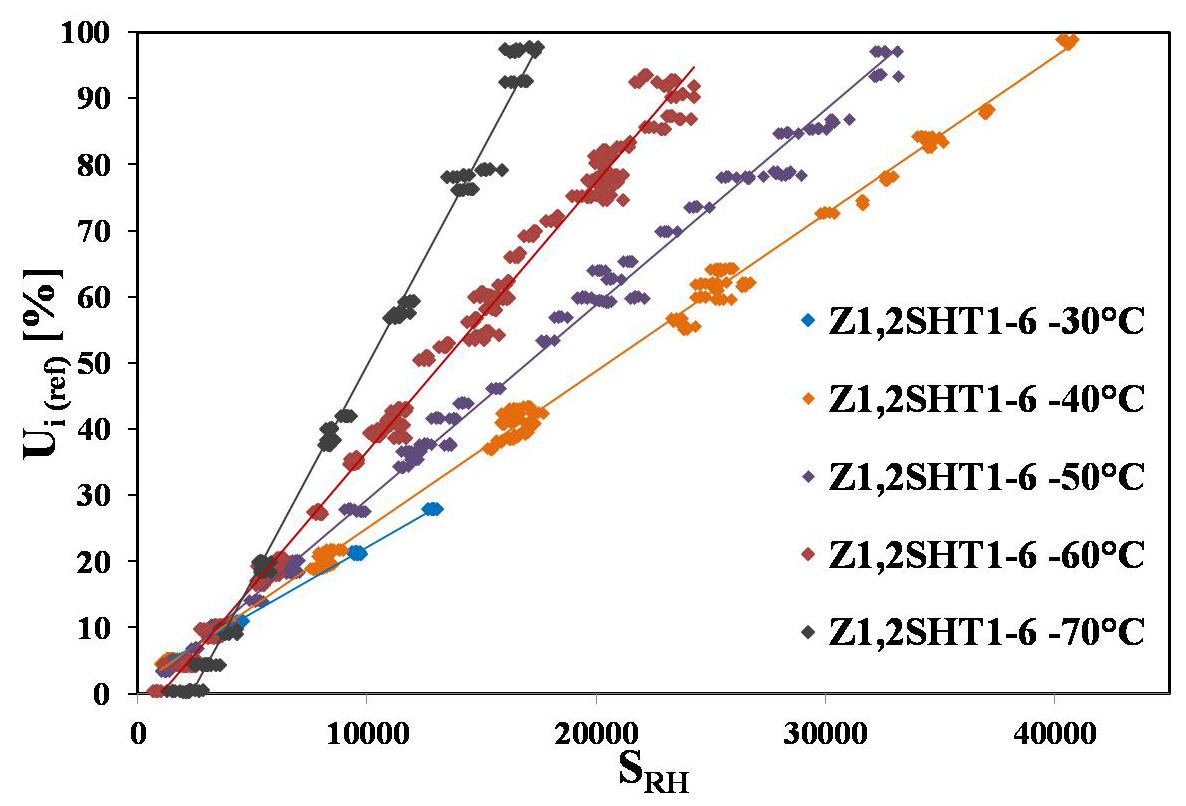
Figure 9The data from Fig. 8f, excluding outliers, with linear regression fits for each temperature.
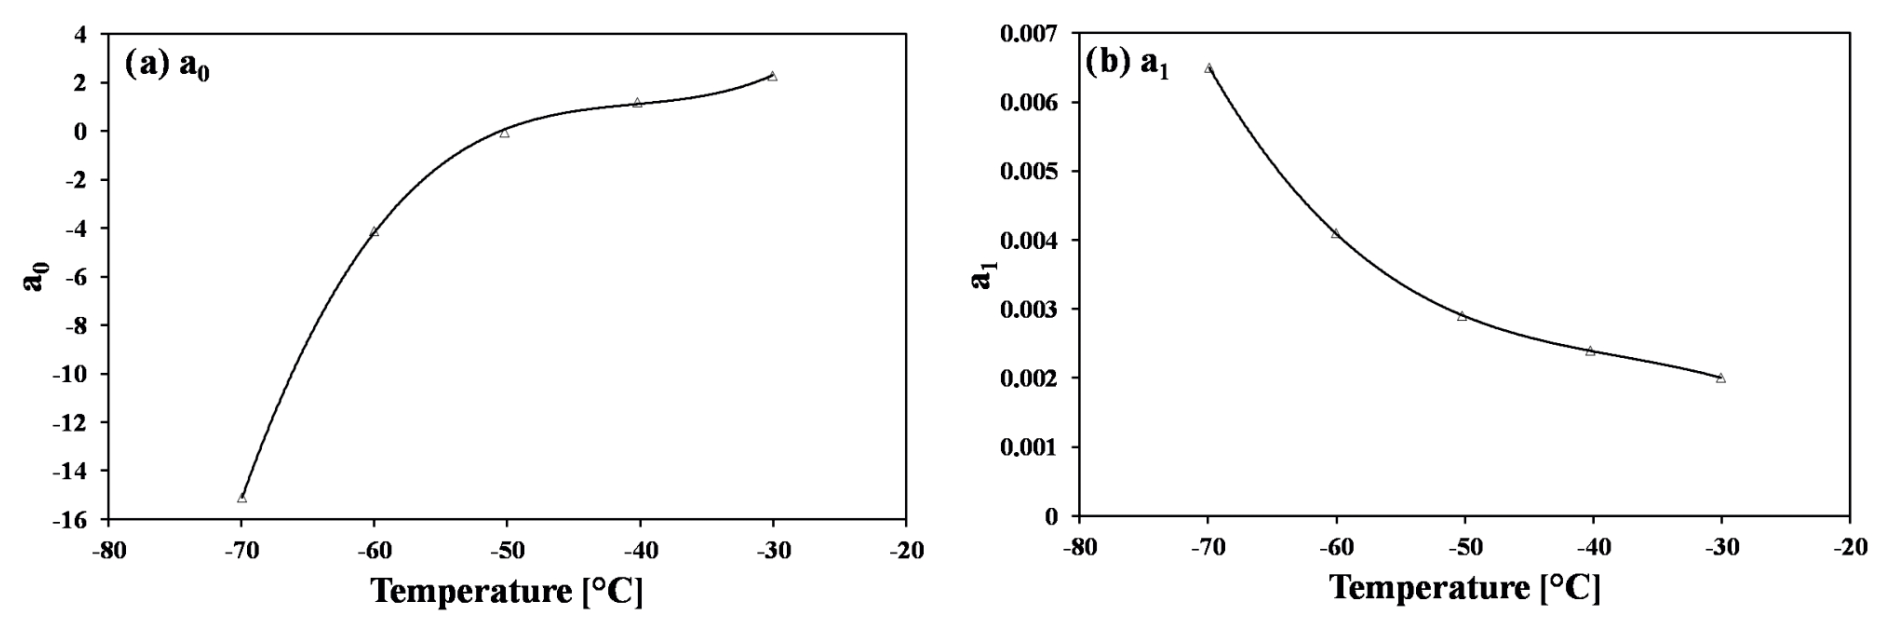
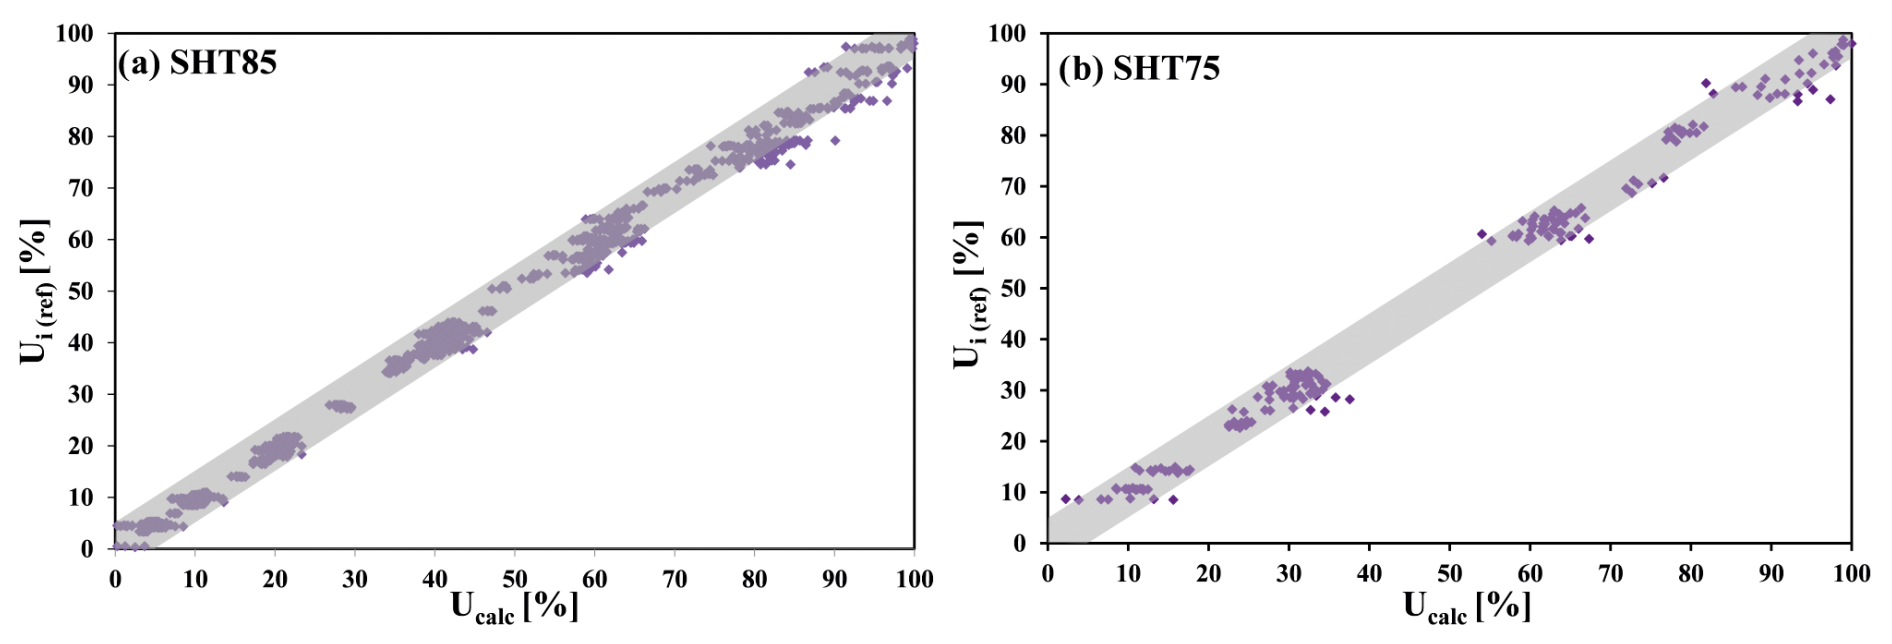
Figure 11(a) All calculated SHT85 values and (b) all calculated SHT75 values replotted from Lorek and Majewski (2018) in relation to the reference values (grey area ± 5 % U for orientation).
Figure 8 shows that the SHT85 sensitivity decreases with temperature, resulting in lower raw output values, SRH, for a given relative humidity. In addition, the scatter of the measured values increases with decreasing temperature. In Fig. 8d there is a spread in the data from the six SHT85 sensors during the 6 hPa run, which is not seen in the data at 8 and 10 hPa. A similar behaviour can be seen in Fig. 8e at 8 hPa, where five of six SHT85 runs are not in line with the other runs at 6 and 10 hPa. The reason for this different behaviour is not clear. The experimental runs exhibiting different behaviour took place at the beginning of new temperature steps at lower temperatures, below −50 °C, as well as at the standard of the new measurement campaigns at different pressures. Although the cause of the deviant behaviour is unclear, it is likely to be due to a time lag in the adaptation of the polymer to new temperature or pressure conditions (desorption of molecules or a phase change from water to ice) or a time lag in the adaption of the electronics inside the SHT85. A significant difference between the investigated pressures of 6, 8, and 10 hPa is not observable, allowing the data to be analysed together (Figs. 8f, 9).
Figure 9 shows the same values as in Fig. 8f with linear regression fits for each temperature. The data showing unexpected behaviour, as discussed above, were excluded from this figure. From the figure the decrease in sensitivity of the sensors with decreasing temperature can clearly be seen. This results in a reduction in resolution with decreasing temperatures which leads to larger uncertainties in the relative humidity. Indeed, the usable temperature range for the SHT85 under Martian-like atmospheric conditions is unlikely to extend much below −80 °C due to decreasing humidity resolution and the associated error in the humidity. With the experimental setup used it was not possible to quantify this limit since temperatures below −70 °C are not possible.
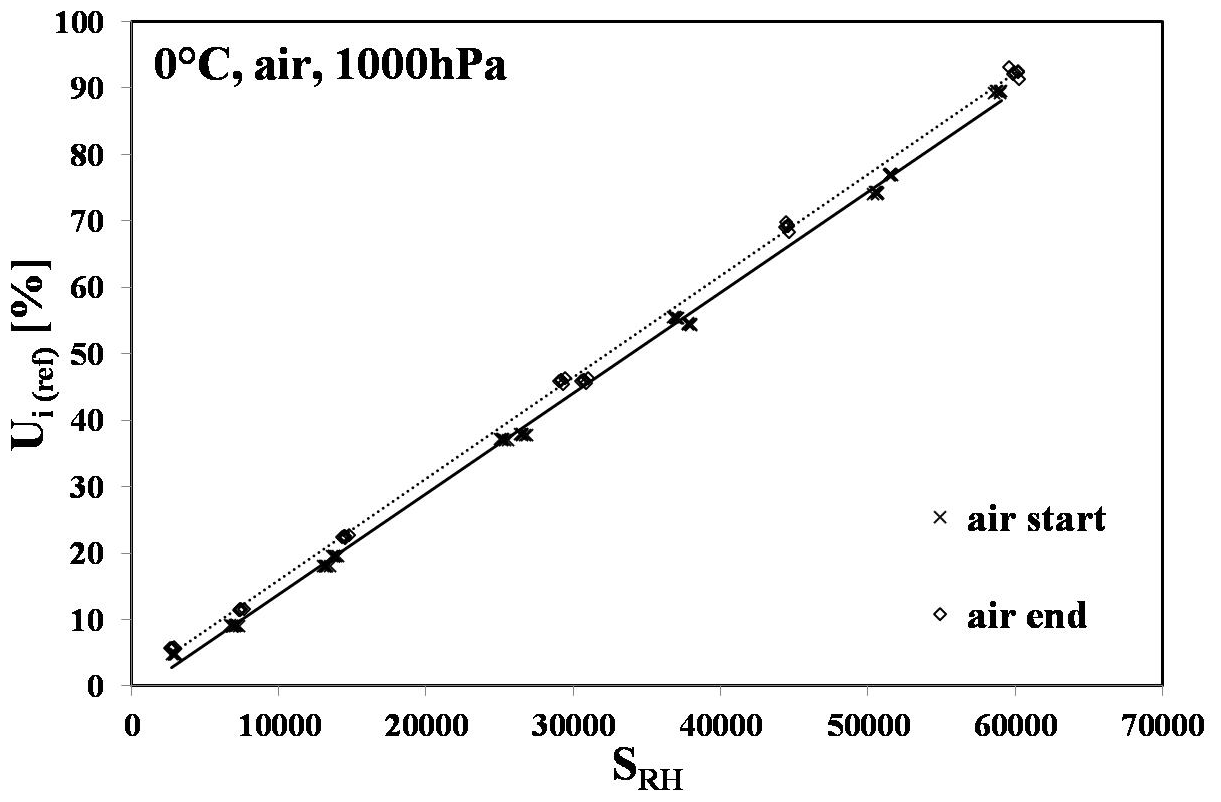
Figure 12Measurement data in air at 0 °C at the start (solid) and the end (dotted) of the experimental campaign.
The equations in Table 3 are written in the following form:
The dependence of the parameters a0 and a1 in relation to the temperature TC (−30 to −70 °C) at pressures of 6 to 10 hPa is given by Eqs. (6) and (7).
Figure 10 shows the fits of a0 and a1. Comparing the fits of a0 and a1 with those calculated for the SHT75 (Lorek and Majewski, 2018), a0 has a different shape, but a1 is similar.
With Eq. (8) the relative humidity (Ucalc) can be determined using the temperature and SRH values for the pressure range from 6–10 hPa. This equation was obtained by inserting Eqs. (6) and (7) into Eq. (5). A similar approach was used in Lorek (2014) and Lorek and Majewski (2018).
Figure 11 shows the results from Eq. (8) applied to the SRH values in Fig. 9 and a comparison with the SHT75 data for 10 hPa based on Fig. 2d and Eqs. (1) and (2), as well as Table 3 from Lorek and Majewski (2018).
With the SHT85 it is possible to make measurements under Martian-like conditions, as was the case with the SHT75 data for 10 hPa (Lorek and Majewski, 2018). In addition, Fig. 11 shows that the SHT85 sensors have a similar uncertainty in Ucalc as the SHT75, with the caveat of a deviation from the expected behaviour at −60 and −70 °C at specific pressures. These outlying data were excluded in Fig. 9 and the fit parameters for Eq. (8). A similar behaviour was not observed during the experiments with SHT75 (Lorek, 2014; Lorek and Majewski, 2018). All six SHT85 sensors survived the experiments under Martian conditions, for a total of 2150 h, and delivered the same calibration curve at the end compared to the beginning of the experiments (Fig. 12).
A measurement campaign was carried out for the SHT85, the new generation of humidity sensor from Sensirion, to test their measurement capability under Martian-like atmospheric conditions: CO2 atmosphere, temperatures in the range from −70 to −30 °C, and pressures in the range from 6–10 mbar. Reference measurements were made with a dew point mirror. The measurement campaign was carried out simultaneously with the calibration campaign of the MEDA HS humidity sensors on the Mars 2020 Perseverance Rover using a parallel but distinct measurement chamber. The measurement campaign follows on from previous tests of the discontinued SHT75 sensor, deployed in the past in experiments under Martian atmospheric conditions at PASLAB, DLR Berlin.
Due to the lower temperature limit of −40 °C for the inbuilt SHT85 temperature sensors, Pt100 sensors were adhered to the back of the SHT85 using a heat-conducting ceramic glue. In addition, a free-floating Pt100 was included in each measurement chamber. The free-floating Pt100s measured temperatures of the order of 0.15 °C lower than the Pt100s adhered to the SHT85, assumed to be due to the self-heating of the humidity sensors. This temperature discrepancy is, however, inside the nominal measurement error in the sensors.
As with the previously characterized SHT75, the SHT85 sensors show a reduced sensitivity when measuring in CO2, resulting in a reduced humidity resolution. A further reduction in sensitivity is observed with reducing temperature, resulting in only around 30 % of the dynamic range of the sensor being used at −70 °C in CO2. No strong pressure dependence was observed in the Martian pressure range from 6–10 mbar. Linear fits were made to the measurements to obtain calibration functions for the SHT85 for each temperature. A temperature-dependent calibration function was determined by fitting third-order polynomials to the linear fit parameters as a function of temperature. The final result is an updated conversion function for the Sensirion SHT85 humidity sensors applicable in a CO2 atmosphere in the pressure range from 6–10 mbar and temperature range from −70 to −30 °C. The sensors can be deployed in this parameter space without being permanently affected and return to normal operation in air after extended periods of use under Martian-like atmospheric conditions.
All raw data can be provided by the corresponding authors upon request.
AL and SG planned the campaign, performed the measurements, and wrote the manuscript draft. AL analysed the data.
The contact author has declared that neither of the authors has any competing interests.
Publisher's note: Copernicus Publications remains neutral with regard to jurisdictional claims made in the text, published maps, institutional affiliations, or any other geographical representation in this paper. While Copernicus Publications makes every effort to include appropriate place names, the final responsibility lies with the authors.
The article processing charges for this open-access publication were covered by the German Aerospace Center (DLR).
This paper was edited by Günter Kargl and reviewed by two anonymous referees.
Anon: Technical Regulations Basic Documents No. 2 Volume I – General Meteorological Standards and Recommended Practices, WMO, 83 pp., https://repository.oceanbestpractices.org/bitstream/handle/11329/111/wmo_49-v1-2012_en.pdf?sequence=1&isAllowed=y (last access: 28 May 2025), 2012.
Anon: Transitioning from SHT7x to SHT85, Sensirion AG, 8 pp., https://sensirion.com/media/documents/EE6A7C63/657ABB2E/HT_Transition_Guide_SHT7x_to_SHT85.pdf (last access: 28 May 2025), 2018.
Anon: Datasheet SHT85, Sensirion AG, 23 pp., https://sensirion.com/media/documents/4B40CEF3/640B2346/Sensirion_Humidity_Sensors_SHT85_Datasheet.pdf (last access: 28 May 2025), 2021.
Gómez-Elvira, J., Armiens, C., Castañer, L., Domínguez, M., Genzer, M., Gómez, F., Haberle, R., Harri, A.-M., Jiménez, V., Kahanpää, H., Kowalski, L., Lepinette, A., Martín, J., Martínez-Frías, J., McEwan, I., Mora, L., Moreno, J., Navarro, S., de Pablo, M. A., Peinado, V., Peña, A., Polkko, J., Ramos, M., Renno, N. O., Ricart, J., Richardson, M., Rodríguez-Manfredi, J., Romeral, J., Sebastián, E., Serrano, J., de la Torre Juárez, M., Torres, J., Torrero, F., Urquí, R., Vázquez, L., Velasco, T., Verdasca, J., Zorzano, M.-P., and Martín-Torres, J.: REMS: The Environmental Sensor Suite for the Mars Science Laboratory Rover, Space Sci. Rev., 170, 583–640, https://doi.org/10.1007/s11214-012-9921-1, 2012.
Hieta, M., Genzer, M., Polkko, J., Jaakonaho, I., Tabandeh, S., Lorek, A., Garland, S., de Vera, J.-P., Fischer, E., Martínez, G. M., Harri, A.-M., Tamppari, L., Haukka, H., Meskanen, M., de la Torre Juárez, M., and Rodriguez Manfredi, J. A.: MEDA HS: Relative humidity sensor for the Mars 2020 Pefrseverance rover, Planet. Space Sci., 223, 105590, https://doi.org/10.1016/j.pss.2022.105590, 2022.
Hieta, M., Jaakonaho, I., Polkko, J., Lorek, A., Garland, S., de Vera, J.-P., Genzer, M., and Harri, A.-M.: Improving relative humidity measurements on Mars: new laboratory calibration measurements, Geosci. Instrum. Method. Data Syst., 13, 337–351, https://doi.org/10.5194/gi-13-337-2024, 2024.
Jensen, L. L., Merrison, J., Hansen, A. A., Mikkelsen, K. A., Kristoffersen, T., Nørnberg, P., Lomstein, B. A., and Finster, K.: A Facility for Long-Term Mars Simulation Experiments: The Mars Environmental Simulation Chamber (MESCH), Astrobiology, 8, 537–548, https://doi.org/10.1089/ast.2006.0092, 2008.
Lorek, A.: Humidity measurement with capacitive humidity sensors between −70 °C and 25 °C in low vacuum, J. Sens. Sens. Syst., 3, 177–185, https://doi.org/10.5194/jsss-3-177-2014, 2014.
Lorek, A. and Majewski, J.: Humidity Measurement in Carbon Dioxide with Capacitive Humidity Sensors at Low Temperature and Pressure, Sensors, 18, 2615, https://doi.org/10.3390/s18082615, 2018.
Lorek, A., Garland, S. P., Baqué, M., and Helbert, J.: THE PLANETARY ANALOG SIMULATION LABORATORY (PASLAB), 55th Lunar and Planetary Science Conference, The Woodlands, Texas, 2 pp., https://www.hou.usra.edu/meetings/lpsc2024/pdf/1319.pdf (last access: 28 May 2025), 2024.
Witte, L., Arnold, G., Bertram, J., Grott, M., Krämer, C., Lorek, A., and Wippermann, T.: A Concept for a Mars Boundary Layer Sounding Balloon: Science Case, Technical Concept and Deployment Risk Analysis, Aerospace, 9, 21, https://doi.org/10.3390/aerospace9030136, 2022.
Zent, A. P., Hecht, M. H., Hudson, T. L., Wood, S. E., and Chevrier, V. F.: A revised calibration function and results for the Phoenix mission TECP relative humidity sensor: Phoenix Humidity Results, J. Geophys. Res.-Planets, 121, 626–651, https://doi.org/10.1002/2015JE004933, 2016.