the Creative Commons Attribution 4.0 License.
the Creative Commons Attribution 4.0 License.
Integration of remote sensing and geographic information systems for geological fault detection on the island of Crete, Greece
Dalal Alshamsi
Fracture systems are of great importance in the field of structural geology. Faults commonly afford easy passage to groundwater and fluids such as hydrothermal fluids and magmas or even contribute to earthquake hazard monitoring. For a geologist, it is not always easy to discern such morphotectonic structures at close range. Both remote sensing techniques and spatial modeling permit the recognition and better understanding of the brittle tectonics in an area. This study was an effort to delineate the tectonic structures on Crete by combining Sentinel-2 satellite data and spatial data. For the enhancement and better discrimination of photolineaments primarily recognized on satellite imagery, a variety of enhancement techniques has been applied. The evaluation of a photolineament as a potential fracture zone was based on several factors: the DEM of the study area, the shaded relief, the slopes and corresponding aspects, the drainage network, the geology and general observations on vegetative coverage appearance. The application of these methods revealed several fracture zones, which we recommend be certified by field investigations. Fault-mapping results may be used for a variety of geological and hydrogeological studies. Indicative places of a large concentration of groundwater are of vital importance for subsequent exploitation by areas of need. The present work may provide useful information for further analysis by geophysicists and seismologists.
- Article
(2307 KB) - Full-text XML
- BibTeX
- EndNote
O' Leary et al. (1976) and Colwell (1983) gave an informative definition of the term lineament. It refers to a mappable, single or composite linear feature of a surface, whose parts are aligned in a rectilinear or slightly curvilinear relationship and which differs distinctly from the pattern of adjacent features and presumably reflects a subsurface phenomenon.
An extensive literature review on the consideration of linear features and lineaments is well presented by Siegal and Gillespie (1980). Suffice it to say here that lineaments identified on aerial photographs and satellite images may represent diverse topographic features (drainage lines), vegetation–soil alignments, coastal lines, crests, ridges, stratigraphic contacts, fold axes (foliation) and seismic zones (Lunkka, 1994).
The importance of detecting lineaments lies in the fact that they often represent fault systems. Faults indicate failure of the crust along a surface, accompanied by the relative movement of the geological units from both sides of that surface (Caumon et al., 2009). Such a zone of structural weakness is a major component in structural geology and may be related to a series of other phenomena. It is noticeable that, in many cases in the past, such a system has been related to seismic events occurring in an area. Locating and identifying the movement is of dual importance to a geologist as the impacts of seismic hazards may endanger lives and involve economic losses (Colwell, 1983).
Furthermore, fault identification is also of economic importance. Faults commonly afford easy passage to several fluids like water, hydrothermal fluids and magmas (Oelkers et al., 2009). Groundwater, on the one hand, can be easily transferred through such channelways, sometimes over large distances, finally reaching and supplying areas of need. On the other hand, mineral entrapping at some time in the past may be of advantageous exploration use (Elhag and Bahrawi, 2014).
In the case of fault detection, the integration of remote sensing and geographic information systems is an issue of great interest. Photolineaments on satellite images do not always account for failure of the crust. They may well represent the drainage lines of the area (rivers), geological boundaries of formations or even cultural features such as roads. The criteria for fault investigation are discussed in several aspects (Greenbaum, 1992; Schulson, 2004).
Vegetation may play a great role in photogeology for it may reveal underlying structural features not easily discerned at close range. As far as fracturing is concerned, attention should be given to the preferential growth of vegetation along linear–curvilinear surfaces (Rodomsky, 2011). The reason for this, as mentioned earlier on, is that fractures often act as a channel for underground water. Water subsequently increases the moisture content of soil and encourages, in one sense, a preferential alignment of vegetation along these fracture zones (Singhal and Gupta, 2010). Moreover, it is not rare to identify on an image (or a photograph) abrupt changes in types of vegetation or even the sudden disappearance of a certain plant species. Particularly in the case in which vegetation varies over a surface underlain by the same type of bedrock, fracturing is implied (Phillips et al., 2008).
Faults, in some cases, may even throw permeable against impermeable rocks. Water again finds ways along the zone of structural weakness and reaches the Earth's surface through numerous springs. At these points, high moisture conditions are particularly favorable to intense vegetation growth (Singhal and Gupta, 2010).
Abrupt changes in slope are commonly associated with brittle tectonics (Agliardi et al., 2001, 2009). Attention should be given to the orientation of slopes with respect to the illumination source. It may have an impact on vegetation and hence confuse the photointerpreter. Singhal et al. (2010) pointed out that this factor may greatly influence the survival of plants and explained that moisture content along the surface of a given slope varies. The parts that are not so well exposed to sunlight retain less moisture than the more illuminated ones and hence a contrast of low- to high-density vegetation growth occurs.
Knowledge of underlying bedrock type is crucial for the processing of a photogeologist's work. Any truncation and displacement of beds may effectively reveal fracturing (Odling et al., 1999). Abrupt changes in geological formations may also indicate fault zones (Stein, 1991). A fault may bring into contact rocks of different petrology and general characteristics that show no physical or inherent association between two formations. In other words, these formations are not expected to be in contact with each other unless fracturing has occurred at some time in the past (Boggs, 2009).
In the case of Crete tectonostratigraphy, it was shown that it has omitted 8–10 km of units above the Mani autochthon (Papanikolaou and Royden, 2007). Therefore, it was crucial to study the tectonic contacts and decipher whether they are thrusts, extensional detachments or even more complex phenomena with opposite kinematic features of primary thrusting followed by later extension (Papanikolaou and Vassilakis, 2010).
This study was an effort to delineate the brittle tectonics of Crete in the Kolymvari area by using spatial models and digital image processing. The satellite image that was initially provided in the laboratory was enhanced by a variety of methods for the better discrimination of photolineaments. Certainly, not all lineaments detected were expected to represent failure of the crust and could be easily confused with roads and rivers. They had to be studied with respect to real-life conditions. Information related to the geomorphology and geology of the region was integrated with the satellite data, and the final evaluation of a certain lineament as a potential fault was carried out.
2.1 Study area
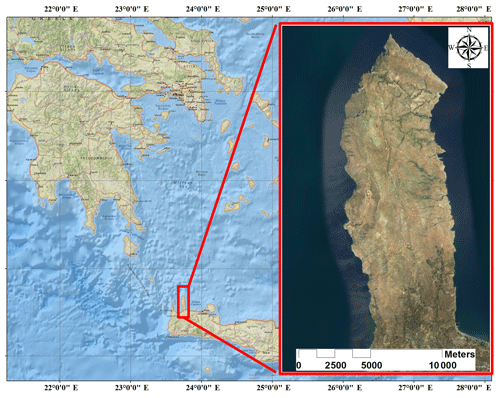
The hydrological basin of the study area is situated in the western part of the island of Crete and is referred to as the Municipality of Kolymvari (Fig. 1). The landscape structure is fundamentally mountainous, resulting in plains only near the coast. The area has a subhumid Mediterranean climate with an annual average temperature of 19.96 ∘C (Elhag and Bahrawi, 2016). The watershed of Kolymvari is mainly an agricultural area where the most common cultivations are olive trees, citrus trees, vineyards and vegetables. The area has also light industrial activities such as olive mills, wineries and other agricultural factories. In the coastal zone of the Keritis watershed, there are many tourism-related activities (Papafilippaki et al., 2007). However, the possible flow paths were all directed to Kolymvari Stream, which is therefore the surface water body (Elhag et al., 2017). Crete has been located at the front of the Hellenic arc since the Oligocene time and still is in the present time (Caputo et al., 2013; Raspini et al., 2013). Moreover, the tectonic movements of the detachment faults indicate opposite slip directions during the Miocene time both to the south and to the north (Chatzipetros et al., 2013; Mountrakis et al., 2013).
2.2 Remote sensing data
The goal of digital image processing was to improve such spectral responses and generate images more interpretable than the original ones in which photolineaments would be better discerned. The digital image of Sentinel-2A (tile number: T34SGE, with 0 % cloud cover), dated 12 March 2018 and covering the pilot area, has been subjected to several enhancement techniques. Sentinel-2 is made of 12 spectral bands with a 10 m resolution of visible bands (VI), 20 m resolution of vegetation red edge (VRE) bands and shortwave infrared (SWIR) bands, in addition to three bands related to coastal aerosols and water vapor with 60 m resolution. There were two basic types of distortions that had to be reckoned with prior to any of the enhancement methods: radiometric distortions and geometric distortions.
2.2.1 Lineament evaluation by RS means
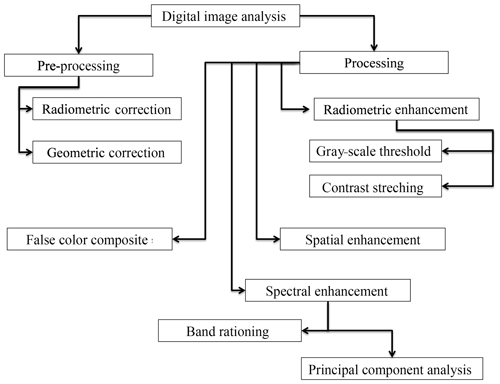
A variety of enhancement methods has been applied to digital raw data in order to improve the spectral characteristics of objects and emphasize the photolineaments of the area under investigation. The original bands have been contrast-stretched for digital numbers (DNs) occupying more gray levels than before, in accordance with their frequency of occurrence. According to Oskoei and Huosheng (2010), isotropic Laplacian, nondirectional convolution filtering and an edge-enhancement technique have been applied to Sentienl-2. Principal component analysis (PCA) aimed to compress information into fewer bands than the original ones, uncorrelated with each other. Images generated by rationing accounted for the real spectral characteristics and physical properties of objects. A schematic flowchart of the implemented procedure in digital image analysis is illustrated in Fig. 2.
For gray-level threshold and contrast stretching, Sentinel-2 B5 has turned out to be the most appropriate one because in this near-infrared channel land areas are highly reflected, whereas water areas are highly absorbed (Elhag, 2017). In 16-bit computer encoding, a digital image can be displayed over a dynamic range of 65 536 gray levels (Lillesand et al., 2014). In many cases, however, only a small portion of these 65 536 levels that are available by devices is utilized. The radiometric ranges (minimum and maximum DN values) in each of the six utilized bands (Sentienl-2 B2–B7) of the original dataset are corrected.
The concept of spatial enhancement is based on a moving window (the so-called kernel window) that, in short, contains an array of weighting factors, moves successively over all the pixels of a single black-and-white image (individual band) and ascribes new weighted DN values as a result of the weighted original ones (Gupta, 2017). A high-pass filter was used in order to emphasize high-frequency features or local spatial detail (Aiazzi et al., 2002). The filter size was 5×5 and was added back to the fourth band of the original band so that low-frequency brightness information was not totally lost.
PCA is a unique mathematical transformation designed to reduce such redundancy in multispectral data (Kaarna et al., 2000). The idea is to compress all the information contained in the n original bands into fewer than N new channels–components (Lillesand et al., 2014).
The high interband correlations (very close to 1) suggested that the best way to proceed with this work was by applying a principal component analysis (Table 1). No pair of bands presented covariance equalling 0; i.e., no pairs of bands were completely independent of each other. Moreover, as covariance >0, data appeared to be positively correlated (Elhag, 2016).
Rationing involves division and more complex functions (additions, subtractions, multiplications) between the DNs of two single bands (Wu et al., 2008). The technique is indicative for both preserving the spectral reflectance characteristics of surficial matter and masking brightness variations derived from illumination conditions and topographic effects (Soulakellis et al., 2006).
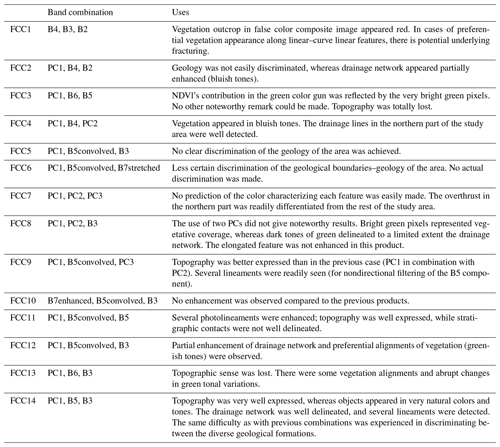
False color composite (FCC), one band at a time, can be displayed in each of the three color guns, generating false color composite images (objects do not appear in their natural colors) that are undoubtedly more interpretable to the human eye than black-and-white images. For the present work several combinations have been tried between original bands, stretched ones, the principal component products and the ratio images (Pohl and Van Genderen, 1998). The scope was to produce an FCC image in which photolineaments would be discriminated to a satisfactory degree for their further digitizing on-screen. Table 2 summaries the band combinations used and their applications.
2.2.2 Lineament evaluation by GIS means
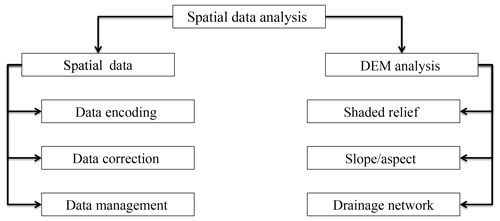
Basically, not all photolineaments detected using remote sensing techniques are represented as fracturing (Karnieli et al., 1996). Cultural features such as roads had to be readily recognizable on satellite data to avoid their confusion with faults and lead to false photointerpretation results. A schematic flowchart of the implemented procedure in spatial image analysis is illustrated in Fig. 3.
3.1 RS lineament evaluation
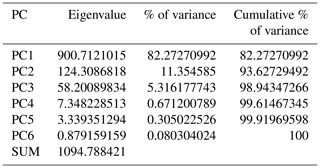
To transform the original data onto the new PC axes, transformation coefficients (eigenvalues, eigenvectors) should be obtained (Johnson and Wichern, 2002). Eigenvalues are presented in Table 3 and describe the variation within the dataset. The percent of total scene variance explained by each PC is given by
where x is .
PC1 contains the largest amount of total scene variance (82.27 %) and hence is the most correlated component with the original bands. PC2, on the other hand, accounts for a smaller amount of the remaining information (11.35 %), PC3 for 5.3 % and so on. The three first PCs account for 98 %, 94 % and 91 % of total scene variance, respectively. As Nikolakopoulos et al. (2008) pointed out, noise is suppressed to the less correlated extracted PCs (Lukáš et al., 2006). Hence, the rest of the principal components (PC4, PC5, PC6) have been ignored.
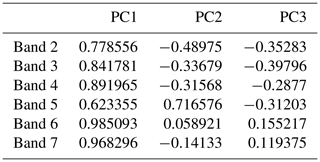
An eigenvector matrix (Table 4) provides us with the loadings or relative contributions of each of the bands to each of the PCs.
PC1 has only positive loadings. That means that in the output image no particular feature or structures are expected to be enhanced. It seems that it is a little bit more correlated with Sentinel-2 B7 in comparison with the rest of the bands. PC1, however, bears many similarities to all six bands and can be used as an image of high quality on its own. It is a weighted product of all input images and reflects in a very good way the albedo and topography of the area.
PC2 is a contrast between the high positive loading of Sentinel-2 B5 and the negative loading of Sentinel-2 B2. Hence, PC2 as a single black-and-white image emphasizes the different sets of features that are sensitive to these bands. More particularly, the spectral responses of the vegetation biomass that is present in the scene (Sentinel-2 B5) contrast with the soil–vegetation differentiations (Sentinel-2 B2).
As far as PC3 is concerned, the output image is of less significance, as no clear discrimination is available. Information related to the correlation between the bands and the extracted PCs is given in Table 5. Factor loadings R were computed in Excel by using the following formula:
where x refers to the xth channel and p to the pth component (Johnson and Wichern, 2002).
The correlation coefficient R extends in a range of −1 to 1. This is nothing more than unit normalization so that loadings are between −1 and 1 (Johnson and Wichern, 2002). The closer the coefficient is to −1 or 1, the more significant the contribution is of a channel to the corresponding PC. Similarly, a loading close to zero is an indication of practically no contribution of a band to the corresponding PC. Thus, PC1 is highly correlated with all bands but mostly Sentinel-2 B6 and Sentinel-2 B7. PC2, on the other hand, is highly correlated with Sentinel-2 B5 and may be used instead of the latter for a color composite image.
For vegetation highly reflected in near infrared and low reflected in visible red, the (Sentinel-2 B4) ∕ (Sentinel-2 B5) ratio generated an image in which vegetation appeared in dark tones. In an analogous way, due to the comparatively high reflectance of vegetation in visible green to the lower reflectance in mid-infrared, vegetation in the (Sentinel-2 B3) ∕ (Sentinel-2 B6) image appeared in light tones. In both ratios, topography has been eliminated and the area gave the impression of being flat. The two images, however, as well as the NDVI product can be safely viewed together for the detection of vegetation biomass. Positive NDVI values correlate with vegetation, while null values correspond to rocks and soil (Johnson and Wichern, 2002).
The (Sentinel-2 B7) + (Sentinel-2 B4) ratio was based on an idea to enhance stratigraphic contacts. That is because Sentinel-2 B7 is important in geology for the discrimination of geologic rock type, while one of Sentinel-2 B4's purposes is the detection of geological boundaries where no particular enhancement was noticeable.
Efforts to use anything other than the Sentinel-2 B2 band in the ratio resulted in negative pixel values and the results could not be used for further analysis. In comparison with the rest of the ratios, the ((Sentinel-2 B2)2+ ( Sentinel-2 B5)2)1∕2 product delineated vegetation amount in a better way, while several lineaments were emphasized.
Edge-enhancement methods resulted in the enhancement of individual bands (black-and-white images) to a satisfactory degree. However, due to the low capability of the human eye to discern the slight spectral responses of objects in gray scaling, the need for multispectral imagery resulted in the creation of false color composite (FCC) products.
A variety of red–green–blue (RGB) combinations has been tested. FCC14, however, appeared to be the most appropriate one for photolineament discrimination. PC1 accounted for topography, whereas R5 reflected the spectral characteristics of vegetation amount (for the Sentinel-2 B5 component of ratio R5). Unfortunately, despite the contribution of Sentinel-2 B7 in the same ratio, stratigraphic contacts were not easily detected except for FCC14 for the area under investigation.
3.2 GIS lineament evaluation
The height values were divided into 15 classes and then coded in colors in order to better highlight the relief. The artificial illumination of a digital elevation model (DEM) was from the northwest direction (315∘) and from 45∘ of altitude. From a statistical point of view, almost one-third of the area is characterized by slopes less than 8.7∘, while only 4.8 % accounts for slopes >43∘. As far as the orientation of slopes is concerned, very few surfaces have a northern–northeastern tendency. The scenery denotes all kinds of slope aspects.
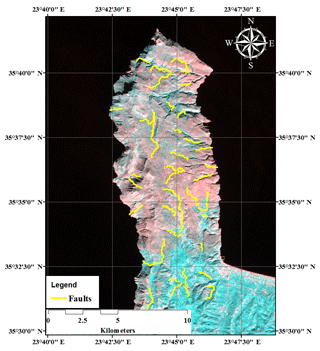
The geology of the area under investigation with the potential tectonics resulted from the integration of enhanced satellite data and spatial information. The corresponding area shows that most of the faults detected on FCC 14 (Fig. 4) have already been mapped, whereas several more apply for field cross-checking. The integration of remote sensing and geographic information systems has proven to be a reliable method of fault mapping to a satisfactory degree. Only at one side of the mainstream do smaller tributaries develop, which is a very good example of such a valley, while the relative displacement of beds at the sides of the streamline confirms the suspicion of underlying fracturing.
A further extended fault zone is recognized in the study area. It is the same feature observed in all cases of digital image enhancement. The streamline following it implies underlying fracturing. A part of this zone has already been mapped. It is clear, though, that the zone extends over a larger area than the one found and mapped during field investigations.
Several more examples reinforced the suspicion of underlying failure, as was initially suspected during photointerpretation, and undoubtedly the drainage network has proven to be an indispensable tool in the evaluation of photolineaments.
The final FCC14 that was used for photolineament detection was composed of PC1, R5 and Sentinel-2 B3 in red, green and blue, respectively. R5, on the other hand, was a complex function between Sentinel-2 B5 and Sentinel-2 B7. Sentinel-2 B5 is widely used for vegetation amount investigations, while Sentinel-2 B7 is very common in the field of geology. Hence, the variant tones of green in FCC14 would normally account for vegetation and/or geology. Since the map of geology of the area was already available in digital form, there was no confusion. In some cases, vegetation alignment could safely reveal underlying structural weakness, whereas in other cases, truncation and displacement of beds were enough for the evaluation of the lineament concerned. Particular attention was paid when a lineament connected to a geological boundary.
In order to evaluate the photolineaments detected on FCC14 as indicators of underlying structural weakness, certain phenomena accompanying fracture zones had to be reckoned with. Spatial models enabled such estimations. Abrupt changes in slope and aspect streamline, sudden bends and straight segments were the criteria used in general terms. Vegetation alignments and drag effects, as were identified during photointerpretation, also applied for a few more lineaments to be recognized. The results of fault detection on FCC14 were by remote sensing and GIS means, and differences between the results derived during this work and conventional fault mapping (during fieldwork) can be noted.
In comparison with the conventional methods of mapping, most of the faults recognized by automated watershed delineation have already been mapped during field investigations. Several of the zones found were not discerned on the FCC14. That was due to certain parameters that one needs to always bear in mind before proceeding with research analogous to that presented here.
Beyond a reasonable doubt, the integration of remote sensing and geographic information systems in the case of fault detection in the designated study area gave satisfactory results. A variety of enhancement techniques resulted in the discrimination of several photolineaments. Cultural features such as roads were immediately extracted so that no confusion would be made with faults. The same was true for drainage lines and geological boundaries, which in many cases were strongly emphasized and could easily result in false identification.
The best combination has proven to be the first principal component (PC1 in red color gun, accounting for 82.27 % of total scene variance), the ratio product R5 = ((Sentinel-2 B5)2+ (Sentinel-2 B7)2)1∕2 and one of the original bands (Sentinel-2 B3). For Sentinel-2 B5's contribution in R5, the spectral characteristics of vegetation amount were emphasized. Hence, the preferential growth of vegetation along linear features suggested in many cases underlying fracturing. Despite Sentinel-2 B7's contribution in the same ratio, the spectral responses of geological formations were not highlighted except for very few cases of apparent displacement of beds. PC1, on the other hand, accounted for the topographic information that was lost due to the ratio contribution.
Spatial modeling was crucial for the evaluation of photolineaments detected on FCC14 (PC1, R5, in Sentinel-2 B3). The digital elevation model of the area under investigation and the derived maps of slope and aspect enabled fracturing to be discerned.
The drainage network has proven to be particularly helpful and informative in terms of underlying structures. Rift valleys and the displacement of river routes were common phenomena within the scene of observation. In many cases parallel vegetation alignments differing from the vegetation outcrop of the surrounding area further assured us about possible failure of the crust. Of course, the analysis was not based on the number of criteria satisfied each time. A fault associated with more criteria than another does not necessarily make it a fracture zone of more significance.
Fault mapping by using satellite data integrated with spatial information may lead to quite noteworthy results. Experience is crucial for an accurate photointerpretation. In this case study, most of the faults that have been mapped in the past during fieldwork investigations were also identified on the satellite image. Some of the photolineaments were discerned but were not readily seen on FCC14. That should be true for all factors explained earlier on. Lastly, for all photolineaments that were identified on the satellite image and raised suspicion of failure of the crust, in situ data collection for verification of the results is strongly recommended in order to be aware of the full tectonics of the area.
Remote sensing data are freely accessed through the European Space Agency website https://www.esa.int/ESA (last access: January 2019).
ME developed the research framework, conducted the field trips and conceptualized the “Results and discussion” section. DA cross-checked the results and helped with paper writing.
The authors declare that they have no conflict of interest.
The authors acknowledge the financial support of United Arab Emirates
University (UAEU) from a National Water Center grant, fund 31R192 (2019). The
authors also thank the Research Office of UAEU for financial support with
publication fees.
Edited by: Francesco Soldovieri
Reviewed by: Nese Yilmaz, George Alexandrakis,
Raffaele Castaldo, and one anonymous referee
Agliardi, F., Crosta, G., and Zanchi, A.: Structural constraints on deep-seated slope deformation kinematics, Eng. Geol., 59, 83–102, 2001.
Agliardi, F., Zanchi, A., and Crosta, G. B.: Tectonic vs. gravitational morphostructures in the central Eastern Alps (Italy): constraints on the recent evolution of the mountain range, Tectonophysics, 474, 250–270, 2009.
Aiazzi, B., Alparone, L., Baronti, S., and Garzelli, A.: Context-driven fusion of high spatial and spectral resolution images based on oversampled multiresolution analysis, IEEE T. Geosci. Remote, 40, 2300–2312, 2002.
Boggs, S.: Petrology of sedimentary rocks, Cambridge University Press, University of Oregon, USA, 2009.
Caputo, R., Chatzipetros, A., Pavlides, S., and Sboras, S.: The Greek Database of Seismogenic Sources (GreDaSS): state-of-the-art for northern Greece, Ann. Geophys., 55, 859–894, 2013.
Caumon, G., Collon-Drouaillet, P., De Veslud, C. L. C., Viseur, S., and Sausse, J.: Surface-based 3-D modeling of geological structures, Math. Geosci., 41, 927–945, 2009.
Chatzipetros, A., Kiratzi, A., Sboras, S., Zouros, N., and Pavlides, S.: Active faulting in the north-eastern Aegean Sea Islands, Tectonophysics, 597, 106–122, 2013.
Colwell, R. N.: Manual of remote sensing, American Society of Photogrammetry, American Society of Photogrammetry, USA, 1983.
Elhag, M.: Evaluation of different soil salinity mapping using remote sensing techniques in arid ecosystems, Saudi Arabia, J. Sensors, 2016, 7596175, https://doi.org/10.1155/2016/7596175, 2016.
Elhag, M.: Consideration of Landsat-8 Spectral Band Combination in Typical Mediterranean Forest Classification in Halkidiki, Greece, Open Geosci., 9, 468–479, 2017.
Elhag, M. and Bahrawi, J. A.: Conservational use of remote sensing techniques for a novel rainwater harvesting in arid environment, Environ. Earth. Sci., 72, 4995–5005, https://doi.org/10.1007/s12665-014-3367-6, 2014.
Elhag, M. and Bahrawi, J. A.: Deliberation of Hilly Areas for Water Harvesting Application in Western Crete, Greece, Global Nest J., 18, 621–629, 2016.
Elhag, M., Bahrawi, J. A., Galal, H. K., Aldhebiani, A., and Al-Ghamdi, A. A.: Stream network pollution by olive oil wastewater risk assessment in Crete, Greece, Environ. Earth. Sci., 76, 278, 2017.
Greenbaum, D.: Structural influences on the occurrence of groundwater in SE Zimbabwe, Geological Society, London, Sp. Pub., 66, 77–85, 1992.
Gupta, R. P.: Remote sensing geology, Springer Verlag GmbH, Germany, 2017.
Johnson, R. A. and Wichern, D.: Multivariate analysis, Wiley Online Library, New York, USA, 2002.
Karnieli, A., Meisels, A., Fisher, L., and Arkin, Y.: Automatic extraction and evaluation of geological linear features from digital remote sensing data using a Hough transform, Photogramm. Eng. Rem. S., 62, 525–531, 1996.
Kaarna, A., Zemcik, P., Kalviainen, H., and Parkkinen, J.: Compression of multispectral remote sensing images using clustering and spectral reduction, IEEE T. Geosci. Remote, 38, 1073–1082, 2000.
Lillesand, T., Kiefer, R. W., and Chipman, J.: Remote sensing and image interpretation, John Wiley & Sons, New York, USA, 2014.
Lukáš, J., Fridrich, J., and Goljan, M.: Detecting digital image forgeries using sensor pattern noise, P. Soc. Photo-Opt. Ins., 60720Y, https://doi.org/10.1117/12.640109, 2006.
Lunkka, J. P.: Sedimentation and Iithostratigraphy of the North Sea Drift and Lowestoft Till Formations in the Coastal cliffs of northeast Norfolk, England, J. Quaternary Sci., 9, 209–233, 1994.
Mountrakis, D., Kilias, A., Pavlaki, A., Fassoulas, C., Thomaidou, E., Papazachos, C., Papaioannou, C., Roumelioti, Z., Benetatos, C., and Vamvakaris, D.: Neotectonic analysis, active stress field and active faults seismic hazard assessment in Western Crete, B. Geol. Soc. Greece, 47, 582–594, 2013.
Nikolakopoulos, K. G., Tsombos, P. I., Skianis, G. A., and Vaiopoulos, D. A.: EO-1 Hyperion and ALI bands simulation to Landat 7 ETM+ bands for mineral mapping in Milos Island, P. Soc. Photo-Opt. Ins., 711010, https://doi.org/10.1117/12.640109, 2008.
O'leary, D., Friedman, J., and Pohn, H.: Lineament, linear, lineation: some proposed new standards for old terms, Geol. Soc. Am. Bull., 87, 1463–1469, 1976.
Odling, N., Gillespie, P., Bourgine, B., Castaing, C., Chiles, J., Christensen, N., Fillion, E., Genter, A., Olsen, C., and Thrane, L.: Variations in fracture system geometry and their implications for fluid flow in fractures hydrocarbon reservoirs, Petrol. Geosci., 5, 373–384, 1999.
Oelkers, E. H., Bénézeth, P., and Pokrovski, G. S.: Thermodynamic databases for water-rock interaction, Rev. Mineral. Geochem., 70, 1–46, 2009.
Oskoei, M. A. and Hu, H.: A survey on edge detection methods, University of Essex, Essex, UK, 2010.
Papafilippaki, A., Gasparatos, D., Haidouti, C., and Stavroulakis, G.: Total and bioavailable forms of Cu, Zn, Pb and Cr in agricultural soils: A study from the hydrological basin of Keritis, Chania, Greece, Global Nest. J., 9, 201–206, 2007.
Papanikolaou, D. and Vassilakis, E.: Thrust faults and extensional detachment faults in Cretan tectono-stratigraphy: implications for Middle Miocene extension, Tectonophysics, 488, 233–247, 2010.
Papanikolaou, D. J. and Royden, L. H.: Disruption of the Hellenic arc: Late Miocene extensional detachment faults and steep Pliocene-Quaternary normal faults – Or what happened at Corinth?, Tectonics, 26, https://doi.org/10.1029/2006TC00200, 2007.
Phillips, J. D., Marion, D. A., and Turkington, A. V.: Pedologic and geomorphic impacts of a tornado blowdown event in a mixed pine-hardwood forest, Catena, 75, 278–287, 2008.
Pohl, C. and Van Genderen, J. L.: Review article multisensor image fusion in remote sensing: concepts, methods and applications, Int. J. Remote Sens., 19, 823–854, 1998.
Raspini, F., Loupasakis, C., Rozos, D., and Moretti, S.: Advanced interpretation of land subsidence by validating multi-interferometric SAR data: the case study of the Anthemountas basin (Northern Greece), Nat. Hazards Earth Syst. Sci., 13, 2425–2440, https://doi.org/10.5194/nhess-13-2425-2013, 2013.
Rodomsky, B. T.: Lava roughness, aridity, and early ecosystem development across a topo-climatic gradient: The 1855–56 Mauna Loa lava flow, Hawaii, University of Hawai'i at Hilo, Hawai'i, USA, 2011.
Schulson, E. M.: Compressive shear faults within arctic sea ice: Fracture on scales large and small, J. Geophys. Res.-Oceans., 109, https://doi.org/10.1029/2003JC002108, 2004.
Siegal, B. S. and Gillespie, A. R.: Remote sensing in geology, Wiley New York, USA, 1980.
Singhal, B. B. S. and Gupta, R. P.: Applied hydrogeology of fractured rocks, Springer Science & Business Media, Springer Verlag GmbH, Germany, 2010.
Soulakellis, N. A., Novak, I. D., Zouros, N., Lowman, P., and Yates, J.: Fusing Landsat-5/TM Imagery and Shaded Relief Maps in Tectonic and Geomorphic Mapping, Photogramm. Eng. Rem. S., 72, 693–700, 2006.
Stein, C. A.: The solid earth: an introduction to global geophysics, Eos, Transactions American Geophysical Union, 72, 427–428, 1991.
Wu, J., Bauer, M. E., Wang, D., and Manson, S. M.: A comparison of illumination geometry-based methods for topographic correction of QuickBird images of an undulant area, ISPRS J. Photogramm., 63, 223–236, 2008.


