the Creative Commons Attribution 4.0 License.
the Creative Commons Attribution 4.0 License.
 | 25 Jan 2023
The land–atmosphere feedback observatory: a new observational approach for characterizing land–atmosphere feedback
Verena Rajtschan
Tobias K. D. Weber
Shehan Morandage
Diego Lange
Syed Saqlain Abbas
Andreas Behrendt
Joachim Ingwersen
Thilo Streck
Volker Wulfmeyer
Important topics in land–atmosphere (L–A) feedback research are water and energy balances and heterogeneities of fluxes at the land surface and in the atmospheric boundary layer (ABL). To target these questions, the Land–Atmosphere Feedback Observatory (LAFO) has been installed in southwestern Germany. The instrumentation allows comprehensive and high-resolution measurements from the bedrock to the lower free troposphere. Grouped into three components, atmosphere, soil and land surface, and vegetation, the LAFO observation strategy aims for simultaneous measurements in all three compartments. For this purpose the LAFO sensor synergy contains lidar systems to measure the atmospheric key variables of humidity, temperature and wind. At the land surface, eddy covariance stations are operated to record the energy distribution of radiation, sensible, latent and ground heat fluxes. Together with a water and temperature sensor network, the soil water content and temperature are monitored in the agricultural investigation area. As for vegetation, crop height, leaf area index and phenological growth stage values are registered.
The observations in LAFO are organized into operational measurements and intensive observation periods (IOPs). Operational measurements aim for long time series datasets to investigate statistics, and we present as an example the correlation between mixing layer height and surface fluxes. The potential of IOPs is demonstrated with a 24 h case study using dynamic and thermodynamic profiles with lidar and a surface layer observation that uses the scanning differential absorption lidar to relate atmospheric humidity patterns to soil water structures.
Both IOPs and long-term observations will provide new insight into exchange processes and their statistics for improving the representation of L–A feedbacks in climate and numerical weather prediction models. The lidar component in particular will support the investigation of coupling to the atmosphere.
- Article
(7327 KB) - Full-text XML
- BibTeX
- EndNote


Land–atmosphere (L–A) feedbacks are the result of interacting processes related to the exchange of momentum, energy and mass in the L–A system. This system consists of the compartments soil, land cover (such as vegetation) and the lower troposphere, encompassing the atmospheric boundary layer (ABL) and the surface layer (SL), including their modifications due to human activities.
A profound understanding and representation of L–A feedbacks contributes to an improvement in the skill of both weather (Holt et al., 2006) and medium-range to sub-seasonal forecasts (Van den Hurk et al., 2012). L–A feedbacks have been identified as one of the key science topics for advancing regional climate simulations (Jacob et al., 2020). Dirmeyer et al. (2018) found clear underrepresentation of the feedback of surface fluxes on boundary layer properties (atmospheric coupling leg) and an overrepresentation of the connection between soil moisture and surface fluxes (terrestrial leg). L–A feedbacks influence the effects of historic, current and future land use and land cover changes (LUCC) on regional hydrology, weather and climate (Davin et al., 2020; Devanand et al., 2020; Stevens et al., 2021). It is of particular importance to understand these interactions over agricultural landscapes in order to maintain high crop yields and food security (Singh et al., 2018; McDermid et al., 2019). L–A feedbacks over agricultural landscapes are also critically important because they modify the impacts of climate change over land (Seneviratne et al., 2006, 2010; Dirmeyer et al., 2012). L–A feedbacks play a very important role in the evolution and strength of heat waves and droughts (Jaeger and Seneviratne, 2011; Zhou et al., 2019a; Miralles et al., 2014, 2019). These extremes are expected to be sensitive to (and amplified by) climate change (Vogel et al., 2017, 2018; IPCC, 2021) and can only be simulated correctly if the feedbacks and reactions of the vegetation due to water and heat stress are well understood (Nolan et al., 2018; Anderegg et al., 2019; Zhou et al., 2019b). Advanced understanding of L–A feedback enables the consideration of bio-geoengineering efforts for mitigating the impacts of climate change (e.g., Davin et al., 2014; Branch and Wulfmeyer, 2019).
At any time and location, the quantities of the variables characterizing the L–A system, such as the soil, canopy, and ABL temperature and moisture values, as well as their fluxes and partitioning at the land surface, are a result of these feedback processes (Santanello et al., 2018; Wulfmeyer et al., 2018; Helbig et al., 2021). With a typical depth ranging from several hundreds of meters during nighttime to several kilometers during the daytime, the convective ABL (CBL) plays a very important role, as it rapidly responds (30–60 min) to changes in land surface properties by vertical mixing (Betts et al., 2004; Ek and Holtslag, 2004). For instance, van Heerwaarden et al. (2009) demonstrated that dry-air entrainment in the CBL increases surface evaporation under all conditions. The strength of the L–A coupling depends on the incoming radiation, the land surface properties and the large-scale synoptic forcing. Therefore, improved understanding of L–A feedbacks requires resolving their diurnal cycle and comprehending how they depend upon large-scale conditions and the evolving land cover over a vegetation period. These interactions become particularly complex when clouds and precipitation develop, feeding back to soil moisture, vegetation photosynthesis and the surface energy balance (e.g., Betts et al., 2007; Gentine et al., 2013; Vilà-Guerau de Arellano et al., 2014; Chen and Dirmeyer, 2017).
To improve the understanding of these feedback processes, observations of energy and water fluxes in the soil and at the land surface are necessary. L–A interactions at the surface are studied globally based on observations using eddy covariance (EC) stations. Many stations are organized into networks, e.g., FLUXNET (Baldocchi et al., 2001), AmeriFlux (Novick et al., 2018), ICOS (Franz et al., 2018) or TERENO (Zacharias et al., 2011), for which long-term datasets are available. Helbig et al. (2021) recently recommended to extend these observational stations with instruments for atmospheric measurements, which will certainly facilitate better understanding of the feedback of the land surface with the ABL and the lower free troposphere.
In addition to ground-based EC stations, remote sensing systems from aircraft or satellites can also observe the land surface. Measurements of atmospheric variables with high temporal and spatial resolutions, however, are even more challenging. Fields of wind, temperature and moisture must be provided at the same time, as these variables are entangled in all standard SL schemes. Recently, a synergy of scanning lidar systems for wind, temperature and water vapor became available that fulfills these measurement needs. Doppler lidar (DL) systems use the coherent detection technique for high-resolution line-of-sight wind measurements. The required range-resolved temperature measurements are realized with temperature rotational Raman lidar (TRL) (Hammann et al., 2015; Behrendt et al., 2015, 2020), and the necessary measurements of the moisture field are provided either from a water vapor Raman lidar (WVRL) (Turner et al., 2002; Wulfmeyer et al., 2010) or from a water vapor differential absorption lidar (WVDIAL) (Wulfmeyer, 1999; Wagner et al., 2013; Wulfmeyer et al., 2016; Muppa et al., 2016; Späth et al., 2016). It was demonstrated that fluxes at the land surface and in the ABL can be measured. Tests of model parameterizations against lidar observations were executed by Milovac et al. (2016) and Muppa et al. (2016).
In 2017, the Land–Atmosphere Feedback Experiment (LAFE, Wulfmeyer et al., 2018) was, to the best of our knowledge, the first dedicated experiment to investigate L–A feedback with the deployment of a novel scanning lidar synergy. It took place at the ARM Southern Great Plains site in Oklahoma, USA, and complemented the existing suit of instruments with a combination of Doppler lidars, Raman lidars and differential absorption lidars to measure the wind velocity, humidity and temperature from the land surface through the ABL and up to the lower troposphere (Späth et al., 2022a). Operating scanning lidars were the key to obtaining measurements in the surface layer region to overcome the near-range gap of vertical-pointing lidars that deliver no data within the surface layer (Späth et al., 2022a).
The campaign-based observations are time limited and thus allow only a few meteorological situations to be captured. For statistically significant results and robust conclusions, long-term observations are required. For this reason, the Land–Atmosphere Feedback Observatory (LAFO) was set up as a research facility at the University of Hohenheim (UHOH) in southwestern Germany. The measurement data are comprehensive, highly resolved and very precise, meaning that new parameterizations of land–atmosphere exchange processes between soil, vegetation and the lower troposphere can be developed, implemented, and tested (e.g., the applicability of the Monin–Obukhov similarity theory, MOST, for natural heterogeneous terrain). The design and operation of LAFO is connected to an international project of the World Climate Research Program (WCRP) within the Global Land/Atmosphere System Study (GLASS) panel (see https://www.gewex.org/panels/global-landatmosphere-system-study-panel/, last access: 19 January 2023) named the Global Energy and Water Exchanges (GEWEX) LAFO (GLAFO, Wulfmeyer et al., 2020).
The overarching scientific goal of LAFO is to explore the L–A feedback with a novel synergy of energy balance and eddy covariance stations, soil and vegetation measurements, and scanning lidar systems. LAFO is a platform to bring together existing and unique instruments to seek observations of the soil, the land surface, the vegetation and the lower troposphere simultaneously.
To achieve the overarching goal, LAFO follows three scientific objectives:
-
determining the water and energy balances and the land–atmosphere feedback as a function of the conditions of the soil, vegetation, and atmosphere in a study region with agricultural fields;
-
investigating the heterogeneity of the fluxes at the land surface and in the boundary layer;
-
developing new parameterizations of the fluxes at the land surface taking into account the vegetation dynamics and the turbulence in the ABL.
The LAFO measurement design follows the LAFE instrumentation and benefits from previous projects, e.g., the research unit “Agricultural Landscapes under Global Climate Change – Processes and Feedbacks on a Regional Scale” of the German research foundation, using the existing long-term and ongoing EC observations in Kraichgau and the Swabian Jura area, southwestern Germany (Wizemann et al., 2015; Weber et al., 2022). This project also contained the Surface–Atmosphere–Boundary–Layer Exchange (SABLE) field campaign to test lidar observations in the surface layer (Späth et al., 2016). Both the LAFE and the new LAFO design with their instrument synergies have already made important contributions to this. By comparing observations to models, (e.g., MOST) natural heterogeneous land surfaces can be investigated or new model parameterizations can be developed (Lee et al., 2019; Lee and Buban, 2020; Späth et al., 2022a).
This paper presents LAFO and is structured in the following manner: the observation strategy of the LAFO setup with the study area and its sensor synergy is presented in Sect. 2, the instrumentation is presented in Sect. 3, and measurement examples are presented in Sect. 4. Finally, we summarize and give an outlook on future developments.
To accomplish our LAFO objectives, we aim for a synergistic sensor network to simultaneously monitor a wide variety of system properties and state variables from the bedrock to the lower free troposphere. The sensor synergy consists of the three components: (1) atmospheric measurements, (2) land surface measurements and (3) vegetation measurements. The interactions between the components are depicted in Fig. 1, and the measured variables are listed in Table 1. The observations illustrated in Fig. 1 show the envisioned full suite of instrumentation for the full extent of observations to study L–A feedbacks as proposed by the GLASS panel. To observe the ABL and the interfacial layer, the combination of scanning lidars plays an important role in capturing the relevant variables with the required resolution to resolve the processes. In the surface layer, EC stations with 2 and 10 m measurement levels with several meteorological measurements can be complemented by temperature sensing along optical fibers (FODS) and low-elevation scanning lidar. In the sub-surface and soil regime, measurements of soil moisture, temperature, and matric potential and their profiles are important variables. Here several hydrological observations complement the information to characterize soil properties. The evapotranspiration of soil and vegetation can be sampled with the eddy covariance method or lysimeters. Further measurements, such as sap flow or other vegetation-characterizing measurements, are helpful to determine the contributions of soil and vegetation. It is noted that some depicted measurements can be obtained continuously and perhaps be automated while others are obtained better during field experiments and intensive observation periods (IOPs).
Table 1Measured variables with the LAFO sensor synergy. Instruments in bold are operated continuously. For these instruments we also give the temporal and spatial resolutions; otherwise we refer to the instrument descriptions in Sect. 3 and the corresponding references. RHI scan refers to the range height indicator scanning operation to measure vertical cross sections.

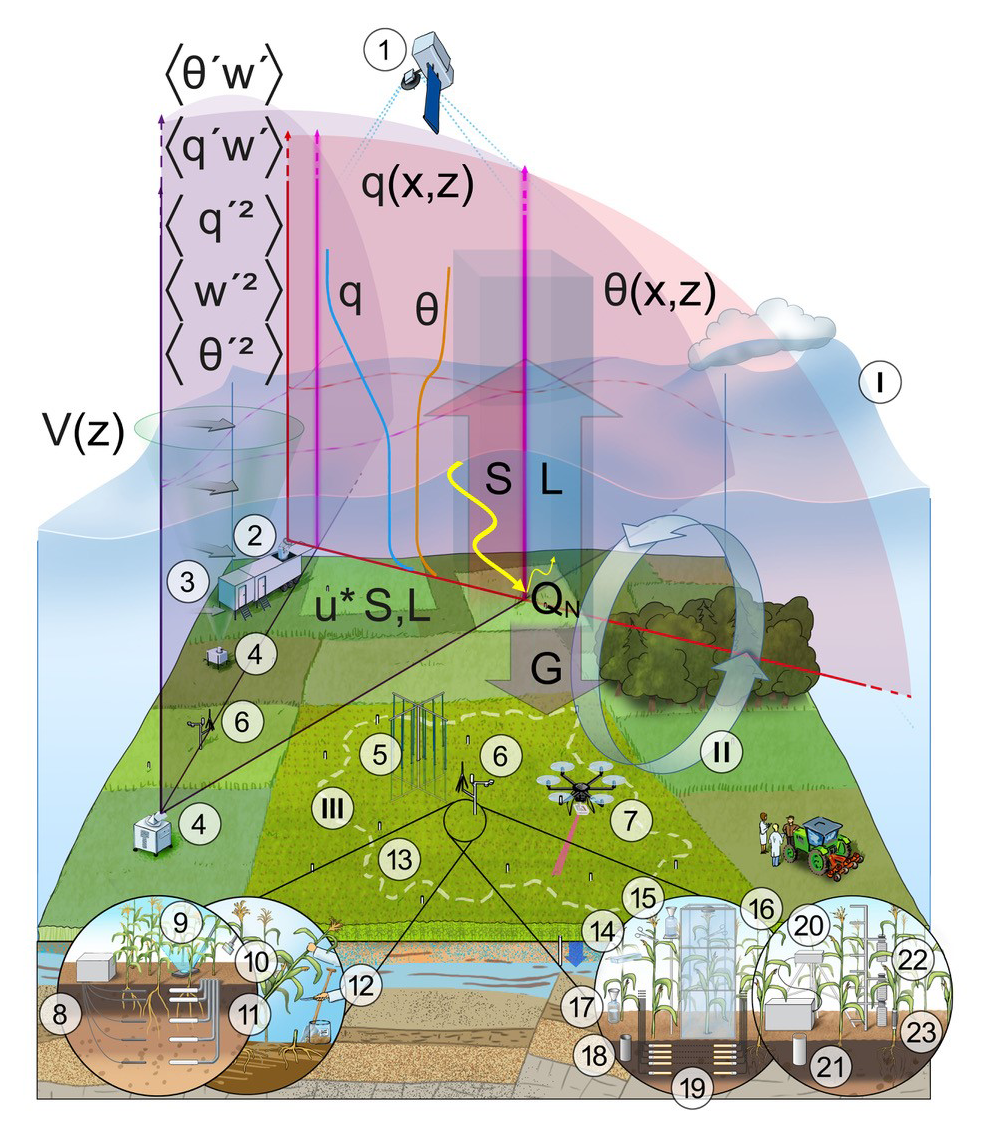
Figure 1LAFO sensor synergy with the following elements labeled: (I) planetary boundary layer top; (II) mesoscale vortex; (III) flux footprint; (1) satellite remote sensing; (2, 3, 4) vertically pointing and scanning Doppler, water vapor, and temperature lidar systems; (5) 3D fiber optic distributed temperature sensing (FODS) in combination with distributed wind and trace gas sensors; (6) energy balance and eddy covariance stations; (7) uncrewed aerial vehicle (UAV); (8) time domain reflectometers (TDRs); (9) leaf area index (LAI) measurement; (10) gas exchange system for photosynthesis and transpiration rate measurements; (11) tensiometers; (12) in situ crop measurements, such as root and shoot biomass, as well as canopy height; (13) soil moisture, temperature, and matric potential network; (14) leaf cuvette; (15) open rainfall sampler; (16) gas exchange chamber; (17) throughfall sampler; (18) groundwater well; (19) in situ soil water probes (14–19 are all coupled to a water isotope analyzer); (20) IR gas analyzer; (21) mini lysimeter; (22) canopy temperature, water vapor, and CO2 profiles; and (23) sap flow sensors. For further explanations, see the GEWEX website (https://www.gewex.org/panels/global-landatmosphere-system-study-panel/glass-projects/, last access: 19 January 2023) and Wulfmeyer et al. (2020).
In the following, we explain the target variables and introduce the sensor synergy and our experimental site. The available and operated instruments in LAFO are described in Sect. 3.
2.1 Targeted variables
The key atmospheric variables of absolute humidity q, temperature θ, and turbulent fluctuations in the vertical wind w are captured with resolutions of 1–10 s in time and 30–60 m in space. The same holds true for the byproducts of aerosol particle backscatter and the extinction coefficient (βpar, αpar) and their optical thickness (τpar), as well as the instantaneous boundary layer height zi(t). Furthermore, horizontal wind profile U(z) and potential properties like the atmospheric optical thickness τC can be retrieved. The combination of these variables delivers the following values: the dissipation of the turbulent kinetic energy (TKE) ε; profiles of the latent and sensible heat fluxes , and their variances , , and ; mixed terms of higher orders like ; and the molecular destruction rate of humidity and temperature εq and εθ (Wulfmeyer et al., 2016), which are fundamental for budget analyses. Uncertainties of these variables are separated into atmospheric variance and instrumental noise using the autocovariance method described in Lenschow et al. (2000), Turner et al. (2014), and Wulfmeyer et al. (2016). The shear velocity (u*); the surface latent and sensible heat fluxes (L0 and S0); and the convective scales of vertical wind, humidity, and temperature (w*, q*, and θ*) are determined by combining the scanning lidars with MOST (Späth et al., 2022a) or EC station measurements with MOST (Wulfmeyer et al., 2022).
To study vegetation status and spatial pattern in standing crops we will record information about biomass, plant height zp, plant density ρP, plant humidity content qP, skin temperature TS of bare soil, normalized difference vegetation index (NDVI), leaf area index (LAI) and nitrogen supply (red edge inflection point, REIP). The vegetation development status is registered according to the BBCH scale (Biologische Bundesanstalt für Land- und Forstwirtschaft, Bundessortenamt und Chemische Industrie; Meier, 2018). The temporal dynamics and spatial configuration of the vegetation state is characterized routinely by LAI measurements, and management data are provided by the field index cards of the agricultural plots. For the sub-surface characterization of root growth dynamics, root density distribution, and root water uptake at various soil depths, additional field campaigns can be applied to complete the full picture.
The Water and Temperature Sensor Network (WaTSeN) monitors the spatial variability of soil water content q(−z) and soil temperature θ(−z) at 40 cm depth. We cover an area of 0.84 km2 with our sensors and record with a 15 min interval. Additionally, the surface energy balance is investigated at two locations by measuring the surface sensible and latent heat fluxes S0 and L0, the ground heat flux G, and the net radiation Qn. Also, the evaporation of the footprint can be derived from these data to identify energy balance errors of the EC stations (Ingwersen et al., 2015; Imukova et al., 2016). Profiles of soil water content q(−z), soil temperature T(−z) and matric potential h(−z) are measured at the EC stations. The variability of the soil properties can be studied with soil samples and geophysical (e.g., EM38) and agricultural measurements (e.g., traction measurements during tillage, Schutte, 2005).
With these data, the scientific objectives of LAFO can be achieved using the following methods.
- i.
Determination of the water and energy balances and the LA feedback as a function of soil, vegetation and atmospheric conditions in an agricultural study area. By combining the measurements of LAFO components 1 and 2, all terms of the water vapor budget can be measured. Thus, the evolution of the boundary layer can be related to the state of the soil and the vegetation (LAFO component 3). This coupling of variables under different atmospheric conditions is sought (e.g., Dirmeyer, 2014) to understand and predict changes in the components of the water budget, including clouds and precipitation due to internal and external factors (e.g., climate change) in the region. These data will also be used to help determine the accuracy of models in simulating the coupling.
- ii.
Investigation of the heterogeneity of fluxes at the land surface and in the boundary layer. The usual neglect of the heterogeneity of the fluxes leads to errors in weather prediction and climate models. When these heterogeneities are resolved, new scaling approaches can be developed and their impact on the coarse scale used in models can be investigated. Furthermore, measuring the states of the land surface and boundary layer at the desired high resolution will allow us to address the closure problem of EC measurements (Mauder et al., 2020; Ingwersen et al., 2015). A quantitative solution to the energy balance closure problem would enhance confidence in the data from the international eddy covariance networks (e.g., FLUXNET) when being used for model validation.
- iii.
Development of new parameterizations of the fluxes at the land surface under consideration of vegetation dynamics and turbulence in the atmospheric boundary layer. Parameterizations of fluxes at the land surface require accurate data on soil and vegetation properties and states in combination with measurements of variables and fluxes in the atmospheric layer. This complete set of LAFO measurements will also be used to further develop dynamic plant growth photosynthesis models (Gayler et al., 2013, 2014). In addition, the LAFO site in situ measurements facilitate straightforward comparison between measured and modeled time series of evapotranspiration, soil water content, soil temperature, soil matric potential, plant growth, plant development, leaf area index, yields and the energy balance closure at the surface, all of which are considered important state variables to further develop the agroecological multi-model library Expert-N and the land surface model NOAH-MP-GECROS. This further development is a prerequisite for coupling spatially explicit land surface models with large eddy simulations to account for field-to-field variability in crop and vegetation types and dynamics. Further, we will use the WRF-NOAHMP model system, which includes plant dynamics components (GECROS model) and hydroecological components (HYDRO models). It can be used for both weather forecasts and climate simulations (Schwitalla and Wulfmeyer, 2014; Warrach-Sagi et al., 2013). The model already provides an ensemble of parameterizations, meaning that probabilistic investigations of their performance are also possible. Initial approaches to combine lidar data to analyze turbulence parameterizations were presented in Milovac et al. (2016). By combining different types of measurements as envisaged in LAFO, parameterizations can be determined much better and more reliably (Wulfmeyer et al., 2016).
2.2 Sensor synergy
We have adopted a two-level observation strategy: long-term time series and IOPs. These provide us with parsimonious yet highly informative datasets obtained from our sensor synergy network.
In the long term, we operate a number of instruments in operational mode to obtain continuous year-round time series. As such, since the beginning of LAFO in 2018, WaTSeN has been continuously supplying time series to characterize the spatial heterogeneity of soil water contents and temperatures at the Heidfeldhof. Similarly, two EC stations have been deployed. At the lidar site, two Doppler lidars, a Doppler cloud radar, a micro rain radar and an optical disdrometer have been continuously operated since May 2020. The vegetation status is registered on all plots with WaTSeN stations.
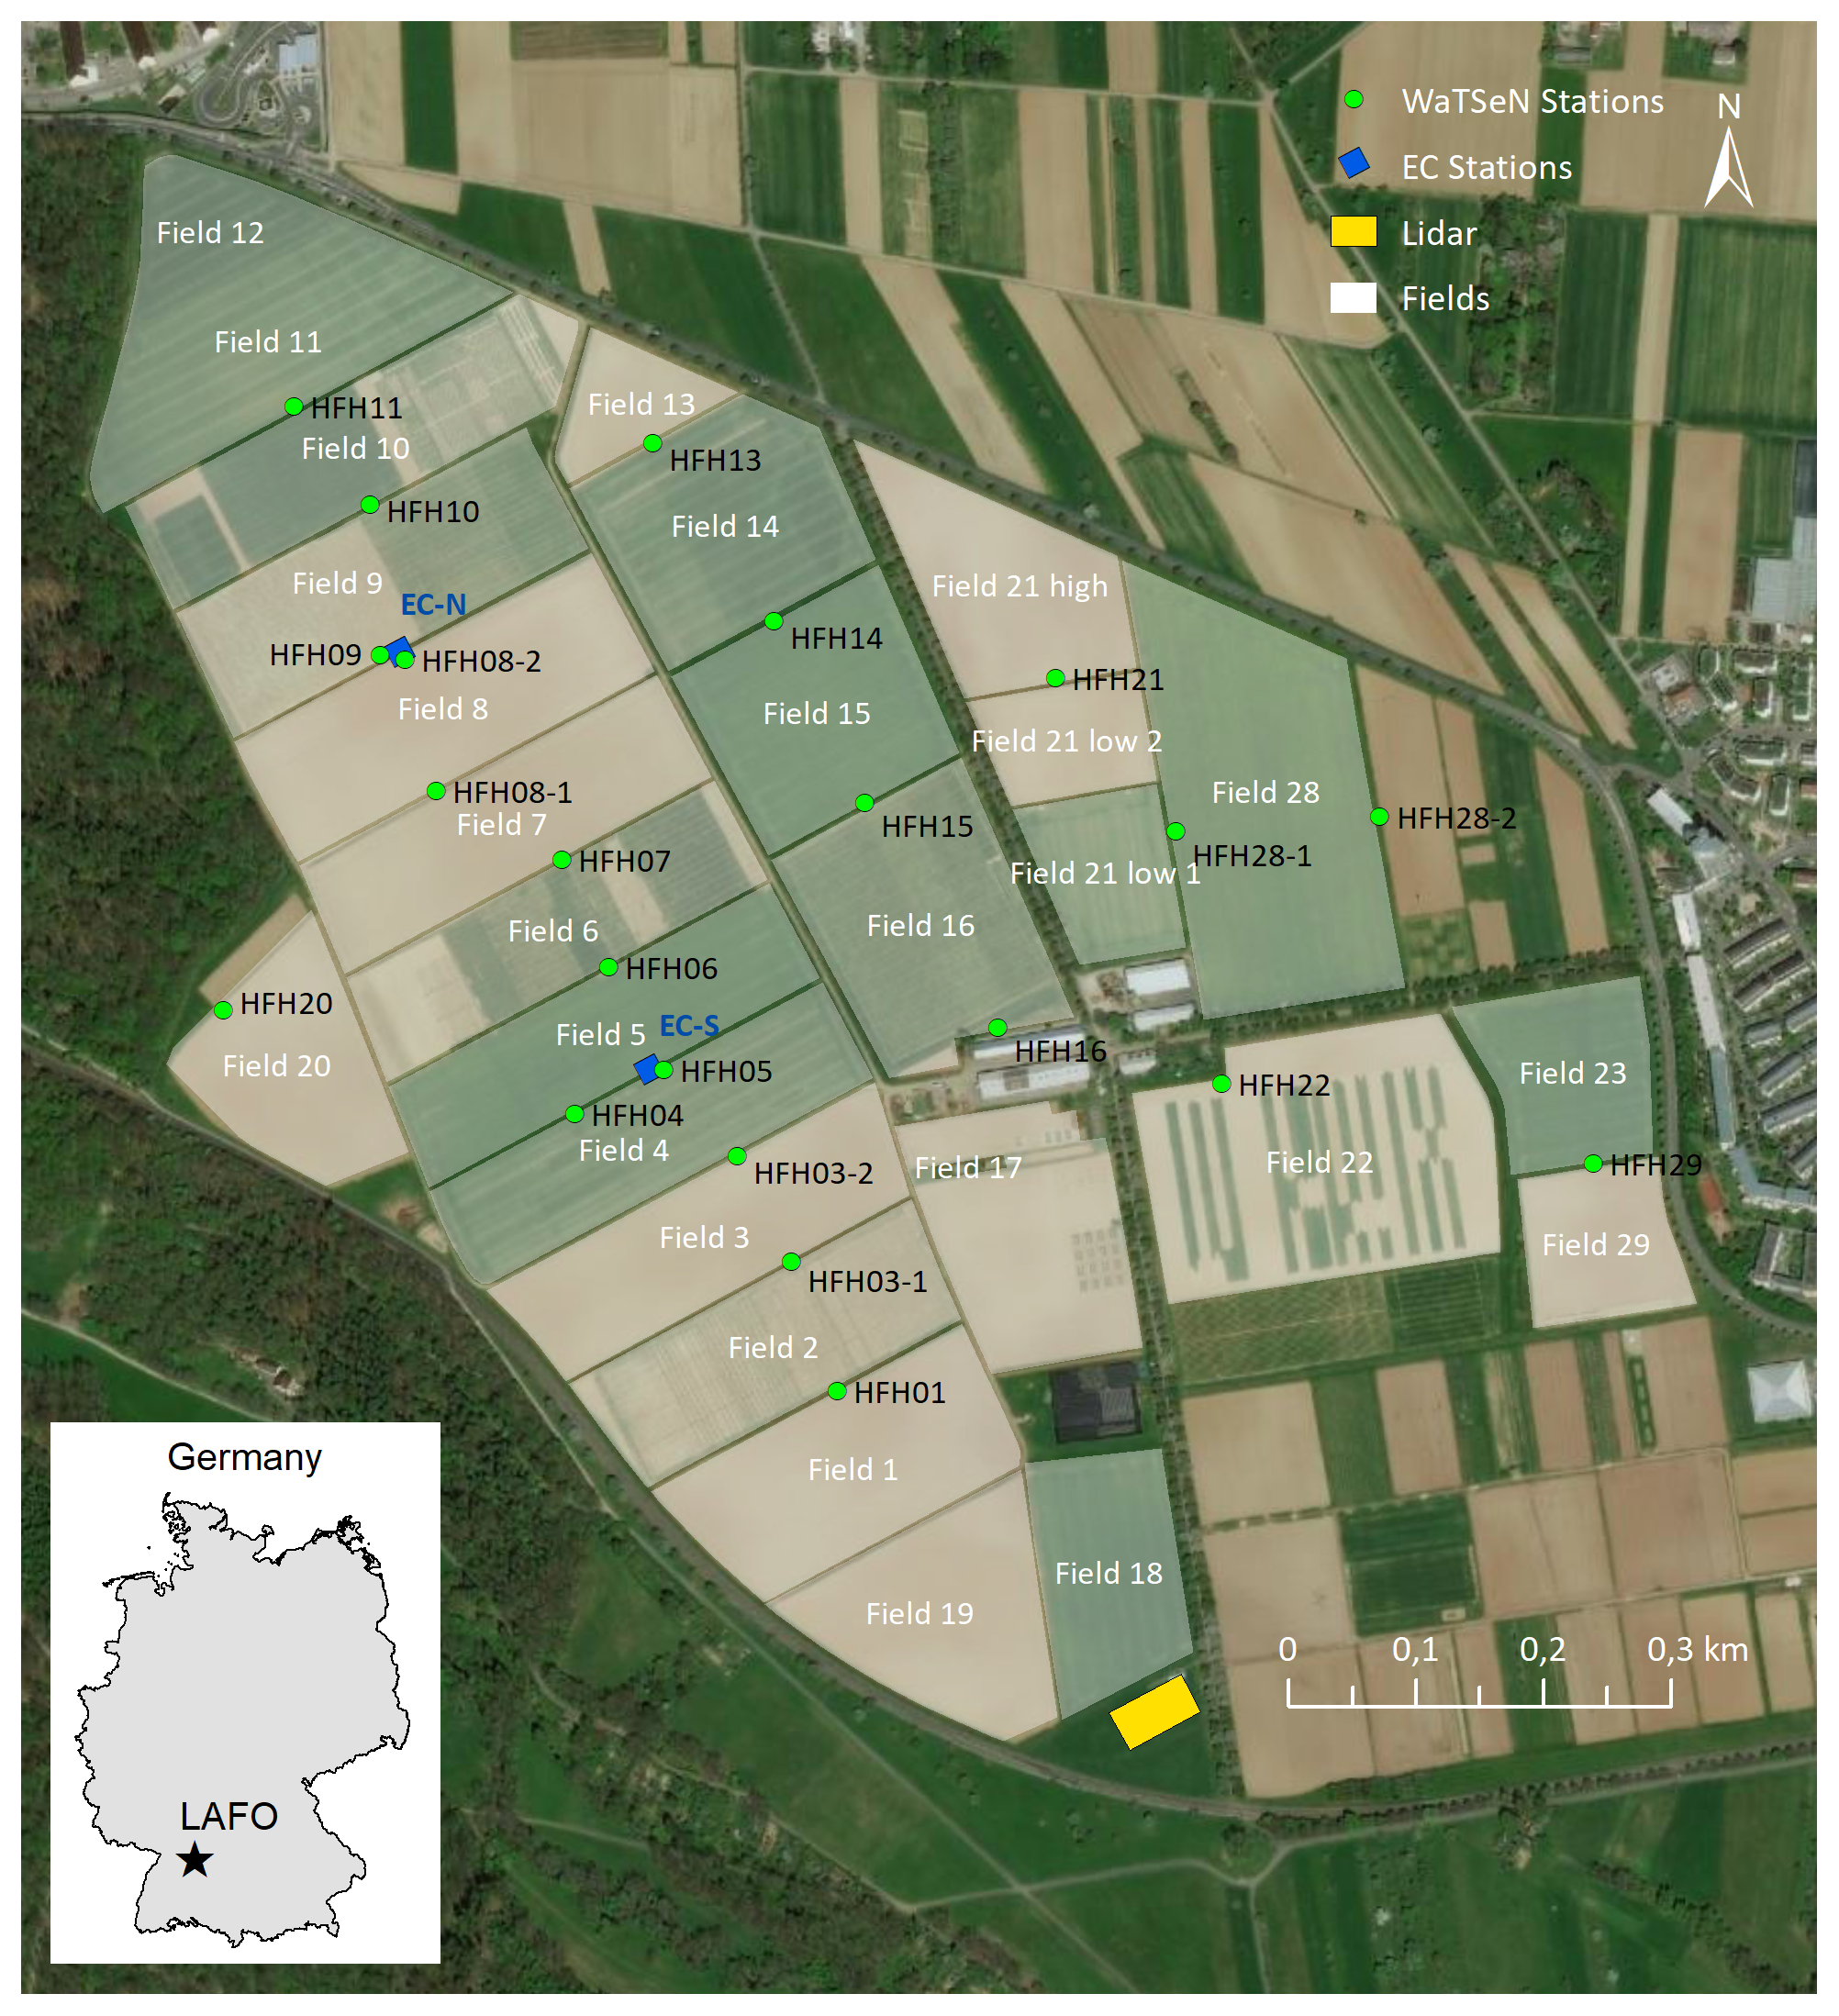
Figure 2LAFO experimental site at the Heidfeldhof, showing the locations of the two eddy covariance stations, the 22 soil water content and temperature stations of WaTSeN, and remote sensing equipment at the lidar site and the extents of the agricultural fields. The inlet shows the location of LAFO in southwestern Germany (basemap sources: Esri, DigitalGlobe, GeoEye, Earthstar Geographics, CNES/Airbus DS, USDA, USGS, AeroGRID, IGN, and the GIS User Community).
In addition to the operationally collected data, intensive observation periods will be organized as field experiments, thereby complementing the operational instrumentation with additional sensors and measurement systems to get an almost full picture of the situation in the atmosphere, at the land surface, in the vegetation layer, and in the soil. This extended instrumentation is operated temporarily to target a certain aspect of L–A interaction. Additional instruments of UHOH are DIAL, RRL, BreedVision, drones, and EM38. Interesting sensors to add are further DLs for SL sampling; fiber optic distributed sensing (FODS) to study the temperature distribution; canopy sensors to observe temperature, humidity, radiation, and wind inside and at the top of the canopy stand; and isotope measurements to discriminate between evaporation and transpiration. Interested external partners can benefit from our sensor synergy and join through collaboration. For example, LAFO was one observation site in the frame of the field campaign Swabian MOSES that took place in spring 2021 (Kunz et al., 2022). During this field experiment the Atmospheric Raman Temperature and Humidity Sounder (ARTHUS) was operated to capture atmospheric temperature and humidity profiles next to wind and cloud observations with DL and a Doppler cloud radar.
2.3 Study area
The LAFO site is located approximately 10 km south of Stuttgart and 3 km north of Stuttgart airport, near the University of Hohenheim, Stuttgart (48∘42′ N, 9∘11′ E), in southwestern Germany. The study site belongs to the university's agricultural research farm “Heidfeldhof” and comprises 26 agricultural fields covering a surface area of 84 ha. Figure 2 shows a map of the LAFO study area. The agricultural fields are surrounded by suburban areas with an adjoining forest to the west. The Heidfeldhof farm is owned by the University of Hohenheim and used as a research site for agricultural experiments. The main crops are maize, rapeseed, wheat, triticale and barley cultivated in rotation, and other crops are also present. The LAFO experimental site is flat; its elevation varies between 390 and 420 m. The monthly temperatures vary between 0 ∘C in winter and 18 ∘C in summer, and annual precipitation is 685 mm. An irrigation system is not installed. The soil type of the site is classified as Haplic Luvisol (periglacial loess) with a silty-loam texture (7 % sand, 73 % silt and 21 % clay).
In addition to the LAFO measurements, additional observations are made close by. At a 2 km distance from the site, the Hohenheim weather and climate station has been recording data since 1878 (Wulfmeyer and Henning-Müller, 2005). The meteorological observations made from Stuttgart airport (METAR code: ESSD) are located only 3 km to the south. The official weather station Stuttgart-Schnarrenberg operated by the German weather service (DWD) with radiosonde launches (two launches per day) is located 13 km to the Northwest. Finally, the water level of the small Körsch creek next to the study area is recorded 8 km downstream to the east in Denkendorf.
The three LAFO components of the LAFO synergy are dedicated to the three compartments atmosphere, soil and land surface, and vegetation and are described in the following, listed in Table 1 and have their locations marked in Fig. 2.
3.1 First LAFO component: atmospheric measurements
The first component consists of three scanning lidar systems, a water vapor differential absorption lidar (DIAL), a water vapor and temperature rotational Raman lidar (RRL), and Doppler lidars (DLs) for wind measurements that are located at the lidar site (Fig. 2). The DIAL and RRL instruments have been developed and designed at the Institute of Physics and Meteorology of UHOH, and the deployed Doppler lidars are manufactured by Halo Photonics Ltd. (UK, Pearson et al., 2009). With this combination, it is possible to measure 2D to 3D structures of these important atmospheric variables from the ground through the boundary layer to the lower free troposphere (about 3–4 km altitude). The coherent Doppler lidars are limited to regions with atmospheric scatter (aerosols, particles), which restricts the measurement range mostly to the ABL and thin clouds, but they have a nominal measurement range of 10 km. The range of DIAL and RRL reaches 5–6 km depending on the resolution. The DIAL is mounted on a mobile platform with a frequency-doubled Nd:YAG-pumped Ti:sapphire laser transmitter at 818 nm with an output power of up to 10 W (Wagner et al., 2013; Metzendorf, 2018). The 3D scanner is equipped with an 80 cm primary mirror and allows scanning of the full upper hemisphere enabled for the first 3D humidity measurements (Späth et al., 2016). Raw signals are recorded with 0.1 s and 15 m frequency and result in provided data resolutions of 1–10 s in time and 60–300 m in range. The RRL is also a mobile, 3D scanning lidar system. The laser transmitter is based on a frequency-tripled Nd:YAG laser at the eye-safe wavelength of 355 nm and a 40 cm receiving telescope with a two-mirror 3D scanner (Radlach et al., 2008). A very efficient receiver separates the components of rotational Raman scattering for temperature and vibrational Raman scattering for water vapor mixing ratio (WVMR) measurements (Hammann et al., 2015). Meanwhile, a more compact and automated Raman lidar for temperature and humidity measurements (Atmospheric Raman Temperature and HUmidity Sounder – ARTHUS, Lange et al., 2019) has been developed and is available at LAFO for collecting vertical profiles of temperature and humidity. The temporal and spatial resolutions are 1–10 s and 100–300 m. Wulfmeyer et al. (2015) demonstrated that the DIAL and the RRL are currently the most accurate and highest-resolution water vapor and temperature remote sensing systems in the world. The RRL was the first to measure inversions at the top of the boundary layer and turbulent fluctuations in daytime temperature (Behrendt et al., 2015). As research instruments, the scanning DIAL and RRL are not automated; thus, manual operation is only affordable for certain time periods during dedicated intensive observations periods. In contrast, ARTHUS is a fully automated system for collecting vertical profiles. When ARTHUS is not involved in other field campaigns, it is operated in LAFO.
The humidity and temperature measurements are complemented by wind measurements of two DLs that are operated continuously. One DL is dedicated to observing the vertical wind with a turbulent resolving resolution of 1 s and 30 m in a constant vertical steering mode. The other DL is operated in six-beam VAD (velocity azimuth display) mode to detect profiles of horizontal wind (Choukulkar et al., 2017). These measurements also have turbulence resolution with 90 s and 21 m. Wulfmeyer et al. (2016) showed that this measurement combination of DIAL, RRL and DL is crucial for measuring fluxes through the ABL and for developing new turbulence parameterizations. In combination with additional cross-track-scanning DLs the measurement setup for SL profiling (Späth et al., 2016) can be achieved and used for mapping land surface fluxes. Additional instruments, e.g., DLs for cross-track scanning, will be provided by project partners.
During cloudy and rainy weather situation one Doppler cloud radar (DCR) is operated in vertical stare mode. The DCR is a MIRA-36 of Metek GmbH (Görsdorf et al., 2015). The recorded DCR data have resolutions of 1 s and 30 m. To characterize rain in more detail a micro rain radar (MRR, Metek GmbH) and an optical disdrometer (ParSiVel) are installed as well. All instruments except DIAL and RRL are operated continuously and quicklooks of measurements are available in near real-time on the LAFO website https://lafo.uni-hohenheim.de/en (last access: 19 January 2023).
3.2 Second LAFO component: soil and land surface measurements
The second component combines sensors that determine energy fluxes at the land surface and state variables of soil.

Figure 3Temporal variations in spatial average soil water content (a, blue), standard deviation of soil water content (a, green) from WaTSeN and daily precipitation (b) measured at the northern EC station during 2019–2020. Soil water content is the spatial mean of hourly averaged data from 13 stations of WaTSeN.
Surface energy fluxes are derived from long-term eddy covariance measurements at two stations at the Heidfeldhof (Fig. 2). The stations are each fully equipped with a 3 m mast and sensors to measure concentrations, 3D wind components with a sonic anemometer, and upwelling and downwelling shortwave (SW) and longwave (LW) radiation to access the net radiation Qn. This instrumentation allows for the investigation of the energy partitioning of Qn into sensible and latent surface heat fluxes S0 and L0, respectively, as well as ground heat flux G. All meteorological variables like air temperature, humidity, pressure and precipitation are collected, as are soil water content, soil temperature and matric potential at five soil depths (5, 15, 30, 45 and 75 cm) and averaged over 30 min time intervals. Variables to determine fluxes are recorded with 10 Hz and processed with TK3.1 (Mauder and Foken, 2015), resulting in 30 min values. The used sensors, characteristics and methods are identical to Wizemann et al. (2015).
Beginning in June 2018, a Water and Temperature Sensor Network (WaTSeN) was installed to quantify the spatial and temporal patterns of precipitation, soil water content and temperature using a total of 22 Aquaflex II universal sensors (Streat Instruments Ltd) to monitor the soil water content and temperature, as well as 22 rain gauges (Pronamic), in November 2020, covering the entire Heidfeldhof (HFH; see Fig. 2) area of 0.84 km2. Aquaflex II sensors are installed below the plowing depth at 40 cm depth, providing year-round measurements without laborious sensor de-installation. Rain gauges, solar panels and loggers are mounted on a post next to each field. Stations are named according to site position and field site number with the prefix “HFH”. The stations are powered by solar electric panels. Each station is equipped with Adcon Remote Transmission Unit (RTU) data logger (OTT HydroMet GmbH) for automatically collecting and transmitting data via a 3G and 4G network. Data loggers store sensor data, taking the mean over 15 min time intervals, and data are then sent to the central database every 6 h. Since factory-calibrated volumetric water contents of Aquaflex II sensors are highly biased (Poltoradnev et al., 2015), the sensor signals are recalibrated based on site-specific soil sampling analysis. For this, soil core samples are systematically collected four times per year in close proximity to each soil sensor. The samples are used to determine the gravimetric water content by oven-drying them and then converting them to volumetric water content using the determined bulk density. The determined values are subsequently used for the calibration of the Aquaflex II sensor data.
In Fig. 3, the spatiotemporal variability of soil water content (SWC), its standard deviation and the time series of precipitation for the 2-year period 2019–2020 are shown. The SWC shows the typical wetting and drying cycles during the year reaching field capacity (the water content which can be held by capillary forces against gravity) in winter and subsequently long periods of drying between April and October as a result of net evapotranspiration being larger than precipitation over this period. SWC values above field capacity are only observable during strong infiltration events, and subsequent rapid drainage leads to plateaus in the observations, which testifies to the high (un)saturated soil hydraulic conductivity. From the state space of the standard deviation of SWC (σSWC) in Fig. 3, we conclude that the variation in SWC is controlled by the land cover (through interception and absorption of plants and evaporation of soil) and by the fact that the infiltration fronts at 40 cm depth is far less homogenous (σSWC higher) than drying (σSWC lower).
So far we have not detected strong coupling between the soil hydrological variables and fluxes at the land surface during the growing seasons. Latent and sensible heat fluxes show no significant correlation with SWC or water potential at any depth. Thus far, soil variables have not been shown to control the fluxes at the land surface during the growing season, and heat fluxes are radiation driven. This can be beneficial since it allows for the identification of the plant state as the principal control for spatial surface flux heterogeneity at the land surface.
3.3 Third LAFO component: vegetation measurements
This component consists of equipment for characterizing vegetation. These include UAVs for recording plant characteristics, which now represent an innovative alternative to traditional remote sensing with manned aircraft or satellites due to the inexpensive and short-term availability of high spatial resolution sensor data. The higher spatial resolution in particular allows for applications using smaller field plots. Several spectral bands are necessary (e.g., 670, 700, 740 and 780 nm) for the calculation of the red edge inflection point (REIP), which is used for the determination of vegetation indices used for the derivation of biomass and nitrogen supply. The spectral analysis was performed with a UAV equipped with converted industrial four-sensor camera for REIP imaging by means of suitable interference filters (Geipel et al., 2014). In addition, the camera has been coupled to an external light meter to dynamically adjust the exposure time to the solar irradiance. The camera is individually programmable and also allows image processing in near real time.
In cooperation with the Osnabrück University of Applied Sciences, the State Seed Breeding Institute (LSA) at the UHOH has developed the “BreedVision” phenotyping platform (Busemeyer et al., 2013). It consists of a carrier vehicle and a sensor module. The carrier vehicle is a high-wheel tractor especially adapted to the requirements of the sensor module. Both the track width and the height of the carrier vehicle can be adjusted hydraulically. The sensor module includes sensors with different morphological or spectral selectivity, such as light grids, laser distance sensors, multi-reflective ultrasonic sensors, digital cameras, a plenoptic camera and a hyperspectral camera. For example, light grids create a shadow image from the transmitted light through the plants of the plots, from which plant height zp and density can be indirectly determined, while a hyperspectral camera can be used to determine plant moisture content or parameters such as the normalized differential vegetation index (NDVI). The sensor module is continuously adjustable in height, allowing a constant distance of the sensors to the plants to be maintained even with varying plant heights. The particularly innovative feature of the developed system is the combination of sensor data for trait prediction. The spatial and temporal allocation of all sensor data to a single position and thus to individual plant organs in the crop, which is necessary for this, is so far unique in field phenotyping. In addition to its use in plant breeding, the system can also be used to record, by means of the various complementary sensors, a range of trait parameters along a plant stand.
Further, we routinely register the leaf area index (LAI) with a LAI2200C sensor from LI-COR Biosciences Inc. (USA) and the crop height and phenomenological growth stage using the BBCH code (Biologische Bundesanstalt für Land- und Forstwirtschaft, Bundessortenamt und Chemische Industrie; Meier, 2018) at our EC and WaTSeN stations throughout the main vegetation period (biweekly). Furthermore, we have a set of canopy sensors to investigate temperature and humidity at different levels inside and right above the canopy top.
The LAFO equipment and its data products are listed in Table 1. The list contains the currently operationally available instruments and measurement data but can be extended in the future or for measurement campaigns with collaborators complementing instrumentation for certain time periods.
4.1 Dynamic and thermodynamic profiling for turbulence analysis
For studying dynamics and thermodynamics in the ABL at LAFO we use the synergy of DLs and ARTHUS. As explained in Sect. 2.2, we measure dynamic profiles of vertical wind with one constantly vertical pointing DL and retrieve the horizontal wind from DL in six-beam VAD mode. In Fig. 4 we show 24 h wind measurements for 27 June 2021. Figure 4a–d show vertical profiles of vertical and horizontal wind and profiles of the backscatter coefficient. The resolution of the vertical wind and backscatter coefficient is 1 s and 30 m. The horizontal wind is retrieved from the six-beam VAD mode with a sinusoidal fit and results in a 90 s and 21 m temporal and spatial resolution (Bonin et al., 2017). To reduce the effect of the convective eddies for the horizontal wind, an additional gliding average of 21 min was applied. In the vertical wind plot (Fig. 4a) the development of the CBL started around 07:00 UTC, which is indicated by the stronger up and down draft starting to grow from the surface into the boundary layer. The CBL stayed convective until around 17:00 UTC and reached a height of around 1 km. Before and after that period only low vertical wind was observed, which is typical for the nighttime boundary layer. While there was nearly no vertical motion at the beginning of the day, a low-level jet (LLJ) in the horizontal wind up to 8 m s−1 was recorded at a height of 500 m. This LLJ disappeared at around 10:00 UTC when the convective motion reached the height of the LLJ. Recording the data with turbulence resolution allows the derivation of further products like vertical wind variance, momentum flux and turbulent kinetic energy, which are plotted in Fig. 4e–g. For these retrievals we determine the fluctuations to calculate the variance and higher-order moments (not shown here) following the method of Lenschow et al. (2000) and Wulfmeyer et al. (2016). This method also allows for distinguishing between atmospheric variance and instrumental noise contribution. The calculation of momentum flux and TKE follows Bonin et al. (2017). In the evening at 20:00 and 23:00 UTC two rain events were captured, which are identified by reduced measurement ranges or strong downward motion and the corresponding effects in the derived products.
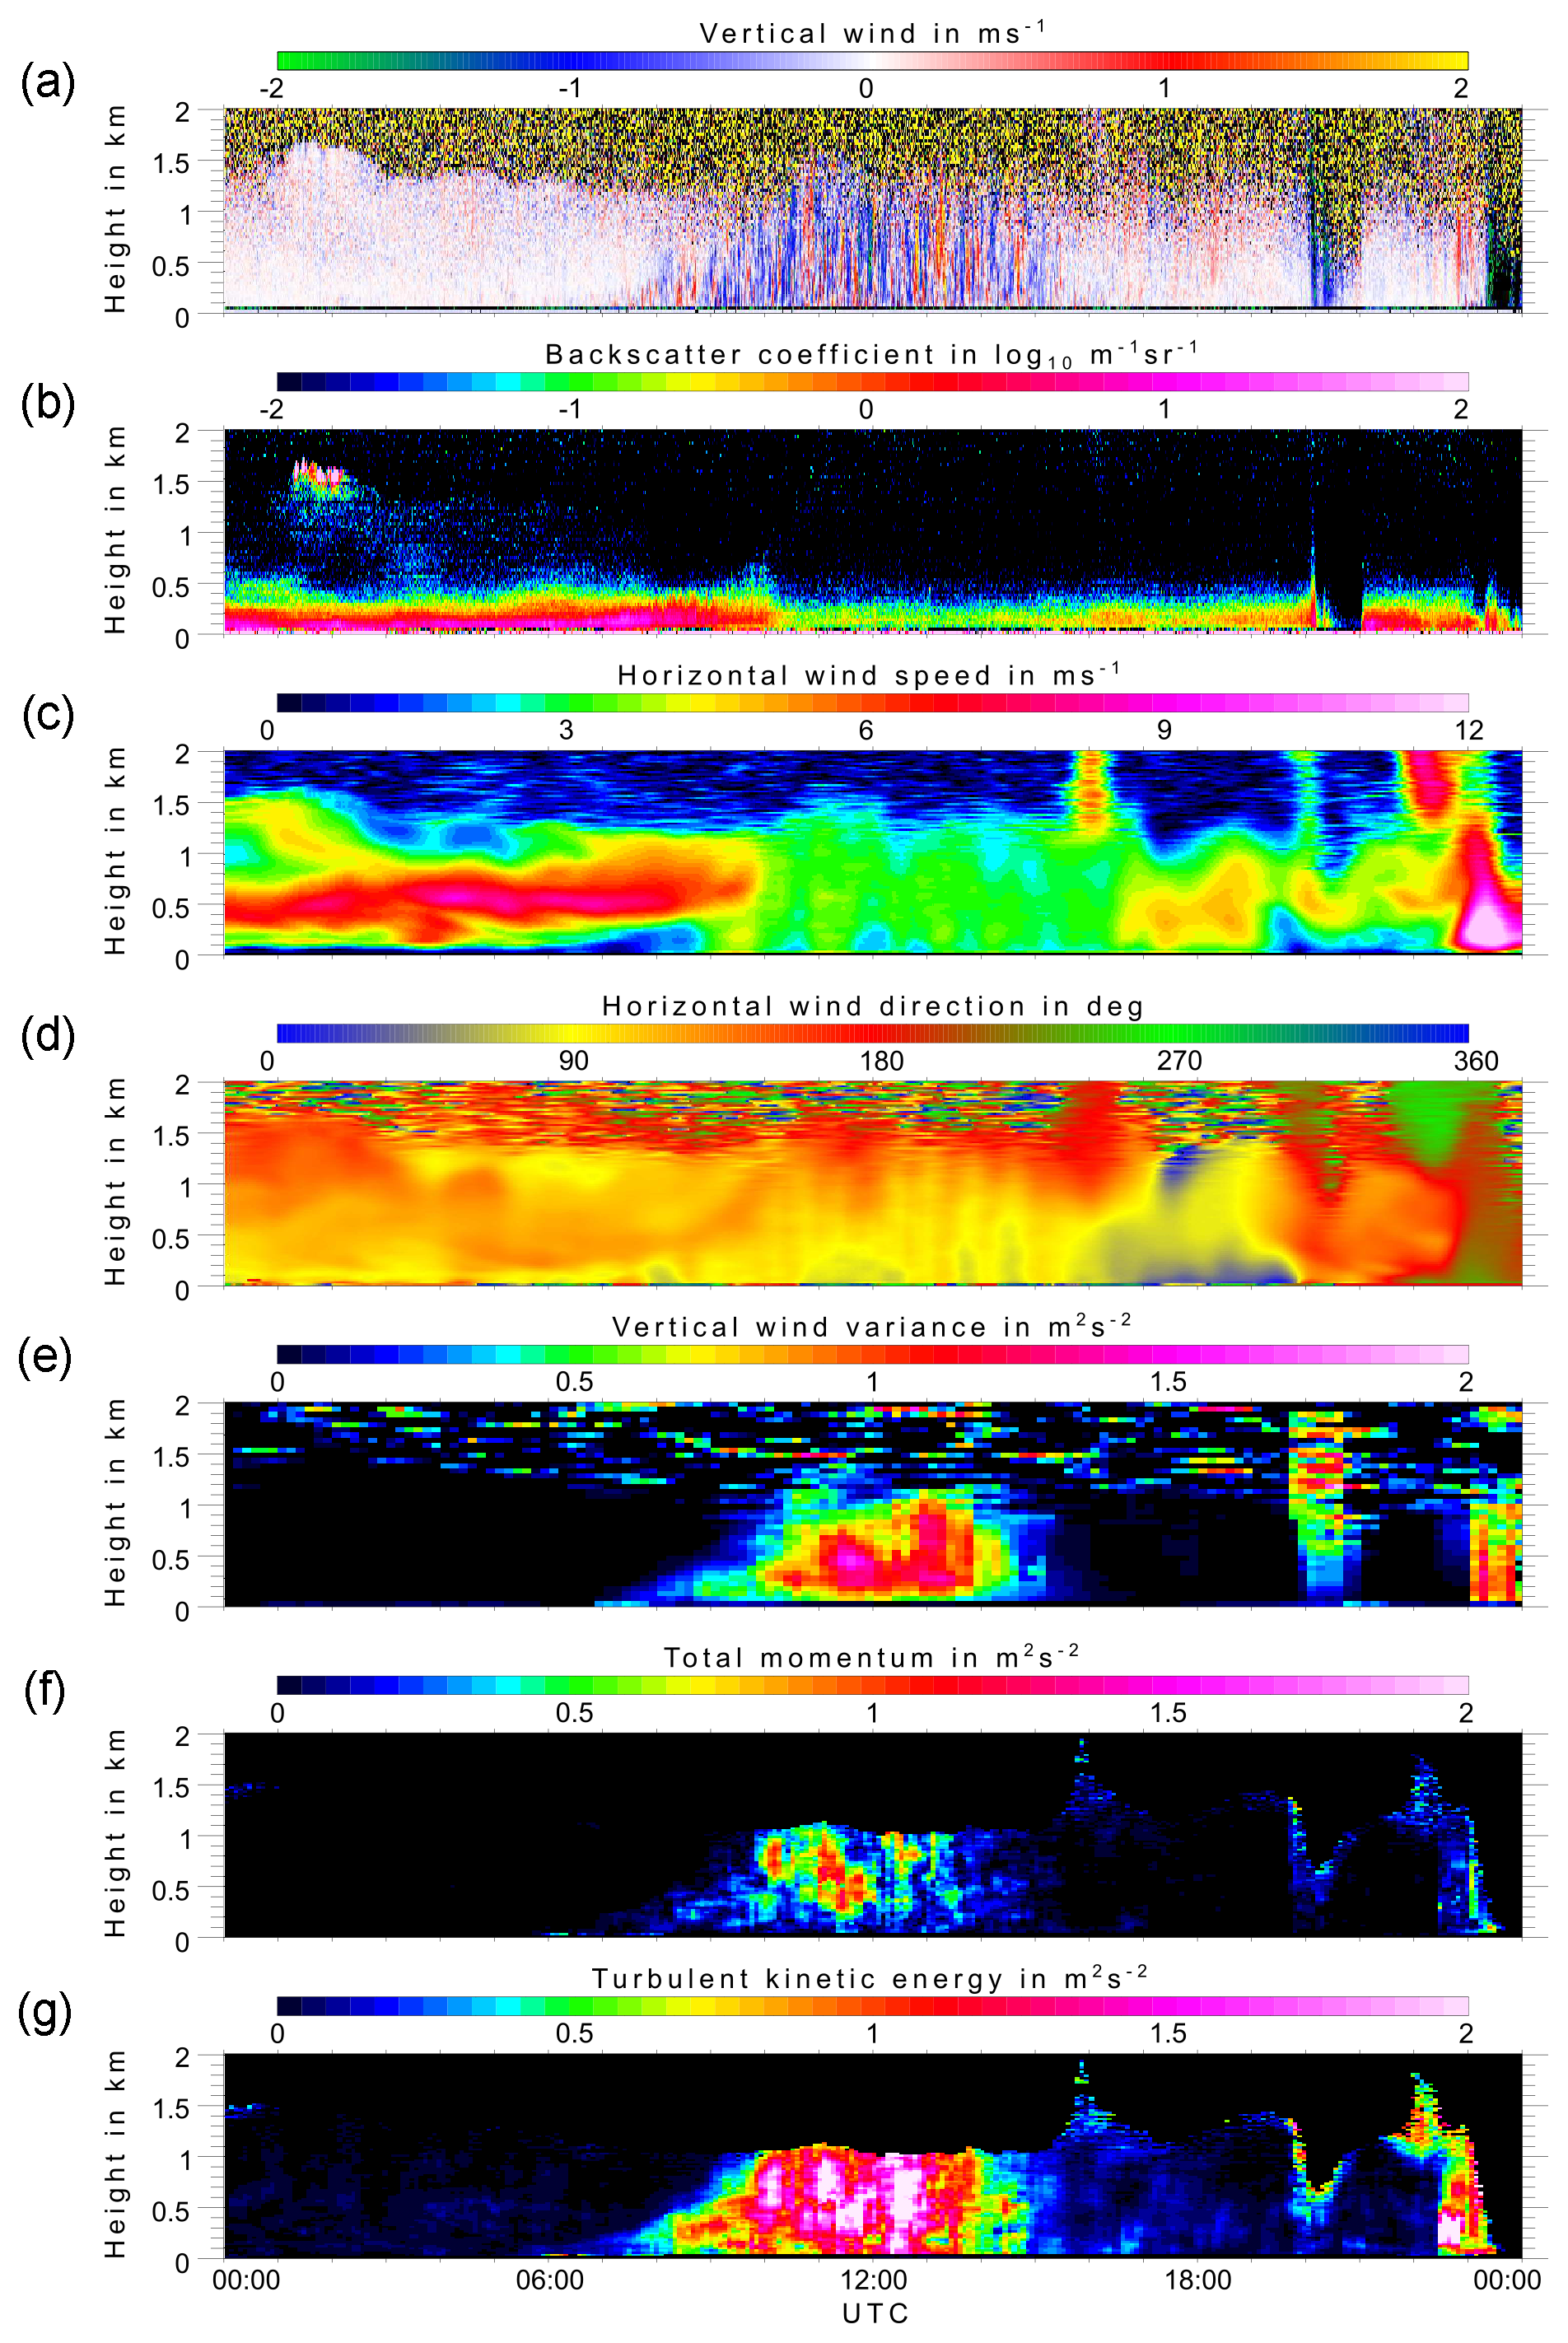
Figure 4Measurements of the vertical and horizontal wind from 27 June 2021. In addition to the wind itself, the backscatter coefficient, vertical wind variance, TKE and momentum flux are also shown.
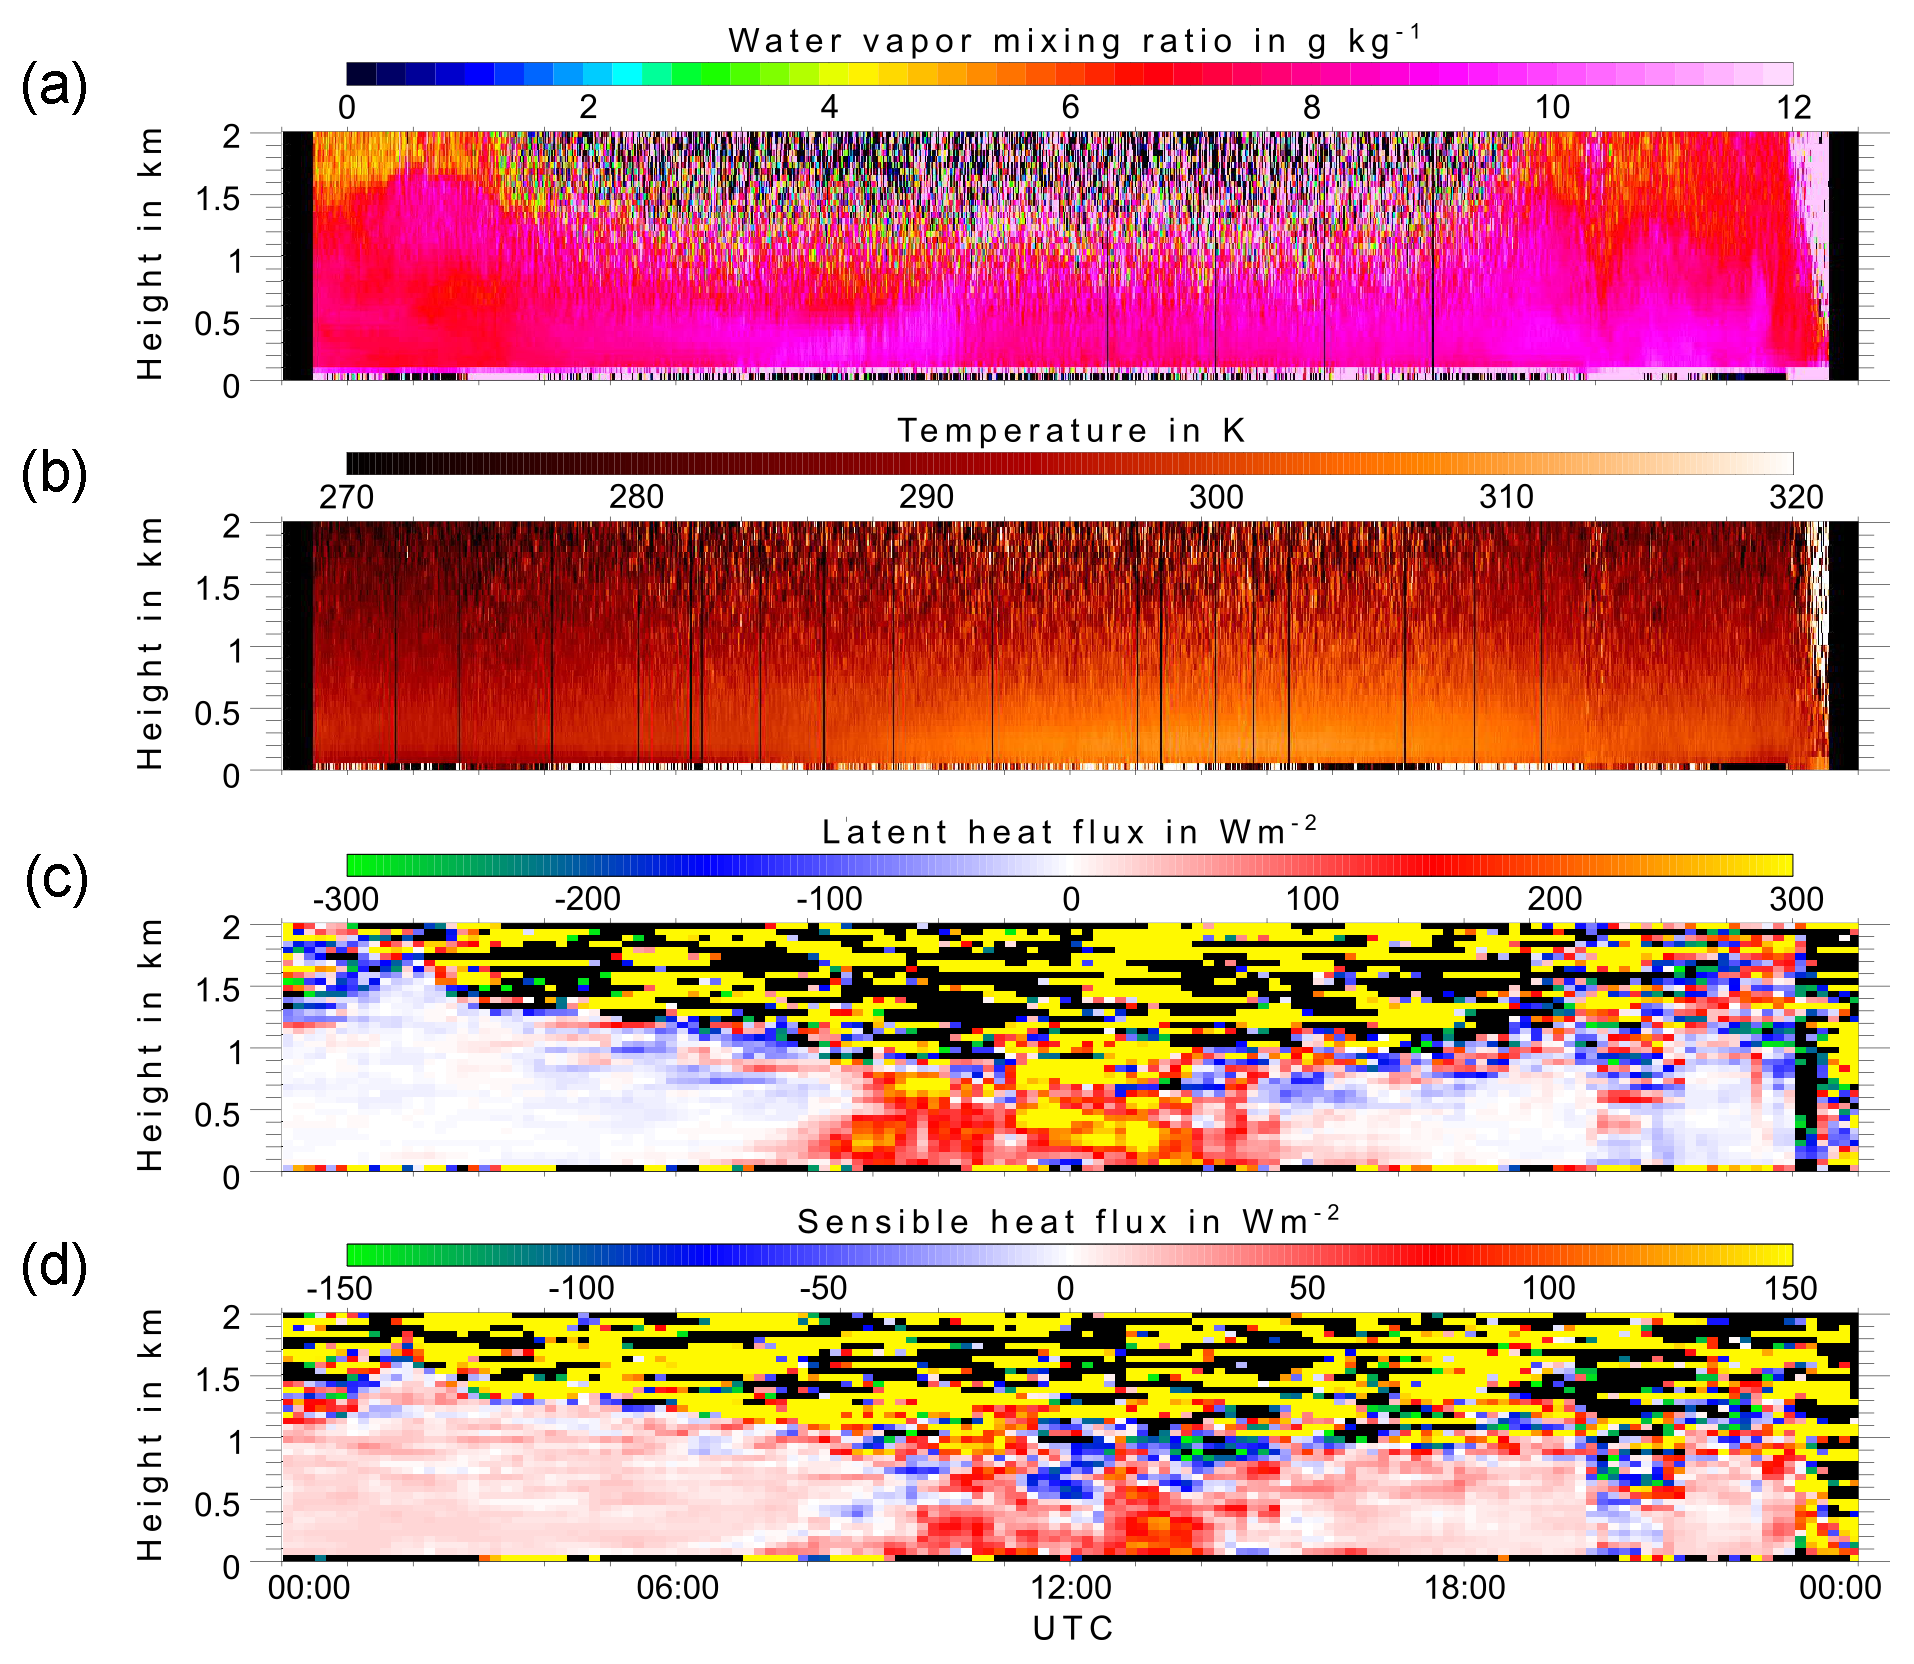
Figure 5Water vapor mixing ratio and temperature time series for 27 June 2021 are plotted in (a) and (b). In (c) and (d) the latent and sensible heat fluxes are shown for that day.
The thermodynamic profiling was performed with ARTHUS. The time series of WVMR and temperature profiles of 27 June 2021 are shown in Fig. 5a and b. The data show the moistening and warming of boundary layer in the cause of the day when the boundary layer became convective. In combination with vertical wind measurements the latent and sensible heat fluxes through the boundary layer can be calculated with the covariances of humidity and temperature fluctuations and vertical wind (Behrendt et al., 2020) and are plotted in Fig. 5c and d. When including horizontal wind, the water vapor budget in the BL can be determined, as demonstrated for the first time for a LAFE case. This measurement synergy demonstrates the atmospheric link for the investigation of energy and water budget, as aimed for in LAFO objective 1.
4.2 Correlation between turbulent mixing height and surface fluxes
The turbulent motion in the BL can be captured with the wind observation. The depth of the CBL is related to the energy intake by solar radiation and its partitioning at the land surface. Thus, we determined the mixing height for the 3-month period from 1 May to 31 July 2021 and correlate them to the surface fluxes measured with the EC station.
For determining the mixing layer height (MLH) we use vertically pointing Doppler lidar and Doppler cloud radar data and a fuzzy logic approach to weight the different data (Bonin et al., 2018). The DL measures the vertical wind w, signal-to-noise ratio (SNR) and backscatter coefficient β. From the DCR, vertical profiles of radar reflectivity, Doppler velocity and spectral width are included in the algorithm. The main contribution comes from the vertical wind variance to map variance as turbulent for m2 s−2 or non-turbulent. A SNR threshold was set to filter the wind data for poor data quality, and high β values are used as an indicator for the presence of clouds and precipitation. Clouds show high β values and strong β gradients at the cloud bottom, and precipitation is associated with high β values and negative vertical wind. In addition, the DCR data are used to support cloud and precipitation estimates. Data of clouds and precipitation are filtered out and are not included in the determination of MLH.
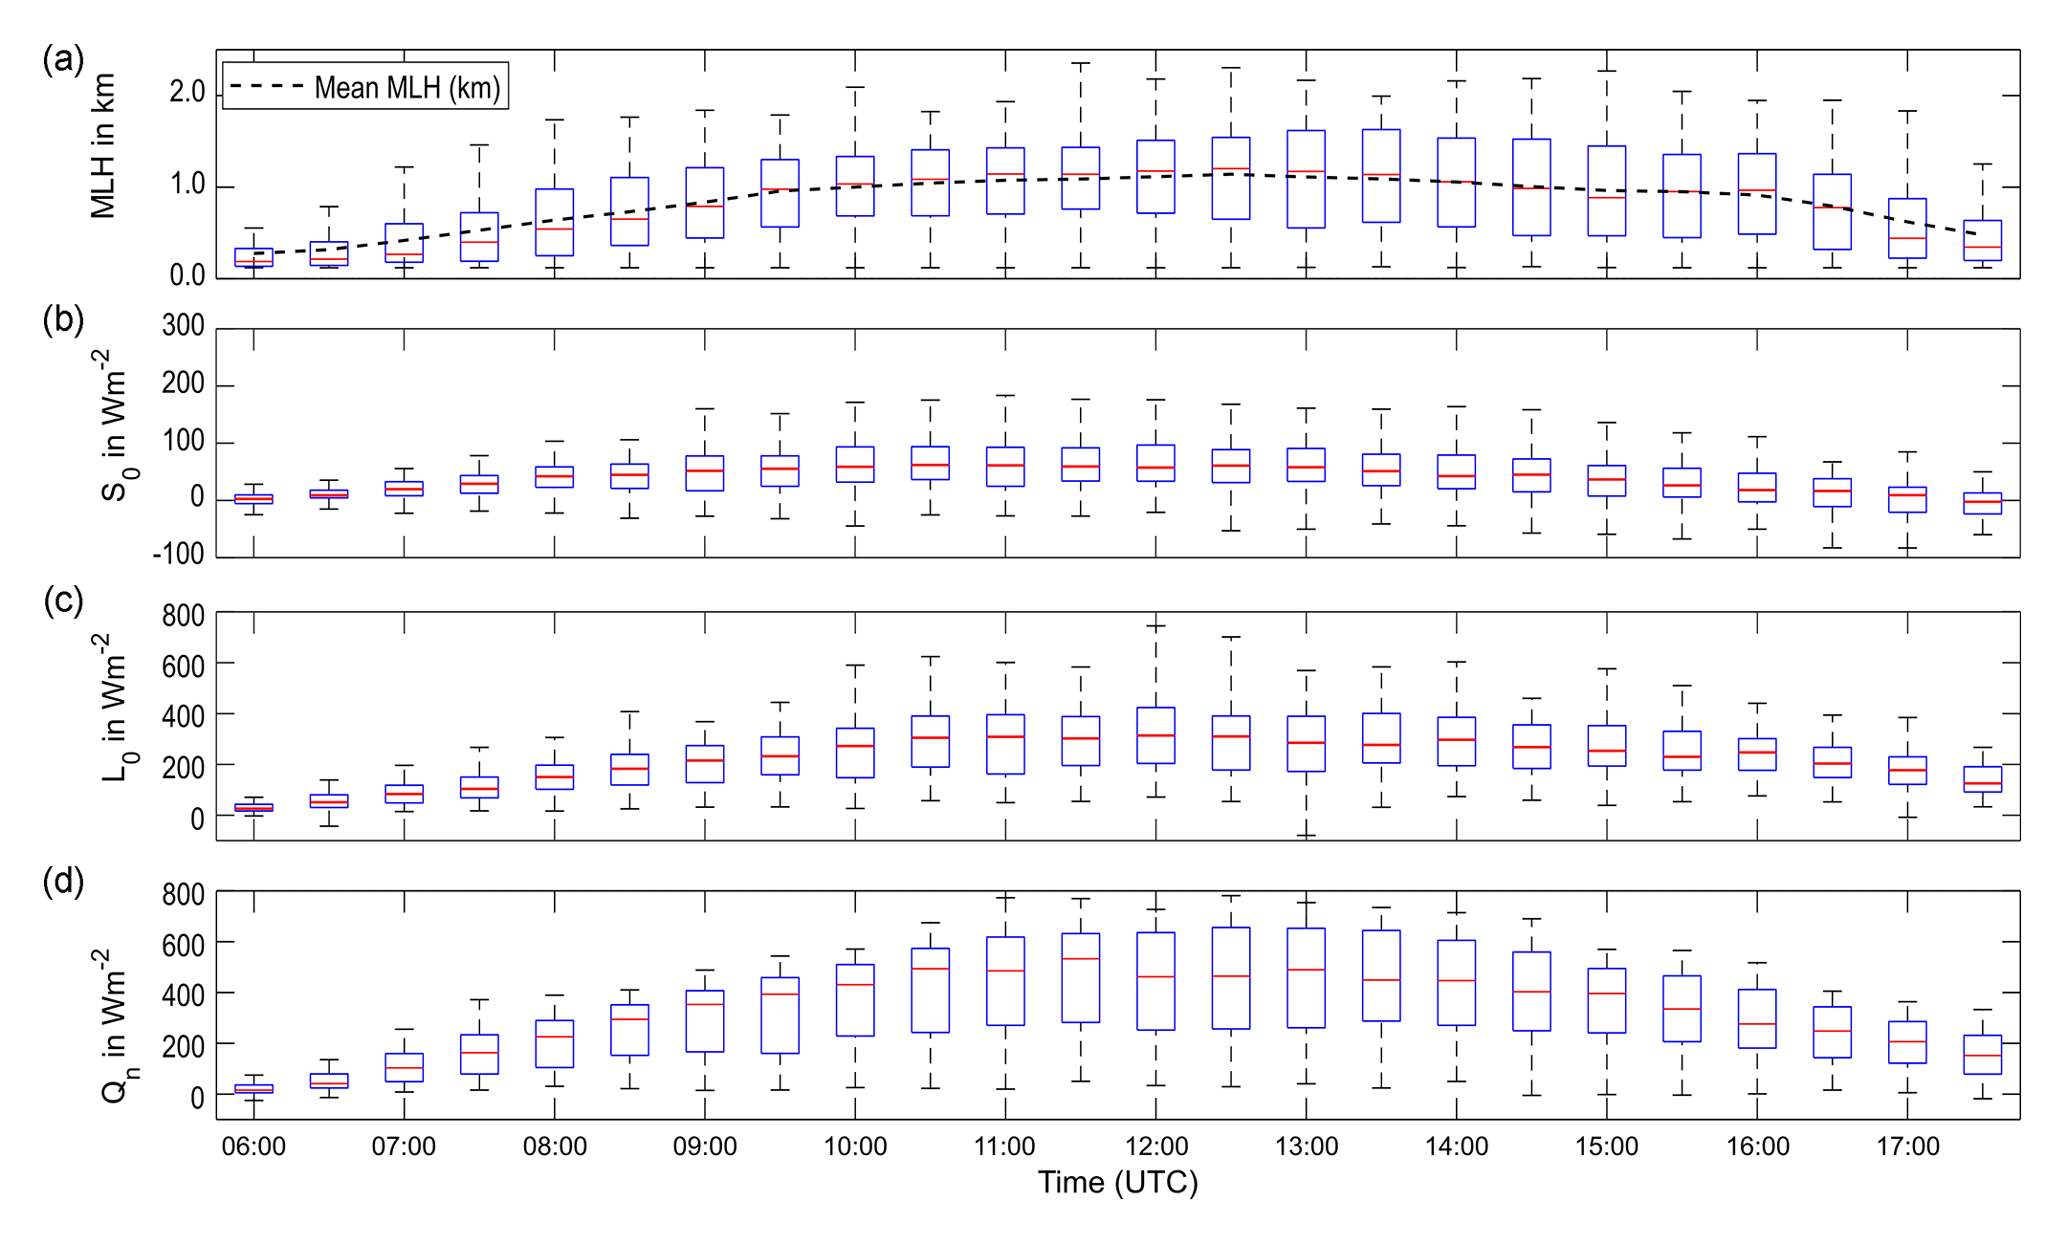
Figure 6Statistics of the diurnal cycle between 06:00 and 18:00 UTC of mixing layer height (MLH) (a), surface sensible heat flux (S0) (b), latent heat flux (L0) (c) and net radiation (Qn) (d) for 3 months from May to July 2021.
The MLH is calculated for each day for the time period between 06:00 and 18:00 UTC, which covers daytime between sunrise and sunset when turbulent mixing is expected. The analysis is based on the 1 s data. Nighttime MLH is usually very low, and mixing is caused by friction between air and land surface. These situations cannot be captured with our vertical pointing instruments as the lowest range bin is not lower than 100 m. Data of the 1 s MLH data are averaged for 30 min intervals as the surface fluxes are calculated likewise for half-hour time slots. In Fig. 6a the statistics of the diurnal cycle of the MLH are plotted as a box and whisker plot. The box and whiskers provide a clear picture of data distribution. The box itself represents the range of 50 % central data (between 25 % and 75 %), also known as interquartile range (IQR). In the box the red line gives the median of the data. The dashed lines (whiskers) extending from the box mark the remaining data, ranging from the minimum to the maximum values. Data points outside of these ranges are considered outliers, which are defined as <1.5 IQR or >1.5 IQR. The dashed curve and red dots follow the mean MLH. Box and whisker plots are also shown in Fig. 6b–d for the surface fluxes of sensible and latent heat and the net radiation for the 30 min intervals. The correlation of the mean MLH and the fluxes is plotted in Fig. 7.
The statistics include the full 3-month period covering all cases including clear sky, clouds, rain and thunderstorms. On convective days the MLH reached a mean of up to around 1.2 km and up to more than 2 km overall; however, on cloudy days the MLH stays about 400 m lower. This is also represented in the flux data when the surface heating is low on cloudy days. The sensible heat flux varies from 20 to 70 W m−2, latent heat flux varies from 20 to 300 W m−2 and net radiation varies from 20 to 400 W m−2. The growth of the MLH starts in the morning when convection starts with the surface heating after sunrise and decays when the energy input decreases. Thus, MLH development is clearly related to the surface fluxes. The maximum is reached around noon when the most energy is available. This is also reflected in the positive correlation of the mean MLH and the surface fluxes plotted in Fig. 7. The MLH is directly correlated with sensible heat flux and net radiation, whereas the correlation to latent heat flux shows a hysteresis effect. The growing MLH follows the increasing latent heat flux, but the MLH decays in the afternoon even when the latent heat flux is still present and does not decrease with a similar rate.
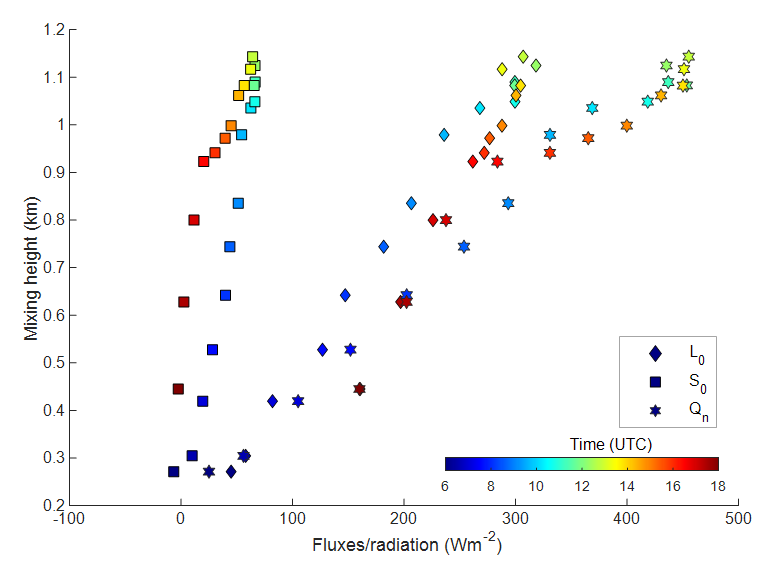
Figure 7Correlation of the mixing layer height MLH with the surface sensible and latent heat fluxes (S0 and L0) and the net radiation (Qn). The color indicates the time of the day.
This example illustrates the use of a long-term dataset to evaluate statistics and relationships between variables of different compartments like atmosphere and the land surface. Such relationships are the first step to develop new parameterizations or metrics for the description of land surface models or to test existing models (as outlined in LAFO objective 3).
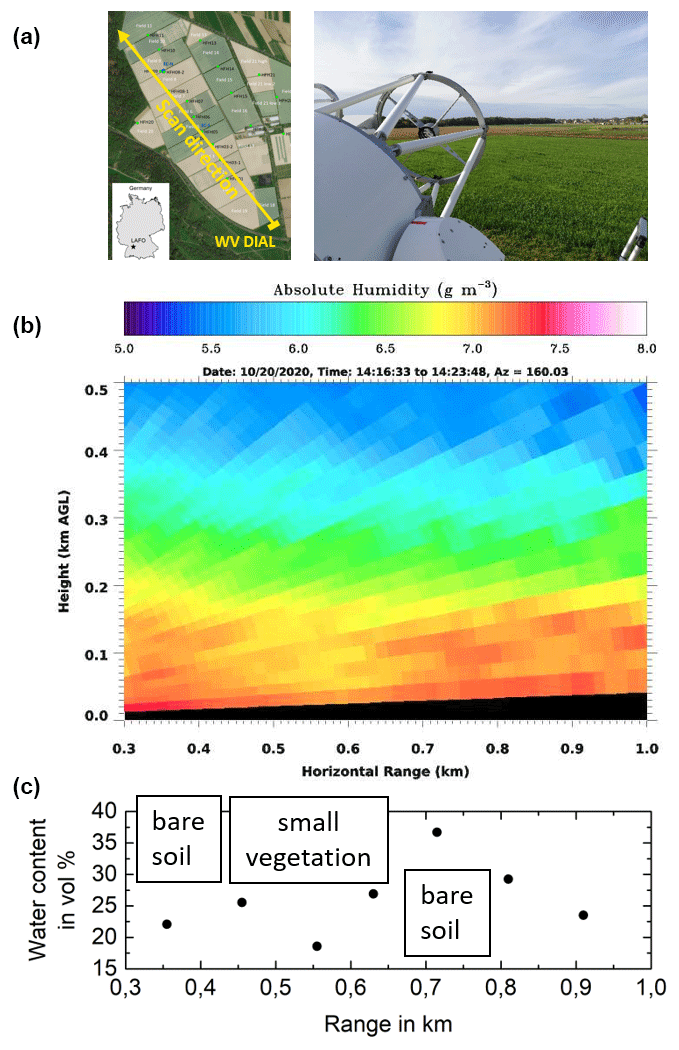
Figure 8Scanning WV DIAL measurements over the agricultural field of Heidfeldhof on 20 October 2020 between 14:23 and 14:31 UTC. Panel (a) shows the scan direction to the northwest with a picture from the scanner over the agricultural fields. Panel (b) gives the humidity field in the lowest 0.5 km above ground (with respect to the altitude of the lidar site). Panel (c) shows the soil water content values in 40 cm depth from WaTSeN along the scan direction. The basemap source for (a) is from Esri, DigitalGlobe, GeoEye, Earthstar Geographics, CNES/Airbus DS, USDA, USGS, AeroGRID, IGN, and the GIS User Community.
4.3 Scanning lidar observations
To observe the direct link between atmosphere and land surface we make use of the scanning capability of our lidar instruments. With low-elevation scanning lidar measurements we are able to observe surface layer profiles of horizontal wind, humidity content and temperature (Späth et al., 2022a). Figure 8 demonstrates humidity measurements with the scanning WV DIAL across the agricultural fields in the northwestern direction. The scan direction and a photograph are shown in Fig. 8a. For the measurement the lidar scanning unit (Fig. 8a) moved with 0.2∘ s−1 for a 90∘ angle range, and the data were analyzed with 10 s and 67.5 m temporal and spatial resolutions, respectively. The measurement was performed on 20 October 2020 at 14:16 UTC. The plot in Fig. 8b shows four layers in the lowest 0.5 km, of which the highest WV content is found in the lowest layer close to the ground with decreasing humidity content in the layers above. The lowest layer shows spatial variations along the scan axis with a lower humidity content at 500 to 600 m and an increase at 650 m. It is noteworthy that the high resolution of the WV DIAL measurement means that it is as sensitive to resolve variabilities of less than 1 g m−3 as it is to higher values. As the atmosphere is moistening from the surface, we can relate the structures close to the surface to land surface properties as explained by Späth et al. (2016). Being already in autumn, most of the fields were harvested and we were thus able to make use of the WaTSeN stations. Here we measure the water content of the soil as an indication for the potential of evaporation and transpiration at the land surface. In Fig. 8c, the soil water content of the WaTSeN stations HFH 1–9 is given with respect to the distance to the WV DIAL. The course of the soil water content in Fig. 8c shows a minimum at 550 m distance and a maximum water content at 700 m. This agrees with the behavior of the atmospheric humidity observed with the lidar in the atmosphere above.
In the region with low atmospheric humidity, inter-tillage in a small growing stage was present on the fields below. Closer and further away, the fields were made up of bare soil where higher evaporation is enabled according to the higher soil water content. This observation displays how heterogenic landscapes and corresponding atmospheric structures can be observed with scanning lidars and the soil sensor network within the LAFO instrumentation. These kinds of observations allow for work on LAFO objective 2 regarding surface fluxes in heterogeneous terrain.
Important topics in L–A feedback research are water and energy balances and heterogeneities of fluxes at the land surface and in the ABL. To target these questions, the land–atmosphere feedback observatory LAFO has been installed as the first GEWEX LAFO. LAFO is dedicated to L–A feedback research, is located in southwestern Germany in a midlatitude continental climate, and demonstrates the GLASS panel proposed instrumentation allowing comprehensive and high-resolution measurements from the bedrock to the lower free troposphere. Grouped into three components (atmosphere, soil and land surface, and vegetation), the LAFO observation strategy aims for simultaneous measurements in all three compartments. For this reason, the LAFO sensor synergy contains lidar systems to measure the atmospheric key variables of humidity, temperature and wind. At the land surface, two EC stations are operated to record the energy distribution of radiation, sensible, latent and ground heat fluxes. Profiles of soil water content, soil temperature and matric potential are measured in the soil under the EC stations. With WaTSeN the soil water and temperature are monitored in the agricultural investigation area. The vegetation status is registered by crop height, LAI measurements and phenological growth stage (BBCH).
The observations in LAFO are organized into those from operational measurements and those from intensive observation periods (IOPs). Operational measurements aim for long time series datasets to investigate statistics like the demonstrated correlation between MLH and surface fluxes. Furthermore, the long-term datasets from the EC stations are interesting to use for machine learning approaches to investigate new SL relationships, as demonstrated by Wulfmeyer et al. (2022). During IOPs, non-automated instruments complement the operational instrumentation for extended analysis, e.g., analysis of sensible and latent heat fluxes in the ABL (with humidity and temperature measurements from ARTHUS) or SL observations of humidity (with the scanning capability of the WV DIAL) to relate atmospheric moisture distribution to soil water structures. The three measurement examples illustrate how the LAFO instrumentation will be used to target the three LAFO objectives to investigate LA feedback.
Further, some of LAFO's measurement technology has significant commercialization potential. In particular, the development of compact and operational water vapor and temperature profilers (ARTHUS, Lange et al., 2019; NCAR DIAL, Spuler et al., 2015) with high resolution and accuracy has long been requested for use in national and international networks to improve weather forecasting (Adam et al., 2016; Weckwerth et al., 2016; Thundathil et al., 2020, 2021), climate monitoring, verification of models and satellite measurements, and data assimilation. LAFO can serve as a platform to test and develop new devices of this kind and support the GLASS panel vision to setup GLAFOs in all climate regions.
In the upcoming months and years, the observational dataset will not only continuously grow but also be made publicly available. Our database is based on the available open-source data portal software of TEODOOR (Kunkel et al., 2013) and connected to the European Network of Hydrological Observatories (ENOHA, https://enoha.eu/, last access: 19 January 2023) and allows access to and visualization of quality-controlled time series of EC station data and WaTSeN data. Later the 2D datasets from the DLs and the DCR will also be accessible. Until then, near-real-time time–height cross section plots of DL and DCR data are available on the LAFO website (http://lafo.uni-hohenheim.de/en, last access: 19 January 2023). In addition to the observations, model runs of large eddy simulations will be prepared for the LAFO region and performed with different configurations of the Weather Research and Forecast (WRF) model. With respect to model efforts, LAFO data can be used for model evaluation, process studies or data assimilation ideas.
The presented data are available under https://doi.org/10.5281/zenodo.7437486 (Späth et al., 2022b). All raw data can be provided by the corresponding authors upon request.
VW, AB and TS designed the observation strategy, and FS, VR, TKDW, SM, JI and DL carried out the observation. FS, VR, TKDW, SM, DL and SSA analyzed the data. FS, VR and TKDW prepared the manuscript with contributions from all co-authors.
The contact author has declared that none of the authors has any competing interests.
Publisher's note: Copernicus Publications remains neutral with regard to jurisdictional claims in published maps and institutional affiliations.
We thank the Carl Zeiss Foundation for funding the setup phase of LAFO as part of its program to strengthen research infrastructures at universities. Further, we kindly thank Herbert Stelz, Stefan Pilz, Timo Keller, Thomas Schreiber, Christian Schade, Jacky Schulz and Arne Poyda for their different levels of support and measurements.
This paper was edited by Fernando Nardi and reviewed by Manuel Helbig and one anonymous referee.
Adam, S., Behrendt, A., Schwitalla, T., Hammann, E., and Wulfmeyer, V.: First assimilation of temperature lidar data into a numerical weather prediction model: Impact on the simulation of the temperature field, inversion strength, and planetary boundary layer depth. Q. J. Roy. Meteorol. Soc., 142, 2882–2896, https://doi.org/10.1002/qj.2875, 2016.
Anderegg, W. R. L., Anderegg, L. D. L., Kerr, K. L., and Trugman, A. T.: Widespread drought-induced tree mortality at dry range edges indicates that climate stress exceeds species' compensating mechanisms, Global Change Biol., 25, 3793–3802, https://doi.org/10.1111/gcb.14771, 2019.
Baldocchi, D., Falge, E., Gu, L., Olson, R., Hollinger, D., Running, S., Anthoni, P., Bernhofer, Ch., Davis, K., Evans, R., Fuentes, J., Goldstein, A., Katul, G., Law, B., Lee, X., Malhi, Y., Meyers, T., Munger, W., Oechel, W., Paw U, K. T., Pilegaard, K., Schmid, H. P., Valentini, R., Verma, S., Vesala, T., Wilson, K., and Wofsy, S.: FLUXNET: A New Tool to Study the Temporal and Spatial Variability of Ecosystem-Scale Carbon Dioxide, Water Vapor, and Energy Flux Densities, B. Am. Meteorol. Soc., 82, 2415–2434, https://doi.org/10.1175/1520-0477(2001)082<2415:FANTTS>2.3.CO;2, 2001.
Behrendt, A., Wulfmeyer, V., Hammann, E., Muppa, S. K., and Pal, S.: Profiles of second- to fourth-order moments of turbulent temperature fluctuations in the convective boundary layer: first measurements with rotational Raman lidar, Atmos. Chem. Phys., 15, 5485–5500, https://doi.org/10.5194/acp-15-5485-2015, 2015.
Behrendt, A., Wulfmeyer, V., Senff, C., Muppa, S. K., Späth, F., Lange, D., Kalthoff, N., and Wieser, A.: Observation of sensible and latent heat flux profiles with lidar, Atmos. Meas. Tech., 13, 3221–3233, https://doi.org/10.5194/amt-13-3221-2020, 2020.
Betts, R. A., Cox, P. M., Collins, M., Harris, P. P., Huntingford, C., and Jones, C. D.: The role of ecosystem-atmosphere interactions in simulated Amazonian precipitation decrease and forest dieback under global climate warming, Theor. Appl. Climatol., 78, 157–175, https://doi.org/10.1007/s00704-004-0050-y, 2004.
Betts, R. A., Boucher, O., Collins, M., Cox, P. M., Falloon, P. D., Gedney, N., Hemming, D. L., Huntingford, C., Jones, C. D., Sexton, D. M. H., and Webb, M. J.: Projected increase in continental runoff due to plant responses to increasing carbon dioxide, Nature, 448, 1037–1041, https://doi.org/10.1038/nature06045, 2007.
Bonin, T. A., Choukulkar, A., Brewer, W. A., Sandberg, S. P., Weickmann, A. M., Pichugina, Y. L., Banta R. M., Oncley, S. P., and Wolfe, D. E.: Evaluation of turbulence measurement techniques from a single Doppler lidar, Atmos. Meas. Tech., 10, 3021–3039, https://doi.org/10.5194/amt-10-3021-2017, 2017.
Bonin, T. A., Carroll, B. J., Hardesty, R. M., Brewer, W. A., Hajny, K., Salmon, O. E., and Shepson, P. B.: Doppler Lidar Observations of the Mixing Height in Indianapolis Using an Automated Composite Fuzzy Logic Approach, J. Atmos. Ocean. Tech., 35, 473-490, https://doi.org/10.1175/JTECH-D-17-0159.1, 2018.
Branch, O. and Wulfmeyer, V.: Deliberate enhancement of rainfall using desert plantations, P. Natl. Acad. Sci. USA, 116, 18841–18847, https://doi.org/10.1073/pnas.1915645116, 2019.
Busemeyer, L., Mentrup, D., Möller, K., Wunder, E., Alheit, K., Hahn, V., Maurer, H. P., Reif, J. C., Würschum, T., Müller, J., Rahe, F., and Ruckelshausen, A.: BreedVision – A Multi-Sensor Platform for Non-Destructive Field-Based Phenotyping in Plant Breeding, Sensors, 13, 2830–2847, https://doi.org/10.3390/s130302830, 2013.
Chen, L. and Dirmeyer, P. A.: Impacts of land-use/land-cover change on afternoon precipitation over North America, J. Climate, 30, 2121–2140, https://doi.org/10.1175/JCLI-D-16-0589.1, 2017.
Choukulkar, A., Brewer, W. A., Sandberg, S. P., Weickmann, A., Bonin, T. A., Hardesty, R. M., Lundquist, J. K., Delgado, R., Iungo, G. V., Ashton, R., Debnath, M., Bianco, L., Wilczak, J. M., Oncley, S., and Wolfe, D.: Evaluation of single and multiple Doppler lidar techniques to measure complex flow during the XPIA field campaign, Atmos. Meas. Tech., 10, 247–264, https://doi.org/10.5194/amt-10-247-2017, 2017.
Davin, E. L., Seneviratne, S. I., Ciais, P., Olioso, A., and Wang, T.: Preferential cooling of hot extremes from cropland albedo management, P. Natl. Acad. Sci. USA, 111, 9757–9761, https://doi.org/10.1073/pnas.1317323111, 2014.
Davin, E. L., Rechid, D., Breil, M., Cardoso, R. M., Coppola, E., Hoffman, P., Jach, L. L., Katragkou, E., de Noblet-Ducoudré, N., Radke, K., Raffa, M., Soares, P. M. M., Sofiadis, G., Strada, S., Strandberg, G., Tölle, M. H., Warrach-Sagi, K., and Wulfmeyer, V.: Biogeophysical impacts of forestation in Europe: First results from the LUCAS Regional Climate Model intercomparison, Earth Syst. Dynam., 11, 183–200, https://doi.org/10.5194/esd-11-183-2020, 2020.
Devanand, A., Huang, M., Lawrence, D. M., Zarzycki, C. M., Feng, Z., Lawrence, P. J., Qian, Y., and Yang, Z.: Land use and land cover change strongly modulates land–atmosphere coupling and warm-season precipitation over the central United States in CESM2-VR, J. Adv. Model. Earth Syst., 12, e2019MS001925, https://doi.org/10.1029/2019MS001925, 2020.
Dirmeyer, P. A.: The cusp of major progress in predicting land–atmosphere interactions, GEWEX News, 24, 15–18, 2014.
Dirmeyer, P. A., Cash, B. A., Kinter Ill, J. L., Stan, C., Jung, T., Marx, L., Towers, P., Wedi, N., Adams, J. M., Altshuler, E. L., Huang, B., Jin, E. K., and Manganello, J.: Evidence for enhanced land–atmosphere feedback in a warming climate, J. Hydrometeorol., 13, 981–995, https://doi.org/10.1175/JHM-D-11-0104.1, 2012.
Dirmeyer, P. A., Chen, L., Wu, J., Shin, C., Huang, B., Cash, B. A., Bosilovich, M. G., Mahanama, S., Koster, R. D., Santanello, J. A., Ek, M. B., Balsamo, G., Dutra, E., and Lawrence, D. M., Verification of Land–Atmosphere Coupling in Forecast Models, Reanalyses, and Land Surface Models Using Flux Site Observations, J. Hydrometeorol., 19, 375–392, https://doi.org/10.1175/JHM-D-17-0152.1, 2018.
Ek, M. and Holtslag, A. A. M.: Influence of soil moisture on boundary layer cloud development, J. Hydrometeorol., 5, 86–99, https://doi.org/10.1175/1525-7541(2004)005<0086:IOSMOB>2.0.CO;2, 2004.
Franz, D., Acosta, M., Altimir, N., Arriga, N., Arrouays, D., Aubinet, M., Aurela, M., Ayres, E., López-Ballesteros, A., Barbaste, M., Berveiller, D., Biraud, S., Boukir, H., Brown, T., Brümmer, C., Buchmann, N., Burba, G., Carrara, A., Cescatti, A., Ceschia, E., Clement, R., Cremonese, E., Crill, P., Darenova, E., Dengel, S., D'Odorico, P., Filippa, G., Fleck, S., Fratini, G., Fuß, R., Gielen, B., Gogo, S., Grace, J., Graf, A., Grelle, A., Gross, P, Grünwald, T., Haapanala, S., Hehn, M., Heinesch, B., Heiskanen, J., Herbst, M., Herschlein, C., Hörtnagl, L., Hufkens, K., Ibrom, A., Jolivet, C., Joly, L, Jones, M., Kiese, R., Klemedtsson, L., Kljun, N., Klumpp, K., Kolari, P., Kolle, O., Kowalski, A., Kutsch, W., Laurila, T., de Ligne, A., Linder, S., Lindroth, A., Lohila, A., Longdoz, B., Mammarella, I., Manise, T., Maraň'on Jiménez, S., Matteucci, G., Mauder, M., Meier, P., Merbold, L., Mereu, S., Metzger, S., Migliavacca, M., Mölder, M., Montagnani, L., Moureaux, C., Nelson, D., Nemitz, E., Nicolini, G., Nilsson, M. B., Op de Beeck, M., Osborne, B., Löfvenius, M. O., Pavelka, M., Peichl, M., Peltola, O., Pihlatie, M., Pitacco, A., Pokorný, R., Pumpanen, J., Ratié, C., Rebmann, C., Roland, M., Sabbatini, S., Saby, N. P. A., Saunders, M., Schmid, H. P., Schrumpf, M., Sedlák, P., Serrano Ortiz, P., Siebicke, L., vSigut, L., Silvennoinen, H., Simioni, G., Skiba, U., Sonnentag, O., Soudani, K., Soulé, P., Steinbrecher, R., Tallec, T., Thimonier, A., Tuittila, E.-S., Tuovinen, J.-P., Vestin, P., Vincent, G., Vincke, C., Vitale, D., Waldner, P., Weslien, P., Wingate, L., Wohlfahrt, G., Zahniser, M., and Vesala, T.: Towards long-term standardised carbon and greenhouse gas observations for monitoring Europe's terrestrial ecosystems: a review, Int. Agrophys., 32, 439–455, https://doi.org/10.1515/intag-2017-0039, 2018.
Gayler, S., Ingwersen, J., Priesack, E., Wöhling, T., Wulfmeyer, V., and Streck, T.: Assessing the relevance of sub surface processes for the simulation of evapotranspiration and soil moisture dynamics with CLM3.5: Comparison with field data and crop model simulations, Environ. Earth Sci., 69, 415–427, https://doi.org/10.1007/s12665-013-2309-z, 2013.
Gayler, S., Wöhling, T., Grzeschik, M., Ingwersen J., Wizemann, H.-D., Warrach-Sagi, K., Högy, P., Attinger, S., Streck, T., and Wulfmeyer, V.: Incorporating dynamic root growth enhances the performance of Noah-MP ensemble simulations at two contrasting winter wheat field sites, Water Resour. Res., 50, 1337–1356, https://doi.org/10.1002/2013WR014634, 2014.
Geipel, J., Link, J., and Claupein, W.: Combined Spectral and Spatial Modeling of Corn Yield Based on Aerial Images and Crop Surface Models Acquired with an Unmanned Aircraft System, Remote Sens., 6, 10335–10355, https://doi.org/10.3390/rs61110335, 2014.
Gentine, P., Holtslag, A. A. M., D'Andrea, F., and Ek, M.: Surface and Atmospheric Controls on the Onset of Moist Convection over Land, J. Hydrometeorol., 14, 1443–1462, https://doi.org/10.1175/JHM-D-12-0137.1, 2013.
Görsdorf, U., Lehmann, V., Bauer-Pfundstein, M., Peters, G., Vavriv, D., Vinogradov, V., and Volkov, V: A 35-GHz Polarimetric Doppler Radar for Long-Term Observations of Cloud Parameters – Description of System and Data Processing, J. Atmos. Ocean. Tech., 32, 675-690, https://doi.org/10.1175/JTECH-D-14-00066.1, 2015.
Hammann, E., Behrendt, A., Le Mounier, F., and Wulfmeyer, V.: Temperature profiling of the atmospheric boundary layer with rotational Raman lidar during the HD(CP)2 Observational Prototype Experiment, Atmos. Chem. Phys., 15, 2867–2881, https://doi.org/10.5194/acp-15-2867-2015, 2015.
Helbig, M., Gerken, T., Beamesderfer, E. R., Baldocchi, D. D., Banerjee, T., Biraud, S. C., Brown, W. O. J., Brunsell, N. A., Burakowski, E. A., Burns, S. P., Butterworth, B. J., Chan, W. S., Davis, K. J., Desai, A. R., Fuentes, J. D., Hollinger, D. Y., Kljun, N., Mauder, M., Novick, K. A., Perkins, J. M., Rahn, D. A., Rey-Sanchez, C., Santanello, J. A., Scott, R. L., Seyednasrollah, B., Stoy, P. C., Sullvan, R. C., Vilà-Guerau de Arellano, J., Wharton, S., Yi, C., and Richardson, A. D.: Integrating continuous atmospheric boundary layer and tower-based flux measurements to advance understanding of land–atmosphere interaction, Agr. Forest Meteorol., 307, 108509, https://doi.org/10.1016/j.agrformet.2021.108509, 2021.
Holt, T. R., Niyogi, D., Chen, F., Manning, K., LeMone, M. A., and Qureshi, A.: Effect of land–atmosphere interactions on the IHOP 24–25 May 2002 convection case, Mon. Weather Rev., 134, 113–133, https://doi.org/10.1175/MWR3057.1, 2006.
Imukova, K., Ingwersen, J., Hevart, M., and Streck, T.: Energy balance closure on a winter wheat stand: Comparing the eddy covariance technique with the soil water balance method, Biogeosciences, 13, 63–75, https://doi.org/10.5194/bg-13-63-2016, 2016.
Ingwersen, J., Imukova, K., Högy, P., and Streck, T.: On the use of the post-closure methods uncertainty band to evaluate the performance of land surface models against eddy covariance flux data, Biogeosciences 12, 2311–2326, https://doi.org/10.5194/bg-12-2311-2015, 2015.
IPCC: Summary for Policymakers, in: Climate Change 2021: The Physical Science Basis, Contribution of Working Group I to the Sixth Assessment Report of the Intergovernmental Panel on Climate Change, edited by: Masson-Delmotte, V., Zhai, P., Pirani, A., Connors, S. L., Péan, C., Berger, S., Caud, N., Y Chen, Y., Goldfarb, L., Gomis, M. I., Huang, M., Leitzell, K., Lonnoy, E., Matthews, J. B. R., Maycock, T. K., Waterfield, T., Yelekçi,O., Yu, R., and Zhou, B., Cambridge University Press, https://www.ipcc.ch/report/ar6/wg1/downloads/report/IPCC_AR6_WGI_SPM.pdf (last access: 19 January 2023), 2021.
Jacob, D., Teichmann, C., Sobolowski, S., Katragkou, E., Anders, I., Belda, M., Benestad, R., Bobern, F., Buonomo, E., Cardoso, R. M., Casanueva, A., Christensen, O. B., Hesselbjerg Christensen, J., Coppola, E., De Cruz, L., Davin, E. L., Dobler, A., Domínguez, M., Fealy, R., Fernandez, J., Gaertner, M. A., Garcia-Díez, M., Giorgi, F., Gobiet, A., Goergen, K., Gómez-Navarro, J. J., González Alemán, J. J., Gutiérrez, C., Gutiérrez, J. M., Güttler, I., Haensler, A., Halenka, T., Jerez, S., Jiménez-Guerrero, P., Jones, R. G., Keuler, K., Kjellström, E., Knist, S., Kotlarski, S., Maraun, D., van Meijgaard, E., Mercogliano, P., Montávez, J. P., Navarra, A., Nikulin, G., de Noblet-Ducoudré, N., Panitz, H.-J., Pfeifer, S., Piazza, M., Pichellli, E., Pietikäinen, J.-P., Prein, A. F., Preuschmann, S., Rechid, D., Rockel, B., Romera, R., Sánchez, E., Sieck, K., Soares, P. M. M., Somot, S., Srnec, L., Lund Sørland, S., Termonia, P., Truhetz, H., Vautard, R., Warrach-Sagi, K., and Wulfmeyer, V.: Regional climate downscaling over Europe: perspectives from the EURO-CORDEX community, Reg. Environ. Change, 20, 51, https://doi.org/10.1007/s10113-020-01606-9, 2020.
Jaeger, E. B. and Seneviratne, S. I.: Impact of soil moisture–atmosphere coupling on European climate extremes and trends in a regional climate model, Clim. Dynam., 36, 1919–1939, https://doi.org/10.1007/s00382-010-0780-8, 2011.
Kunkel, R., Sorg, J., Eckardt, R., Kolditz, O., Rink, K., and Vereecken, H.: TEODOOR: a distributed geodata infrastructure for terrestrial observation data, Environ. Earth Sci., 69, 507–521, https://doi.org/10.1007/s12665-013-2370-7, 2013.
Kunz, M., Abbas, S. S., Bauckholt, M., Böhmländer, A., Feuerle, T., Gasch, P., Glaser, C., Groß, J., Hajnsek, I., Handwerker, J., Hase, F., Khordakova, D., Knippertz, P., Kohler, M., Lange, D., Latt, M., Laube, J., Martin, L., Mauder, M., Möhler, O., Mohr, S., Reitter, R. W., Rettenmeier, A., Rolf, C., Saathoff, H., Schrön, M., Schütze, C., Spahr, S., Späth, F., Vogel, F., Völksch, I., Weber, U., Wieser, A., Wilhelm, J., Zhang, H., and Dietrich, P.: Swabian MOSES 2021: An interdisciplinary field campaign for investigating convective storms and their event chains, Front. Earth Sci., 10, 999593, https://doi.org/10.3389/feart.2022.999593, 2022.
Lange, D., Behrendt, A., and Wulfmeyer, V.: Compact operational tropospheric water vapor and temperature Raman Lidar with turbulence resolution, Geophys. Res. Lett., 46, 14844–14853, https://doi.org/10.1029/2019GL085774, 2019.
Lee, T., Buban, M., Dumas, E., and Baker, C.: On the Use of Rotary-Wing Aircraft to Sample Near-Surface Thermodynamic Fields: Results from Recent Field Campaigns, Sensors, 19, 10, https://doi.org/10.3390/s19010010, 2019.
Lee, T. R. and Buban, M.: Evaluation of Monin–Obukhov and Bulk Richardson Parameterizations for Surface–Atmosphere Exchange, J. Appl. Meteorol. Clim., 59, 1091–1107, https://doi.org/10.1175/JAMC-D-19-0057.1, 2020.
Lenschow, D. H., Wulfmeyer, V., and Senff, C.: Measuring second-through fourth-order moments in noisy data, J. Atmos. Ocean. Tech., 17, 1330–1347, https://doi.org/10.1175/1520-0426(2000)017<1330:MSTFOM>2.0.CO;2, 2000.
Mauder, M. and Foken, T.: Documentation and Instruction Manual of the Eddy-Covariance Software Package TK3 (update), Arbeitsergebnisse, University of Bayreuth, Bayreuth, 62 pp., https://epub.uni-bayreuth.de/2130/1/ARBERG062.pdf (lLast access: 19 January 2023), 2015.
Mauder, M., Foken, T., and Cuxart, J.: Surface-Energy-Balance Closure over Land: A Review, Bound.-Lay. Meteorol., 177, 395–426, https://doi.org/10.1007/s10546-020-00529-6, 2020.
McDermid, S.S., Montes, C., Cook, B. I., Puma, M. J., Kiang, N. Y., and Aleinov, I.: The sensitivity of land–atmosphere coupling to modern agriculture in the Northern Midlatitudes, J. Climate, 32, 465–484, https://doi.org/10.1175/JCLI-D-17-0799.1, 2019.
Meier, U.: Growth stages of mono- and dicotyledonous plants: BBCH Monograph, Open Agrar Repositorium, JKI – Julius Kühn-Institut, Quedlinburg, Germany, https://doi.org/10.5073/20180906-074619, 2018.
Metzendorf, S.: 10 W-Average-Power single-frequency Ti:sapphire Laser with tuning agility – A breakthrough in high-resolution 3D water-vapor measurement, Dissertation, University of Hohenheim, Institute for Physics and Meteorology, Hohenheim, http://opus.uni-hohenheim.de/volltexte/2019/1558/ (last access: 19 January 2023), 2018.
Milovac, J., Warrach-Sagi, K., Behrendt, A., Späth, F., Ingwersen, J., and Wulfmeyer, V.: Investigation of PBL schemes combining the WRF model simulations with scanning water vapor differential absorption lidar measurements, J. Geophys. Res.-Atmos., 121, 624–649, https://doi.org/10.1002/2015JD023927, 2016.
Miralles, D., Teuling, A., van Heerwaarden, C. C., and Vilà-Guerau de Arellano, J.: Mega-heatwave temperatures due to combined soil desiccation and atmospheric heat accumulation, Nat. Geosci., 7, 345–349, https://doi.org/10.1038/ngeo2141, 2014.
Miralles, D. G., Gentine, P., Seneviratne, S. I., and Teuling, A. J.: Land-atmospheric feedbacks during droughts and heatwaves: state of the science and current challenges, Ann. NY Acad. Sci., 1436, 19–35, https://doi.org/10.1111/nyas.13912, 2019.
Muppa, S. K., Behrendt, A., Späth, F., Wulfmeyer, V., Metzendorf, S., and Riede, A.: Turbulent humidity fluctuations in the convective boundary layer: Case studies using water vapour differential absorption lidar measurements, Bound.-Lay. Meterorol., 158, 43–66, https://doi.org/10.1007/s10546-015-0078-9, 2016.
Nolan, C., Overpeck, J. T., Allen, J. R. M., Anderson, P. M., Betancourt, J. L., Binney, H. A., Brewer, S., Bush, M. B., Chase, B. M., Cheddadi, R., Djamali, M., Dodson, J., Edwards, M. E., Gosling, W. D., Haberle, S., Hotchkiss, S. C., Huntley, B., Ivory, S. J., Kershaw, A. P., Kim, S.-H., Latorre, C., Leydet, M., Lézine, A.-M., Liu, K.-B., Liu, Y., Lothkin, A. V., McGlone, M. S., Marchanz, R. A., Momohara, A., Moreno, P. I., Müller, S., Otto-Bliesner, B. L., Shen, C., Stevenson, J., Takahara, H., Tarasov, P. E., Tipton, J., Vincens, A., Weng, C., Xu, Q., Zheng, Z., and Jackson, S. T.: Past and future global transformation of terrestrial ecosystems under climate change, Science, 361, 920–923, https://doi.org/10.1126/science.aan5360, 2018.
Novick, K. A., Biederman, J. A., Desai, A. R., Litvak, M. E., Moore, D. J. P., Scott, R. L., and Torn, M. S.: The AmeriFlux network: A coalition of the willing, Agr. Forest Meteorol., 249, 444–456, https://doi.org/10.1016/j.agrformet.2017.10.009, 2018.
Pearson, G., Davies, F., and Collier, C.: An Analysis of the Performance of the UFAM Pulsed Doppler Lidar for Observing the Boundary Layer, J. Atmos. Ocean. Tech., 26, 240–250, https://doi.org/10.1175/2008JTECHA1128.1, 2009.
Poltoradnev, M., Ingwersen, J., and Streck, T.: Calibration and Application of Aquaflex TDT Soil Water Probes to Measure the Soil Water Dynamics of Agricultural Topsoil in Southwest Germany, J. Irrig. Drain. Eng., 141, 04014072, https://doi.org/10.1061/(asce)ir.1943-4774.0000838, 2015.
Radlach, M., Behrendt, A., and Wulfmeyer, V.: Scanning rotational Raman lidar at 355 nm for the measurement of tropospheric temperature fields, Atmos. Chem. Phys., 8, 159–169, https://doi.org/10.5194/acp-8-159-2008, 2008.
Santanello Jr., J. A., Dirmeyer, P. A., Ferguson, C. R., Findell, K. L., Tawfik, A. B., Berg, A., Ek, M., Gentine, P., Guillod, B. P., van Heerwaarden, C., Roundy, J., and Wulfmeyer, V.: Land–Atmosphere Interactions: The LoCo Perspective, B. Am. Meteorol. Soc., 99, 1253–1272, https://doi.org/10.1175/BAMS-D-17-0001.1, 2018.
Schutte, B.: Bestimmung von Bodenunterschieden durch Zugkraftmessungen bei der Bodenbearbeitung, Forschungsbericht Agrartechnik des Arbeitskreises Forschung und Lehre der VDI-MEG Nr. 429, Dissertation, University of Hohenheim, 2005.
Schwitalla, T. and Wulfmeyer, V.: Radar data assimilation experiments using the IPM WRF Rapid Update Cycle, Meteorol. Z., 23, 79–102, https://doi.org/10.1127/0941-2948/2014/0513, 2014.
Seneviratne, S., Lüthi, D., Litschi, M., and Schär, C.: Land–atmosphere coupling and climate change in Europe, Nature, 443, 205–209, https://doi.org/10.1038/nature05095, 2006.
Seneviratne, S. I., Corti, T., Davin, E. L., Hirschi, M., Jaeger, E. B., Lehner, I., Orlowsky, B., and Teuling, A. J.: Investigating soil moisture–climate interactions in a changing climate: A review, Earth-Sci. Rev., 99, 125–161, https://doi.org/10.1016/j.earscirev.2010.02.004, 2010.
Singh, D., McDermid, S. P., Cook, B. I., Puma, M. J., Nazarenko, L., and Kelley, M.: Distinct influences of land cover and land management on seasonal climate, J. Geophys. Res.-Atmos., 123, 12017–12039, https://doi.org/10.1029/2018JD028874, 2018.
Späth, F., Behrendt, A., Muppa, S. K., Metzendorf, S., Riede, A., and Wulfmeyer, V.: 3D water vapor field in the atmospheric boundary layer observed with scanning differential absorption lidar, Atmos. Meas. Tech., 9, 1701–1720, https://doi.org/10.5194/amt-9-1701-2016, 2016.
Späth, F., Behrendt, A., Brewer, W. A., Lange, D., Senff, C., Turner, D. D., Wagner, T., and Wulfmeyer, V.: Simultaneous observations of surface layer profiles of humidity, temperature, and wind using scanning lidar instruments, J. Geophys. Res.-Atmos., 127, e2021JD035697, https://doi.org/10.1029/2021JD035697, 2022a.
Späth, F., Rajtschan, V., Abbas, S. S., Lange, D., Weber, T. K. D., Morandage, S., Behrendt, A., Ingwersen, J., Streck, T., and Wulfmeyer, V.: Dataset for publication: The Land-Atmosphere Feedback Observatory: A New Observational Approach for Characterizing Land-Atmosphere Feedback (Version 1), Zenodo [data set], https://doi.org/10.5281/zenodo.7437486, 2022b.
Spuler, S. M., Repasky, K. S., Morley, B., Moen, D., Hayman, M., and Nehrir, A. R.: Field-deployable diode-laser-based differential absorption lidar (DIAL) for profiling water vapor, Atmos. Meas. Tech., 8, 1073–1087, https://doi.org/10.5194/amt-8-1073-2015, 2015.
Stevens, B., Bony, S., Farrell, D., Ament, F., Blyth, A., Fairall, C., Karstensen, J., Quinn, P. K., Speich, S., Acquistapace, C., Aemisegger, F., Albright, A. L., Bellenger, H., Bodenschatz, E., Caesar, K.-A., Chewitt-Lucas, R., de Boer, G., Delanoë, J., Denby, L., Ewald, F., Fildier, B., Forde, M., George, G., Gross, S., Hagen, M., Hausold, A., Heywood, K. J., Hirsch, L., Jacob, M., Jansen, F., Kinne, S., Klocke, D., Kölling, T., Konow, H., Lothon, M., Mohr, W., Naumann, A. K., Nuijens, L., Olivier, L., Pincus, R., Pöhlker, M., Reverdin, G., Roberts, G., Schnitt, S., Schulz, H., Siebesma, A. P., Stephan, C. C., Sullivan, P., Touzé-Peiffer, L., Vial, J., Vogel, R., Zuidema, P., Alexander, N., Alves, L., Arixi, S., Asmath, H., Bagheri, G., Baier, K., Bailey, A., Baranowski, D., Baron, A., Barrau, S., Barrett, P. A., Batier, F., Behrendt, A., Bendinger, A., Beucher, F., Bigorre, S., Blades, E., Blossey, P., Bock, O., Böing, S., Bosser, P., Bourras, D., Bouruet-Aubertot, P., Bower, K., Branellec, P., Branger, H., Brennek, M., Brewer, A., Brilouet , P.-E., Brügmann, B., Buehler, S. A., Burke, E., Burton, R., Calmer, R., Canonici, J.-C., Carton, X., Cato Jr., G., Charles, J. A., Chazette, P., Chen, Y., Chilinski, M. T., Choularton, T., Chuang, P., Clarke, S., Coe, H., Cornet, C., Coutris, P., Couvreux, F., Crewell, S., Cronin, T., Cui, Z., Cuypers, Y., Daley, A., Damerell, G. M., Dauhut, T., Deneke, H., Desbios, J.-P., Dörner, S., Donner, S., Douet, V., Drushka, K., Dütsch, M., Ehrlich, A., Emanuel, K., Emmanouilidis, A., Etienne, J.-C., Etienne-Leblanc, S., Faure, G., Feingold, G., Ferrero, L., Fix, A., Flamant, C., Flatau, P. J., Foltz, G. R., Forster, L., Furtuna, I., Gadian, A., Galewsky, J., Gallagher, M., Gallimore, P., Gaston, C., Gentemann, C., Geyskens, N., Giez, A., Gollop, J., Gouirand, I., Gourbeyre, C., de Graaf, D., de Groot, G. E., Grosz, R., Güttler, J., Gutleben, M., Hall, K., Harris, G., Helfer, K. C., Henze, D., Herbert, C., Holanda, B., Ibanez-Landeta, A., Intrieri, J., Iyer, S., Julien, F., Kalesse, H., Kazil, J., Kellman, A., Kidane, A. T., Kirchner, U., Klingebiel, M., Körner, M., Kremper, L. A., Kretzschmar, J., Krüger, O., Kumala, W., Kurz, A., L'Hégaret, P., Labaste, M., Lachlan-Cope, T., Laing, A., Landschützer, P., Lang, T., Lange, D., Lange, I., Laplace, C., Lavik, G., Laxenaire, R., Le Bihan, C., Leandro, M., Lefevre, N., Lena, M., Lenschow, D., Li, Q., Lloyd, G., Los, S., Losi, N., Lovell, O., Luneau, C., Makuch, P., Malinowski, S., Manta, G., Marinou, E., Marsden, N., Masson, S., Maury, N., Mayer, B., Mayers-Als, M., Mazel, C., McGeary, W., McWilliams, J. C., Mech, M., Mehlmann, M., Meroni, A. N., Mieslinger, T., Minikin, A., Minnett, P., Möller, G., Morfa Avalos, Y., Muller, C., Musat, I., Napoli, A., Neuberger, A., Noisel, C., Noone, D., Nordsiek, F., Nowak, J. L., Oswald, L., Parker, D. J., Peck, C., Person, R., Philippi, M., Plueddemann, A., Pöhlker, C., Pörtge, V., Pöschl, U., Pologne, L., Posyniak, M., Prange, M., Quiñones Meléndez, E., Radtke, J., Ramage, K., Reimann, J., Renault, L., Reus, K., Reyes, A., Ribbe, J., Ringel, M., Ritschel, M., Rocha, C. B., Rochetin, N., Röttenbacher, J., Rollo, C., Royer, H., Sadoulet, P., Saffin, L., Sandiford, S., Sandu, I., Schäfer, M., Schemann, V., Schirmacher, I., Schlenczek, O., Schmidt, J., Schröder, M., Schwarzenboeck, A., Sealy, A., Senff, C. J., Serikov, I., Shohan, S., Siddle, E., Smirnov, A., Späth, F., Spooner, B., Stolla, M. K., Szkółka, W., de Szoeke, S. P., Tarot, S., Tetoni, E., Thompson, E., Thomson, J., Tomassini, L., Totems, J., Ubele, A. A., Villiger, L., von Arx, J., Wagner, T., Walther, A., Webber, B., Wendisch, M., Whitehall, S., Wiltshire, A., Wing, A. A., Wirth, M., Wiskandt, J., Wolf, K., Worbes, L., Wright, E., Wulfmeyer, V., Young, S., Zhang, C., Zhang, D., Ziemen, F., Zinner, T., and Zöger, M.: EUREC4A, Earth Syst. Sci. Data, 13, 4067–4119, https://doi.org/10.5194/essd-13-4067-2021, 2021.
Thundathil, R., Schwitalla, T., Behrendt, A., Muppa, S. K., Adam, S., and Wulfmeyer, V.: Assimilation of lidar water vapour mixing ratio and temperature profiles into a convection-permitting model, J. Meteorol. Soc. Jpn., 98, 959–986, https://doi.org/10.2151/jmsj.2020-049, 2020.
Thundathil, R., Schwitalla, T., Behrendt, A., and Wulfmeyer, V.: Impact of assimilating lidar water vapour and temperature profiles with a hybrid ensemble transform Kalman filter: Three-dimensional variational analysis on the convection-permitting scale, Q. J. Roy. Meteorol. Soc., 147, 4163–4185, https://doi.org/10.1002/qj.4173, 2021.
Turner, D. D., Ferrare, R. A., Brasseur, L. A. H., Feltz, W. F., and Tooman, T. P.: Automated Retrievals of Water Vapor and Aerosol Profiles from an Operational Raman Lidar, J. Atmos. Ocean. Tech., 19, 37–50, https://doi.org/10.1175/1520-0426(2002)019<0037:AROWVA>2.0.CO;2, 2002.
Turner, D. D., Wulfmeyer, V., Berg, L. K., and Schween, J. H.: Water vapor turbulence profiles in stationary continental convective mixed layers, J. Geophys. Res., 119, 11151–11165, https://doi.org/10.1002/2014JD022202, 2014.
Van den Hurk, B., Doblas-Reye, F., Balsamo, G., Koster, R. D., Seneviratne, S. I., and Camargo Jr., H.: Soil moisture effects on seasonal temperature and precipitation forecast scores in Europe, Clim. Dynam., 38, 349–362, https://doi.org/10.1007/s00382-010-0956-2, 2012.
van Heerwaarden, C. C., Vilà-Guerau de Arellano, J., Moene, A. F., and Holtslag, A. A. M.: Interactions between dry-air entrainment, surface evaporation and convective boundary-layer development, Q. J. Roy. Meteorol. Soc., 135, 1277–1291, https://doi.org/10.1002/qj.431, 2009.
Vilà-Guerau de Arellano, J., Ouwersloot, H. G., Baldocchi, D., and Jacobs, C. M. J.: Shallow cumulus rooted in photosynthesis, Geophys. Res. Lett., 41, 1796–1802, https://doi.org/10.1002/2014GL059279, 2014.
Vogel, M. M., Orth, R., Cheruy, F., Hagemann, S., Lorenz, R., van den Hurk, B. J. J. M., and Seneviratne, S. I.: Regional amplification of projected changes in extreme temperatures strongly controlled by soil moisture-temperature feedbacks, Geophys. Res. Lett., 44, 1511–1519, https://doi.org/10.1002/2016GL071235, 2017.
Vogel, M. M., Zscheischler, J., and Seneviratne, S. I.: Varying soil moisture–atmosphere feedbacks explain divergent temperature extremes and precipitation projections in central Europe, Earth Syst. Dynam., 9, 1107–1125, https://doi.org/10.5194/esd-9-1107-2018, 2018.
Wagner, G., Wulfmeyer, V., Späth, F., Behrendt, A., and Schiller, M.: Performance and specifications of a pulsed high-power single-frequency Ti:Sapphire laser for water-vapor differential absorption lidar, Appl. Optics, 52, 2454–2469, https://doi.org/10.1364/AO.52.002454, 2013.
Warrach-Sagi, K., Schwitalla, T., Wulfmeyer, V., and Bauer, H.-S.: Evaluation of a climate simulation in Europe based on the WRF-N OAH Model System: precipitation in Germany, Clim. Dynam., 41, 755-774, https://doi.org/10.1007/s00382-013-1727-7, 2013.
Weber, T. K. D., Ingwersen, J., Högy, P., Poyda, A., Wizemann, H.-D., Demyan, M. S., Bohm, K., Eshonkulov, R., Gayler, S., Kremer, P., Laub, M., Nkwain, Y. F., Troost, C., Witte, I., Reichenau, T., Berger, T., Cadisch, G., Müller, T., Fangmeier, A., Wulfmeyer, V., and Streck, T.: Multi-site, multi-crop measurements in the soil–vegetation–atmosphere continuum: a comprehensive dataset from two climatically contrasting regions in southwestern Germany for the period 2009–2018, Earth Syst. Sci. Data, 14, 1153–1181, https://doi.org/10.5194/essd-14-1153-2022, 2022.
Weckwerth, T. M., Weber, K. J., Turner, D. D., and Spuler, S. M.: Validation of a Water Vapor Micropulse Differential Absorption Lidar (DIAL), J. Atmos. Ocean. Tech., 33, 2353–2372, https://doi.org/10.1175/JTECH-D-16-0119.1, 2016.
Wizemann, H.-D., Ingwersen, J., Högy, P., Warrach-Sagi, K., Streck, T., and Wulfmeyer, V.: Three year observations of water vapor and energy fluxes over agricultural crops in two regional climates of Southwest, Germany, Meteorol. Z., 24, 39–59, https://doi.org/10.1127/metz/2014/0618, 2015.
Wulfmeyer, V.: Investigations of humidity skewness and variance profiles in the convective boundary layer and comparison of the latter with large eddy simulation results, J. Atmos. Sci., 56, 1077–1087, https://doi.org/10.1175/1520-0469(1999)056<1077:IOHSAV>2.0.CO;2, 1999.
Wulfmeyer, V. and Henning-Müller, I.: The climate station of the University of Hohenheim: Analysis of Air Temperature and Precipitation Time Series Since 1878, Int. J. Climatol., 26, 113–138, https://doi.org/10.1002/joc.1240, 2005.
Wulfmeyer, V., Turner, D. D., Pal, S., and Wagner, E.: Can water vapour Raman lidar resolve profiles of turbulent variables in the convective boundary layer?, Bound.-Lay. Meteorol., 136, 253–284, https://doi.org/10.1007/s10546-010-9494-z, 2010.
Wulfmeyer, V., Hardesty, R. M., Turner, D. D., Behrendt, A., Cadeddu, M. P., Di Girolamo, P., Schlüssel, P., Van Baelen, J., and Zus, F.: A review of the remote sensing of lower-tropospheric thermodynamic profiles and its indispensable role for the understanding and the simulation of water and energy cycles, Rev. Geophys., 53, 819–895, https://doi.org/10.1002/2014RG000476, 2015.
Wulfmeyer, V., Muppa, S. K., Behrendt, A., Hammann, E., Späth, F., Sorbjan, Z., Turner, D. D., and Hardesty, R. M.: Determination of convective boundary layer entrainment fluxes, dissipation rates, and the molecular destruction of variances: Theoretical description and a strategy for its confirmation with a novel lidar system synergy, J. Atmos. Sci., 73, 667–692, https://doi.org/10.1175/JAS-D-14-0392.1, 2016.
Wulfmeyer, V. , Turner, D.D., Baker, B., Banta, R., Behrendt, A., Bonin, T., Brewer, W. A., Buban, M., Choukulkar, A., Dumas, E., Hardesty, R. M., Heus, T., Ingwersen, J., Lange, D., Lee, T. R., Metzendorf, S., Muppa, S. K., Meyers, T., Newsom, R., Osman, M., Raasch, S., Santanello, J., Senff, C., Späth, F., Wagner, T., and Weckwerth, T.: A New research approach for observing and characterizing Land–Atmosphere Feedback, B. Am. Meteorol. Soc., 99, 1639–1667, https://doi.org/10.1175/BAMS-D-17-0009.1, 2018.
Wulfmeyer, V., Späth, F., Behrendt, A., Jach, L., Warrach-Sagi, K., Ek, M., Turner, D. D., Senff, C., Ferguson, C. R., Santanello, J., Lee, T. R., Buban, M., and Verhoef, A.: The GEWEX Land–Atmosphere Feedback Observatory (GLAFO), GEWEX Quart., 30, 6–11, 2020.
Wulfmeyer, V., Pineda, J. V. M., Otte, S., Karlbauer, M., Butz, M. V., Lee, T. R., Buban, M., and Rajtschan, V.: Estimation of the surface fluxes for heat and momentum in unstable conditions with machine learning and similarity approaches for the LAFE data set, Bound-Lay. Meteorol., https://doi.org/10.1007/s10546-022-00761-2, in press, 2022.
Zacharias, S., Bogena, H., Samaniego, L., Mauder, M., Fuß, R., Pütz, T., Frenzel, M., Schwank, M., Baessler, C., Butterbach-Bahl, K., Bens, O., Borg, E., Brauer, A., Dietrich, P., Hajnsek, I., Helle, G., Kiese, R., Kunstmann, H., Klotz, S., Munch, J. C., Papen, H., Priesack, E., Schmid, H. P., Steinbrecher, R., Rosenbaum, U., Teutsch, G., and Vereecken, H.: A network of terrestrial environmental observatories in Germany, Vadose Zone J., 10, 955–973, https://doi.org/10.2136/vzj2010.0139, 2011.
Zhou, S., Park Williams, A., Berg, A. M., Cook, B. I., Zhang, Y., Hagemann, S., Lorenz, R., Seneviratne, S. I., and Gentine, P.: Land–atmosphere feedbacks exacerbate concurrent soil drought and atmospheric aridity, P. Natl. Acad. Sci. USA, 116, 18848–18853, https://doi.org/10.1073/pnas.1904955116, 2019a.
Zhou, S., Zhang, Y., Park Williams, A., and Gentine, P.: Projected increases in intensity, frequency, and terrestrial carbon costs of compound drought and aridity events, Sci. Adv., 5, eaau5740, https://doi.org/10.1126/sciadv.aau5740, 2019b.