the Creative Commons Attribution 4.0 License.
the Creative Commons Attribution 4.0 License.
 | 09 Oct 2024
Analysis of orientation errors in triaxial fluxgate sensors and research on their calibration methods
Xiujuan Hu
Shaopeng He
Xudong Zhao
Qin Tian
Alimjan Mamatemin
Pengkun Guo
Guoping Chang
Three-axis magnetic flux gate sensors are widely used in Chinese geomagnetic observatories, but due to their directional errors it is necessary to study error correction methods to improve measurement accuracy. Firstly, the mechanism of directional errors produced by three-axis magnetic flux gate sensors is analyzed, followed by the development of measurement tools for conducting directional error measurement experiments on the high-precision three-axis magnetic flux gate sensors of the Chinese FGM-01 series. Experimental results show that correcting the Z-axis and D-axis directional errors is essential. The observation data after error correction, whether in terms of the standard deviation of its all-day baseline values or the relative difference magnitude with the reference instrument, significantly decrease, demonstrating the clear correction effect and proving the effectiveness of this correction method.
- Article
(3274 KB) - Full-text XML
- BibTeX
- EndNote


Three-axis fluxgate sensors have the advantages of being high resolution, having low power consumption, and being of low cost, and they are widely used in measuring the geomagnetic field signal (Langel et al., 1988; Tohyama et al., 1988a, b; Ejiri et al., 1988; Crassidis et al., 2005). Currently, nearly 200 sets of three-axis fluxgate magnetometers, mainly GM4 type (Fig. 1a), GM4-XL type, and FGM-01 type (Fig. 1b), are installed in the Chinese geomagnetic observatories. Most observatories install two or more sets of such instruments for parallel observations, aiming to ensure the continuity and integrity of the observation data and to facilitate timely detection and identification of potential issues in the data. The ideal measurement value of a three-axis fluxgate sensor should be equal to the true value of the measured geomagnetic field variation (Luo et al., 2019; Wu, 2008). However, due to limitations in manufacturing and installation processes, errors such as non-orthogonality, zero offset, and temperature drift unavoidably exist in three-axis fluxgate sensors (Včelák et al., 2006; Foster and Elkaim, 2008; Pang et al., 2011). Studies have shown that these errors can lead to deviations in the sensor's measurement values from the true values of the measured geomagnetic field, significantly affecting its measurement accuracy. Therefore, it is of great significance to correct the errors of the sensor (Zhu et al., 2005; Li, 2008).
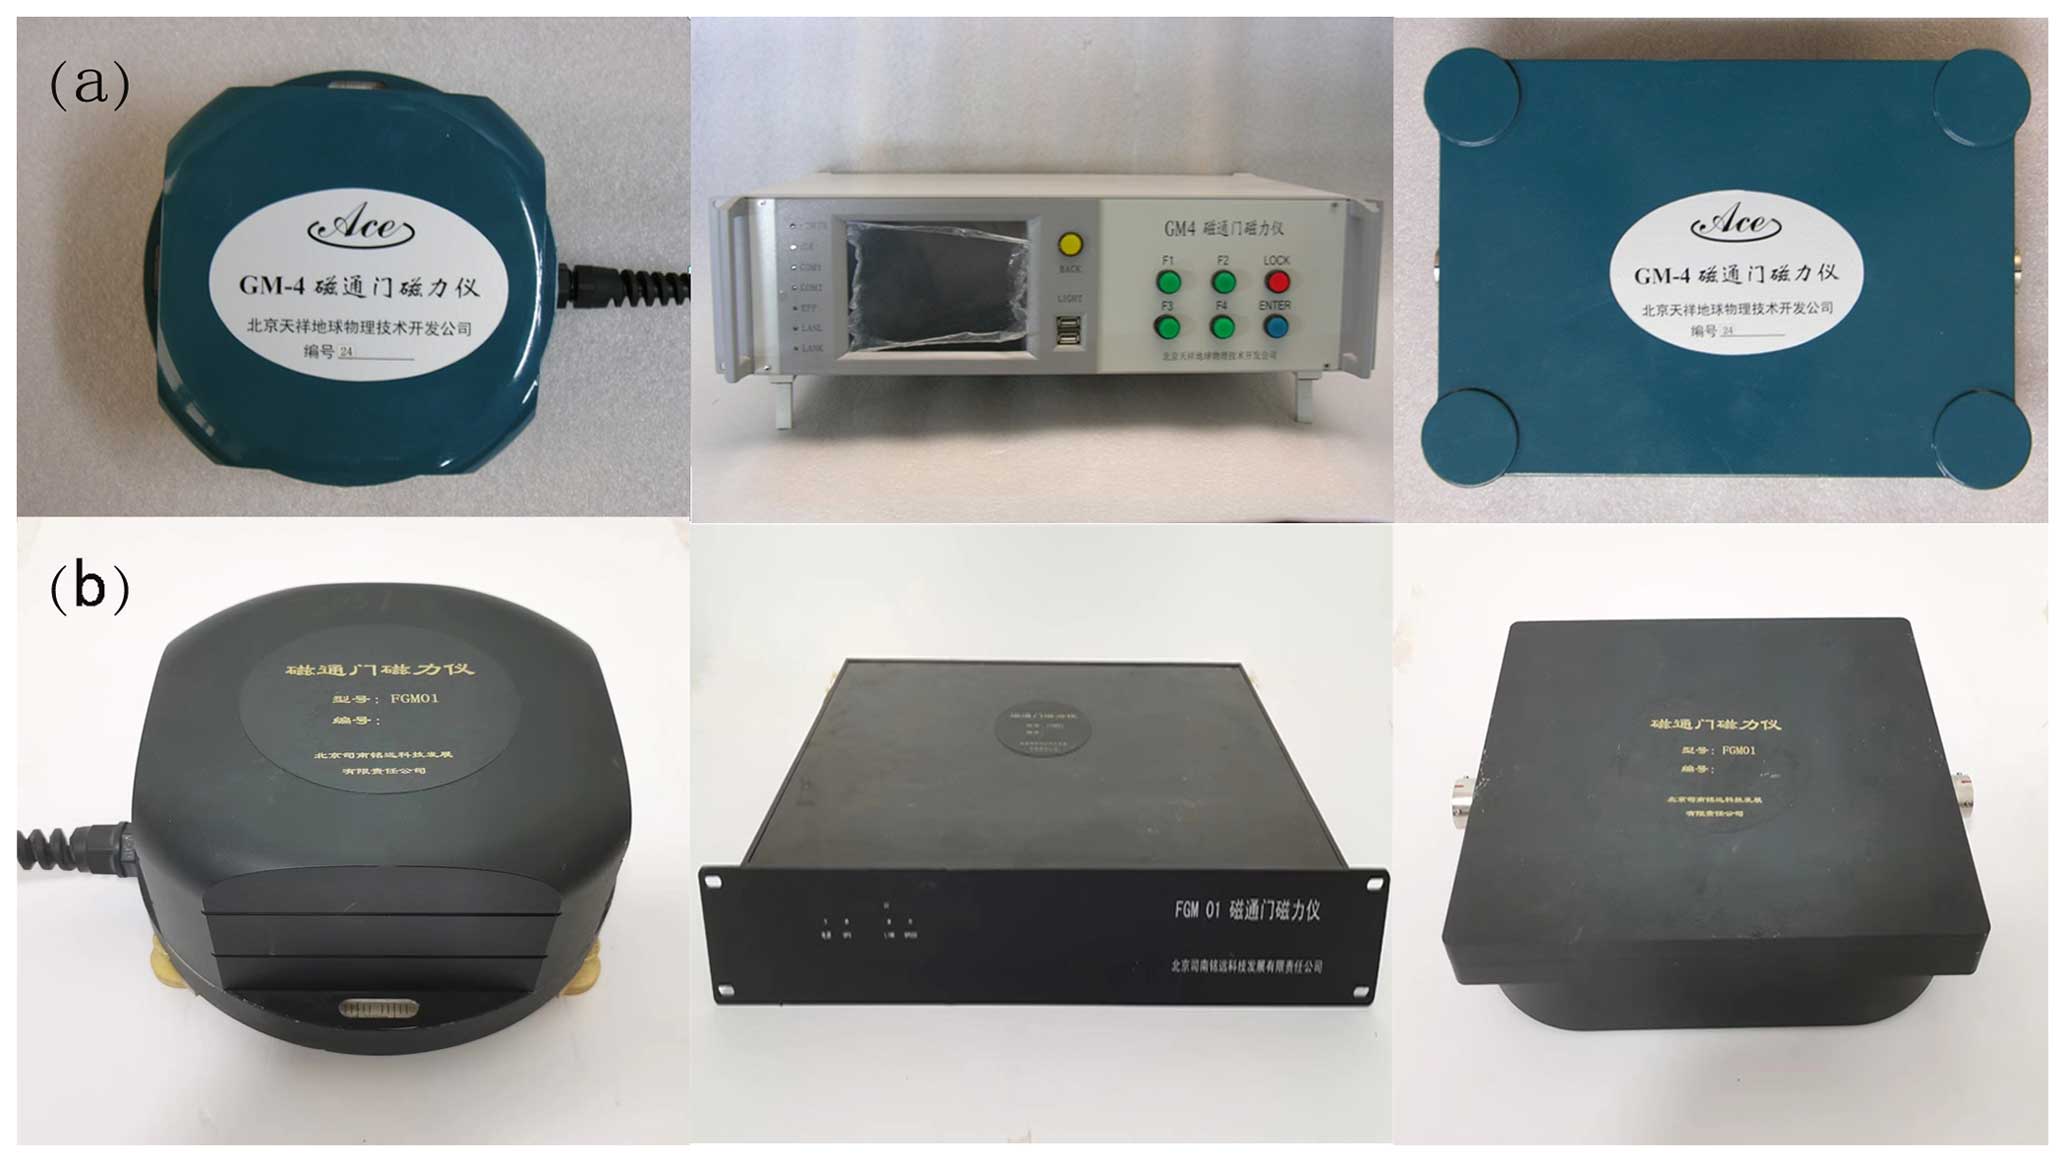
Figure 1Fluxgate magnetometers. (a) GM4 type fluxgate magnetometer. (b) FGM-01 type fluxgate magnetometer.
Research on the error of three-axis magnetic fluxgate sensors in the past has typically only considered the systematic error of the sensors (Liu et al., 2022), with relatively little study on the directional errors introduced during sensor installation. Wang et al. (2017) analyzed the variation patterns between the orientation of the instrument, the level of the base, and the observed data of each component of the geomagnetic field based on theoretical calculations and station experiments, providing quantitative relationships. Liu et al. (2019) established a three-axis calibration model for the magnetic fluxgate magnetometer, determined the attitude angles and scale factor coefficients of the instrument, and then corrected the actual observation data based on the calculation results. The author developed a measuring device in 2016 to measure and correct the directional errors of the D magnetic axis, eliminating the daily variation distortion recorded by the magnetic fluxgate magnetometer at Hong-shan Observatory (Hu et al., 2016). However, the aforementioned algorithms or measurements are somewhat difficult (Zhu, 2004) and not easy to implement or only focus on the method of correcting the directional errors of the sensor's D magnetic axis, without yet conducting research on correcting the directional errors of the Z magnetic axis, all of which have shortcomings that need improvement.
This study analyzes the mechanism of directional error generation of the three-axis magnetic flux gate sensor, measures the directional error of the sensor using homemade measurement tools, and corrects the measurement results when reorienting. Finally, by comparing the changes in the actual measurement data before and after correction, the correction effect is analyzed.
This article mainly analyzes the directional errors generated during the installation of a three-axis fluxgate magnetometer, ignoring the errors of the three-axis orthogonality. Therefore, during the experiment, it is assumed that the three axes of the fluxgate sensor are in a perfectly orthogonal ideal state. When installing the fluxgate instrument, a sensor that measures the declination angle D is usually used for orientation. Currently, Chinese geomagnetic observatories typically orient sensors in the following manner (referred to as the traditional orientation method). The first step is to select a day with calm magnetic fields and adjust the base angle screws of the sensor to center two mutually perpendicular bubbles, thereby determining the orientation of the Z magnetic axis. The second step is to rotate the sensor horizontally to control the output value of the magnetic declination angle D within the range of −50 to 50 nT, thus determining the orientation of the D magnetic axis. The orientation of the H magnetic axis is determined as the D magnetic axis is determined.
Since the three axes of the sensor are considered orthogonal, when the Z magnetic axis is perpendicular, it can be assumed that the H magnetic axis and D magnetic axis are in the horizontal plane, and this plane is defined as HOD (Wang et al., 2017). As shown in Fig. 2, due to the presence of the orientation error angle α, the measurement values of the two elements in the horizontal plane mutually include each other's components. This means that the measurement value of the D element is the sum of the projections of the real D element and the H element in its measurement direction, which is expressed as
Similarly, the measurement value of the H element is
where D0 and H0 are the values of the magnetic field D and H elements in the ideal coordinate system, and are the projections of the D element in the HOD plane when there is an orientation error angle α, and and are the projections of the H element in the HOD plane when there is an orientation error angle α. Since the value of the D element and α are relatively small, D0sin α can be omitted. Therefore, if there is an orientation error angle α, it has a greater impact on the recorded data of the D element.
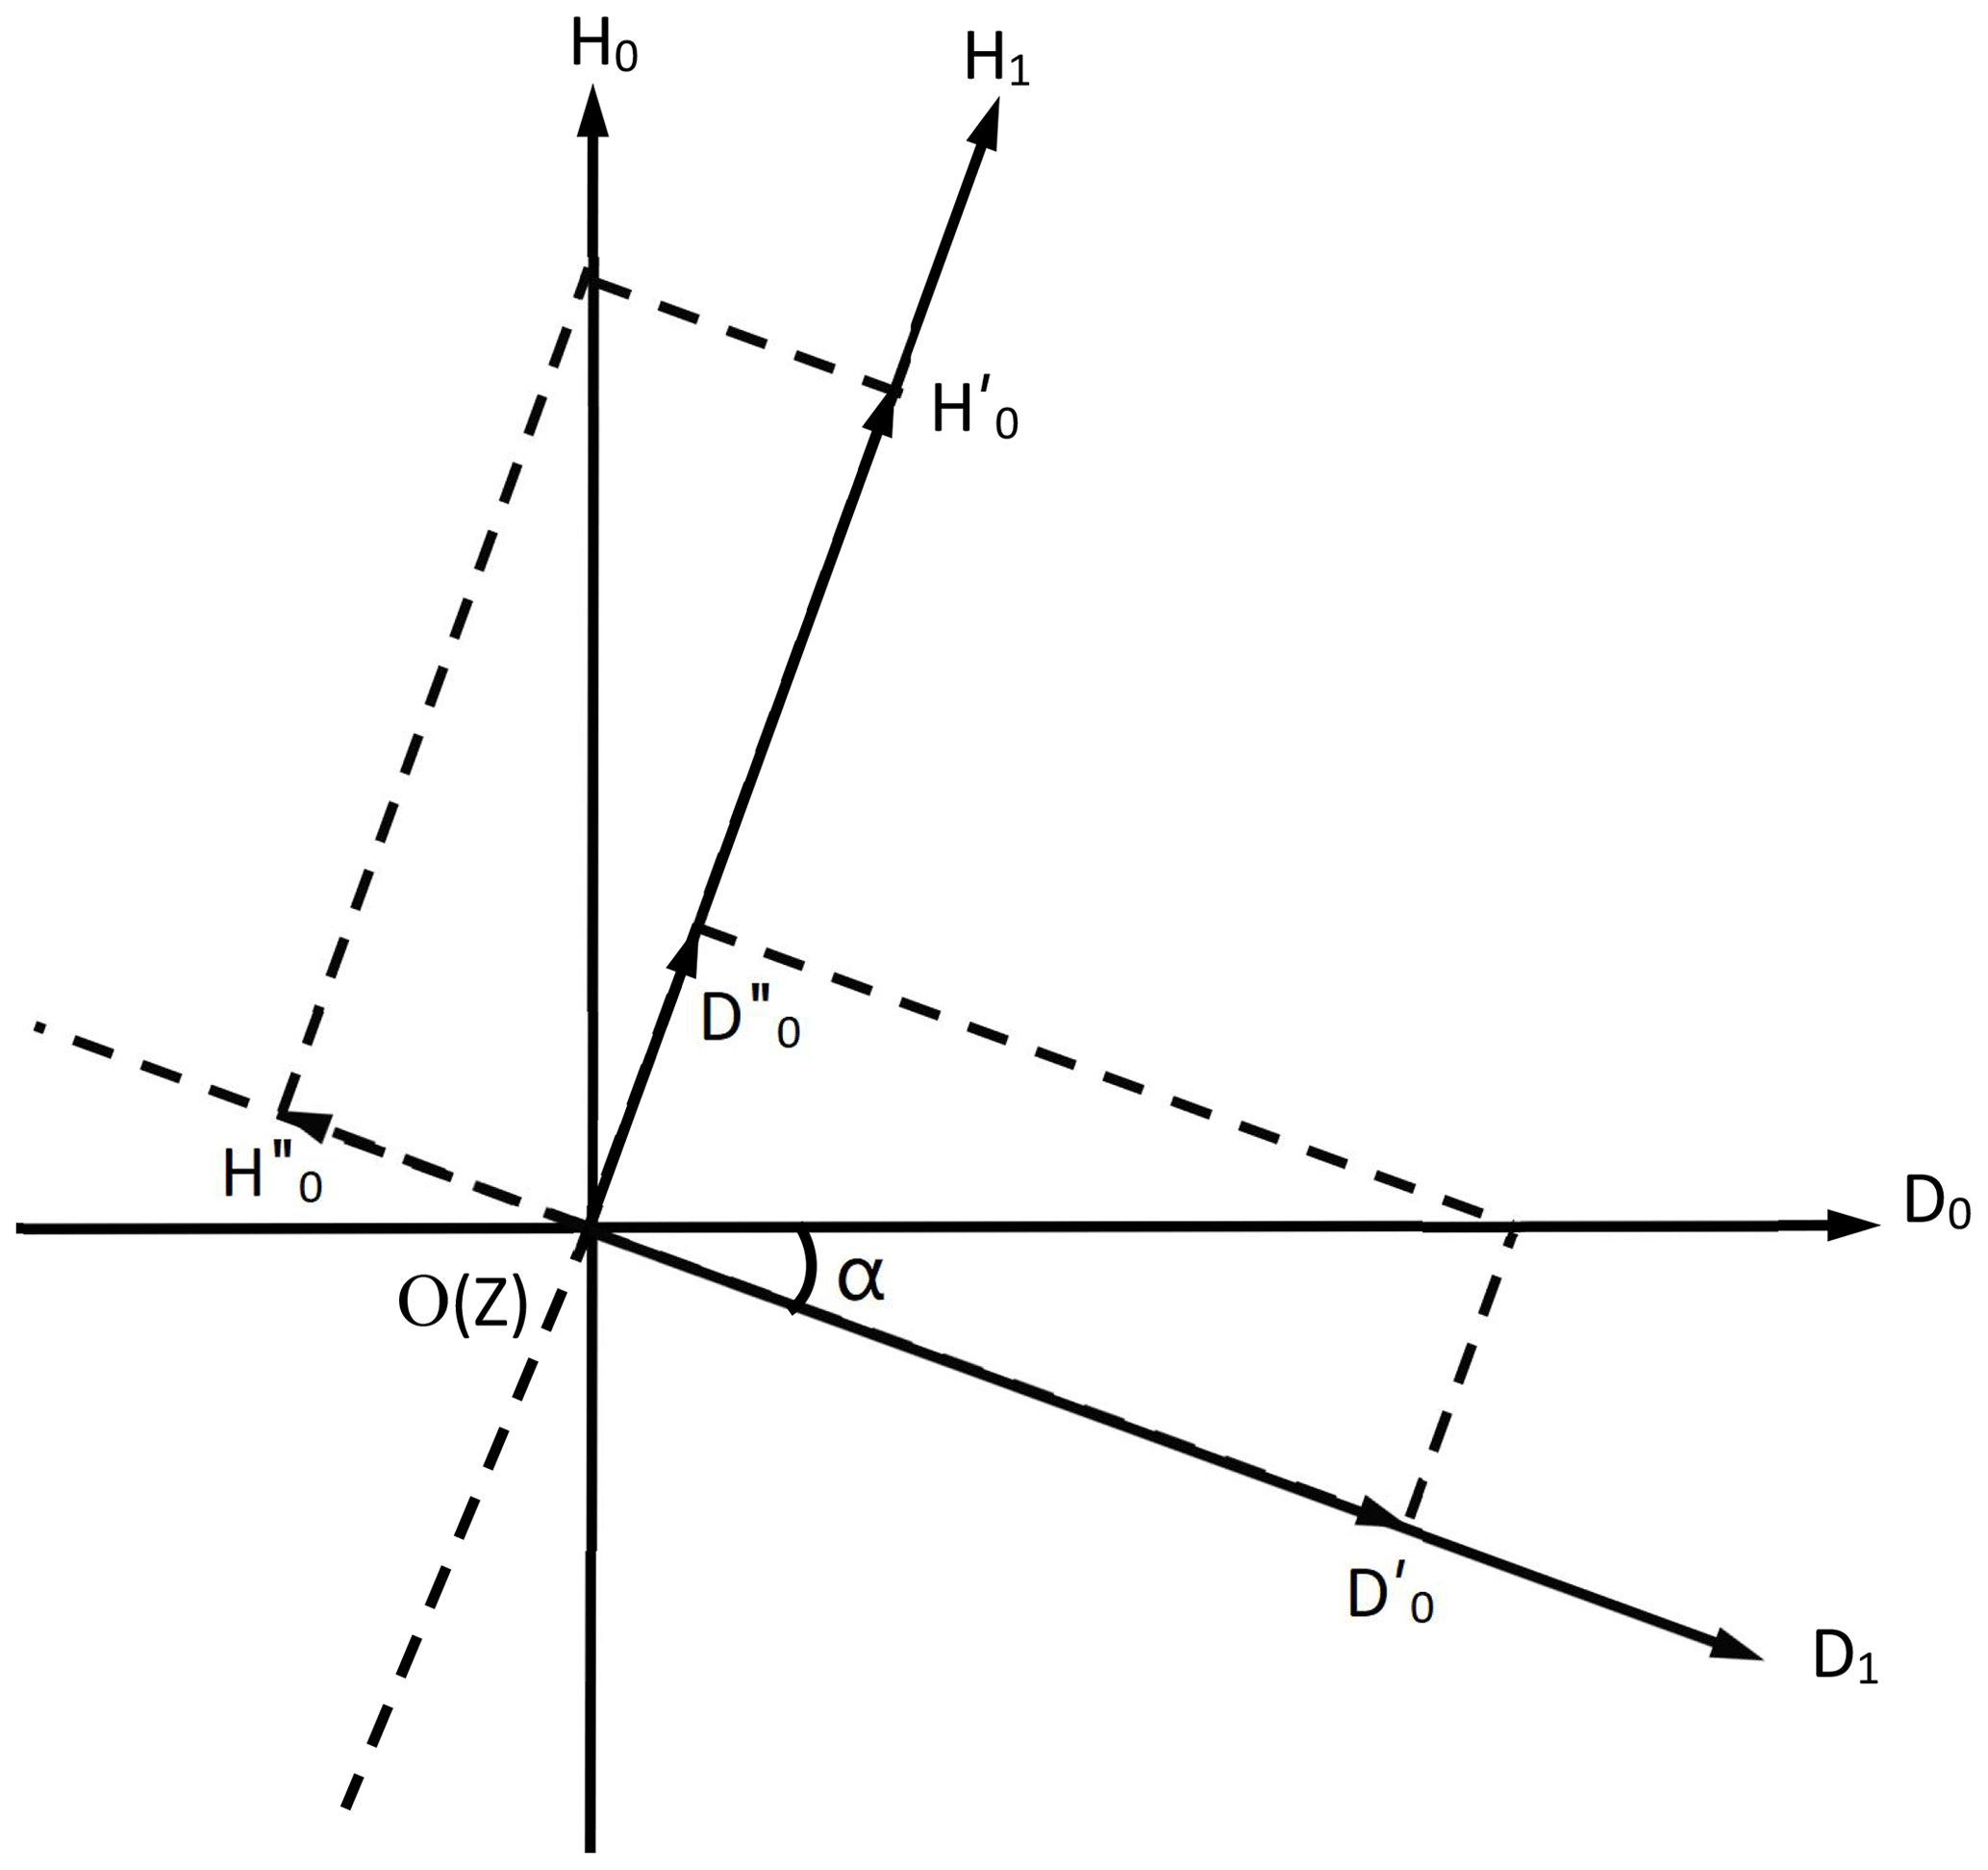
Figure 2The coordinate reference system of the magnetic sensor with the directional error angle α.
In traditional orientation methods, it is believed that controlling the output value of the magnetic declination D within the range of −50 to 50 nT results in a relatively small orientation error angle. However, due to some ferromagnetic substances inherent in the triaxial fluxgate sensor being magnetized by the environmental magnetic field, residual magnetism is generated. This, combined with zero drift produced by the sensor and data acquisition module, collectively superimposes a fixed magnetic field on each axis of the fluxgate sensor, causing the measured magnetic field component values to shift (Luo et al., 2019). Therefore, when the magnetic declination D is oriented, the output value simultaneously includes the offset of the D magnetic axis, which may result in an increase in the orientation error angle α, leading to inaccurate orientation of the D magnetic axis.
Assume the offset of the D magnetic axis is S0, and the projection value of the magnetic field H on the D magnetic axis is S, as shown in Fig. 3a, where A represents the magnetic east direction, B represents the magnetic north direction, and C represents the position of the magnetic axis when the offset S0 exists and the output value of D is zero. At this point, the output value of the D component is S0−S. As shown in Fig. 3b, rotate the position of the D magnetic axis horizontally by 180°, which will make the output value of the D element S0+S. The numerical value of the offset S0 can also be obtained through calculation.
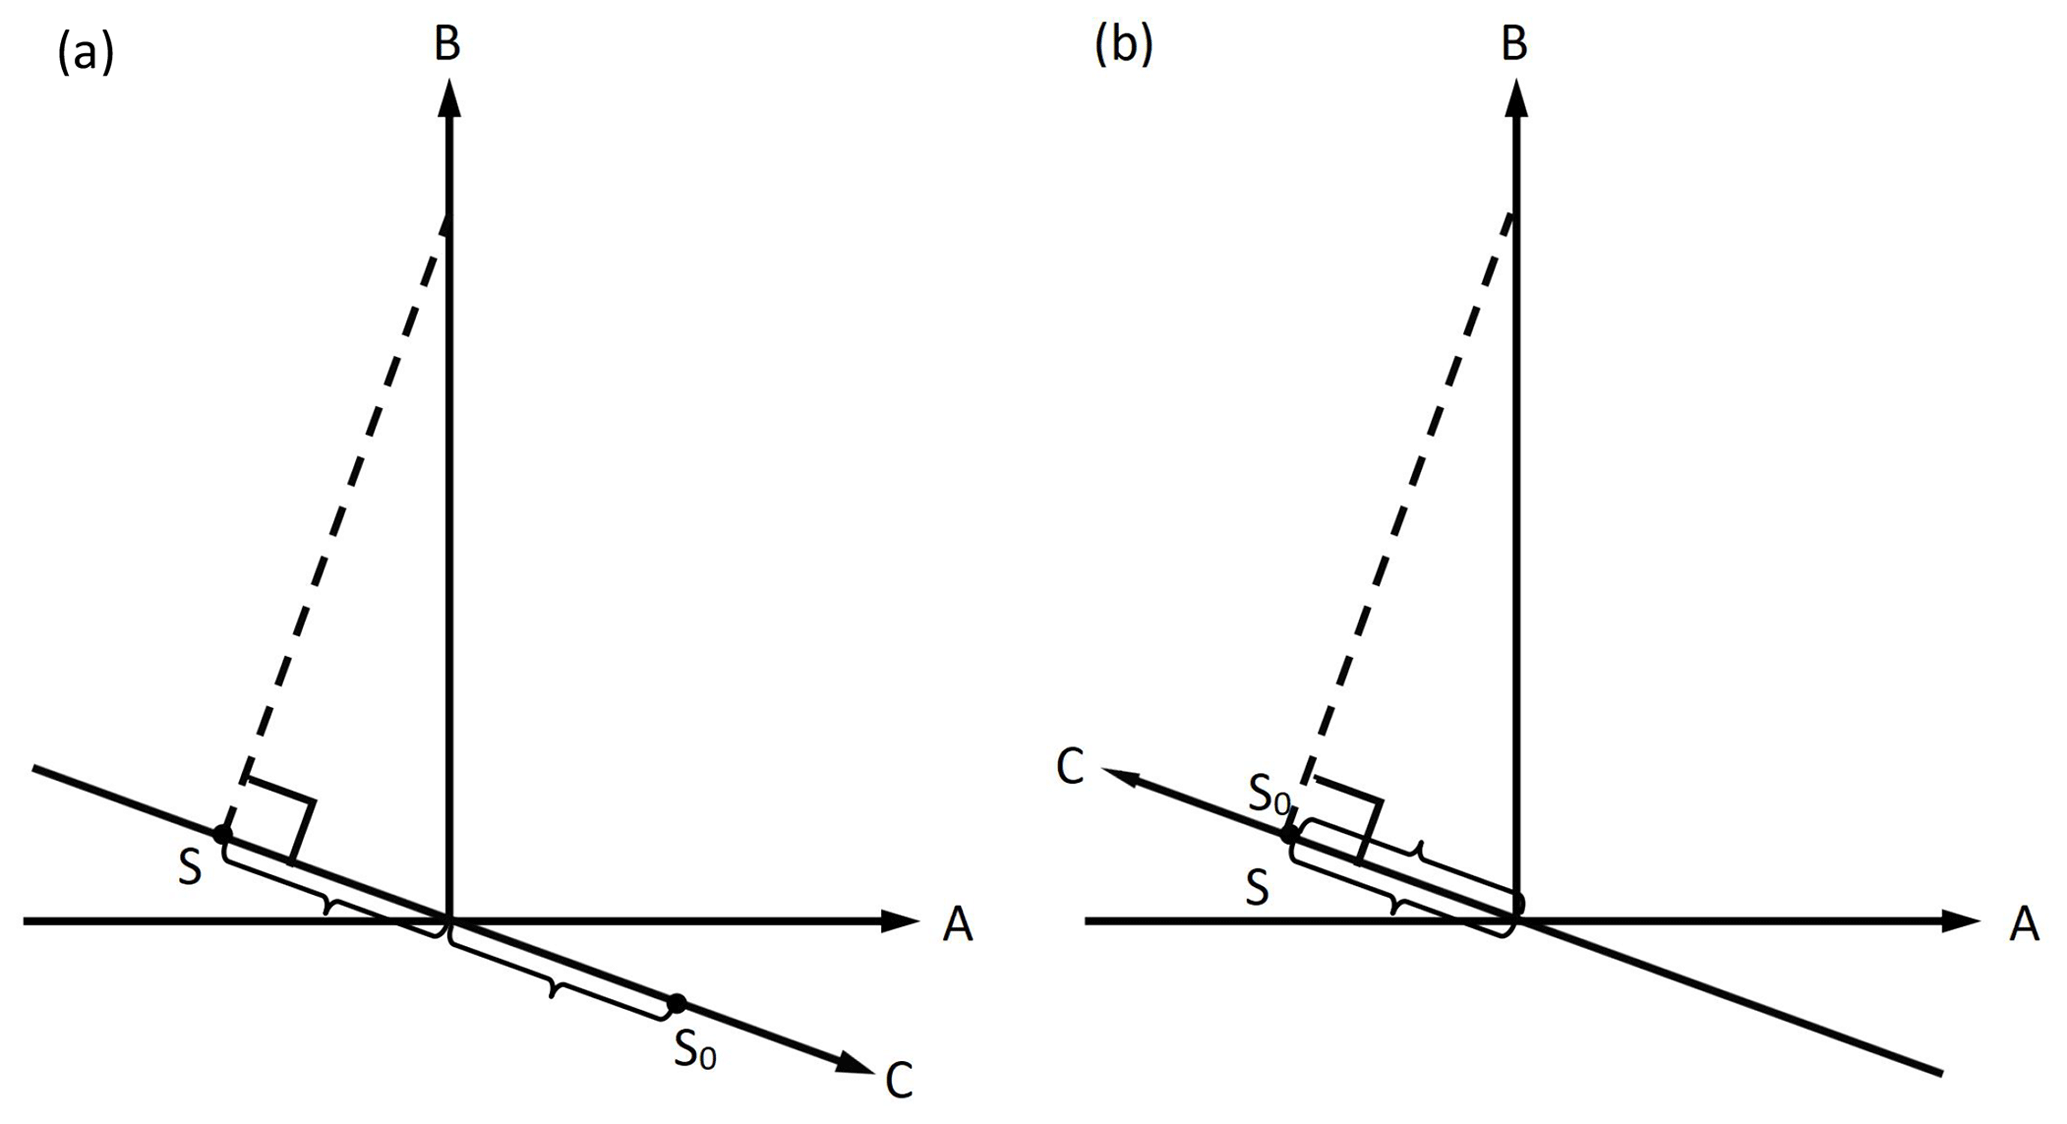
Figure 3Calculation schematic diagram of offset S0 at the D magnetic axis orientation position (a) and its position after rotating 180° (b).
Furthermore, the angle error caused by the non-horizontal placement of the triaxial fluxgate magnetometer will also lead to mutual influences among the components. Therefore, whether the leveling bubble of the instrument base can ensure that the Z magnetic axis is vertical is also crucial for accurate orientation.
In summary, when installing and orienting the instrument, to ensure accurate orientation, in addition to considering the magnitude of the D output value during orientation, it is also necessary to consider the offset of the D magnetic axis, and at the same time ensure whether the Z magnetic axis is truly in a vertical state.
To complete this experiment, a set of non-magnetic rotary platforms (hereinafter referred to as the platform) was specifically designed. This platform mainly consists of a weak magnetic plate and a non-magnetic theodolite. The weak magnetic aluminum plate is installed on the non-magnetic theodolite telescope (Fig. 4a), and it enables the platform to rotate on a horizontal plane by adjusting the vertical dial and horizontal dial of the theodolite. During the experiment, first adjust the level of the theodolite, adjust the vertical dial to make the platform horizontal, place the sensor on the platform, and check the verticality of the Z magnetic axis by rotating the horizontal dial and observing the output value of the Z magnetic axis. The offset of the D magnetic axis can be measured by adjusting the theodolite horizontal dial.
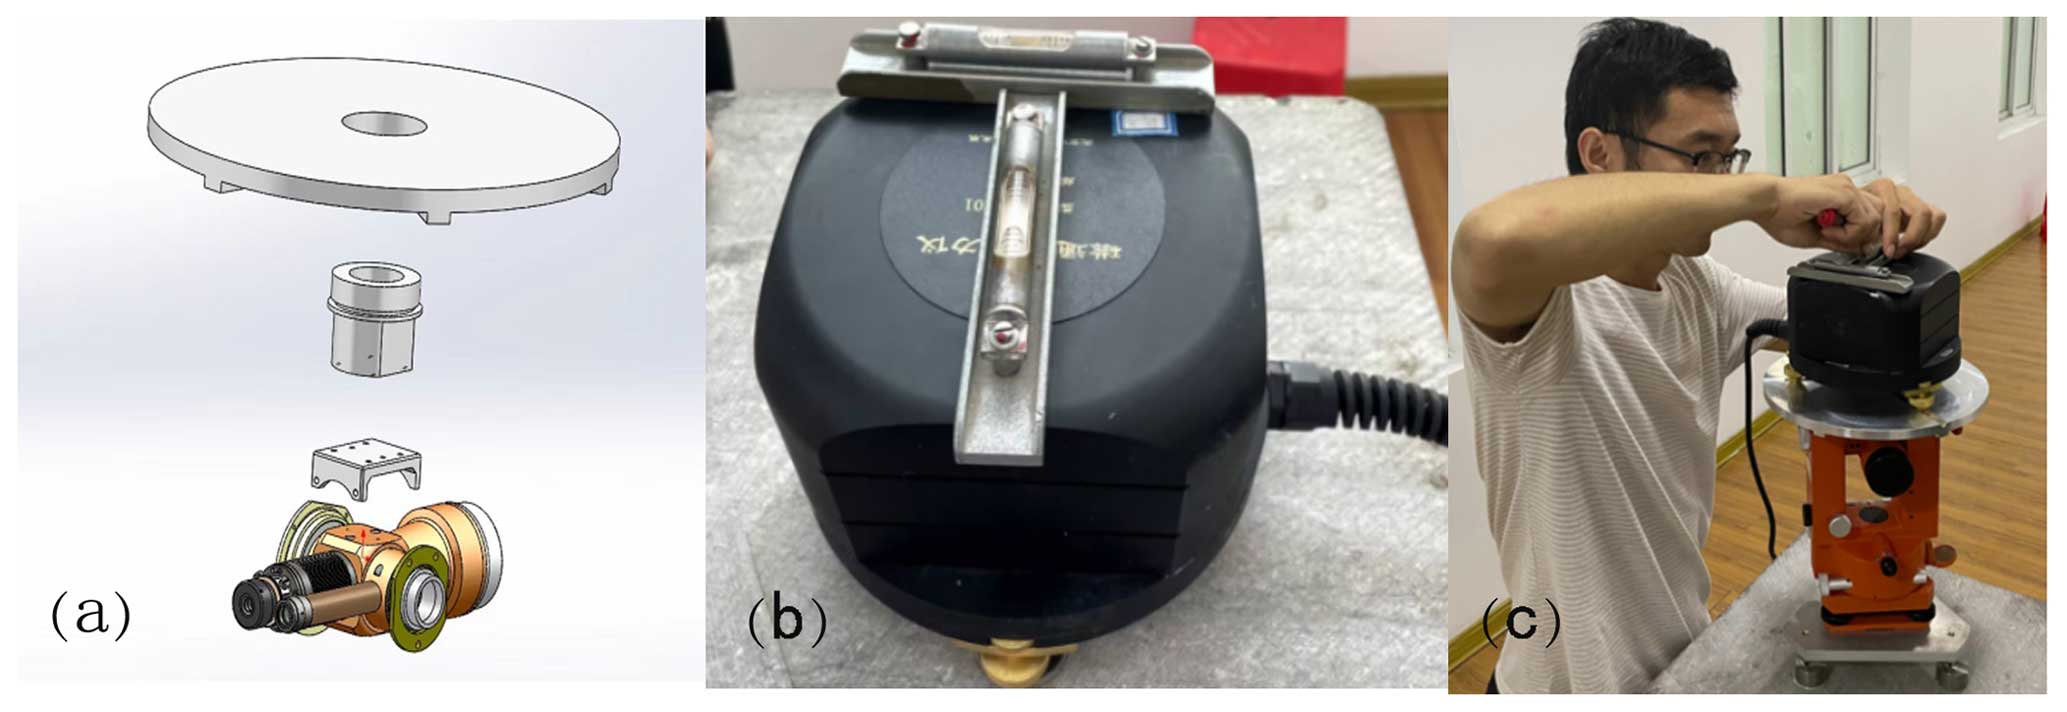
Figure 4Schematic assembly and actual operation of the non-magnetic rotation platform.(a) Non-magnetic rotation platform connection schematic diagram. (b) Sensor top with external level. (c) Actual operation of non-magnetic rotation platform.
Before the experiment, two adjustable spirit levels with an accuracy of 10 s were fixed, perpendicular to each other, on the top of the sensor with rosin, with one passing through the magnetic axis (Fig. 4b). When the Z axis reaches the ideal vertical state, adjust the spirit level to a horizontal state so that when the sensor is installed in a new location it can be placed in the same vertical position (Jankowski and Sucksdoff, 1996).
The measurement part of this experiment was conducted in the absolute measurement room of Hong-shan Observatory. The FGM-01 magnetic fluxgate magnetometer was used as the instrument under examination (see Fig. 4c).
First, we examined the perpendicularity of the Z magnetic axis using the platform. After leveling the non-magnetic theodolite, we began adjusting the sensor's base angle screws to center two mutually perpendicular bubbles. By rotating the platform, we recorded the output values of the Z element at four positions 90° apart, as shown in Table 1. From the first set of data, it can be observed that the output values of the Z element at the four positions are not equal. The maximum difference between the two values at positions 180° apart reaches 749 nT, indicating that the sensor's leveling with the bubbles does not accurately represent the perpendicularity of the Z magnetic axis and suggesting the presence of directional error. We continued adjusting the three base screws to make the Z element's output values as close as possible at different positions. Data from the second to the sixth sets represent the stepwise adjustment of the Z component output values by the base screws. The data from the sixth set are the measurement results when the base screws are adjusted to their limits. At this time, the difference between the two values of the Z component at positions 180 and 90° apart is 1 and 22 nT, respectively. Since the measurement experiment was not conducted in a uniform magnetic field laboratory, even during a quiet magnetic period there will still be small diurnal variations, making it difficult to achieve an ideal state where the Z component remains unchanged at any position when rotating the platform. There is certain to be an error in the results. The maximum difference between the Z component values at different positions is 22 nT. If this value is projected onto the magnetic declination D direction, compared to the output value range of −50 to 50 nT when the magnetic declination D is oriented, its impact is small. Therefore, we believe that the Z magnetic axis is now in a vertical position. Obviously, the bubbles of the instrument itself are no longer centered, and we level a pair of external levels previously fixed on top of the sensor.
Table 1Adjustment results of the FGM-01 instrument for the verticality of the Z magnetic axis.

Subsequently, we measured the offset of the D magnetic axis according to the method shown in Fig. 2. By rotating the platform, we read the output values of the D element in two directions 180° apart and calculated the D magnetic axis offset to be 109 nT. Using the formula to convert the D magnetic axis offset from nT to angle, it is expressed as follows: . In the formula, H takes the annual average value of the H component. The known H value of Hong-shan Observatory is 29 600 nT, and the θ value can be calculated to be approximately 0.2°.

Figure 5Baseline values obtained through daily calibration before and after calibration of the test instrument.
Finally, the instrument being tested was moved to the relative recording room of Hong-shan Observatory. We first checked and leveled the external bubbles fixed at the top of the sensor to correct the Z magnetic axis directional error. We then adjusted the sensor to ensure the output value of the D element to be 109±50 nT, completing the correction of the D magnetic axis directional error and allowing the instrument to begin recording observations.
It should be noted that we know the daily variation in the geomagnetic field is very small. When conducting experiments, it is advisable to choose a period when the magnetic field is calm and the temperature is stable. It can be assumed that the geomagnetic field is stable and uniform at this time.
To verify the correction effects mentioned above, the data from the instrument before and after calibration were compared in the following two ways.
4.1 Comparative analysis of calibration results for daily variation records accuracy
The purpose of the calibration of the accuracy of daily variation records is to examine the accuracy of the fluxgate magnetometer in recording diurnal variation data. The specific method is as follows: on a selected day, an absolute measurement is carried out every hour, and two sets of valid data are obtained for each measurement. The precision and stability are measured by calculating the change in the baseline value and the standard deviation (Gao et al., 1991; Zhang and Yang, 2011). The tested instrument underwent diurnal variation calibration both before and after correction, with 11 absolute measurements each time, as shown in Fig. 5. As can be seen from Fig. 5, there is a clear diurnal variation pattern in the baseline value curves of the tested instrument before correction, with the maximum baseline value change of 0.26′ for DB, 1.7 nT for HB, and 1.0 nT for ZB, and a standard deviation of 0.07′ for DB, 0.5 nT for HB, and 0.3 nT for ZB. After correction, the maximum baseline value changes for each element were 0.07′ for DB, 1.0 nT for HB, and 0.6 nT for ZB, with a standard deviation of 0.02′ for DB, 0.3 nT for HB, and 0.2 nT for ZB. Compared to the pre-correction data, there was a reduction in both the maximum baseline value changes and standard deviations for each element, with the D element showing the most significant decrease in maximum baseline value change (decreasing by 0.19′). The results indicate that the post-correction observational data accuracy of the tested instrument is significantly superior to that of the pre-correction data and that it more accurately reflects the diurnal variation in the geomagnetic field.
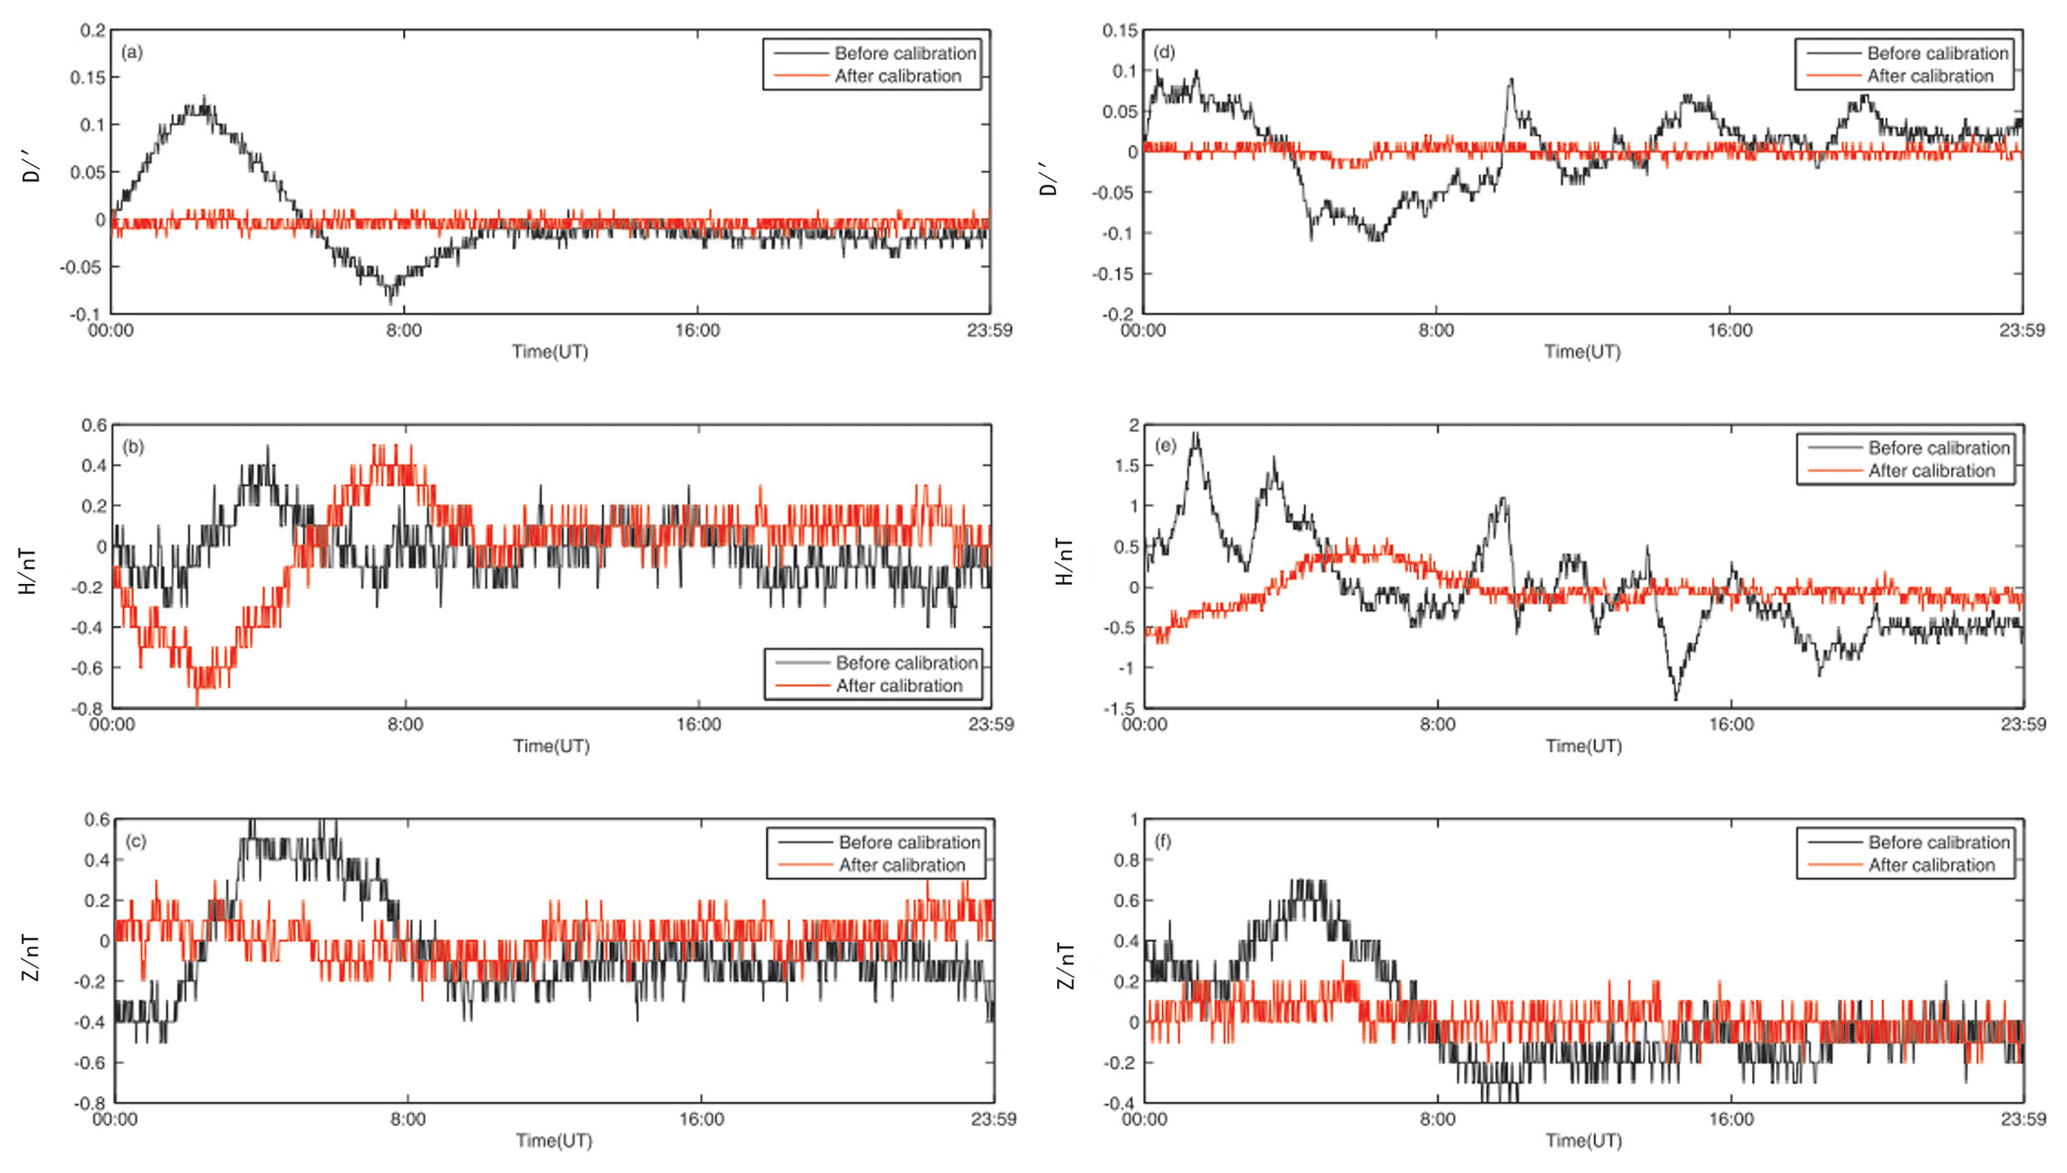
Figure 6The difference curve between the tested instrument before and after calibration and the reference instrument. Panels (a)–(c) are geomagnetic quiet days. Panels (d)–(f) are geomagnetic disturbance days.
4.2 The comparison of the difference curve of daily variation before and after instrument calibration
The comparison of the difference curve of daily variation can generally describe the consistency of data from different instruments at a station. Using the standard instrument GM4 located in the relative recording room of Hong-shan Observatory as the reference instrument, the minute values of the instrument under examination are compared with those of the reference instrument. The difference curves before and after correction are shown in Fig. 6, where Fig. 6a–c and d–f represent the difference curves for geomagnetic quiet days and geomagnetic disturbed days, respectively. It can be observed that the difference between the instrument under examination and the reference instrument is significant before calibration, especially for the D component. Even when the magnetic field is relatively stable, the maximum variation in the difference in the D component still reaches 0.22′. After calibration, the differences in magnetic field components between the instrument under examination and the reference instrument are significantly reduced, particularly for the D and Z components, with the difference curves coming much closer to a straight line compared to the reference instrument.
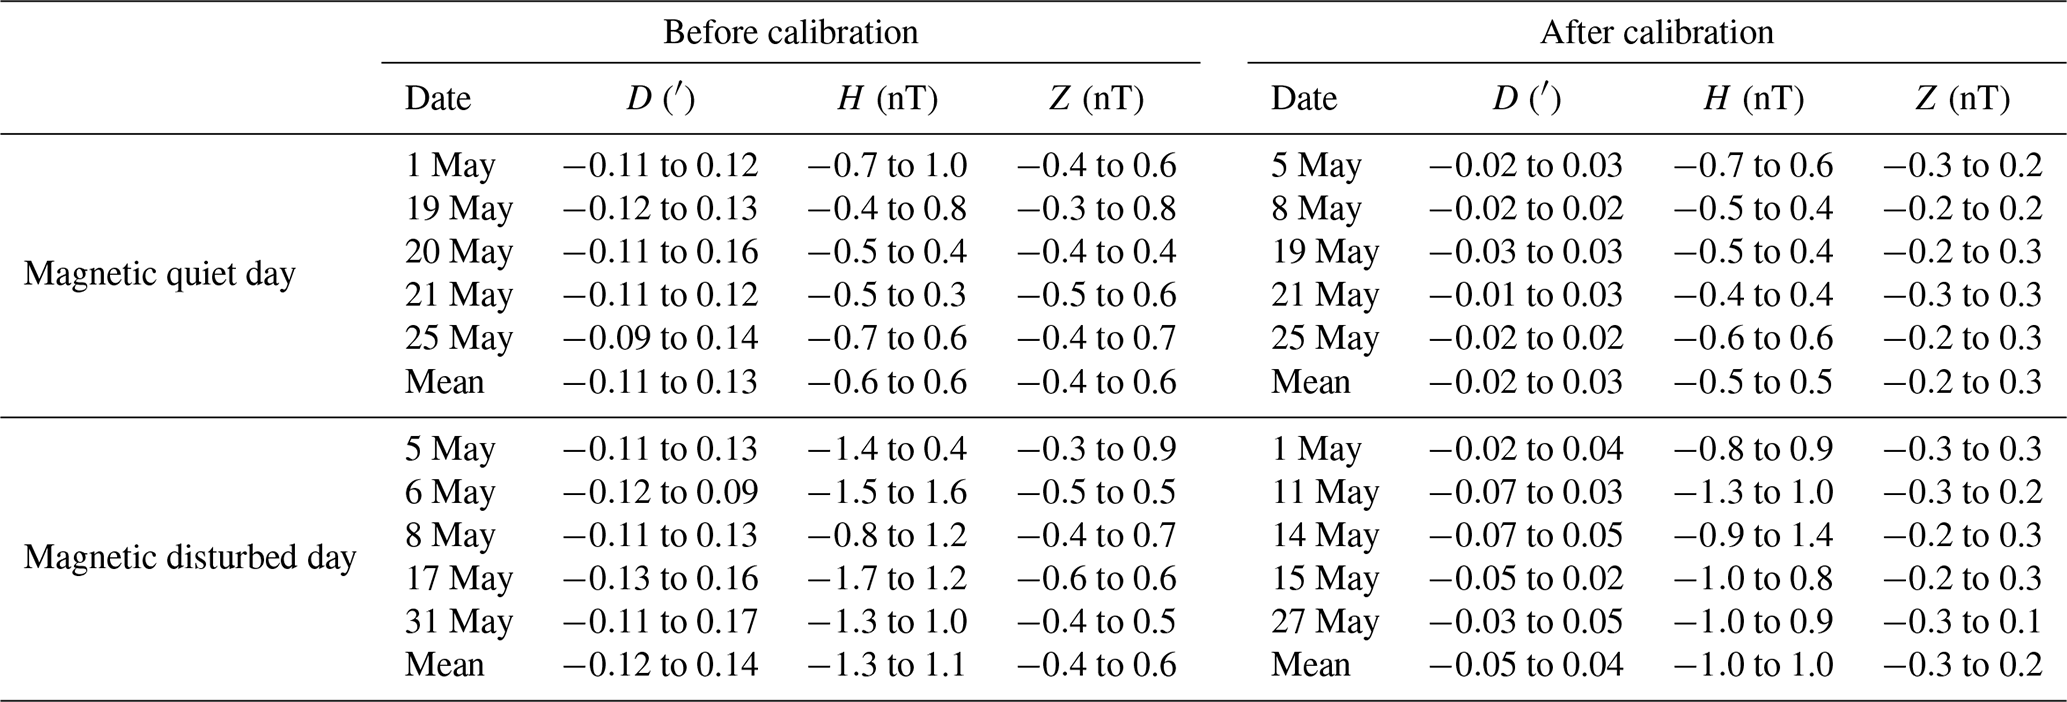
Following this, we select the observation data of the instrument before calibration (May 2022) and after calibration (May 2023) for comparison. From these data, we select five magnetically quiet days and five magnetically disturbed days and calculate the range of relative difference amplitude compared to the reference instrument and its average range (Table 2). As can be seen from Table 2, the average change range of the relative difference amplitude of the D and Z components before calibration is “−0.11 to 0.13′ and “−0.4 to 0.6 nT”, respectively, with the average change range of the amplitude being similar on magnetically quiet days and magnetically disturbed days. The average change range of the amplitude of the H component is almost twice as large on magnetically disturbed days compared to magnetically quiet days. After calibration, the H component shows a slight decrease compared to before, and the improvement effect of the D and Z components is very significant. The average change range of the amplitude on magnetically quiet days is “−0.02 to 0.03′ and −0.2 to 0.3 nT”, and on magnetically disturbed days it is “−0.05 to 0.04′ and −0.3 to 0.2 nT”, with the average change range of the amplitude being significantly reduced compared to before calibration. This indicates that the above-mentioned orientation method has a good calibration effect on the magnetic field components.
Table 2The range of relative difference amplitudes between the test instrument and the reference instrument.
This paper has analyzed the generation mechanism of orientation errors in triaxial fluxgate magnetometers and conducted a station experiment on an FGM-01 instrument using a self-made measurement device. The experimental and research results show that orientation errors occur in both the Z and D magnetic axes of the sensor, and it is necessary to correct these errors. The observational data, after correction for orientation errors, demonstrated a significant reduction in both the standard deviation of baseline values and the amplitude of differences when compared to a reference instrument, proving the effectiveness of the correction method. The measurement device used in the experiment is low in cost, simple to operate, and easy to disseminate, boasting a high performance-to-price ratio. In this study, the author found that the improvement effects on the D and Z components are more pronounced on both magnetically quiet or disturbed days but not as significant for the H component. This indicates that the accuracy of geomagnetic daily variation records is influenced by factors other than orientation errors, including orthogonality. We will continue to examine the impact of instrument orthogonality and correction methods in future work. The research presented in this paper provides a reference for the standardized installation and regular adjustment of orientation in fluxgate magnetometers at geomagnetic stations.
The experimental data of the three-axis fluxgate instrument installation and orientation error correction are available at https://doi.org/10.5281/zenodo.13377498 (Hu et al., 2024).
XH, SH, and PG conducted the experiments. XH, XZ, QT, AM, and GC analyzed the results. All authors contributed writing the text and creating the figures for this paper.
The contact author has declared that none of the authors has any competing interests.
Publisher's note: Copernicus Publications remains neutral with regard to jurisdictional claims made in the text, published maps, institutional affiliations, or any other geographical representation in this paper. While Copernicus Publications makes every effort to include appropriate place names, the final responsibility lies with the authors.
The geomagnetic observation data in this article are sourced from the National Geomagnetic Network Center of the Institute of Geophysics, China Earthquake Administration. Li Xijing from Qianling Station in Shanxi Province proposed the measurement method for directional errors and guided the specific experimental procedures. We would like to thank the anonymous reviewer for their constructive questions and comments that increased the clarity of this contribution.
This research was funded by Science for Earthquake Resilience of China (grant no. XH23006A), the National Natural Science Foundation of China (grant no. 42374092), and Special Project of Hong-shan Scientific Observation of China (grant no. DZ2021110500003).
This paper was edited by Valery Korepanov and reviewed by two anonymous referees.
Crassidis, J. L., Lai, K. L., and Harman, R. R.:Real-Time Attitude-Independent Three-Axis Magnetometer Calibration, Guidance Contr. Dynam., 28, 115–120, https://doi.org/10.2514/1.6278, 2005.
Ejiri, M., Fukunishi, H., Ono, T., Yamagishi, H., Hirasawa, T., Kimura, I., and Oguti, T.:Auroral Phenomena Observed by the Sounding Rockets S-130JA-8 to -12 at SyowaStation, Antarctica, J.Geomag. Geoelect., 40, 763–781,1988.
Foster, C. C.and Elkaim, G. H.: Extension of a Two-step Calibration Methodology to Include Nonorthogonal Sensor Axes, IEEE T. Aerosp. Elect. Syst., 44, 1070–1078, 2008.
Gao, Y. F., Cheng, A. L., Zhao, Y. F., and Zhou, J. P.: Baseline analysis for geomagnetic observatory, Seismol. Geomag. Obs. Res., 12, 3–10, 1991.
Hu, X.: The experimental data of three-axis fluxgate instrument installation orientation error correction [Data set], Zenodo [data set], https://doi.org/10.5281/zenodo.13377499, 2024.
Hu, X. J., Li, X. J., Wang, J., Li, X. S., Chang, G. P., Wang, X. M., Song, Z., Luo, N., and Xie, Z.:Influences of instrument orien-tation error on the accuracy of daily variation of geomagnetic record, Acta Seismol. Sin., 38, 130–137 https://doi.org/10.11939/jass.2016.01.013, 2016.
Jankowski, J. and Sucksdoff, C.: Testing using a turntable, in: Guide for Magnetic Measurements and Observatory Practice, International Association of Geomagnetism and Aeronomy, ISBN 0-9650686-2-5, 1996.
Langel, R. A., Ridgway, J. R., Sugiura, M., and Maezawa, K.: The Geomagnetic Field at 1982 from DE-2 and Other Magnetic Field Data, J. Geomaget. Geoelect., 40, 1103–1127, 1988.
Li, J. C.:Error Intelligent Modeling and Adaptive Calibration of Tri-Axial Magnetometer, Meas. Contr. Technol., 27, 11–19, https://doi.org/10.19708/j.ckjs.2008.08.003, 2008.
Liu, C., Teng, Y. T., Wang, X. M., and Wu, Q.:Consistency correcion for the observed data of fuxgate magnetometer based on geneticalgorithms, Prog. Geophys., 34, 0751–0756, https://doi.org/10.6038/pg2019CC0024, 2019.
Liu, H., Li, Y. G., Ding, X. Z., and Feng,C. Q.: Analysis and calibration method for temperature drift error of a three-axis fux-gate magnetometer, Periodical of Ocean University of China, 52, 107–113, https://doi.org/10.16441/j.cnki.hdxb.20210153, 2022.
Luo, J. G., Li, H. B., Liu, X. J., Li, H. H., and Zhang, F.: Study on Error correction method of Three-axis Fluxgate Magnetometer, Navigat. Control., 18, 52–58, https://doi.org/10.3969/j.issn.1674-5558.2019.03.008, 2019.
Pang, H. F., Luo, S. T., Chen, D. X., Fan, M. C., and Zhang, Q.:Error Calibration of Fluxgate Magnetometers in Arbitrary Attitude Situation, J. Test Meas. Technol., 25, 371–375, https://doi.org/10.3969/j.issn.1671-7449.2011.04.020, 2011.
Tohyama, F., Ishido, M., and Fukunishi, H.: Attitude Determination of the Antarctic Sounding Rockets from Magnetometer and Horizon Aspect Sensor Data, J. Geomaget. Geoelectron., 40, 817–829, 1988a.
Tohyama, F., Fukunishi, H., Takahashi, T., Kokubun, S., Fujii, R., and Yamagishi, H.:Intense Auroral Field-Aligned Currents and Electrojets Detected by Rocket-Borne Fluxgate Magnetometer, J. Geomaget. Geoelectron., 40, 831–842, 1988b.
Včelák, J., Ripka, P., Platil, A., Kubík, J., and Kašpar, P.: Errors of AMR compass and methods of their compensation, Sensors Actuat., 129, 53–57,2006.
Wang, X. M.,Teng, Y. T., Tan, J., Wu, Q., and Wang, Z.:Influencing factors of tri-axial fluxgate sensor horizontal and orientation on the accuracy of geomagnetic variation records, Acta Seismol. Sin., 39, 429–435, https://doi.org/10.11939/jass.2017.03.012, 2017.
Wu, D. H.:Research on correction of three axis fluxgate sensor based on SVR, Transduc. Microsyst. Technol., 27, 43–46, https://doi.org/10.13873/j.1000-97872008.06.026, 2008.
Zhang, S. Q.and Yang, D. M.: Analysis of the calibration results of the accuracy of geomagnetic diurnalvariation records, Seismol. Geomagnet. Obs. Res., 32, 60–65, https://doi.org/10.3969/j.issn.1003-3246.2011.05.012, 2011.
Zhu, J. P., Wang, B. L., Huang, Z. Y., and Li, H. Q.: Design of ERT system, J. Zhejiang Univers. Sci., 6A, 1446–1448, https://doi.org/10.1631/jzus.2005.A1446, 2005.
Zhu, Z. C.: Effects on the right-angled error of the three-component flux gate magnetometer exploring head to the sense of orientation, Seismol. Res. Northeast China, 20, 70–75, https://doi.org/10.13693/j.cnki.cn21-1573.2004.02.013, 2004.