the Creative Commons Attribution 4.0 License.
the Creative Commons Attribution 4.0 License.
Shipborne comparison of infrared and passive microwave radiometers for sea surface temperature observations
Guisella Gacitúa
Jacob Lorentsen Høyer
Sten Schmidl Søbjærg
Hoyeon Shi
Sotirios Skarpalezos
Ioanna Karagali
Emy Alerskans
Craig Donlon
In the spring of 2021, a shipborne comparison of sea surface temperature (SST) measurements was undertaken using thermal infrared (IR) and passive microwave (PMW) radiometers. The Danish Meteorological Institute (DMI) and the Technical University of Denmark (DTU) jointly deployed two IR and two PMW instruments aboard the Norröna ferry, which traversed between Denmark and Iceland for a week. The primary objective was to assess the proximity-based comparison of IR and PMW measurements, minimizing atmospheric influences and providing valuable insights into reconciling IR- and PMW-derived SSTs. A linear regression algorithm was developed using IR SST data as a reference to derive PMW SST from brightness temperature. The data analysis primarily focused on evaluating data variability, identifying discrepancies between IR and PMW SST, and assessing the overall uncertainty in the retrieval process. The overall root-mean-square error (RMSE) of the retrieved PMW SST was 0.88 K during the ship's motion and 0.94 K when the ship was moored. The analysis of the retrieved SST uncertainty budget involved the consideration of observed quantities and a forward model, accounting for factors like instrument noise, wind speed, incidence angle, and the RMSE of skin and sub-skin temperature. The resulting uncertainty budget in the retrieved PMW SST indicated 0.53 K for the data acquired during motion and 0.3 K for data collected during a port stay. Based on the analyses of the collected data and uncertainty estimations, recommendations are offered to improve future inter-comparisons and help reconcile IR and PMW measurements.
- Article
(5208 KB) - Full-text XML
- BibTeX
- EndNote
Sea surface temperature (SST) is a fundamental variable to observe and is recognized as an essential climate variable (ECV) (Bojinski et al., 2014). SST regulates ocean–atmosphere interactions and plays a crucial role as a significant input in atmospheric and oceanic forecasting models. In addition, the assessment of climate change and variability heavily relies on remote-sensing-based observations of SST, which have been collected for over 5 decades, resulting in a substantial and extensive dataset (Minnett et al., 2019; Merchant et al., 2019). The most extensive satellite records providing global coverage of SST have traditionally been acquired through the use of thermal infrared (IR) satellite sensors that measure the radiation representative of the sea surface skin temperature (Donlon et al., 2007). SST records from satellite IR sensors have been available since the early 1980s and have a typical spatial resolution of 1–4 km and uncertainties of about 0.2–0.4 °C (e.g. Embury et al., 2012; Gladkova et al., 2016). Satellite IR SST observations are thus very accurate, yet they are subject to certain limitations. For example, they can only be obtained in cloud-free conditions and are influenced by the presence of aerosols and water vapour.
An alternative method for retrieving SST involves utilizing passive microwave (PMW) satellite measurements of brightness temperature (Tb) in the C and X bands that are representative of thermal emission from the sub-skin layer of the ocean surface (Gentemann et al., 2010). SST records from PMW sensors have been available since 1997 and can provide observations of the sea surface in non-precipitating conditions. The quality of the satellite PMW SST observations is impacted by strong winds (rough sea state), sun glint, and radio frequency interference (RFI). In addition, proximity to land and sea ice (within ∼ 100 km) can contaminate observations of the sea surface (Gentemann, 2014; Gentemann and Hilburn, 2015). Satellite PMW SST products typically have uncertainties of 0.4–0.5 °C with a spatial resolution of 50–60 km (Alerskans et al., 2020; Nielsen-Englyst et al., 2018; Gentemann, 2014).
As discussed in O’Carroll et al. (2019), it is vital that the satellite constellation consists of both IR and PMW sensors, as these two types of sensors have complementary observational characteristics but represent two different physical observations, such as the temperature of the skin (SSTskin) and sub-skin (SSTsubskin) surface layers, and differ by the cool-skin effect (Donlon et al., 2002). Conversely, studies comparing satellite IR and PMW observations of SST have shown significant discrepancies over large regions and on monthly timescales (Castro et al., 2008; Gentemann, 2014). Due to their different observational characteristics, it is important to link IR and PMW SST observations and to quantify the different contributions to potential discrepancies between IR and PMW SSTs. This is particularly important when generating consistent climate data records and is supported by the current EU Copernicus plans calling for an improved understanding of IR and PMW SSTs. The development of the new Copernicus Imaging Microwave Radiometer (CIMR) will ensure the acquisition of accurate and high-resolution PMW observations in parallel with the Sentinel 3 IR SST observations for many years (Thépaut et al., 2018; Jiménez et al., 2021; Nielsen-Englyst et al., 2021).
Fiducial reference measurements (FRMs) have been identified as essential observations for the validation and improvement of the satellite SST products (Donlon et al., 2014b; O’Carroll et al., 2019; Le Menn et al., 2019). For example, existing projects such as SHIPS4SST (https://ships4sst.org, last access: 9 December 2024) are ongoing and are collecting SST FRMs from IR radiometers to be used for satellite validations. Laboratory and inter-comparison campaigns have been conducted to assess the performance of FRM IR radiometers that are deemed traceable by the International System of Units (SI) (Wimmer et al., 2012; Theocharous et al., 2010, 2019). The collection and deployment of PMW radiometers on ships to observe the sea surface temperature are, however, more complex and less mature compared to IR radiometers, and very few coinciding PMW and IR radiometric observations of the sea surface temperature are available as a result.
This study presents the inter-comparison between PMW and FRM IR radiometer measurements of SST collected during a shipborne campaign conducted in close proximity to the sea surface to minimize atmospheric influence on the data. The primary objectives of this investigation are to gain experience with shipborne PMW deployments and to enhance understanding of the relationship between SSTs at the skin and sub-skin levels. The study is an initial effort to improve understanding of reconciling SSTs influenced by different physical processes. A data-driven model was developed to retrieve SST from PMW Tb measurements (SSTPMW) using a linear regression, with SST from IR measurements (SSTIR) used as the independent variable. The model tests whether an SST equivalent to SSTIR can be estimated from PMW measurements despite the differences in the characteristics of SSTskin and SSTsubskin.
The analysis focuses on (i) quantifying the PMW instrumental noise and geophysical variability of Tb data collected during the experiment, (ii) assessing the geophysical conditions contributing to the variability of the observed PMW data, (iii) retrieving SST from PMW measurements using a statistical model, (iv) quantifying the uncertainty budget of the retrieved SSTPMW, and (v) analysing the differences between the retrieved SSTPMW and SSTIR and against existing satellite products.
The results provide insights for improving upcoming inter-comparison campaigns, helping establish connections between these two measurement techniques, and optimizing the current synergy between IR and PMW radiometers.
2.1 IR instrument – ISAR
The infrared SST autonomous radiometer (ISAR) is specifically designed for shipborne measurements of SST at the skin interface (SSTskin). Over the course of nearly 2 decades, ISARs have proven to be highly effective in collecting accurate SST data from ships. These instruments are commonly deployed for data validation purposes, particularly in the collection of FRM used to validate satellite-derived SST data (Donlon et al., 2008, 2014b; Wimmer and Robinson, 2016).
ISARs utilize a Heitronics KT15.85D infrared detector and are equipped with two precision calibration blackbodies (BBs). One BB is maintained at the ambient temperature, while the other is heated to approximately 12 K above the ambient temperature. The scanning process of the ISAR involves a sequential set of observations. Initially, the infrared detector points towards the calibration blackbodies, allowing for initial calibration. Subsequently, the detector scans the sky and the sea, which serves as a self-calibration reference. This comprehensive scanning process enables the ISAR to achieve a remarkable level of accuracy, with an error range of 0.1 K root-mean-square error (RMSE) (Donlon et al., 2008; Wimmer and Robinson, 2016).
To ensure data integrity, the ISAR system incorporates a rain detector mechanism that effectively prevents water intrusion. As a result, the instrument stops obtaining sea measurements during rainy conditions.
2.2 PMW instrument – EMIRAD
The EMIRAD radiometers, owned and operated by the Technical University of Denmark (DTU) – Space, underwent special refurbishment for the purpose of conducting the IR–PMW inter-comparison experiment. The refurbished EMIRAD-C and EMIRAD-X models utilize horn antennas, connected to the receiver via an orthomode transducer (OMT), which enables the independent output of signals for the two polarizations through separate connector ports (Høyer et al., 2021b). EMIRAD-C is fully polarimetric and capable of simultaneously measuring the complete Stokes vector in the C band. EMIRAD-X measures the two polarizations in a time multiplex using the same physical receiver in the X band. Frequencies of C- and X-band radiometers are highly advantageous for deriving and calibrating PMW SST products. These frequencies play a central role in accurately measuring surface temperature, as highlighted by previous studies (Nielsen-Englyst et al., 2021; Prigent et al., 2013). Especially for the C-band frequency of 7.05 GHz (see Table 1), which is very close to the frequency of the first channel (6.925 GHz) of the Advanced Microwave Scanning Radiometer (AMSR), sensitivity in cold waters is higher (Wentz and Meissner, 2000), which is highly relevant for the area of the field campaign. In order to achieve optimal consistency with satellite observations, an average incidence angle of 55° was selected, aligning closely with the AMSR for EOS (Earth Observing System) (AMSR-E) and AMSR2 (Alerskans et al., 2020; Mai et al., 2016).
Table 1General characteristics of the radiometers used for this shipborne inter-comparison campaign.

The calibration procedure for EMIRAD involves a series of four steps. Step one is a classical internal calibration based on a matched load, an active cold load (input of a low-noise amplifier), and a noise diode. The following steps correct for cable insertion loss, antenna return loss and insertion loss, and the antenna's attitude (Søbjærg et al., 2013, 2015). Potential sideline contamination (which refers to unwanted signals being picked up from directions other than the intended one) was theoretically assessed by Høyer et al. (2021b), indicating the antenna's gain successfully rolls off towards 90° from bore sight, with a wide angular interval for picking up radiation; however, contamination from sources near the horizon cannot be excluded.
2.3 Ancillary data
In this study, a range of datasets that serve as references and support the analyses of the IR–PMW inter-comparison data were used. To obtain a comprehensive view of the SST in the region of interest throughout the duration of the campaign, Sentinel-3 Sea and Land Surface Temperature Radiometer (SLSTR) SST (Donlon et al., 2012) L2P data were used (Fig. 1). The wind components at 10 m and SST during the campaign were obtained from the European Centre for Medium-Range Weather Forecasts (ECMWF) ERA5 reanalysis (Hersbach et al., 2020). Additionally, the Danish Meteorological Institute (DMI) HYbrid Coordinate Ocean Model (HYCOM) v9 data were utilized to provide sea salinity information along the transect (Ponsoni et al., 2023) (Fig. 2). PMW SST from the AMSR2 level 2 data was obtained from JAXA's Global Change Observation Mission 1st – Water (GCOM-W1) platform (GCOM-W, 2012). These PMW data were employed for comparison with the SST retrievals from the EMIRAD.
2.4 Measurement campaign
The study area is the region between Denmark and Iceland. The ship's track during the measurements (approximately 4853 km), including a stopover in the Faroe Islands, captures the inflow of Atlantic waters into the Nordic Seas and the Arctic, a crucial area associated with the Atlantic meridional overturning circulation (Dickson et al., 2008). Figure 1 illustrates the ship's trajectory as a black line, while the background image shows the weekly averaged SST derived from SLSTR data. The incorporation of SST data from the Sentinel 3 SLSTR serves as a reference of the SST conditions during the study period.
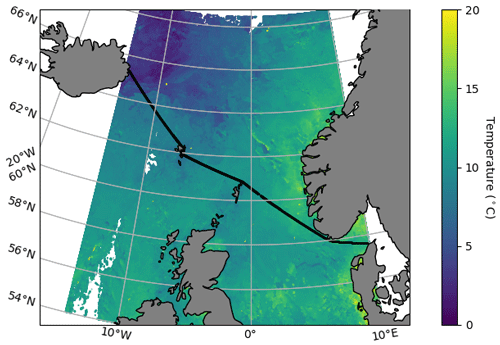
Figure 1Study area. Measurements were made both ways between Denmark and Iceland with stop over in the Faroe Islands. The black line depicts the track position of the ship. The background is the weekly averaged SST from the Sentinel 3 SLSTR.
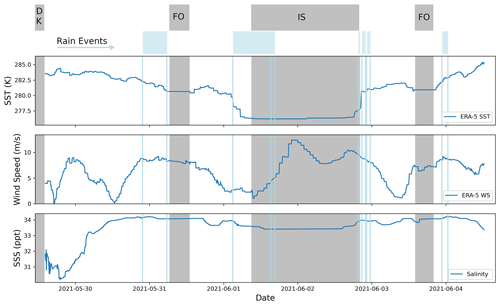
Figure 2Weather and ocean conditions during the inter-comparison campaign. SST and wind speed (WS) are obtained from ERA5 reanalysis data, and sea surface salinity is obtained from the DMI HYCOM model. Grey bands depict the mooring time in the following sequence: Hirtshals (DK), Tórshavn (FO), Seyðisfjörður (IS), and Tórshavn (FO). Detected rain event periods are represented by vertical light blue lines.
The inter-comparison campaign was conducted over a period of 7 d from 29 May to 4 June 2021. The DMI and the DTU jointly deployed two thermal infrared instruments (ISAR-8 and ISAR-19) and two passive microwave instruments (EMIRAD-C and EMIRAD-X) onboard the Smyril Line passenger ferry, Norröna, which travels between Denmark and Iceland. The route of Norröna includes stops at the ports of Hirtshals (DK), Tórshavn (FO), Seyðisfjörður (IS), Tórshavn (FO), and Hirtshals (DK) (Fig. 1).
The 7 d composite SST indicated warmer waters during the first and last parts of the campaign, from DK–FO and back, ranging between 12 and 16 °C. During the FO–IS (and back) part of the campaign, a sharp SST gradient was crossed where SST dropped from around 8 °C to less than 5 °C.
Throughout the course of the campaign, the weather conditions varied from clear skies to heavy rain. The journey began with clear-sky conditions after departure, followed by the development of clouds and the occurrence of mild rain as Norröna approached the Faroe Islands. Subsequently, the sky became partially covered, with a heavy rain event taking place on 1 June as the ferry approached Iceland. For the remainder of the campaign, the sky was partially covered, ranging from 20 % to 70 % cloud coverage. Additionally, there were instances of fog in the morning and afternoon during the return journey from the Faroe Islands to Denmark (FO–DK). Throughout the duration of the campaign, the sea remained relatively calm, characterized by a low sea state and mild surface roughness conditions. The ISAR recorded the roll, pitch, and azimuth of the instruments (and ship). The mean roll angle recorded was 0.42°, with the highest value of 5.79° observed during the transect between FO–IS. Figure 2 provides additional information on the weather and ocean conditions.
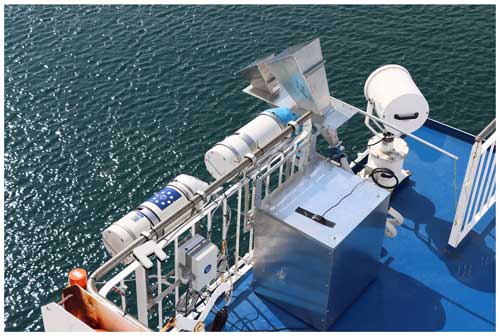
The equipment configuration for the inter-comparison campaign is illustrated in Fig. 3. The setup consists of the two ISARs (left) and the two EMIRADs (right) mounted at an approximate elevation of 20 m above sea level (a.s.l.), above the bridge on the port side of the ship. This configuration was chosen to ensure the observation of undisturbed waters.
2.5 IR–PMW shipborne data
Throughout the campaign, there were minimal instances of precipitation, allowing for almost uninterrupted data collection of SST by the ISAR instruments (ISAR-8 and ISAR-19) at an average sampling rate of approximately 6.9 samples per hour. Regrettably, ISAR-8, being an older-generation instrument, experienced a mechanical failure during the initial section (from DK-FO), resulting in the discarding of its data. Thus, only the data collected using ISAR-19 are presented here (Fig. 4a).
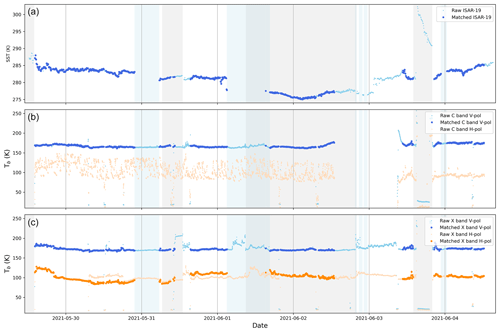
Figure 4Original and matched data from the IR and PMW instruments. SST from ISAR-19 (a), brightness temperature measurements from the C band (b) and X band (c). Light colours indicate raw data, while dark colours depict the resulting match-up dataset of observations. Vertical shaded bands indicate port time (grey) and rain events (blue), as described in Fig. 2.
To ensure accurate FRM with observations traceable to SI standards, the SHIPS4SST project developed specific protocols for this shipborne campaign (Høyer et al., 2021a). This included pre- and post-calibration against a BB reference (CASOTS) (Donlon et al., 2014a). The calibration of ISAR-19 resulted in a mean performance of −0.01 K and a standard deviation of 0.01 K for both the pre- and post-deployment calibrations. In the same way as for the EMIRAD, the calibration was based on the four-step calibration procedure mentioned in Sect. 2.2 (Høyer et al., 2021b).
Figure 4b and c display the measured brightness temperature acquired from the PMW instruments during the field campaign. Intermittent sky measurements were performed throughout the campaign by manually adjusting the antenna orientation, resulting in data points reflecting lower temperatures. Possible geophysical sources of brightness temperature obtained from sky measurements are atmospheric thermal radiation and the cosmic microwave background (CMB). At C and X bands, the atmosphere is highly transparent due to the low sensitivity to the atmospheric water vapour and liquid water, while the CMB is cold and almost constant at 2.7 K (Njoku, 1982). The “outliers” at the edge of some of the sky shots are caused by “mixed observations” when data were collected during the motion of the antenna, resulting in a mix of brightness temperature from the sky and the sea surface. An extended period of sky measurements was captured while the ship was anchored at Tórshavn port on the return trip. This complementing data of the sky serve as a reference for the variability of brightness temperature with minimal geophysical influences to characterize the uncertainty of EMIRAD measurements (Sect. 4.2).
The PMW instruments had an average sampling rate of 32 samples per hour for the C-band V-polarization (V-pol) channel, 16.2 samples per hour for the X-band V-polarization channel, and 16.8 samples per hour for the X-band H-polarization (H-pol) channel.
3.1 Filtering of data
It is important to note that while the ISAR instrument used to collect SSTskin data is a fully automated, stable, and well-documented instrument that is widely used as a reference for satellite validation products (Donlon et al., 2014b; Wimmer et al., 2012; Wimmer and Robinson, 2016), the PMW EMIRAD instrument is more experimental and has been refurbished specifically for this campaign, requiring manual operation at times.
The C-band H-polarization channel (orange dots in Fig. 4b) showed a persistent noise pattern throughout most of the observational period, which is consistent with previous observations from the static measurements conducted in Copenhagen (Høyer et al., 2021b). Thus, data were excluded from the analysis. The source of noise can be attributed to interference originating from RFI, although mechanical issues with the cable connection cannot be ruled out.
The remaining three channels underwent a filtering process to separate sky measurements and eliminate outliers resulting from instrument manipulation. Special attention was given to the X-band H-pol observations, which exhibited consistent systematic offsets between sky measurements. The magnitude of the offsets varied up to a maximum brightness temperature of 15.18 K after a sky measurement on 30 May (Fig. 4). The most plausible explanation for these offsets is attributed to small changes in cable loss caused by mechanical tension in the independent wiring of each channel. This tension arose from the manual movement of the antennas (rotated 90°) to perform sky measurements. To address this issue, the observed “jumps” in the X-band H-pol data were rectified by subtracting the offset from the median within a range of 10 samples before and after each sky measurement. The cumulative sum of these offsets over the entire period amounted to 0.3 K, which supports the notion that these jumps were induced and suppressed by the sky measurements. This adjustment ensured the data's integrity and enhanced the reliability of subsequent analyses.
During the data collection period in Tórshavn, all of the sea data obtained by the radiometers had to be excluded from the analysis. This was required as the ship moored with the radiometers directed towards the side road of the pier, rendering the sea measurements invalid.
Data collected with the antennas oriented to the sky was then separated, and the sea-oriented dataset was divided into two categories, i.e. “moving” data and “port” data. Subsequently, each analysis was conducted separately, ensuring a thorough examination of these two conditions.
3.2 Matchup dataset
The dataset construction process involved first matching the EMIRAD dataset, which included C-band V-pol, X-band H-pol, and X-band V-pol data, within a 300 s time window. Following this, data from the IR (ISAR-19), including SST and the ship's roll angle (both instant and the standard deviation calculated over a 10-sample window), were incorporated. The resulting dataset was then temporally and spatially aligned with wind components and SST information from ERA5, with a maximum time difference of 2 h and a spatial separation limit of 0.3° (Fig. 2). Additionally, the dataset was aligned with the salinity output from the DMI HYCOM forecasting model (Fig. 2). This process resulted in a dataset of 708 points (N), which are depicted in dark colours in Fig. 4 and are further used in the SST retrieval algorithm.
4.1 Instrumental noise
The instrumental noise was assessed from sky measurements, which provide information on the stability of the instrument when there is minimal geophysical effect.
The measurements were conducted for a duration of 4 h at Tórshavn port on 3 June, with the antennas oriented upward. Throughout this period, the sky conditions exhibited intermittent presence of thin clouds, covering approximately 20 %–40 % of the sky. This particular set of sky measurements was employed to assess the stability of the instruments, as it represents the longest continuous sky observation conducted during the campaign. Figure 5 depicts the Tb variability of sky observations from the EMIRAD instruments.
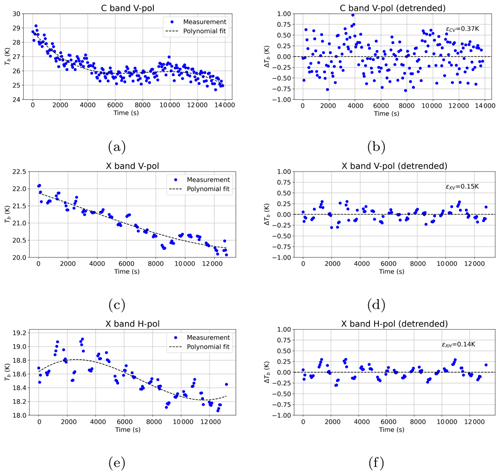
Figure 5Time series of sky measurements at Tórshavn (a, c, e) and the corresponding detrended signal (b, d, f) using a third-degree polynomial fit. The instrument uncertainty (ϵinst) is the standard deviation of the residuals.
As the sky measurements at C and X bands are supposed to consist of insignificant atmospheric emissions and cold CMB, significantly colder Tb values were collected for the sky observation compared to the downward-looking observation. However, it was noted that the Tb values from sky observations were not as cold as the typical level of ∼ 5 K. This might be related to the jump phenomenon that results in the Tb offset described in Sect. 3.1. As there is not enough information to determine the exact cause, the following analysis assumes that its variability appropriately reflects the geophysical variability (i.e. changes in the sky condition) and the instrument's random noise, despite the positive offset in this chunk of sky observation.
The instrument uncertainty (random noise) was quantified from the Tb variability of the sky measurements shown in Fig. 5a, c, and e. A cyclic pattern can be noticed in the X-band sky variability plots (around a 30 min period), which is likely the result of temperature regulation that produced slow changes in the signal. Assuming that the sky condition varies more slowly than the noise, a detrending process was applied to the time series of the sky measurements by subtracting a polynomial fit from the original time series. Subsequently, the standard deviation of the residuals (detrended signal; see Fig. 5b, d, and f) was calculated and used as an estimate of the random instrument uncertainty. The appropriate order of a polynomial used for a fit was determined through a sensitivity test. The standard deviation of the residuals reached stability from the third-degree polynomial, and thus it was selected for the detrending process. The instrument uncertainties, i.e. standard deviation of the residuals, for C-band V-pol, X-band V-pol, and X-band H-pol were determined to be 0.37, 0.15, and 0.14 K, respectively.
4.2 Observed Tb variability
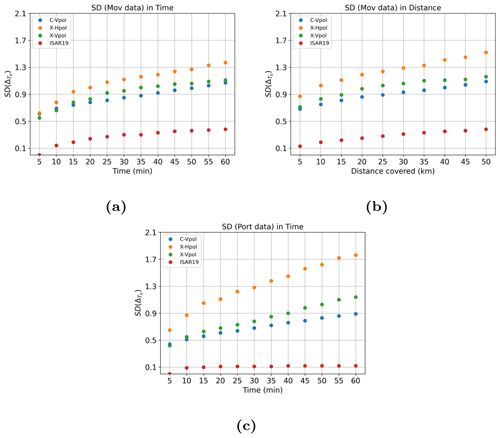
The variability of Tb data was evaluated individually for each channel using the raw dataset with filtered outliers and sky measurements. This assessment was performed by measuring the standard deviation of the absolute differences between each data point and the mean value within a specific time or space window. Figure 6a shows the standard deviation of Tb for each channel at intervals from 5 to 60 min for the moving data, and SSTIR is included for reference. In all cases, there was a steeper increase in the standard deviation from 5 to 20 min, particularly obvious for the X-band H-pol, which also shows the highest values. The V-pol for both C and X bands (blue and green dots, respectively) indicates similar temporal variability, increasing from 0.6 at 5 min to approximately 0.8 at 20 min, beyond which a slow increase up to 1.07 and 1.11 occurred at 60 min, respectively. The ISAR SST standard deviation was below 0.1 at 5 min and slowly increased up to 0.38 at 60 min. When port time was considered, Fig. 6c indicates a higher temporal variability for the passive microwave channels, especially for the X band H-pol, although the ISAR SST remains stable at 0.12 K.
The spatial variability assessed for distances from 5 km up to 50 km is shown in Fig. 6b, where a similar pattern to the temporal variability is identified, although standard deviation values are slightly higher overall for all instruments and channels.
4.3 Sensitivity of Tb to geophysical parameters based on simulations
To investigate the sensitivity of microwave Tb to various geophysical parameters, a microwave forward model was employed, following the methodology described in Wentz and Meissner (2000); Nielsen-Englyst et al. (2021). It is important to note that the forward model employs slightly different frequencies (6.925 and 10.65 GHz for C and X bands, respectively) compared to EMIRAD (see Table 1).
Microwave remote sensing is particularly sensitive to wind speed and incidence angle, with both affecting the emissivity of the sea surface (Meissner and Wentz, 2012). Variations in wind speed can lead to changes in the measured Tb, while increasing the incidence angle generally decreases emissivity (Wentz and Meissner, 2000). This angular dependency of the emissivity is well documented, particularly within the infrared and microwave spectra, and it is largely governed by the Fresnel equations (Masuda et al., 1988).
The input parameters for the forward model to be assessed are wind speed (WS), incidence angle (θ), SST, the angle between the azimuth of the ship and the wind direction (relative angle, ϕr), sea surface salinity (SSS), total column water vapour (TCWV), and total column liquid water (TCLW).
Since the measurements were taken near the surface, within the C and X bands, the parameters related to atmospheric effects (TCWV and TCLW) were set to zero during the forward model run. This assumes that atmospheric influence on the measured Tb is negligible (Njoku, 1982).
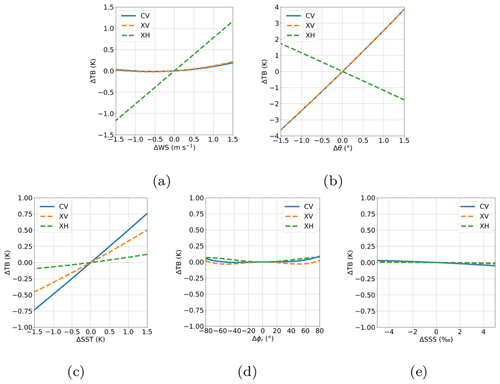
The sensitivity analysis focused on examining how the microwave Tb changes in response to variations in the input surface parameters for the forward model. The reference values used for the test were as follows: SST = 280 K; WS = 5 m s−1; SSS = 35 ‰; θ = 55°; and ϕr = 180°.
The results are shown in Fig. 7, where the symbol Δ indicates the deviation from a reference value. Large changes in Tb were induced by changes in WS (especially for the X-band H-pol channel), θ for all channels and SST (especially for the C-band V-pol channel). The contributions of salinity and relative angle were small for all channels.
5.1 Regression analysis
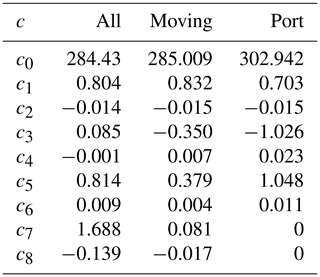
The retrieval method used to derive SST from PMW Tb measurements in this study was based on Alerskans et al. (2020). A linear regression model was used to fit the data using a weighted-least-squares (WLS) approach, with sample weights applied to account for measurement uncertainties. To optimize the regression, multiple iterations were conducted, considering input parameters and statistical outputs of the fit. The forward model indicates that the incidence angle has a strong impact on the PMW Tb; however, the incidence angle derived from the ISAR-19 sampling was not representative of the instant incidence angle of the matching PMW data points. As a result, the standard deviation of the ship's roll (based on 10-sample windows) was used as a measure of the incidence angle uncertainty (ϵθ). WS was included as a predictor due to its significant influence on Tb. Conversely, the sensitivity analysis of ϕr and salinity indicated their low impact on Tb, leading to its exclusion from the retrievals equation. The final equation used for the regression analysis is as follows:
The variable t represents Tb−150, and the subscripts of t denote the specific PMW band and polarization involved. The term ϵ represents the observational uncertainty associated with the instruments and the input parameters, as shown in Eq. (2), where the subscript p refers to the parameters inducing uncertainties. These are instrumental, WS, and incidence angle uncertainties. The accuracy of SSTIR, ϵIR, was determined to be 0.01 K from the pre- and post-deployment calibration process. For the PMW instruments, the estimated instrumental uncertainty from sky measurements (as depicted in Fig. 5) was used. The WS uncertainty (ϵWS) was assumed to be 2 m s−1 (Nielsen-Englyst et al., 2018). Furthermore, the standard deviation array of the ship's roll (ϵθ) recorded by ISAR-19 was used as a reference of the incidence angle uncertainty.
The regression coefficients in Eq. (1) were calculated using SSTIR from ISAR-19 as the independent variable. These coefficients were computed based on a randomly selected “training” dataset, which comprised two-thirds of the matchup data. Equations (1) and (2) were separately applied to the three training datasets: all data, moving, and port, in order to observe the output under distinct conditions. Given the minimal roll during the mooring period and the limitations of ERA5 data near land, the wind speed, which is a measure of surface roughness, was set to zero for the two port periods under consideration. The resulting coefficients obtained from this analysis are presented in Table 2. The remaining matchup dataset (“test”) was used for retrieving the sea surface temperature (SSTPMW) and for further analysis.
5.2 Uncertainty estimation
An uncertainty propagation was performed in order to identify the main uncertainty components and the expected total retrieval uncertainty of the retrieved SSTPMW. The uncertainty resulting from a certain parameter is quantified as the standard deviation of the retrieved SST distribution when subjected to perturbations in that parameter. This analysis utilized the microwave forward model described in Sect. 4.3. Taking into account the possibility of a systematic bias between the forward model and actual observations, our focus is solely on measuring the variation in retrieved SST induced by specific perturbed parameters.
To evaluate the components in the uncertainty budget and estimate the total uncertainty, the first step involved setting reference values and uncertainties for the parameters that can affect the SST retrieval (Table 3) for moving and port cases. The parameters examined include the observed Tb (i.e. instrumental noise), wind speed (WS), salinity (SSS), incidence angle (θ), and relative angle (ϕr). Predictors in Eq. (1) are here referred to as explicit parameters (i.e. Tb and WS). The reference values of the explicit parameters were assigned with the values used for the SSTPMW retrieval, and their uncertainties were defined in the previous sections. The parameters not used as a predictor, hereafter referred to as an implicit parameter, including SSS, θ, and ϕr. Implicit parameters' reference values were derived by averaging the corresponding data points for moving and port data, and their uncertainty was obtained as the standard deviation (σ) during the observation period. The uncertainty of the incidence angle was set to ϵθ as obtained during the moving period. For the port condition, it was set to zero, as ϵθ was nearly zero during mooring.
Table 3Reference values for parameters that can affect SST retrieval, considered for the uncertainty estimation. The uncertainty perturbation of each parameter is denoted within parentheses.
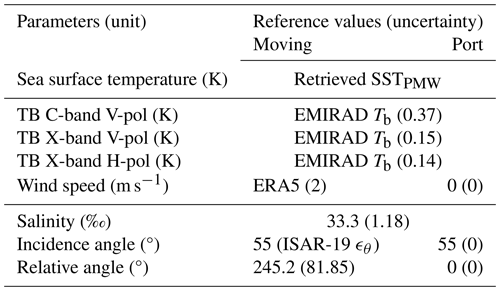
In the next step, a total of 100 000 samples for the parameter of interest were generated randomly. The samples followed a Gaussian distribution with a mean value equal to the parameter's reference value and a standard deviation equal to its uncertainty. For the subsequent step, distinct calculations were performed for the implicit and explicit parameters. For the implicit parameters, the generated distribution of a target parameter was inputted into the forward model along with the reference values of the remaining parameters. This process resulted in the generation of distributions of Tb for each channel (i.e. C-band V-pol, X-band V-pol, and X-band H-pol). It should be noted that the three Tb distributions generated for each implicit variable are correlated, whereas the Tb distributions for the instrumental noise for each channel are independent. These Tb distributions were then incorporated into the regression equation (Eq. 1) with coefficients for moving and port cases (Table 2), resulting in a distribution of SST. This analysis enables us to evaluate the level of uncertainty that arises from excluding the implicit parameters in the retrieval process, which are varying and affecting the microwave Tb. As for the explicit parameter, the generated distribution was directly used in the regression equation to obtain the SST distribution. Finally, the corresponding standard deviation values of the resulting SST distributions were calculated.
Once the uncertainties associated with individual parameters (contributors) were obtained, the total uncertainty SST induced by these parameters was calculated with Eq. (2). This calculation assumes that the uncertainty contributors are independent.
The average uncertainty values for each point in the dataset, derived from the perturbed input parameters analysis, are summarized in Table 4. The instruments contributed to an uncertainty of approximately 0.1 K, denoted as ϵSST. The uncertainty in salinity, represented by ϵSSS, had a negligible effect on Tb, and therefore it had minimal influence on the overall ϵSST for both conditions.
Table 4Uncertainty contributions to SST retrieval with induced values for each channel for moving and port conditions.
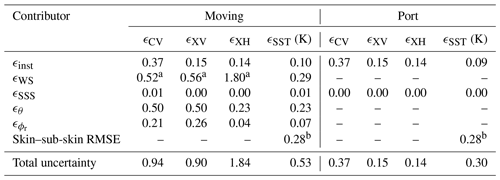
a These values were not used to calculate ϵSST. b Wurl et al. (2019)
In the case of moving data, the uncertainty in wind speed (surface roughness), denoted as ϵWS, had the greatest impact on ϵSST among the contributing factors, resulting in uncertainty of 0.29 K. When considering the incidence angle due to the ship's roll, it was estimated that its uncertainty, ϵθ, leads to 0.5 K uncertainty in vertically polarized Tb and 0.23 K in horizontally polarized Tb. These uncertainties contribute to an overall uncertainty of 0.23 K in ϵSST. On the other hand, the effect of 81.85° variation in ϕr had a minimal influence, inducing only 0.07 K uncertainty when propagated through the retrieval equation. This supports the previous decision to exclude ϕr from the retrieval process.
Moreover, it is important to account for the variability between skin and sub-skin SSTs in the uncertainty estimation. In situ measurements by Wurl et al. (2019) reveal a strong correlation between skin and sub-skin SSTs, with an RMSE of 0.28 K. Although this was obtained from different latitudes, it is here used as a reference of this geophysical component.
Consequently, the estimated total uncertainty of the retrieval of SST was 0.53 K for data collected while moving, whereas the uncertainty for the stationary time was smaller, estimated to be 0.30 K.
In Sect. 4.3 the atmospheric effect was set to zero due to the proximity of the surface to the sensor, minimizing the atmospheric mass and reducing the impact on upwelling emission and attenuation. However, this simplification overlooks that surface-reflected downwelling atmospheric emissions can still influence the Tb and consequently affect the SST retrieval. Unlike the upwelling emission, downwelling emission originates from the entire atmospheric column, from the surface to the top of the atmosphere, typically contributing around 3–5 K. The sea surface emissivity at a 55° incidence angle is approximately 0.55 for vertical polarization and 0.25 for horizontal polarization. This means that 45 % of the downwelling atmospheric emission can reach the sensor for vertical polarization, and 75 % for horizontal polarization, after being reflected at the sea surface. Therefore, it is important to note that atmospheric emission can influence the observed Tb by about 1–1.5 K, particularly for the horizontal polarization. However, due to the lack of simultaneous surface- and sky-looking observations at the same incidence angle, combined with an apparent positive offset in the sky measurements, it was challenging to perform reliable or meaningful uncertainty calculations related to downwelling atmospheric emissions.
Additionally, the possibility that certain explicit variables could introduce systematic uncertainties, thereby increasing overall uncertainties, cannot be ruled out. However, because of the limited availability of specific information or references needed to quantify these uncertainties, they were excluded from the uncertainty calculation in this study.
5.3 Comparisons of PMW and IR SST
Figure 8 presents scatter plots that depict the relationship between SSTPMW and SSTIR analysed for the test dataset, along with the corresponding coefficient of determination (R2) indicating the goodness of the fit. Uncertainty values of the SSTPMW retrieval have been added to Fig. 8b and c as analysed in the previous section and demonstrate that the derived uncertainties for the PMW retrievals are sensible. When considering all of the data (Fig. 8a), the obtained R2 value was 0.88, indicating a strong overall correlation between SSTPMW and SSTIR. However, when only moving data were considered (Fig. 8b), the R2 decreased to 0.45, indicating a weak correlation between SSTPMW and SSTIR. The SST values ranged from 280 to 286 K, with a positive mean difference between SSTPMW and SSTIR. In contrast, the port data (Fig. 8c) primarily comprised cold-water observations (IS), with SST values ranging from 275 to 278 K. In this case, the R2 of 0.83 indicates a better agreement between SSTPMW and SSTIR compared to the moving dataset. Nevertheless, some discrepancies were noted for the data collected in the slightly warmer waters of Tórshavn (FO).
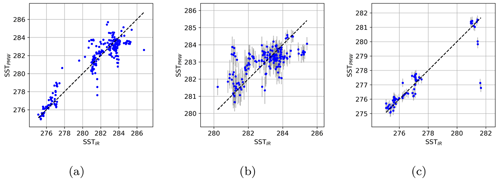
Figure 8Scatter plot comparing SSTIR and retrieved SSTPMW values for the test dataset and with the corresponding coefficients (Table 2). (a) Retrievals evaluated for the complete dataset (R2= 0.88) and separately for (b) moving data (R2= 0.45) and (c) port data (R2= 0.45). Grey bars depict the uncertainty estimations obtained in Sect. 5.2.
Figure 9 illustrates the time series of input variables and output SST of the retrieval process. The top panel displays SSTIR plotted alongside the retrieved SSTPMW, which is the combined result obtained from both the moving and port data. Especially for the first part of the campaign, i.e. before the first rain event (shaded blue area), there is good agreement between the two SSTs that remains up to 2 June when the ship was moored (IS). The agreement deteriorates during the last part of the campaign after 3 June, with the SSTIR showing more variability compared to the SSTPMW. The time series of Tb for the V-pol from both X and C bands are shown in Fig. 9b, Tb for the H-pol from the X band is shown in Fig. 9c, and WS and ϵθ are shown in Fig. 9d.
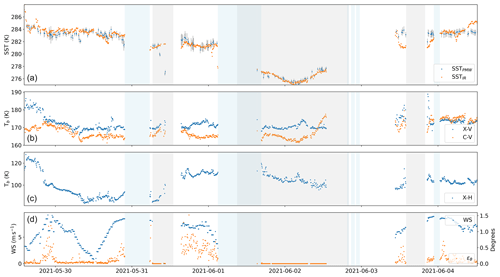
Figure 9Matchup data used in the comparison of SST from ISAR-19 and SST retrieved from EMIRAD throughout the campaign. From top to bottom: SSTPMW (separately obtained for moving and port data) with error bars and SSTIR, vertically polarized Tb, horizontally polarized Tb, and WS and ϵθ.
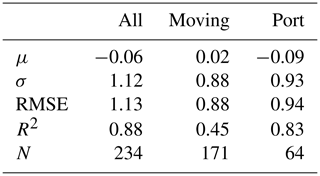
Table 5 shows the statistics of the comparison between SSTPMW and SSTIR. When considering all of the data, the mean difference was −0.06 K, indicating a minimal systematic bias. The RMSE was 1.13 K, reflecting the overall variability between the two signals. During the moving periods, the mean difference was closer to zero at 0.02 K, and the RMSE significantly decreased to 0.88 K. However, during port docking the mean bias slightly increased to −0.09 K, while the RMSE slightly increased to 0.94 K.
Table 5Comparison of SST retrieved from PMW Tb using the regression analysis and IR observations from ISAR-19.
To examine the potential impact of diurnal variability in atmospheric conditions on the sea surface, a comparative analysis of SSTPMW was conducted, as depicted in Fig. 10. The data were segregated into two categories based on the classification of day and night, with the time boundaries set at 08:00 and 22:00 UTC.
When all data were considered, there was a wider range of differences during daytime (Fig. 10a) compared to night-time (Fig. 10d), and although the mean bias μ was smaller by 0.1°, the standard deviation σ was higher by 0.5°. When moving data were considered (Fig. 10b, e), the distribution of biases for daytime was marginally wider even though the bias μ was positive (0.16°) compared to night-time (−0.17°), while the difference in σ was reduced to 0.26°. For port data (Fig. 10c, f), the pattern was reversed, with higher negative μ during daytime (−0.35°) compared to night-time (0.15°), and σ was significantly higher at 1.27° for daytime compared to 0.25 for night-time. Part of these higher differences in μ and σ can be attributed to diurnal variability in the SST and the difference between skin and sub-skin temperatures.
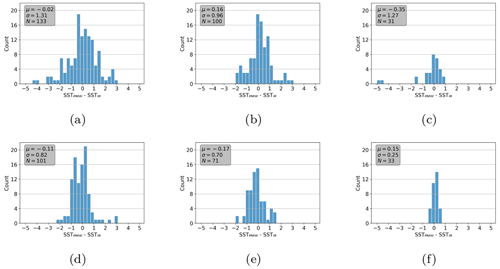
Figure 10Histogram of the difference between the retrieved SSTPMW and SSTIR for day (a, b, c) and night (d, e, f) conditions. Results are shown from left to right for all (a, d), moving (b, e), and port (c, f), respectively.
The analyses of the moving data show that the mean bias during daytime is positive (0.16 K), whereas during night-time it is negative (−0.17). The magnitude of the reported bias suggests that the night-time difference is consistent with the cool-skin effect, while during daytime the slightly positive bias suggests no major effect of a diurnal near-surface warm layer on the bias (Gentemann et al., 2003; Gentemann and Minnett, 2008; Alappattu et al., 2017).
5.4 Comparison to satellite products
To assess the bias of the retrieved SST from EMIRAD against available SST products, data from Sentinel 3 SLSTR and AMSR2 level 2 (10 GHz) were utilized. The satellite data were separately matched to the retrieved (test) data subset by considering a time window of 3 h and a spatial window of 0.1°. This matching process resulted in 53 SLSTR data points and 40 AMSR2 data points.
Figure 11 illustrates the scatter plot and histogram of the comparison between EMIRAD's retrieved SST and SLSTR, followed by the comparison to AMSR2.
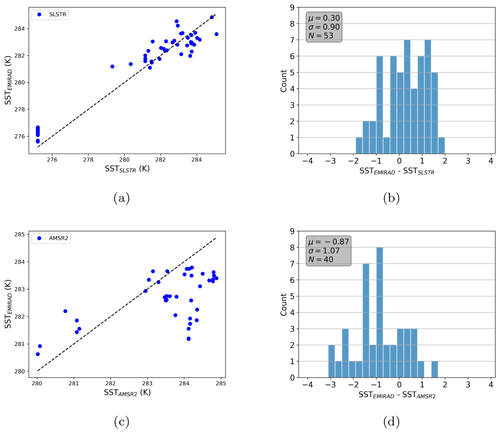
Figure 11Comparison of EMIRAD-retrieved SST against satellite products. Datasets were matched separately for SLSTR (a, b) and AMSR2 (c, d).
SLSTR and EMIRAD SST appear to be in good agreement, with a mean bias of 0.3 K, standard deviation of 0.9 K (Fig. 11b), and SSTskin being colder. On the other hand, when comparing microwave-derived SSTPMW, AMSR2 shows warmer temperatures than those retrieved from EMIRAD (μ= −0.87 K) and higher variability (σ = 1.07 K) (Fig. 11d).
Despite the relatively large temporal and spatial windows used to search for matching data points, no correlation was found between the distance or time difference of these points and the magnitude of the SST bias.
This study presents a unique comparison of sea surface temperature (SST) obtained from simultaneous thermal infrared (IR) and passive microwave (PMW) radiometer measurements during a week-long shipborne campaign from Denmark to Iceland in the early summer of 2021. Using a shipborne dataset reduces the need for atmospheric correction, allowing the analysis to focus on instrumentation and physical processes at the ocean surface. However, even without atmospheric corrections a key challenge remains, as SSTskin and SSTsubskin are influenced by different physical processes, particularly the skin layer effect and diurnal warming (Fairall et al., 1996; Donlon et al., 2002; Gentemann et al., 2009). The IR SSTskin measurements provide data of the uppermost micrometres of the ocean surface, and thus they are highly sensitive to the atmospheric conditions and the cool-skin effect. In contrast, the PMW measurements capture the temperature slightly deeper within the sub-skin layer. While the difference in the nature of the measurements is acknowledged, IR SSTskin measurements from the ISAR instrument were used as a baseline for deriving the SSTPMW. This approach was chosen because IR measurements, despite their sensitivity to surface conditions, offer a well-documented and stable reference, essential for calibrating and validating the more experimental PMW measurements using the ERMIRAD. The PMW retrieval thereby implicitly involved adjusting for the mean sub-skin temperature towards the skin temperature through the coefficient that incorporates a constant offset (c0). The variability in the cool-skin effect remains when comparing different types of retrieved SSTs, with wind speed being a primary driver of this effect and thus a component of the retrieval equation.
The matchup dataset was constructed by considering a time window of up to 5 min between the actual observed values without performing any sample averaging. The choice of the time window length was based on the lowest sampling rate among the four instruments involved (i.e. ISAR-19). This decision led to a reduced dataset for the comparison, presenting a challenge for the data analyses and chosen methodologies due to the small number of data points available when separating them into different categories (i.e. moving, port, day, and night). The resulting matchup dataset used for the comparison also excluded the C-band H-pol given the noisy signal obtained from the instrument throughout most of the campaign. The reasons for this noisy signal remain unknown, but it is speculated that resulted from the sensitivity of the C-band H-pol to RFI and cable connection issues.
The geophysical impact on the variability of the collected dataset was assessed by looking into the spatial and temporal variability of Tb and comparing it with that of SSTIR. The ISAR instrument and the three usable channels (X-band H-pol and V-pol and C-band V-pol) of the EMIRAD instrument were analysed. Figure 6 showed an overall higher variability for the PMW bands compared to the SSTIR. The H-pol channel exhibited the highest temporal and spatial variability for the moving data, as shown in Fig. 6a and b, and this variability was even more pronounced in the port data (Fig. 6c). However, for sky measurements in which little geophysical impact is involved, the variability was minimal (Fig. 5). This confirms what is already known from the literature regarding the impact of various physical parameters on Tb (Nielsen-Englyst et al., 2021; Wentz and Meissner, 2000).
In order to define the retrieval algorithm, the sensitivity of the PMW bands to the geophysical factors involved and the data availability were considered. The sensitivity of simulated Tb to geophysical parameters for the EMIRAD frequencies was used to quantify the impact of wind speed on the H-pol channel (Fig. 7a). Although wind speed and wind direction measurements were not directly available for this analysis, ERA5 data were used as a coarse approximation. This may explain the general variability observed in the X-band H-pol signal (Fig. 4c), as wind conditions can change rapidly compared to other geophysical parameters that vary more slowly, such as SST. The uncertainty analysis (Table 4) revealed that an uncertainty in wind speed of 2 m s−1 would result in a Tb measurement uncertainty of 1.8 K for this particular channel, while for the V polarization of both channels, the uncertainty would be below 0.6 K. The forward model simulations also revealed a strong sensitivity of both vertical and horizontal polarization at the C- and X-band frequencies to minor changes in the incidence angle (Fig. 7b). This is consistent with previous studies (Wentz and Meissner, 2000) and can be explained by the angular dependency of sea surface emissivity, which is largely described by the Fresnel equation, being greater in microwave regions than in infrared regions (Masuda et al., 1988). The uncertainty analyses further highlighted the sensitivity of the retrieval method to the incidence angle. ϵθ has a larger impact on the V polarization of both channels and consequently on the estimation of SST. This underscores the importance of accurately measuring θ along with Tb for the retrieval of SSTPMW. The lack of measurement of the incidence angle during PMW data collection limited our ability to fully account for the effect of these variations in the retrieval process. Future campaigns should prioritize the integration of high-precision inertial measurement units (IMUs) or similar instrumentation to continuously account for the exact incidence angle during PMW data collection to improve the robustness and reliability of the SST retrievals from PMW measurements.
As per Donlon et al. (2002), the cool-skin effect tends to be smaller above a wind speed of 6 m s−1, particularly at night. The wind speed dependence analysis of the SST differences for the moving dataset collected during night-time indicates that this is the case for winds above 6 m s−1 but shows cooler SSTPMW at low wind speed, which makes it prevail over the subset analysis (μ= −0.17 in Fig. 10e). The bias for daytime instead indicates that SSTPMW is generally warmer compared to SSTskin, particularly at instances where the wind exceeded 8 m s−1, leading to μ=0.16, as seen in Fig. 10b. In contrast, the analysis for data collected in port did not take wind speed into account during the retrieval process. Consequently, a relatively warm skin temperature is observed during daytime, while a lower skin temperature is noted at night-time, aligning with the findings in Donlon et al. (2002).
The regression analysis was conducted to define the retrieval equation, and its performance was assessed with and without splitting the dataset. Although the splitting process significantly reduced the dataset, the coefficients of determination (R2) for the three fits changed by less than 0.01 for each data subset. However, it is important to note that the RMSE between the observed and retrieved SST increased by 0.17 K when considering the port data. On the other hand, when the regression was applied to the entire dataset without splitting, it resulted in a very small mean bias in the SST, raising concerns about potential over-fitting of the regression model. Thus, coefficients were obtained using the split dataset (training and test) despite the limited number of data matchups available.
The results of this study, which are based on a small dataset, should be interpreted with caution. Nonetheless, they offer insights into the relationship between SSTPMW and SSTskin. The comparison between retrieved SSTPMW and measured SSTskin shows general concordance, largely aligning within the derived uncertainty budget for the SSTPMW values, attributable to instrumental and geophysical factors. One exception is, however, during the last part of the campaign from Iceland to the Faroe Islands. These disagreements are likely due to the lack of precise observational data on the geophysical parameters that influence the signal variability (e.g. incidence angle, wind speed, solar radiation, and sea surface roughness). In future studies, physical models could be employed to account for the skin layer effect and diurnal warming, provided complementary observations of the near-surface ocean conditions are available. Despite the challenge of obtaining direct sub-skin temperature measurements at the precise depth, such data would be particularly valuable as a reference for validation.
In 2021, an unprecedented preliminary study was undertaken, marking a significant step forward in the field of oceanic temperature monitoring. This study involved the simultaneous acquisition of shipborne data utilizing both IR and PMW instruments. These instruments were mounted in close proximity during a week-long campaign traversing from Denmark to Iceland. Notably, the PMW radiometers were refurbished specifically for this study, while a well-documented IR radiometer served as the reference for retrieving SST from the PMW measurements.
The analysis of the unique dataset obtained has yielded valuable insights into the intricate challenges associated with capturing and establishing the relationship between skin and sub-skin SSTs. This study underscores the pressing need for further advancements in PMW instrument design to ensure a robust association between these two SST observations.
Furthermore, our assessment of the uncertainty budget for the PMW observations included a sensitivity analyses of Tb to various physical parameters, particularly emphasizing the importance of accurately accounting for the incidence angle of PMW measurements and the wind speed and direction.
Drawing from the data collected and the knowledge gained from PMW brightness temperature measurements, this study proposes enhancements for the design and execution of future IR–PMW shipborne and aerial inter-comparison campaigns.
-
Prioritize instrument design considerations. Special attention should be given to the instrument design, particularly in terms of its sensitivity to external RFI noise. In this study, the C-band H-pol channel output data were affected due to high RFI levels, making them unusable. Therefore, measures should be taken to minimize RFI and optimize instrument performance.
-
Address cable losses. Account for changes in cable losses when manipulating the antennas, as this can have a noticeable impact on the performance of specific channels. For instance, in this case, the X-band H-pol was affected. By addressing cable losses, the accuracy and reliability of the measurement can be improved.
-
Enhance data collection with independent instrumentation. To gain a deeper understanding of the effects of incidence angles on PMW data collection, it is recommended that PMW instruments be equipped with additional independent sensors. These could include geolocation instruments, inertial measurement units, or sensors to measure other external parameters for each Tb sample collected. Furthermore, conducting simultaneous surface- and sky-looking observations at the same incidence angle will help by accounting for the influence of surface-reflected atmospheric emissions. This enhanced data collection will provide valuable context, improving both the interpretability and accuracy of the PMW measurements.
-
Consider complementary weather observations. To account for the sensitivities of PMW instruments to local atmospheric variations at small scales, it is advisable to ensure that the IR–PMW matchup dataset encompasses complementary weather conditions throughout the ship's course. This will provide a broader range of conditions for analysis and enable a more comprehensive assessment of the instruments' performance.
-
Provide in situ observations of SSTsubskin. To create an improved characterization of the PMW retrieval algorithm and its uncertainties and to evaluate the average cool-skin effect, it is advised to equip the ship with instrumentation capable of monitoring in situ SSTsubskin throughout the cruise.
-
Ensure a larger matchup dataset. Because of the multiple conditions that prevent simultaneous data collection from different instruments, a longer campaign or a larger sampling rate of the collection will ensure a more confident conclusion about the retrieval algorithm's effectiveness and provide a more significant data comparison.
In implementing these recommendations, future IR–PMW shipborne and aerial inter-comparison campaigns stand to benefit from enhanced instrument performance, improved measurement accuracy, and a more profound understanding of the intricate relationships between IR and PMW measurements. This preliminary study serves as a pivotal milestone in laying the groundwork for simultaneous IR–PMW observations, offering a unique opportunity to delve deeper into the distinct SST measurements captured by these methods. Through consideration of these recommendations, progress can be achieved in oceanic temperature monitoring techniques. This advancement is crucial, especially in light of upcoming projects like CIMR, emphasizing the need for improved combined methods in SST monitoring. Such progress holds significant implications for climate research, environmental management, and maritime industries.
The software code used in this study was developed in-house and is Python-based. It is not publicly available but can be made available upon request. Interested parties can contact the corresponding author to access the codes developed for this study.
The dataset used in this study is not publicly available due to its small size and the absence of a formal requirement for public sharing at the time of publication. However, the data can be made available upon request. Interested parties can contact the corresponding author to access the dataset and related materials.
JLH and SSS conceived the idea and design of the experiment. SSS and SS executed the campaign. GG processed and analysed the data. HS performed the sensitivity and uncertainty analyses. A thorough review was made by IK and CD, and all co-authors contributed to the interpretation of results.
The contact author has declared that none of the authors has any competing interests.
Publisher’s note: Copernicus Publications remains neutral with regard to jurisdictional claims made in the text, published maps, institutional affiliations, or any other geographical representation in this paper. While Copernicus Publications makes every effort to include appropriate place names, the final responsibility lies with the authors.
The authors gratefully acknowledge the support of the ESA FRM4SST project (https://ships4sst.org, last access: 9 December 2024), which provided funding for this research. We acknowledge the use of SLSTR data from the European Space Agency's Copernicus Sentinel-3 mission. The data were downloaded using a universal Sentinel download script by Ben Loveday, Hayley Evers-King (Plymouth Marine Laboratory, EUMETSAT). We thank the Japan Aerospace Exploration Agency (JAXA) for producing the AMSR2 level 2 data product, which is accessible through the Globe Portal System (G-Portal) at https://gportal.jaxa.jp/gpr/ (last access: 9 December 2024). Finally, we acknowledge the use of ERA5 data from the European Centre for Medium-Range Weather Forecasts (ECMWF) and the DMI-HYCOM salinity dataset by Mads H. Ribergaard and Till S. Rasmussen from Ocean DMI.
Furthermore, we express our gratitude to the Smyril Line passenger ferry, Norröna, for their invaluable support of this research endeavour.
This research has been supported by the European Space Agency (grant no. FRM4SST – Fiducial Reference Measurements for Sea Surface Temperature).
This paper was edited by Lev Eppelbaum and reviewed by two anonymous referees.
Alappattu, D. P., Wang, Q., Yamaguchi, R., Lind, R. J., Reynolds, M., and Christman, A. J.: Warm layer and cool skin corrections for bulk water temperature measurements for air-sea interaction studies, J. Geophys. Res.-Oceans, 122, 6470–6481, https://doi.org/10.1002/2017JC012688, 2017. a
Alerskans, E., Høyer, J. L., Gentemann, C. L., Pedersen, L. T., Nielsen-Englyst, P., and Donlon, C.: Construction of a climate data record of sea surface temperature from passive microwave measurements, Remote Sens. Environ., 236, 111485, https://doi.org/10.1016/j.rse.2019.111485, 2020. a, b, c
Bojinski, S., Verstraete, M., Peterson, T. C., Richter, C., Simmons, A., and Zemp, M.: The concept of essential climate variables in support of climate research, applications, and policy, B. Am. Meteorol. Soc., 95, 1431–1443, https://doi.org/10.1175/BAMS-D-13-00047.1, 2014. a
Castro, S. L., Wick, G. A., Jackson, D. L., and Emery, W. J.: Error characterization of infrared and microwave satellite sea surface temperature products for merging and analysis, J. Geophys. Res.-Oceans, 113, 03010, https://doi.org/10.1029/2006JC003829, 2008. a
Dickson, B., Meincke, J., and Rhines, P.: Arctic–Subarctic Ocean Fluxes: Defining the Role of the Northern Seas in Climate: A General Introduction, Springer, ISBN 978-1-4020-6774-7, 2008. a
Donlon, C., Robinson, I., Casey, K. S., Vazquez-Cuervo, J., Armstrong, E., Arino, O., Gentemann, C., May, D., LeBorgne, P., Piolle, J., Barton, I., Beggs, H., Poulter, D. J. S., Merchant, C., Bingham, A., Heinz, S., Harris, A., Wick, G., Emery, B., Minnett, P., Evans, R., Llewellyn-Jones, D., Mutlow, C., Reynolds, RW., Kawamura, H. and Rayner, N.: The global ocean data assimilation experiment high-resolution sea surface temperature pilot project, B. Am. Meteorol. Soc., 88, 1197–1214, 2007. a
Donlon, C., Robinson, I. S., Reynolds, M., Wimmer, W., Fisher, G., Edwards, R., and Nightingale, T. J.: An infrared sea surface temperature autonomous radiometer (ISAR) for deployment aboard volunteer observing ships (VOS), J. Atmos. Ocean. Tech., 25, 93–113, https://doi.org/10.1175/2007JTECHO505.1, 2008. a, b
Donlon, C., Berruti, B., Buongiorno, A., Ferreira, M. H., Féménias, P., Frerick, J., Goryl, P., Klein, U., Laur, H., Mavrocordatos, C., Nieke, J., Rebhan, H., Seitz, B., Stroede, J., and Sciarra, R.: The Global Monitoring for Environment and Security (GMES) Sentinel-3 mission, Remote Sens. Environ., 120, 37–57, https://doi.org/10.1016/j.rse.2011.07.024, 2012. a
Donlon, C. J., Minnett, P. J., Gentemann, C., Nightingale, T. J., Barton, I. J., Ward, B., and Murray, M. J.: Toward improved validation of satellite sea surface skin temperature measurements for climate research, J. Climate, 15, 353–369, https://doi.org/10.1175/1520-0442(2002)015<0353:TIVOSS>2.0.CO;2, 2002. a, b, c, d
Donlon, C. J., Minnett, P. J., Fox, N., and Wimmer, W.: Strategies for the Laboratory and Field Deployment of Ship-Borne Fiducial Reference Thermal Infrared Radiometers in Support of Satellite-Derived Sea Surface Temperature Climate Data Records, in: Optical Radiometry for Ocean Climate Measurements, edited by: Zibordi, G., Donlon, C., and Parr, A., Chap. 5.2, 557–603, Academic Press, https://doi.org/10.1016/B978-0-12-417011-7.00018-0, 2014a. a
Donlon, C. J., Minnett, P. J., Jessup, A., Barton, I., Emery, W., Hook, S., Wimmer, W., Nightingale, T. J., and Zappa, C.: Chapter 3.2 – Ship-Borne Thermal Infrared Radiometer Systems, in: Optical Radiometry for Ocean Climate Measurements, edited by: Zibordi, G., Donlon, C. J., and Parr, A. C., vol. 47 of Experimental Methods in the Physical Sciences, 305–404, Academic Press, https://doi.org/10.1016/B978-0-12-417011-7.00011-8, 2014b. a, b, c
Embury, O., Merchant, C. J., and Corlett, G. K.: A reprocessing for climate of sea surface temperature from the along-track scanning radiometers: Initial validation, accounting for skin and diurnal variability effects, Remote Sens. Environ., 116, 62–78, 2012. a
Fairall, C. W., Bradley, E. F., Godfrey, J. S., Wick, G. A., and Edson, J. B.: Cool-skin and warm-layer effect on sea surface temperature, J. Geophys. Res., 101, 1295–1308, 1996. a
GCOM-W: GCOM-W/AMSR2 L2 Sea Surface Temperature Product, https://doi.org/10.57746/EO.01gs73b0qqn52pqrxsqrjpcbbj, 2012. a
Gentemann, C. L.: Three way validation of MODIS and AMSR-E sea surface temperatures, J. Geophys. Res.-Oceans, 119, 2583–2598, 2014. a, b, c
Gentemann, C. L. and Hilburn, K. A.: In situ validation of sea surface temperatures from the GCOM-W1 AMSR2 RSS calibrated brightness temperatures, J. Geophys. Res.-Oceans, 120, 2813–2825, https://doi.org/10.1002/2014JC010574, 2015. a
Gentemann, C. L. and Minnett, P. J.: Radiometric measurements of ocean surface thermal variability, J. Geophys. Res.-Oceans, 113, C08017, https://doi.org/10.1029/2007JC004540, 2008. a
Gentemann, C. L., Donlon, C. J., Stuart-Menteth, A., and Wentz, F. J.: Diurnal signals in satellite sea surface temperature measurements, Geophys. Res. Lett., 30, 1140, https://doi.org/10.1029/2002GL016291, 2003. a
Gentemann, C. L., Minnett, P. J., and Ward, B.: Profiles of ocean surface heating (POSH): A new model of upper ocean diurnal warming, J. Geophys. Res.-Oceans, 114, C07017, https://doi.org/10.1029/2008JC004825, 2009. a
Gentemann, C. L., Meissner, T., and Wentz, F. J.: Accuracy of satellite sea surface temperatures at 7 and 11 GHz, IEEE T. Geosci. Remote, 48, 1009–1018, https://doi.org/10.1109/TGRS.2009.2030322, 2010. a
Gladkova, I., Ignatov, A., Shahriar, F., Kihai, Y., Hillger, D., and Petrenko, B.: Improved VIIRS and MODIS SST Imagery, Remote Sensing, 8, 79, https://doi.org/10.3390/rs8010079, 2016. a
Hersbach, H., Bell, B., Berrisford, P., Hirahara, S., Horányi, A., Muñoz-Sabater, J., Nicolas, J., Peubey, C., Radu, R., Schepers, D., Simmons, A., Soci, C., Abdalla, S., Abellan, X., Balsamo, G., Bechtold, P., Biavati, G., Bidlot, J., Bonavita, M., De Chiara, G., Dahlgren, P., Dee, D., Diamantakis, M., Dragani, R., Flemming, J., Forbes, R., Fuentes, M., Geer, A., Haimberger, L., Healy, S., Hogan, R. J., Hólm, E., Janisková, M., Keeley, S., Laloyaux, P., Lopez, P., Lupu, C., Radnoti, G., de Rosnay, P., Rozum, I., Vamborg, F., Villaume, S., and Thépaut, J. N.: The ERA5 global reanalysis, Q. J. Roy. Meteor. Soc., 146, 1999–2049, https://doi.org/10.1002/qj.3803, 2020. a
Høyer, J. L., Skarpalezos, S., and Sten, S.: Protocols for Radiometer Deployments, Tech. rep., ESA, https://ships4sst.org/sites/default/files/documents/FRM4SST-PRD-DMI-001_Issue-1.pdf, (last access: 26 September 2024), 2021a. a
Høyer, J. L., Skarpalezos, S., and Sten, S.: Charcterization Report, Tech. rep., ESA, https://ships4sst.org/sites/default/files/documents/FRM4SST-CR-DMI-001_Issue-1.pdf, (last access: 26 September 2024), 2021b. a, b, c, d
Jiménez, C., Tenerelli, J., Prigent, C., Kilic, L., Lavergne, T., Skarpalezos, S., Høyer, J. L., Reul, N., and Donlon, C.: Ocean and Sea Ice Retrievals From an End-To-End Simulation of the Copernicus Imaging Microwave Radiometer (CIMR) 1.4–36.5 GHz Measurements, J. Geophys. Res.-Oceans, 126, e2021JC017610, https://doi.org/10.1029/2021JC017610, 2021. a
Le Menn, M., Poli, P., David, A., Sagot, J., Lucas, M., O'Carroll, A., Belbeoch, M., and Herklotz, K.: Development of surface drifting buoys for fiducial reference measurements of sea-surface temperature, Frontiers in Marine Science, 6, 578, https://doi.org/10.3389/fmars.2019.00578, 2019. a
Mai, M., Zhang, B., Li, X., Hwang, P. A., and Zhang, J. A.: Application of AMSR-E and AMSR2 low-frequency channel brightness temperature data for hurricane wind retrievals, IEEE T. Geosci. Remote, 54, 4501–4512, 2016. a
Masuda, K., Takashima, T., and Takayama, Y.: Emissivity of pure and sea waters for the model sea surface in the infrared window regions, Remote Sens. Environ., 24, 313–329, https://doi.org/10.1016/0034-4257(88)90032-6, 1988. a, b
Meissner, T. and Wentz, F. J.: The emissivity of the ocean surface between 6 and 90 GHz over a large range of wind speeds and earth incidence angles, IEEE T. Geosci. Remote, 50, 3004–3026, https://doi.org/10.1109/TGRS.2011.2179662, 2012. a
Merchant, C. J., Embury, O., Bulgin, C. E., Block, T., Corlett, G. K., Fiedler, E., Good, S. A., Mittaz, J., Rayner, N. A., Berry, D., Eastwood, S., Taylor, M., Tsushima, Y., Waterfall, A., Wilson, R., and Donlon, C.: Satellite-based time-series of sea-surface temperature since 1981 for climate applications, Scientific Data, 6, 1–18, https://doi.org/10.1038/s41597-019-0236-x, 2019. a
Minnett, P. J., Alvera-Azcárate, A., Chin, T. M., Corlett, G. K., Gentemann, C. L., Karagali, I., Li, X., Marsouin, A., Marullo, S., Maturi, E., Santoleri, R., Saux Picart, S., Steele, M., and Vazquez-Cuervo, J.: Half a century of satellite remote sensing of sea-surface temperature, Remote Sens. Environ., 233, 111366, https://doi.org/10.1016/j.rse.2019.111366, 2019. a
Nielsen-Englyst, P., Høyer, J. L., Pedersen, L. T., Gentemann, C. L., Alerskans, E., Block, T., and Donlon, C.: Optimal estimation of sea surface temperature from AMSR-E, Remote Sensing, 10, 229, https://doi.org/10.3390/rs10020229, 2018. a, b
Nielsen-Englyst, P., Høyer, J. L., Alerskans, E., Pedersen, L. T., and Donlon, C.: Impact of channel selection on SST retrievals from passive microwave observations, Remote Sens. Environ., 254, 112252, https://doi.org/10.1016/j.rse.2020.112252, 2021. a, b, c, d
Njoku, E.: Passive microwave remote sensing of the earth from space – A review, P. IEEE, 70, 728–750, https://doi.org/10.1109/PROC.1982.12380, 1982. a, b
O’Carroll, A. G., Armstrong, E. M., Beggs, H. M., Bouali, M., Casey, K. S., Corlett, G. K., Dash, P., Donlon, C. J., Gentemann, C. L., Høyer, J. L., Ignatov, A., Kabobah, K., Kachi, M., Kurihara, Y., Karagali, I., Maturi, E., Merchant, C. J., Marullo, S., Minnett, P. J., Pennybacker, M., Ramakrishnan, B., Ramsankaran, R., Santoleri, R., Sunder, S., Saux, P. S., Vázquez-Cuervo, J., and Wimmer, W.: Observational needs of sea surface temperature, Frontiers in Marine Science, 6, 420, https://doi.org/10.3389/fmars.2019.00420, 2019. a, b
Ponsoni, L., Ribergaard, M. H., Nielsen-Englyst, P., Wulf, T., Buus-Hinkler, J., Kreiner, M. B., and Rasmussen, T. A. S.: Greenlandic sea ice products with a focus on an updated operational forecast system, Frontiers in Marine Science, 10, 138, https://doi.org/10.3389/fmars.2023.979782, 2023. a
Prigent, C., Aires, F., Bernardo, F., Orlhac, J.-C., Goutoule, J.-M., Roquet, H., and Donlon, C.: Analysis of the potential and limitations of microwave radiometry for the retrieval of sea surface temperature: Definition of MICROWAT, a new mission concept, J. Geophys. Res.-Oceans, 118, 3074–3086, 2013. a
Søbjærg, S. S., Kristensen, S. S., Balling, J. E., and Skou, N.: The airborne EMIRAD L-band radiometer system, Geoscience and Remote Sensing (igarss), IEEE International Symposium, Melbourne, Australia, 21–26 July 2013, 1900–1903, https://doi.org/10.1109/IGARSS.2013.6723175, 2013. a
Søbjærg, S. S., Balling, J. E., and Skou, N.: Performance assessment of an LNA used as active cold load, in: 2015 IEEE International Geoscience and Remote Sensing Symposium (IGARSS), 4742–4745, https://doi.org/10.1109/IGARSS.2015.7326889, 2015. a
Theocharous, E., Usadi, E., and Fox, N.: CEOS comparison of IR brightness temperature measurements in support of satellite validation. Part I: Laboratory and Ocean surface temperature comparison of radiation thermometers, Tech. rep., NPL Report, OP 3, http://eprintspublications.npl.co.uk/id/eprint/4744 (last access: 9 December 2024), 2010. a
Theocharous, E., Fox, N. P., Barker-Snook, I., Niclòs, R., Garcia Santos, V., Minnett, P. J., Göttsche, F. M., Poutier, L., Morgan, N., Nightingale, T., Wimmer, W., Høyer, J., Zhang, K., Yang, M., Guan, L., Arbelo, M., and Donlon, C. J.: The 2016 CEOS infrared radiometer comparison: Part II: Laboratory comparison of radiation thermometers, J. Atmos. Ocean. Tech., 36, 1079–1092, https://doi.org/10.1175/JTECH-D-18-0032.1, 2019. a
Thépaut, J.-N., Dee, D., Engelen, R., and Pinty, B.: The Copernicus programme and its climate change service, in: IGARSS 2018-2018 IEEE International Geoscience and Remote Sensing Symposium, Valencia, Spain, 22–27 July 2018, 1591–1593, https://doi.org/10.1109/IGARSS.2018.8518067, 2018. a
Wentz, F. J. and Meissner, T.: Algorithm theoretical basis document (ATBD): AMSR ocean algorithm (version 2), RSS Tech. Proposal 121599A-1, Remote Sensing Systems, Santa Rosa, CA, https://eospso.gsfc.nasa.gov/sites/default/files/atbd/atbd-amsr-ocean.pdf (last access: 9 December 2024), 2000. a, b, c, d, e
Wimmer, W. and Robinson, I. S.: The ISAR instrument uncertainty model, J. Atmos. Ocean. Tech., 33, 2415–2433, https://doi.org/10.1175/JTECH-D-16-0096.1, 2016. a, b, c
Wimmer, W., Robinson, I. S., and Donlon, C. J.: Long-term validation of AATSR SST data products using shipborne radiometry in the Bay of Biscay and English Channel, Remote Sens. Environ., 116, 17–31, 2012. a, b
Wurl, O., Landing, W. M., Mustaffa, N. I. H., Ribas-Ribas, M., Witte, C. R., and Zappa, C. J.: The Ocean's Skin Layer in the Tropics, J. Geophys. Res.-Oceans, 124, 59–74, https://doi.org/10.1029/2018JC014021, 2019. a, b


