the Creative Commons Attribution 4.0 License.
the Creative Commons Attribution 4.0 License.
 | 08 May 2025
Electrical resistivity imaging data for hydrological and soil investigations of virgin Rospuda River peatland (north-eastern Poland)
Grzegorz Sinicyn
Łukasz Kaczmarek
Radosław Mieszkowski
Stanisław Mieszkowski
Bartosz Bednarz
Krzysztof Kochanek
Mateusz Grygoruk
Maria Grodzka-Łukaszewska
The paper deals with the application of the geophysical method for the investigation of the near-subsurface fragile hydrological environments. The study delivers geophysical measurement data performed in the Rospuda wetlands located in north-eastern Poland. The measurements were carried out by means of the electrical resistivity imaging (ERI; also called electrical resistivity tomography, ERT) method, which so far has never been used in this region of the river Rospuda peatland valley. The ERI data were collected in a single survey campaign in November 2022 to account for the wet season. During the campaign, two ERI profiles were measured. The aim of the fieldwork was to provide material for illustration of the arrangement of geological layers creating the wetland. A data repository contains detailed descriptions for each survey site. The study revealed a strong interaction between groundwater, characterized by a thick sandy aquifer, and surface water. In this system, surface present peat constitutes the dominant soil component within the contact zone between groundwater and surface water (with drainage river type). Variations in this relationship will have a direct impact on peat stability and associated hydrological processes. The water-saturated peat electrical resistivity zone (10–40 Ω m) has a thickness ranging from a few to several meters at a maximum (the highest thickness of peats is present near the Rospuda River).
- Article
(8416 KB) - Full-text XML
- BibTeX
- EndNote


Peatlands constitute unique areas of the interaction between soil, groundwater, and surface water (Limpens et al., 2008). The organic soils, extremely valuable for the environment, due to their accumulation properties (water, carbon dioxide, organic matter; Kane et al., 2019; Word et al., 2022), high compressibility, and variable water permeability depending on the tension level (Paniagua et al., 2021; Long et al., 2022), constitute a great challenge in terms of planning their protection and potential development. Due to challenging availability and high variability of geological conditions, all the data considering wetlands become very important input for further analyses, numerical calculations, and field and laboratory tests. Mostly because of the environmental uniqueness of case study areas, the non-invasive method of electrical resistivity imaging (ERI; which does not need heavy transportation to be moved) fits perfectly into the circumstances of achievable tests (i.a., Slater and Reeve, 2002; Kowalczyk et al., 2017; Minasny et al., 2019; Pezdir et al., 2021). ERI is a geophysical method used to investigate subsurface structures by measuring electrical resistivity variations. In environmental studies, it helps monitor soil water content distribution, soil structure (i.a., high-resistivity diversity of peats; compare results of Pezdir et al., 2021, and Kaczmarek et al., 2024), and permafrost dynamics, which are important for assessing climate change impacts. Thus, it is particularly valuable for detecting changes in permafrost thawing, carbon-rich soil degradation (especially peats), and hydrological processes influenced by rising temperatures.
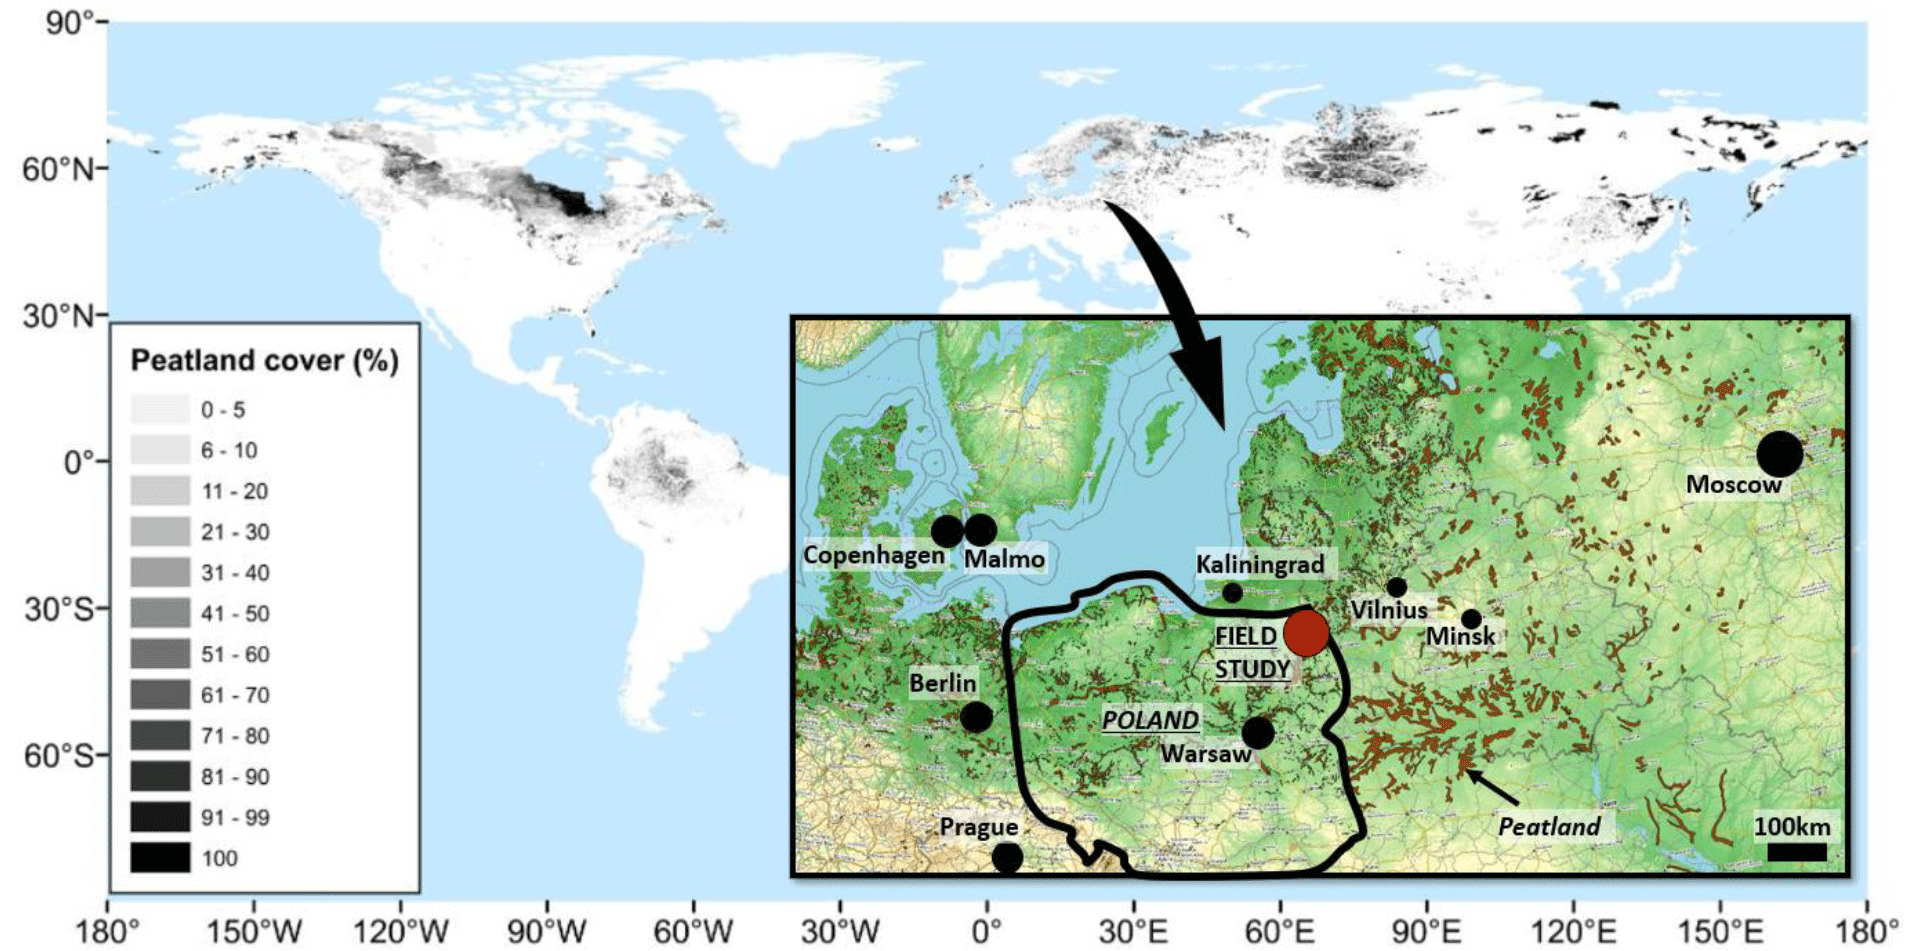
Figure 1Localization of the field study, with the background of world peatland cover (modified from Xu et al., 2017).
The research is of reference nature for peatlands occurring in this part of Europe, also because of the research technique, which provides continuous identification of ground variability. The study considers electrical resistivity imaging results of the exemplary section of the Rospuda River valley, of which the structure is original (no anthropogenic influence). The field study is located in east-central Europe, north-eastern Poland (close to the border with Belarus); see Fig. 1.
Rospuda River valley was formed as peatland, which developed in the large land depression in the Holocene (deglaciation in the Würm–Vistulian phase; see Fig. 2). The valley of the Rospuda River is vast (in the region of analysis, it ranges from around 0.5 to 1.5 km), which is related to the glacial history of this region. Nowadays, the meandering river is in the middle (south part of the research area) and close to the west bank (north part of the research area) of the valley mentioned above, which has around 2.5 km between geophysical prospection lines. The analyzed area is surrounded by a large forest complex; the entire region is a Rospuda Valley Protected Landscape Area (which also partly constitutes the Professor Aleksander Sokołowski Rospuda Valley Reserve). Figure 2 presents geomorphology with the topographic situation, the location of archival geological cross-sections (Fig. 3), and the geophysical prospection lines' location performed within them.
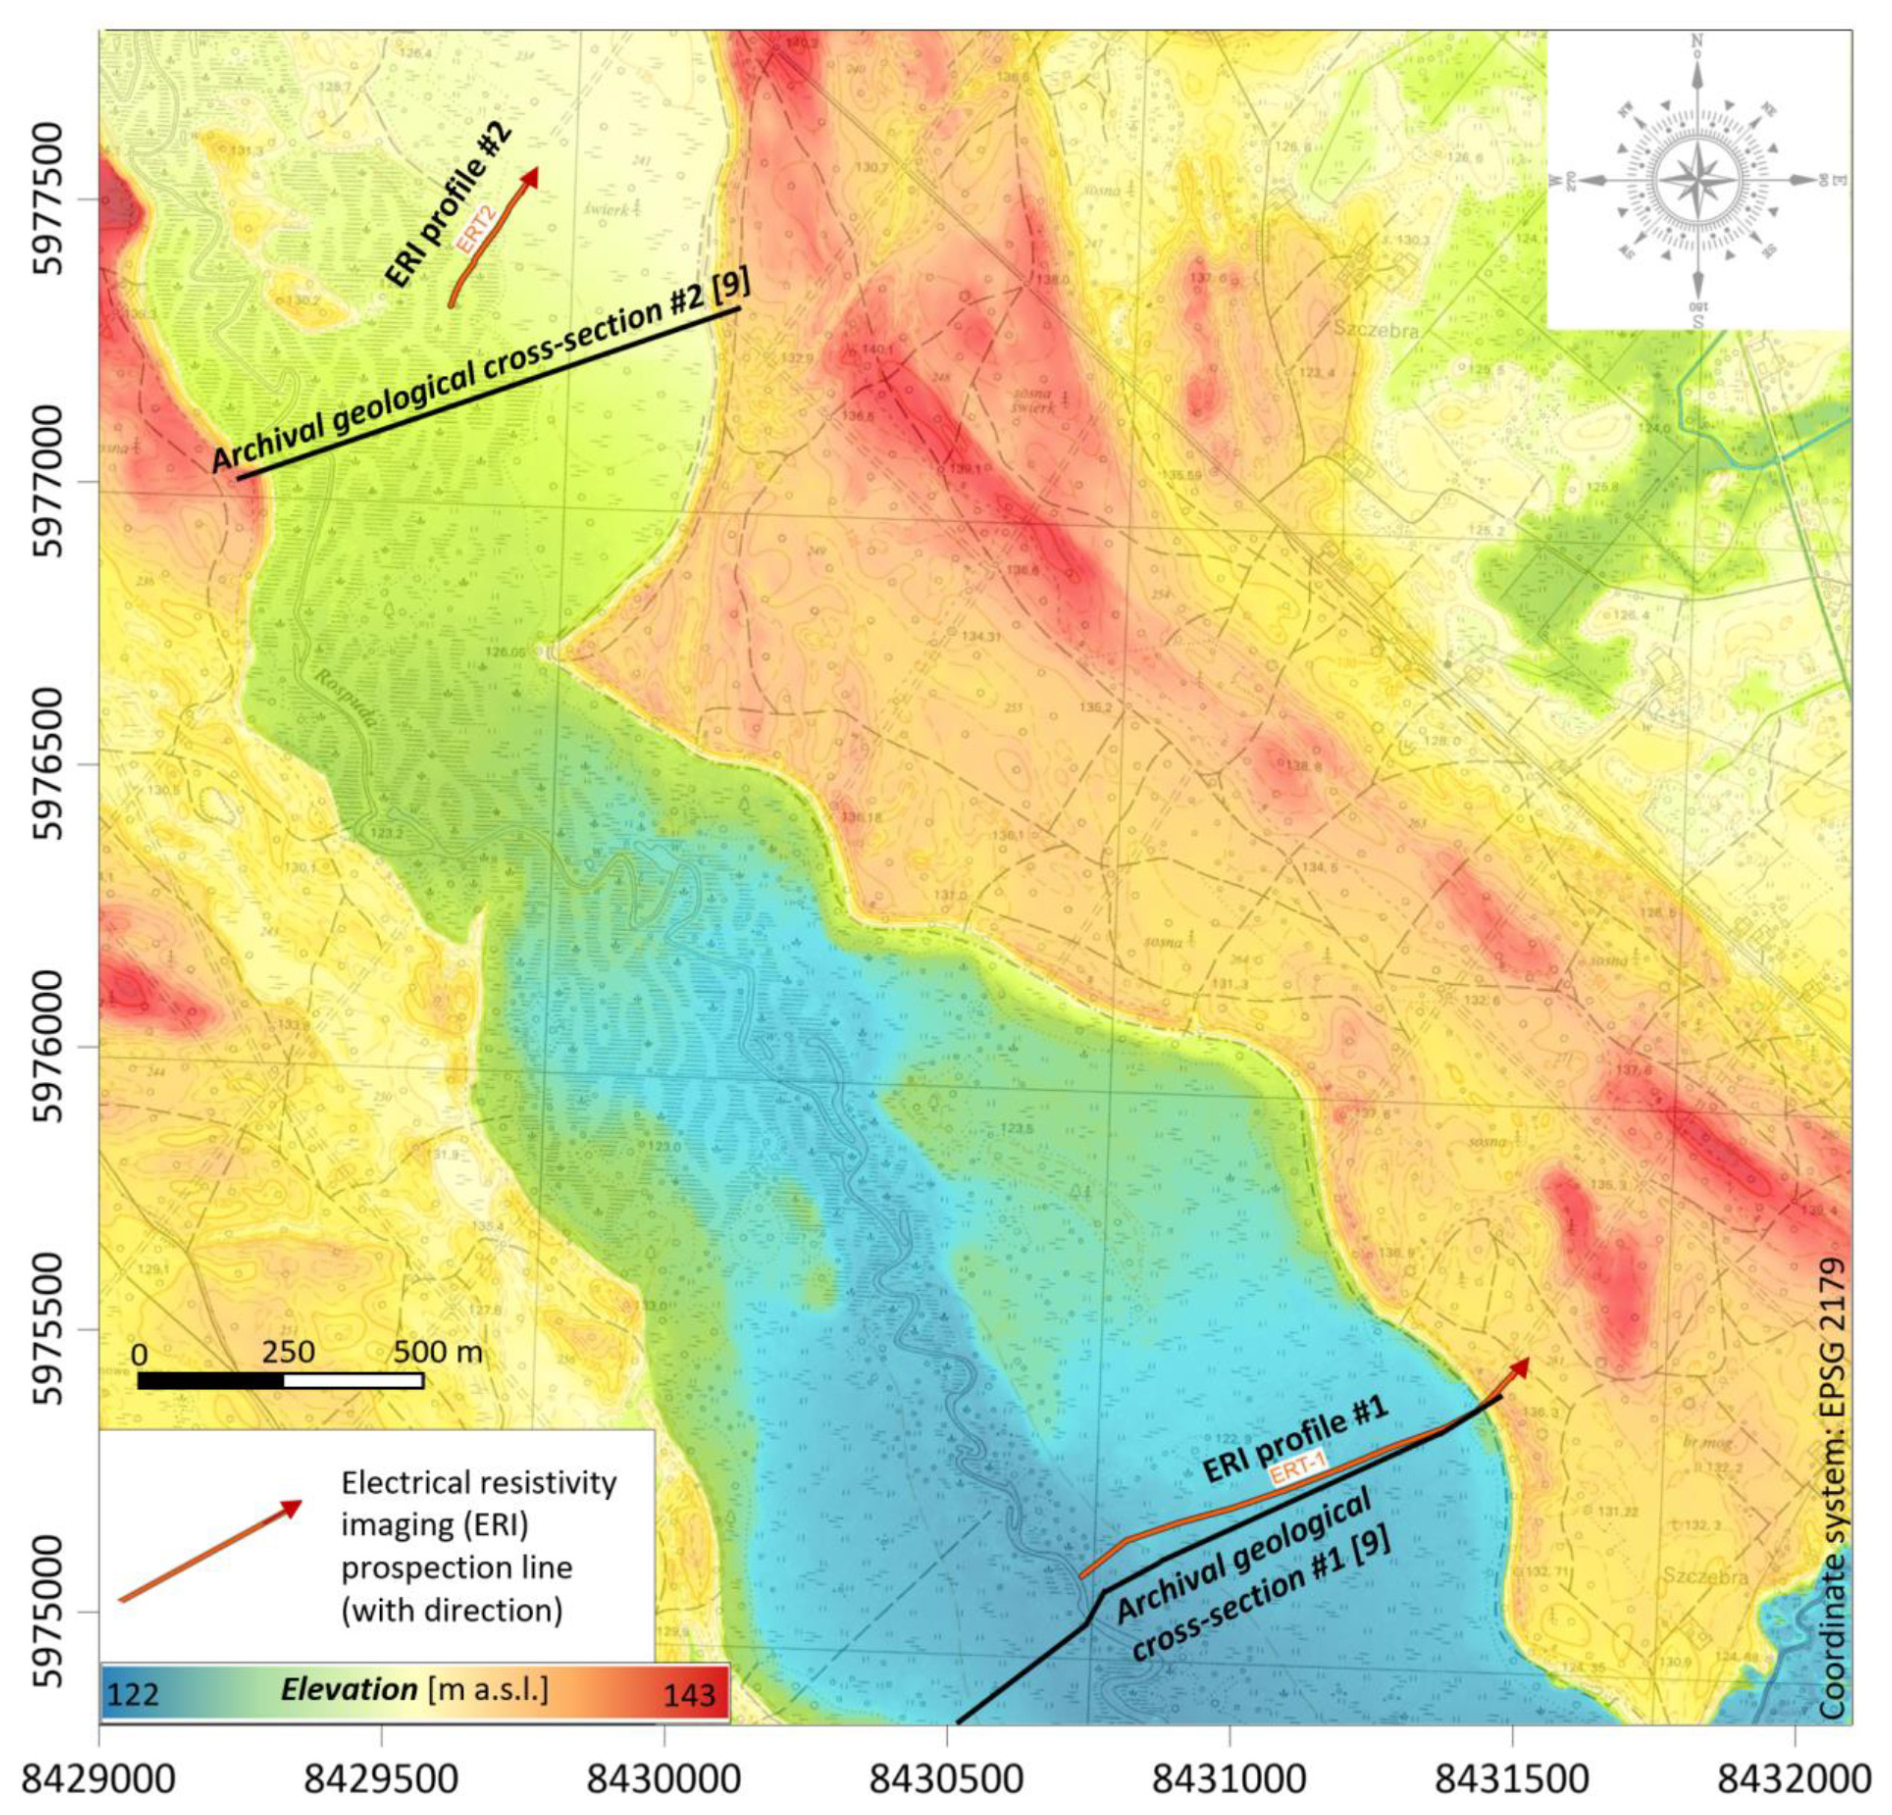
Figure 2The ERI data distribution on the topographic map background (source: http://www.geoportal.gov.pl, last access: 5 October 2024). Dark-blue color means the lowest elevation, and dark red means the highest one.
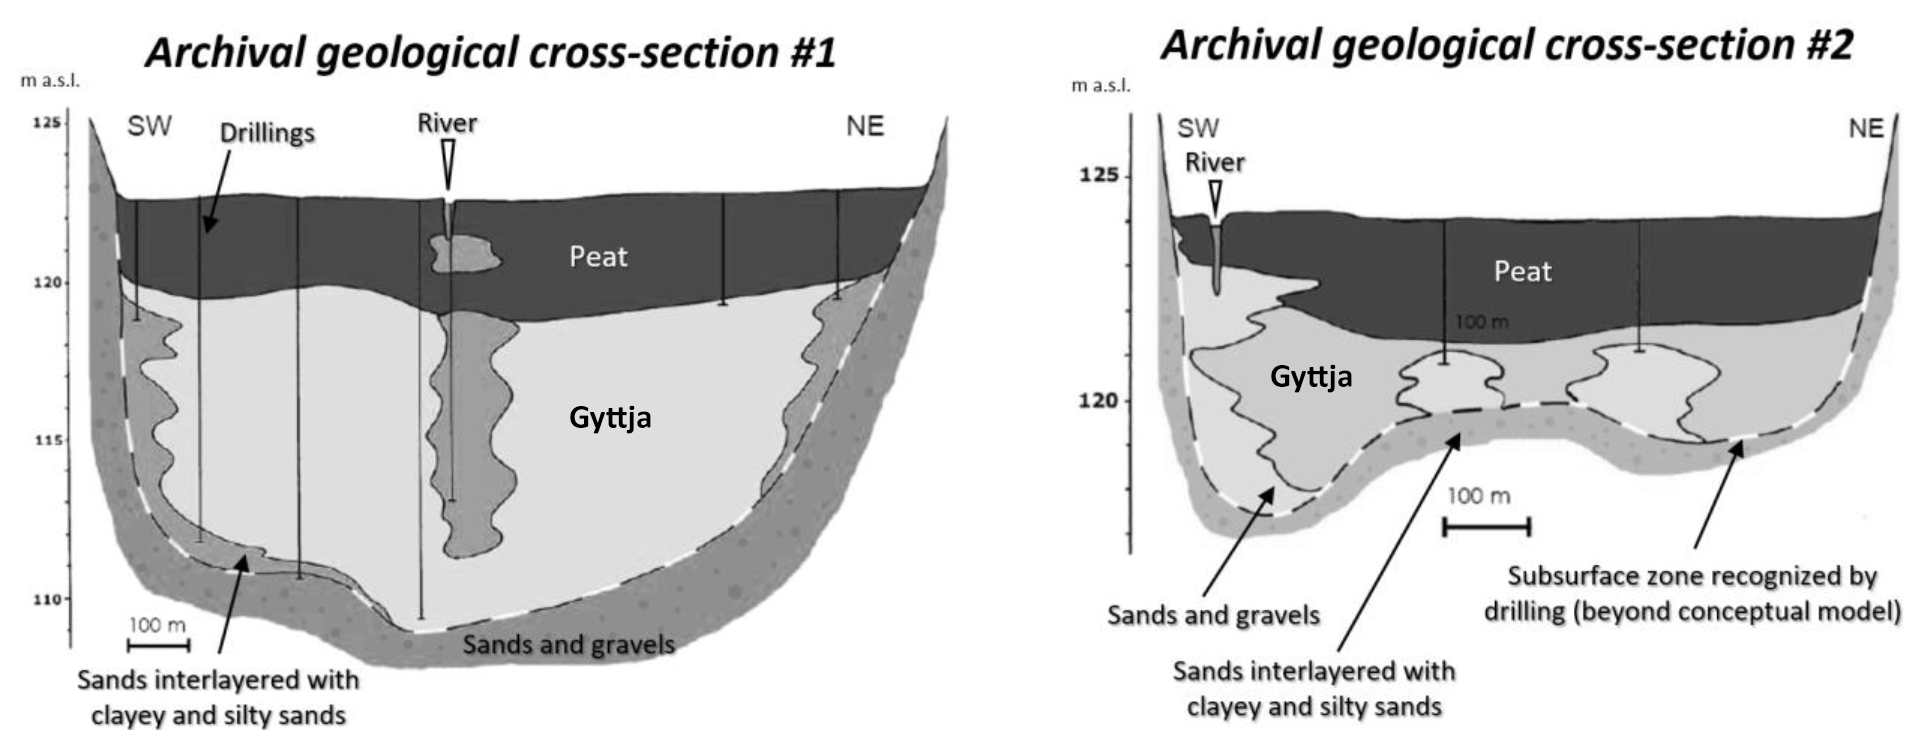
Figure 3Archival geological cross-sections in the Rospuda research site (modified from Jabłońska et al., 2010).
This area is representative of many similar peatlands in north-eastern Poland. Rospuda River valley hosts one of the last large, well-preserved percolation mires (rich fen system) remaining in central Europe (Jabłońska et al., 2011, 2014, 2019). Figure 3 shows the geological structure (of the locations where the geophysical prospecting was done) in the form of cross-sections (according to Jabłońska et al., 2010) made based on reconnaissance drilling (further lithological description of the Rospuda valley along the riverbed can be found in Jabłońska et al., 2014).
The two-dimensional resistivity imaging data were collected by galvanically injecting a low-frequency electrical current into the ground via two electrodes and measuring the voltage difference between two potential electrodes (detailed methodology aspects described in, e.g., Loke, 2018). Differences in resistivity values caused by the flow of electric current through various subsurface media are used to identify materials (exemplary materials listed in Table 1). Electrical resistivity of the subsurface material is determined by the composition of soil (particle size distribution, mineralogy), its structure (porosity, pore size distribution, connectivity), its fluid content, the concentration of dissolved electrolytes, its clay content, and its temperature (Palacky, 1988; Loke, 2018; Tarnawski, 2020). Table 1 depicts the electrical resistivity characteristics (inverse of conductivity) of common soil types (and water for comparison) in this area of Poland.
Table 1Typical electrical resistivity of materials (based on Tarnawski, 2020, and authors' experience).
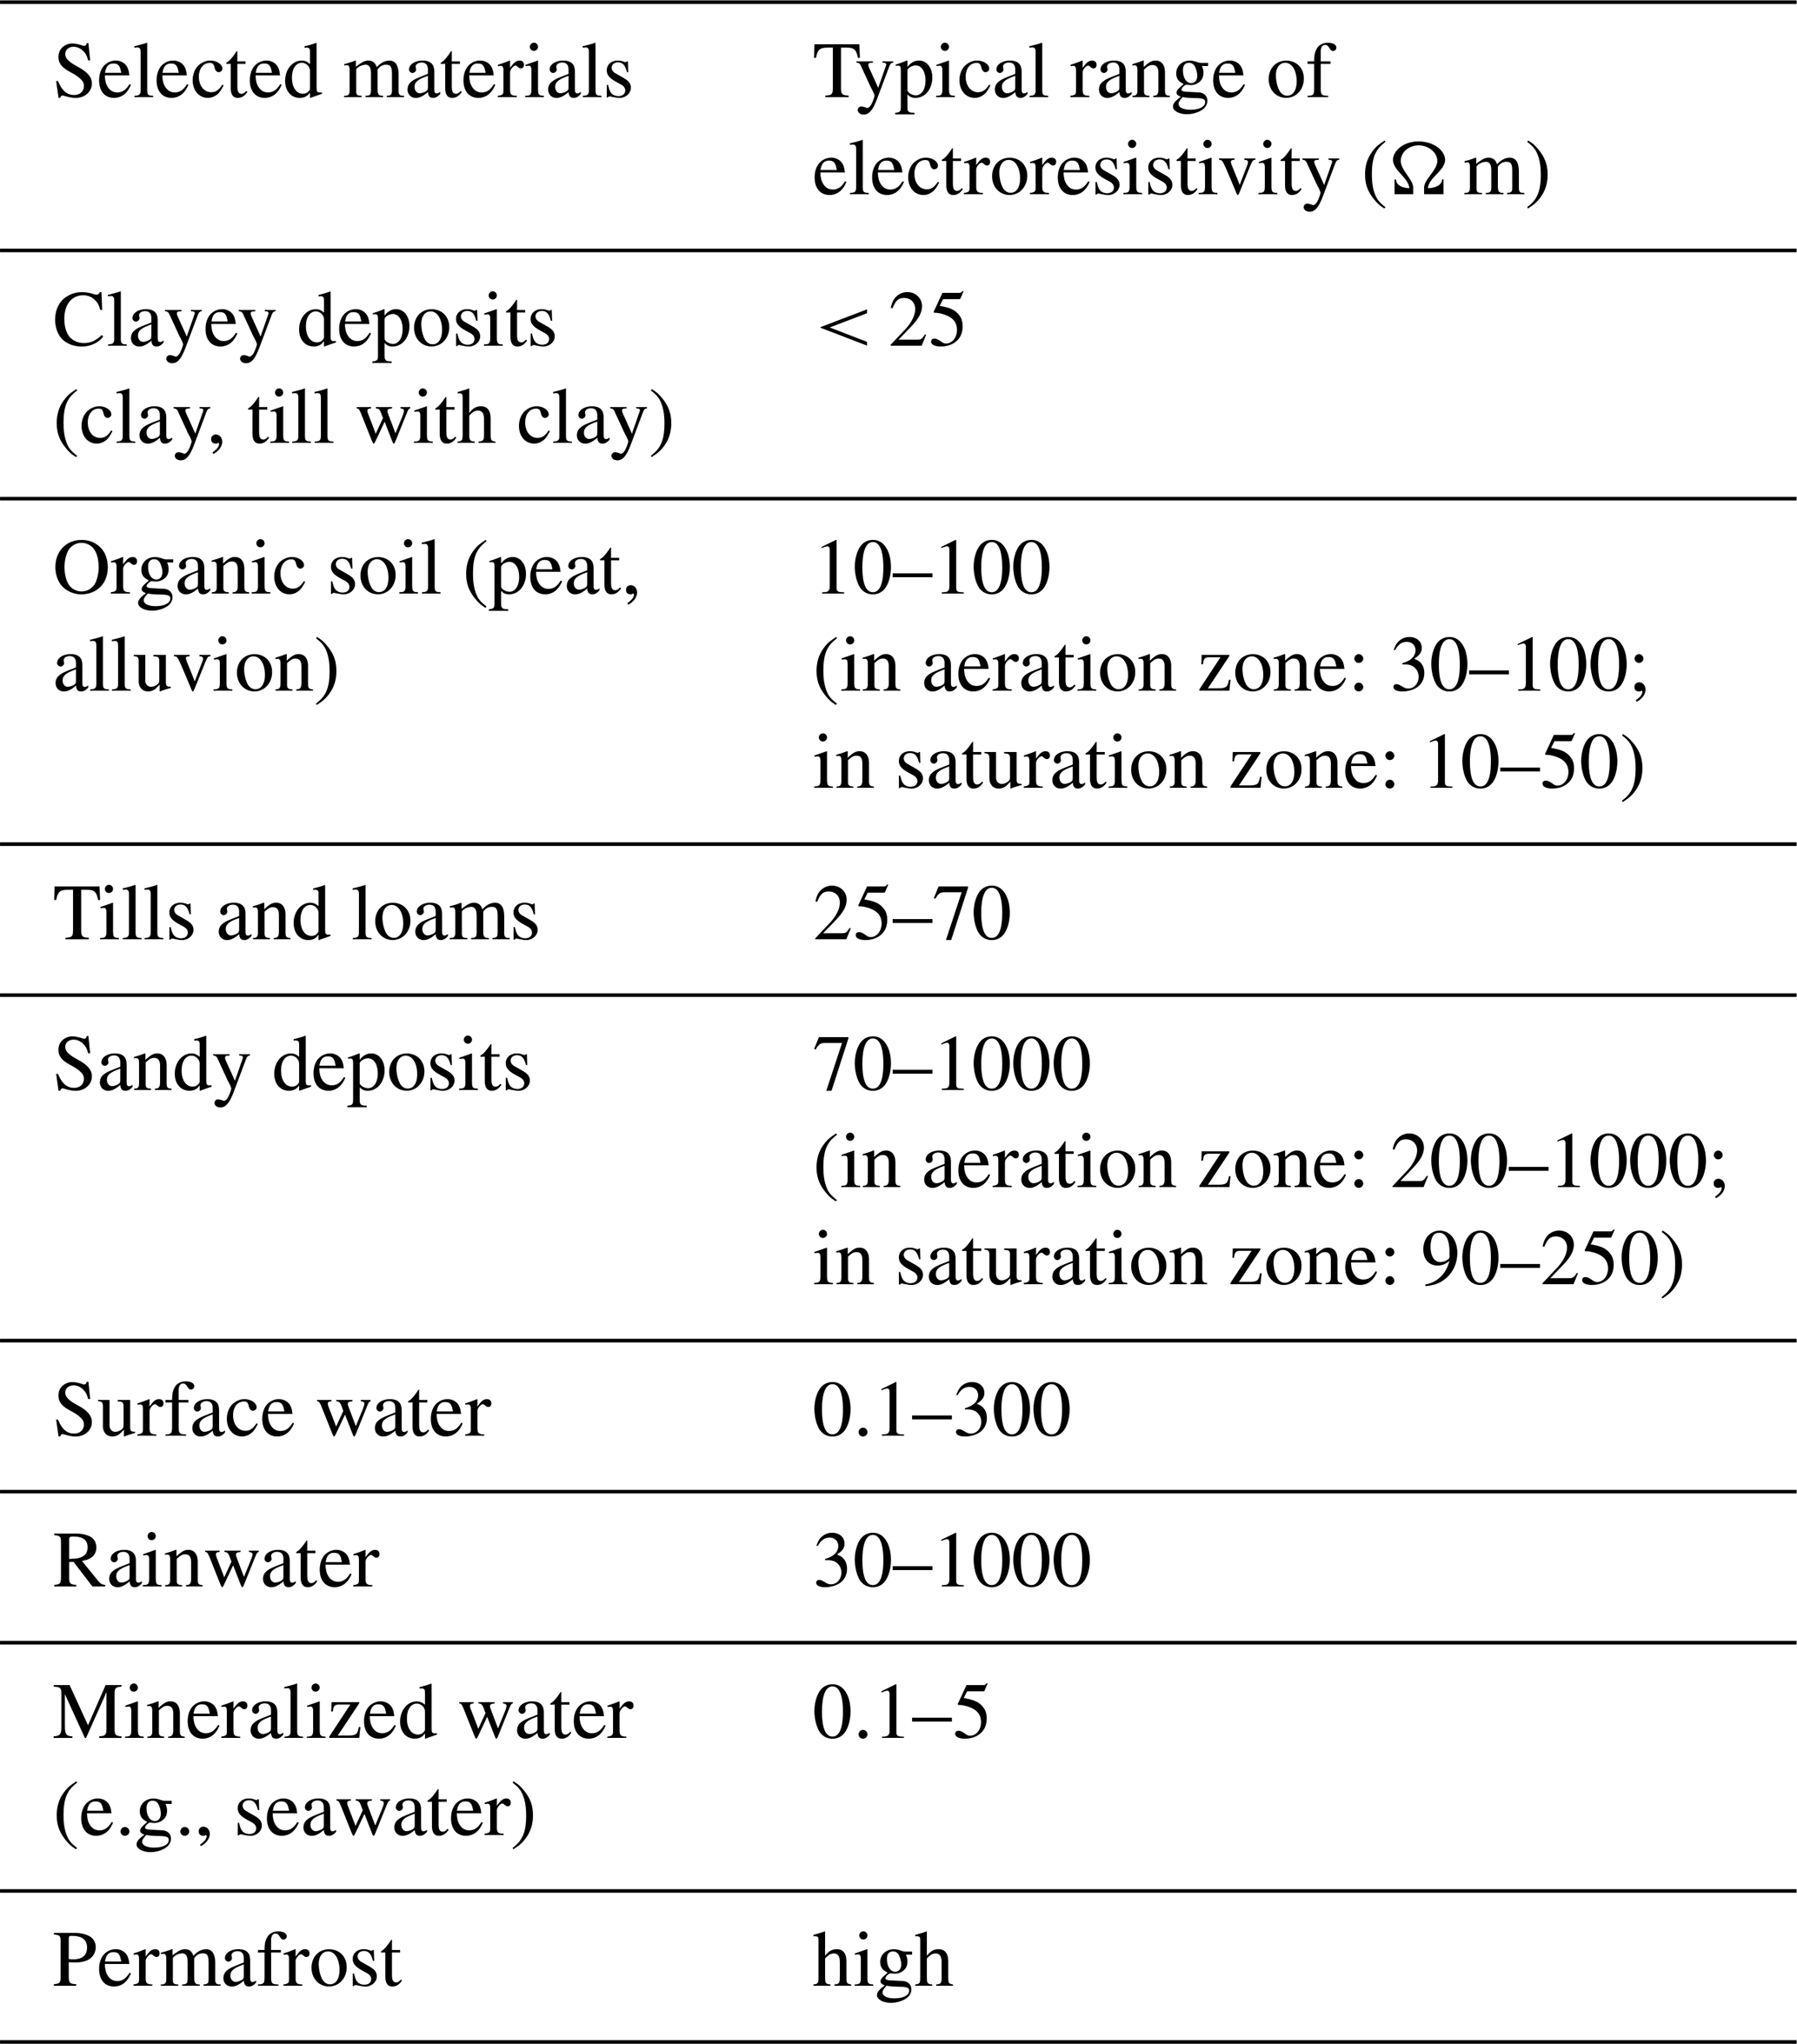
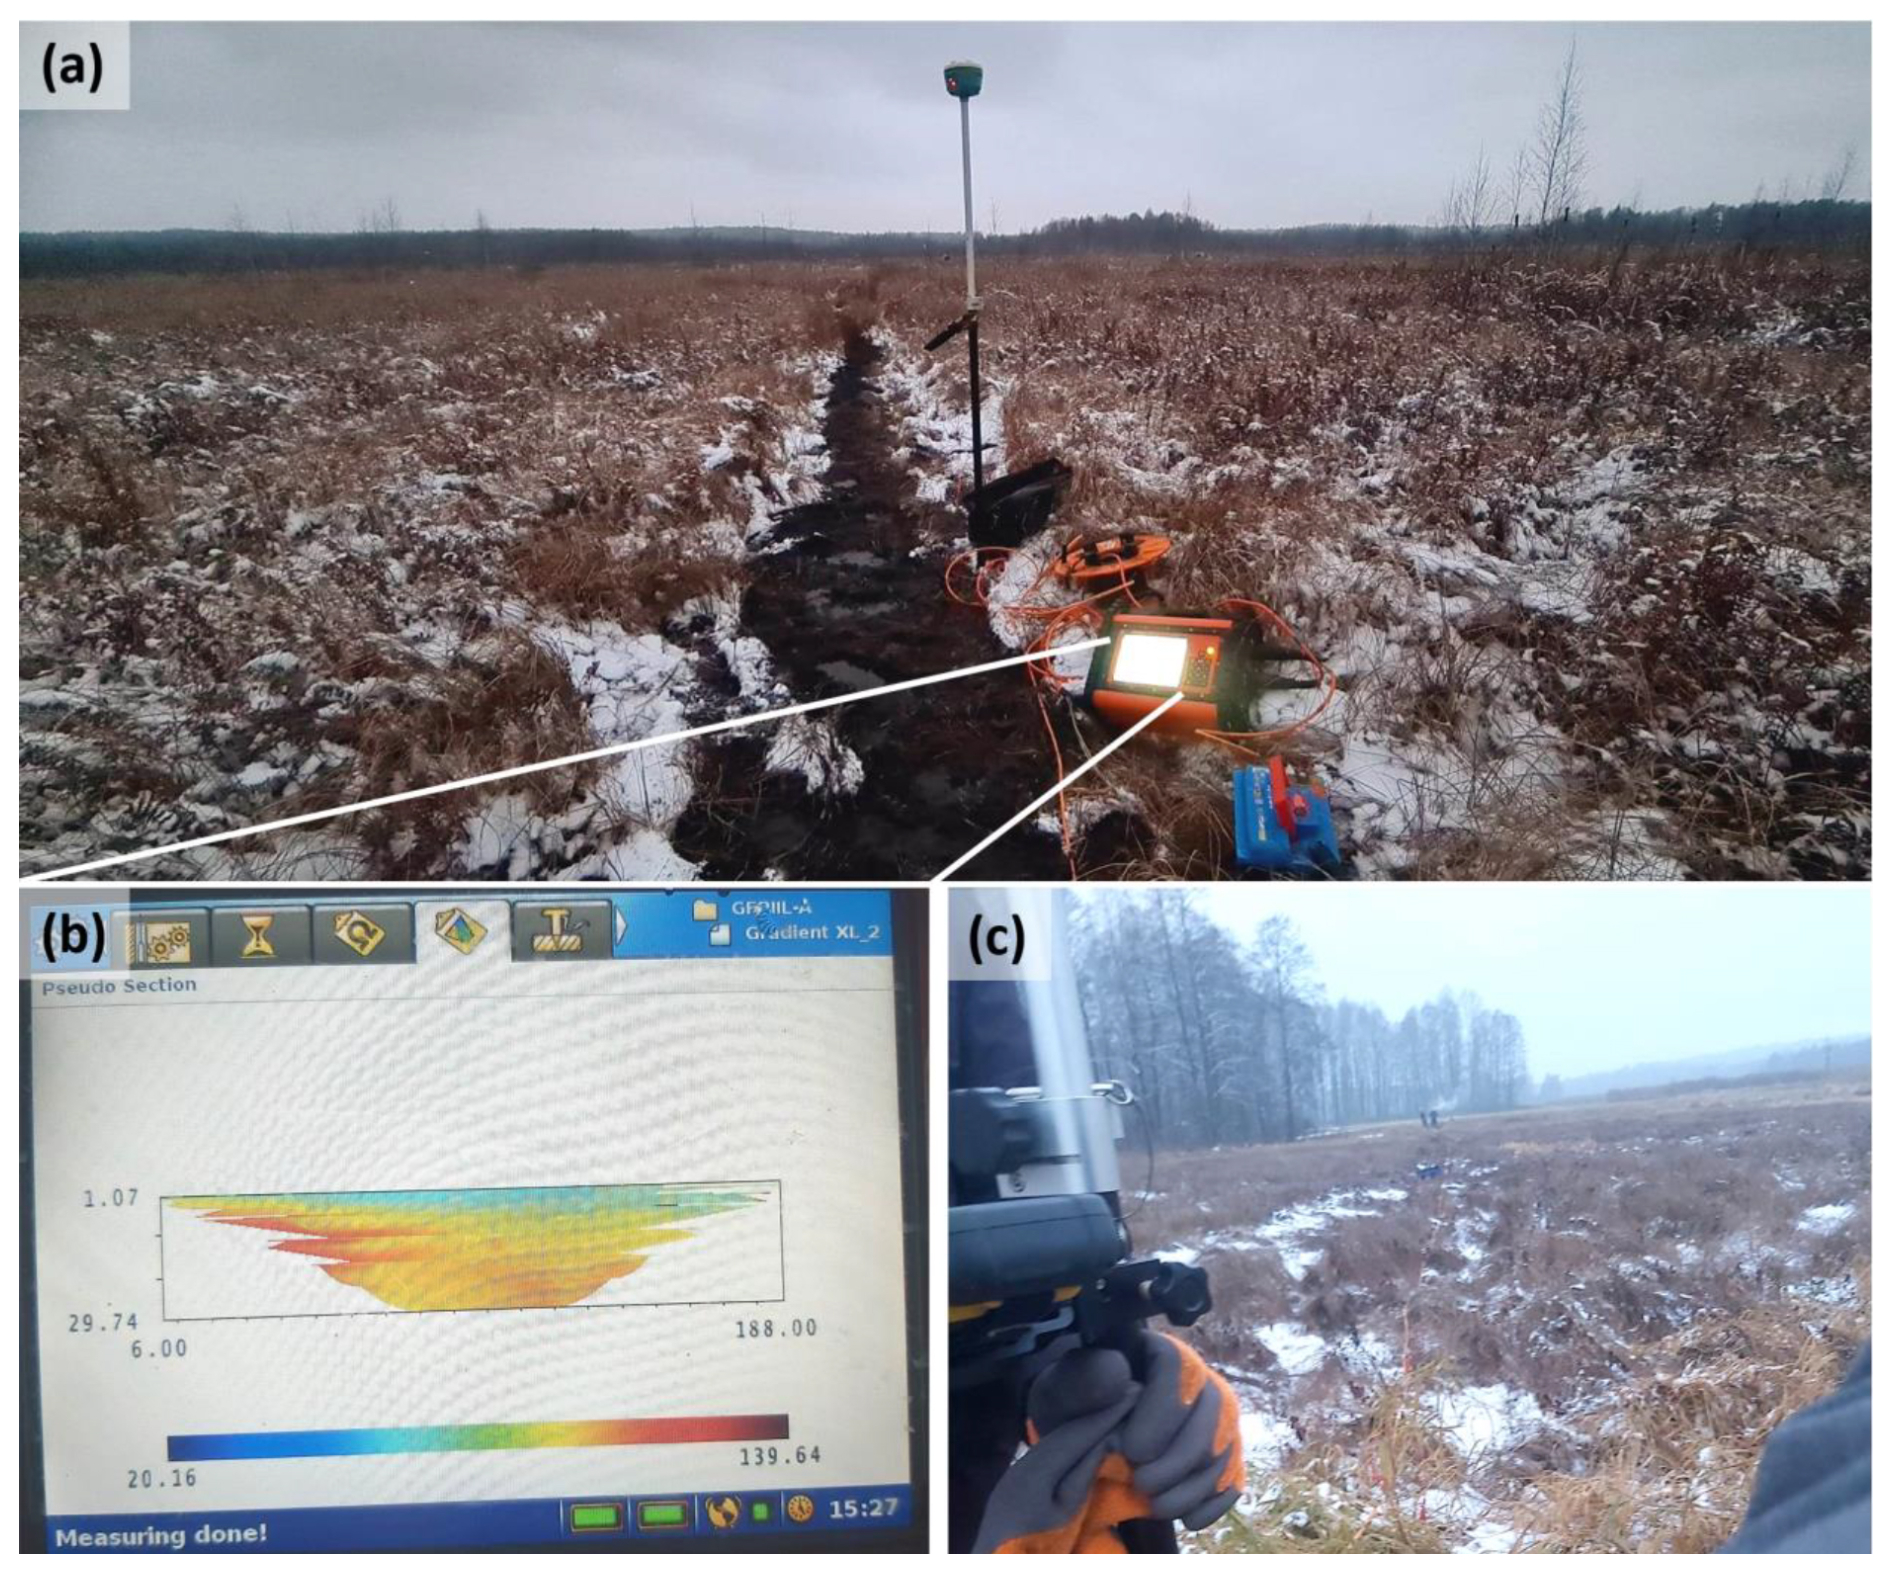
Figure 4(a) Acquiring ERI field data with multi-electrode 12-point light ABEM Terrameter LS 2 setup at ERI profile no. 1, (b) raw visualization of results, and (c) acquiring data with the Terrameter at ERI profile no. 2.
The advanced multi-electrode resistivity sensors were used to measure numerous data points in a single ERI profile by automatic switching of the current and potential electrodes. A multiple-gradient array was used to collect resistivity data in both the forward and backward survey directions. Figure 4 depicts the acquisition of field ERI data with one of the most advanced 12-point light ABEM Terrameter LS 2 setups (Fig. 4a). The electrodes were driven along the profiles and connected to cables with the cable joints for 21 take-out cables, which lead to a resistivity meter during resistivity measurements. The electrodes were tested for the contact resistance before each measurement session, and apparent resistivity was measured. Then, apparent resistivity in many of data points can be measured for a single ERI profile (eventually, giving the effect of a quasi-continuous section). The multiple-gradient array was described in detail, e.g., by Loke (2018).
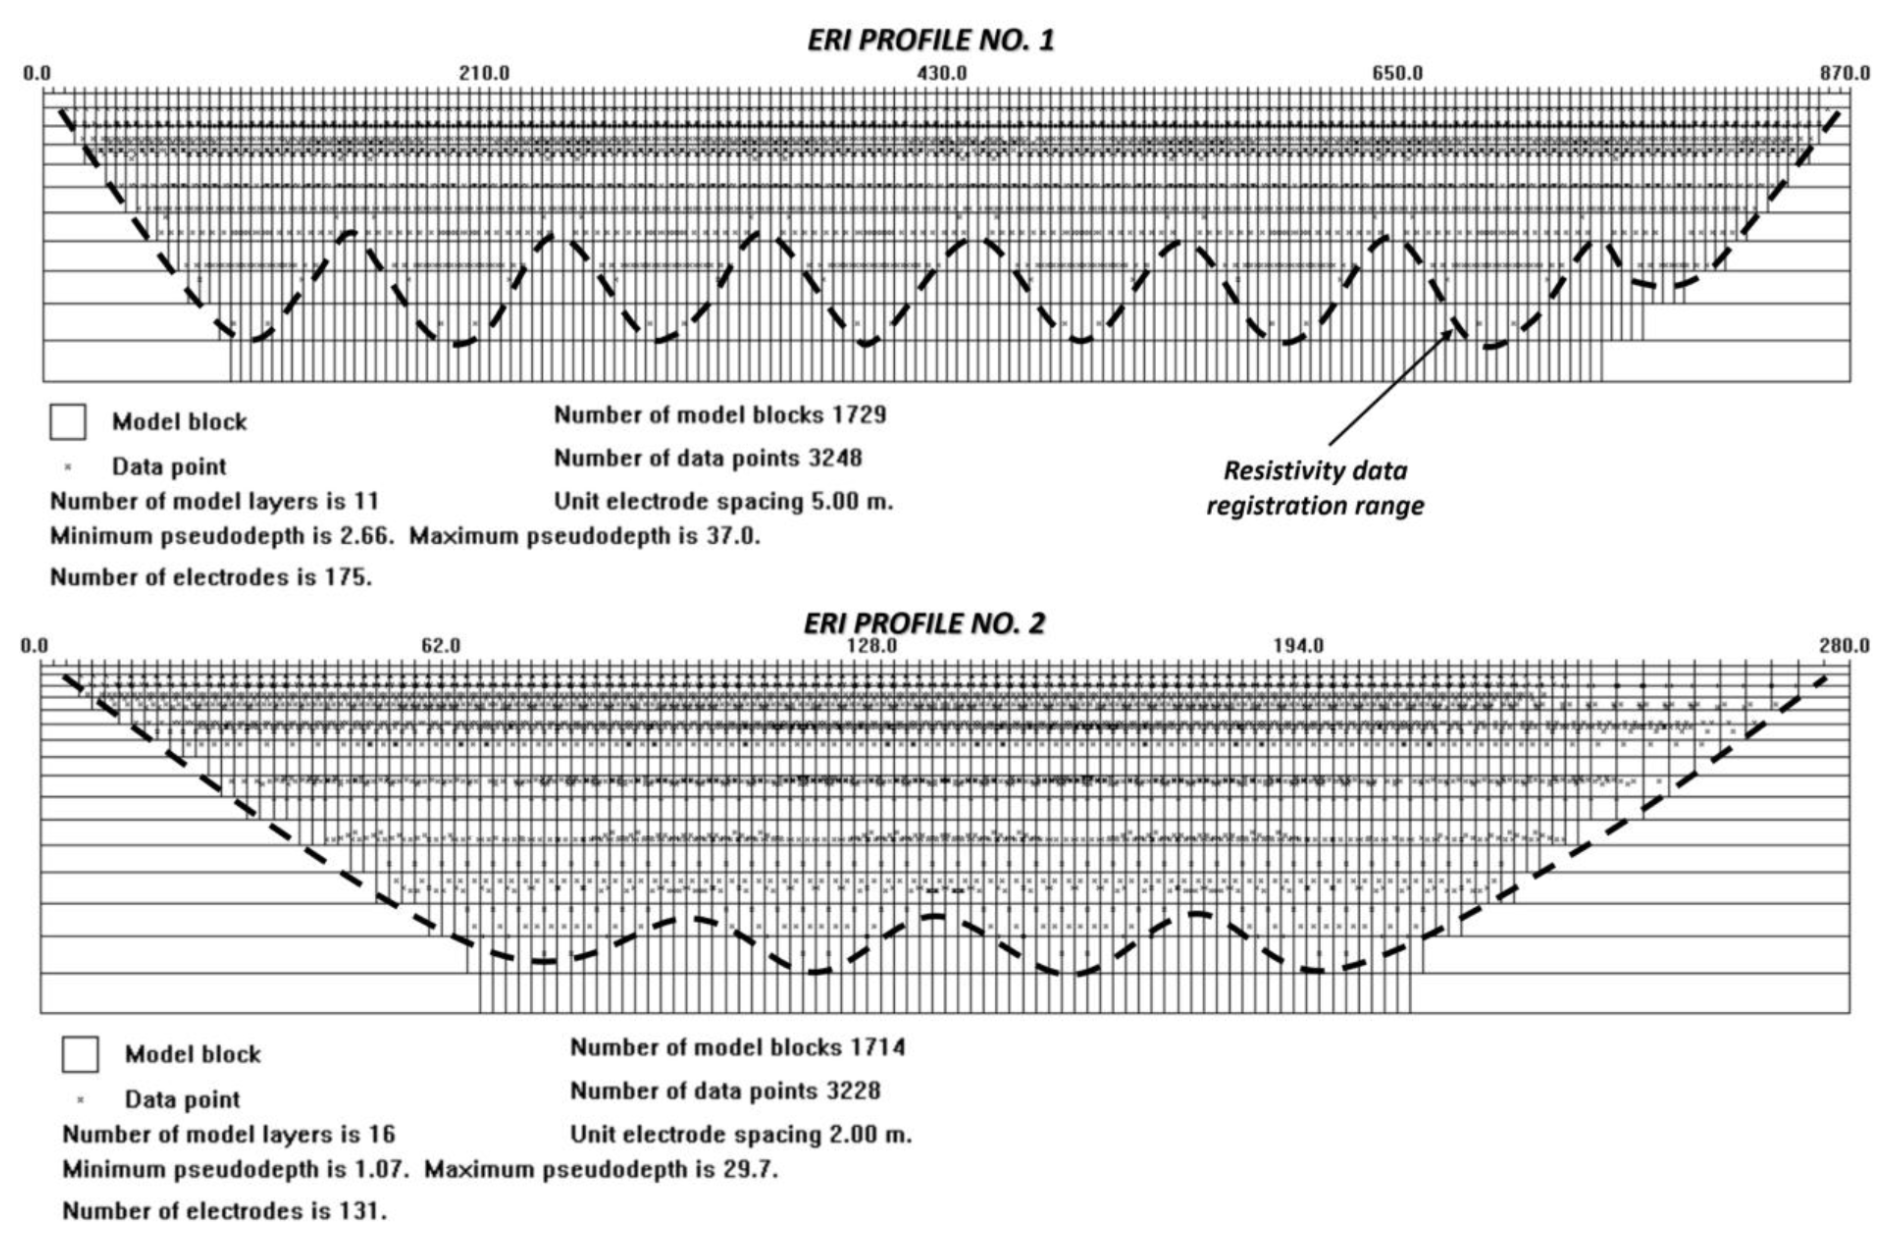
Figure 5Electrical resistivity data point distribution and arrangement of model blocks: ERI profile nos. 1 and 2 at the Rospuda site.
The measured datasets were filtered to minimize noise. The RES2DINV software package (Aarhus Geosoftware, 2022) was used for data processing and inversion. The smoothness-constrained least-square (DeGroot-Hedlin and Constable, 1990) and robust inversion (Wolke and Schwetlick, 1988) algorithms were used for data processing, depending on the expected subsurface features. However, the ERI data were mostly inverted by means of the smoothness-constrained least-square inversion algorithm. The iterative inversion method was applied until the discrepancy between measured and predicted resistivity data reached acceptable levels, i.e., when the root mean square (rms) error dropped below 5 % (information about the difference between the measured and calculated apparent resistivity values). This value may be exceeded for surveys in hard rock and noisy environments. As an example, we show the ERI data distribution (Fig. 5) for resistivity data collected from the Rospuda site – prospection depth ca. 32 m below terrain surface (b.t.s) (profile no. 2) and 43 m b.t.s (profile no. 1). These figures are important for providing a sketch of the roll-along distribution of the acquired data. This will allow for the identification of any empty zones (areas without data, i.e., surface layer) and the density of data points (as well as number of model blocks related to them) and for the verification of the final resistivity model.
The resulted ERI data of this important case study can be easily accessible in the Mendeley data repository (Sinicyn et al., 2024): https://doi.org/10.17632/5m34cs5zn4.4. The repository is structured into a folder, “ERI Rospuda Data”, which contains raw data (presented in a general array format; in dat files), and inverted-resistivity model images for each ERI profile (presented in jpg files). Google Earth KML (Keyhole Markup Language) files with the location of the ERI profiles are also provided for each survey site. The data are of comparable good quality because all the ERI profiles have been measured by the same ABEM Terrameter LS 2 setup by a multiple-gradient array (roll-along technique) with 5 m (profile no. 1) and 2 m (profile no. 2) electrode spacing. For the first ERI profile performed using the roll-along technique, seven stations (central unit positions of the Terrameter) were required. For the second, shorter ERI profile, five stations were necessary.
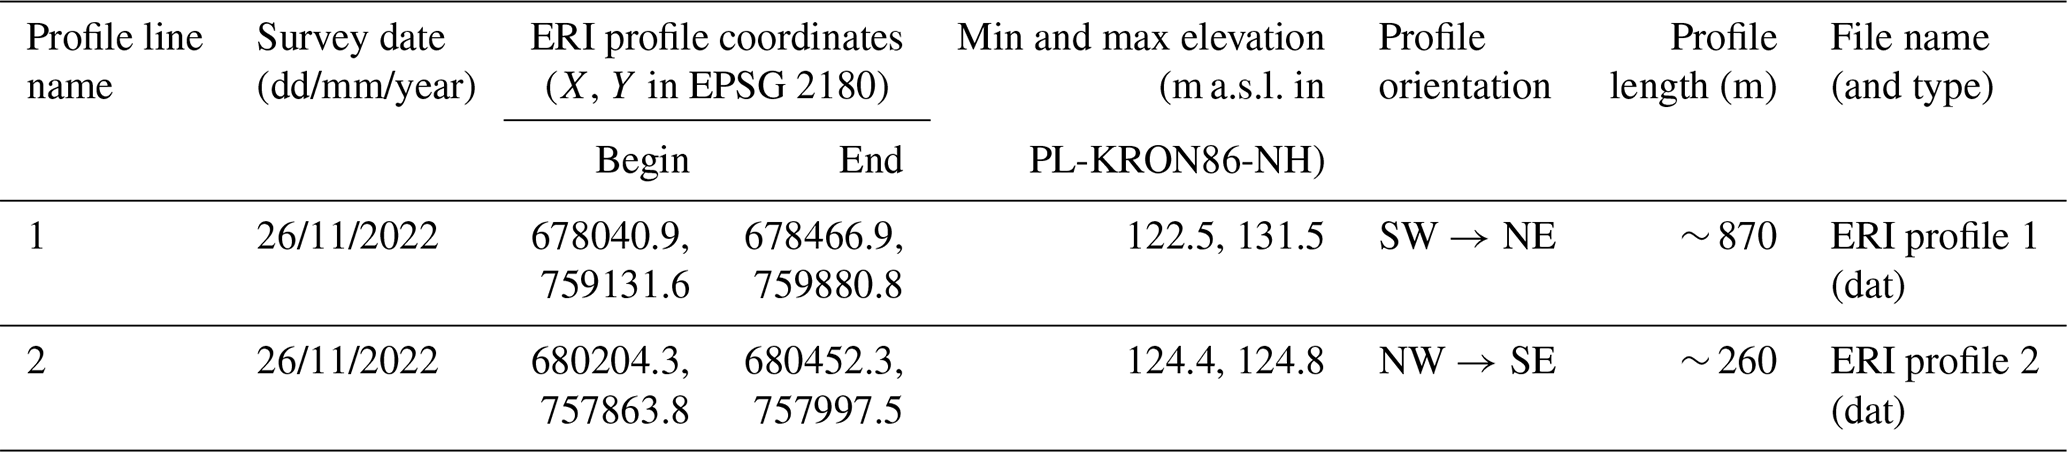
Table 2 presents details on the ERI's metadata: profile line name, survey data, beginning and ending coordinate points of ERI profiles, elevation, profile orientation, array type, profile length, filer type, file name, and instrument information.
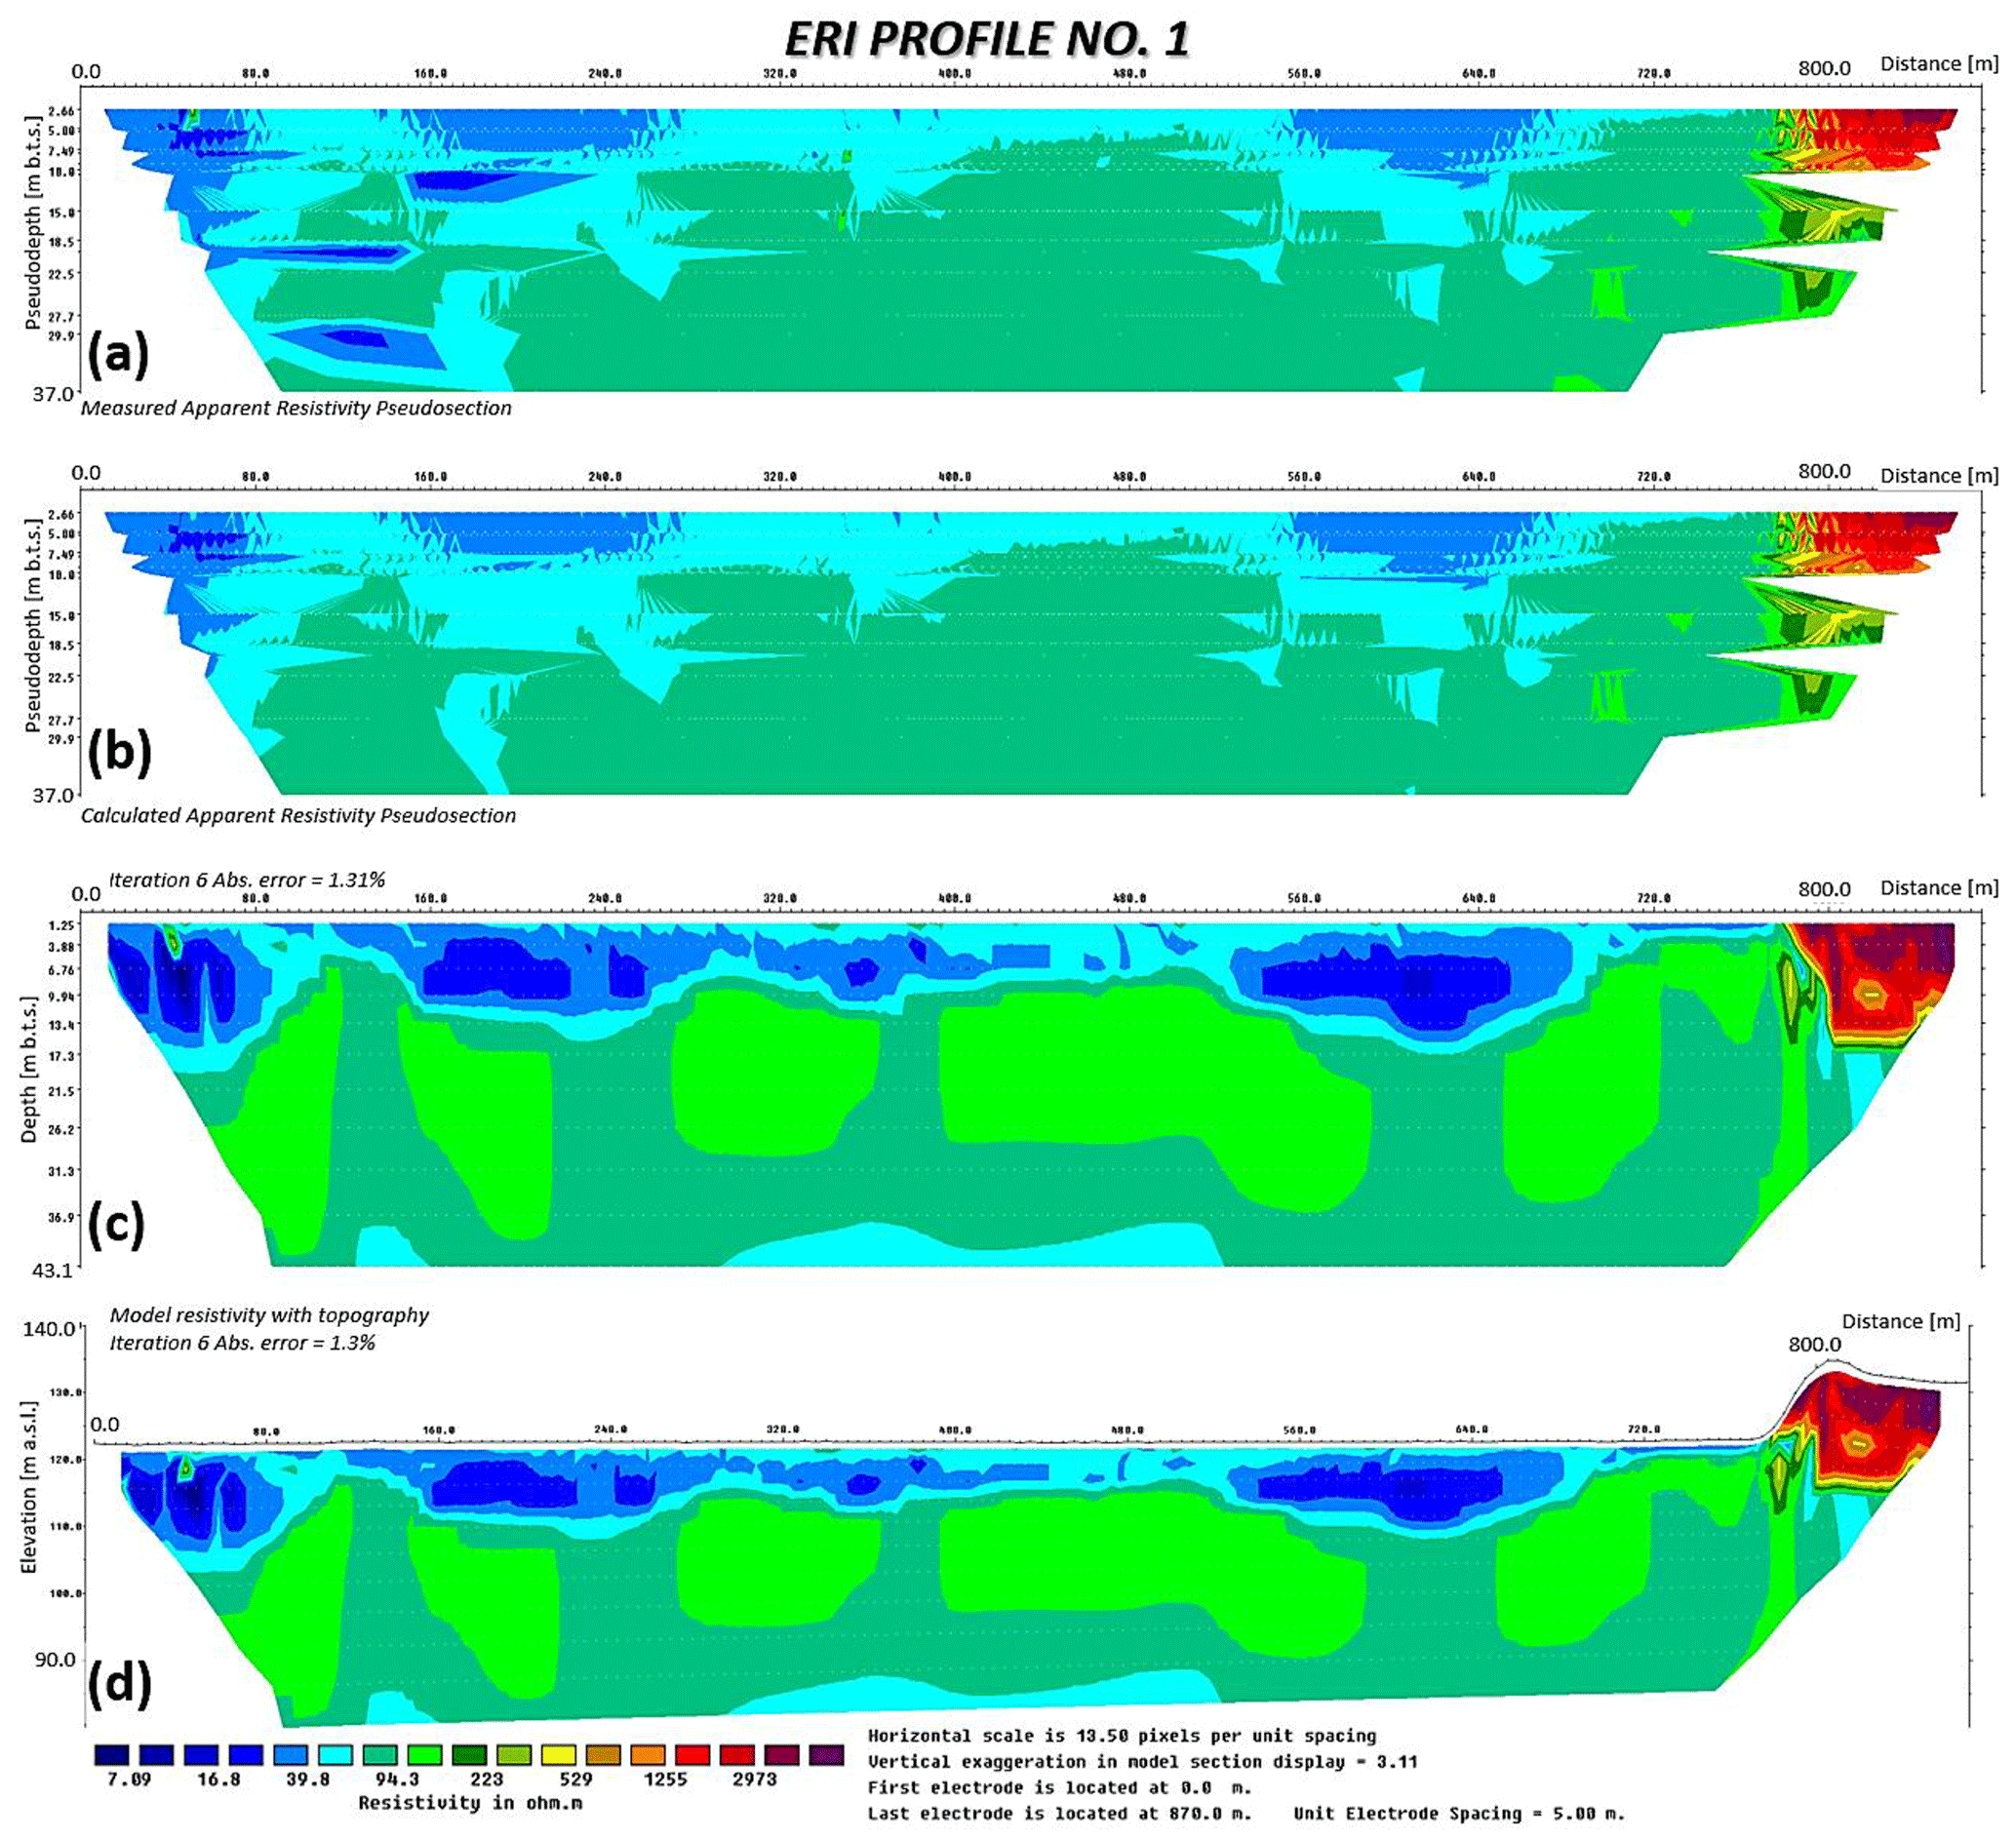
Figure 6ERI profile no. 1 at the Rospuda site: (a) apparent resistivity data, (b) calculated apparent resistivity data, (c) inverted-resistivity model, and (d) inverted-resistivity model with topography.
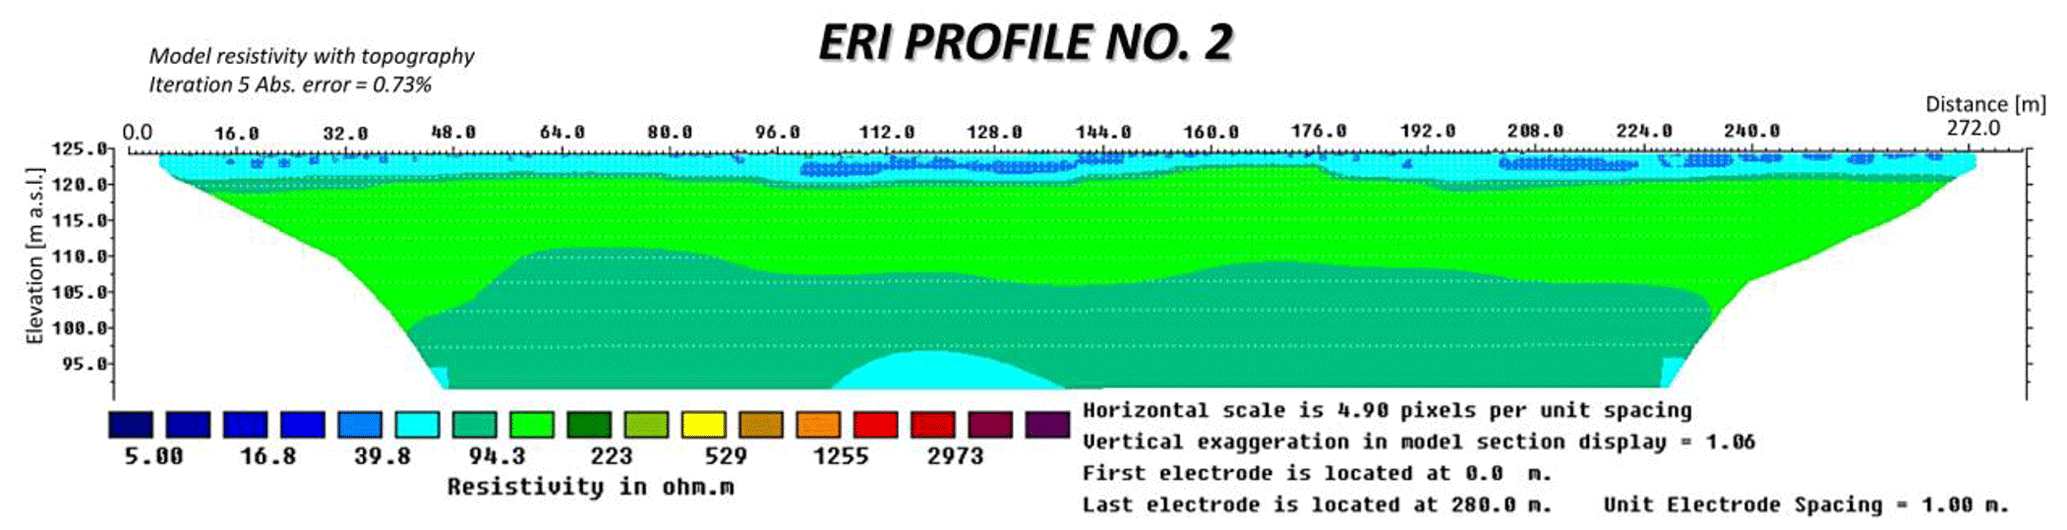
Using the roll-along technique, it was possible to obtain very valuable long prospecting lines (several hundred meters long). Figure 6 shows ERI profile no. 1: Fig. 6a shows the distributions of apparent resistivity data, Fig. 6b shows model calculated apparent resistivity data, and Fig. 6c shows an inverted-resistivity model. Figure 7 shows ERI profile no. 2. The images present electrical resistivity cross-sections with no rejected measurements (no such critical need; there were several that could be discussed, but we wanted to show the quality of “rough” data).
The obtained electrical resistivity images revealed the geological structure and the position of the water table very well. On the electrical resistivity cross-sections it is possible to distinguish the following:
- i.
a zone of very high resistivity, which corresponds to sands and gravels with very low water content constituting the high ground (a few thousand ohm-meters (Ω m), maximum ∼ 4310 Ω m);
- ii.
a zone of low resistivity (from ca. 75 to ca. 500 Ω m), occurring below the near-surface zone and which most probably constitutes fully water saturated sands;
- iii.
a zone of even lower resistivity than zone ii (from ca. 40 to approx. 75 Ω m), which constitutes water-saturated silty sands (which may be overlain by clayey sands; this zone is present at a relatively great depth of approx. 30 m);
- iv.
a zone of the lowest resistivity (10–40 Ω m), which is water-saturated peats of a thickness ranging from a few to several meters at the maximum (the highest thickness of peats is present near the Rospuda River).
This interpretation corresponds to the geomorphology of the described area (detailed by Ber, 2007): the Rospuda River valley is a subglacial trough adjacent to sand plains in the west and east, within which numerous eskers and other forms of crevasses are present. This type of form was identified as an elevation in the first cross-section. The Rospuda River heads south-east, flowing approximately 2.5 km further into Lake Rospuda. Rospuda is a drainage river type, with groundwater recharge from the north-west and east. The groundwater table is in intense contact with the surface water of the Rospuda River. The influence of the water table level in the sand- and gravel-type soils (zone i) changes their electrical resistivity image (first cross-section), causing a difference in resistivity of about 1000 Ω m (a decrease from about 4000 to about 3000 Ω m). This description indicates a thick Quaternary groundwater aquifer (no impermeable soil to a depth of about 43 m) with no more significant surface isolation layers in the form of soils like clays or tills. In this context, peats constitute a separate hydrogeological layer characterized by lower hydraulic conductivity than the surrounding mineral soils but with excellent retention properties.
4.1 Limitations
While conducting the research campaign with the ERI profiling, we faced difficulties related to the high water saturation impact on the current field; in such a case the Terrameter revealed false data with zero or negative resistivity values or, quite contrarily, large resistivity variation (especially near the surface). Such unexpected obstacles led to time-consuming result processing or even made the measurements impossible. Fortunately, during the investigation, there was no rain, and we managed to prevent the ERI setup from becoming too wet; thus we avoided the previously mentioned problems. Moreover, we managed to achieve a very low level of absolute error in iterations – in the first long profile this error was just 1.3 % after six iterations, and in the second case it was just 0.94 % after five iterations.
4.2 Data value
The electrical resistivity imaging data from the selected survey site can be used to perform numerical modeling of groundwater and surface water interaction (i.e., van Loon et al., 2009; Grodzka-Łukaszewska et al., 2022) in the environmentally valuable area of the river Rospuda valley, which is, to a certain extent, a scientific terra incognita, but they can also be used for hydrological investigations of hydraulic conductivity and hydrodynamic field, identification of geological structure, and characterization of the engineering properties of the organic soils. In the case of hydraulic conductivity, it could be related to lab/field tests, which can even be used for further resistivity conversion into a hydraulic conductivity value (Coe et al., 2018; Kaczmarek et al., 2022; although these values should be regarded as indicative). Determining a precise relationship between geophysical parameter values and the hydraulic conductivity is a complex challenge (Kirsch, 2009). Nevertheless, there are studies showing such a (local) relation, i.e., , where e is the exponential constant, R (Ω m) is the average resistivity of the aquifer, and k (m d−1) is the hydraulic conductivity of the aquifer (Lu et al., 2021).
The ERI data can be used to monitor groundwater heads (Chang et al., 2023) or general hydrogeological conditions (i.e., Kowalczyk et al., 2014) as well as terrain changes (mainly subsidence due to water loss in the wetland's body) through comparison with future surveys. This could be related to climate change effects.
The ERI data can be jointly inverted and interpreted with other field measurements (e.g., other geophysical methods, boreholes) to obtain more reliable subsurface information. Studies such as recognition drilling and probing (i.e., Carrière and Chalikakis, 2021); sampling and hydraulic conductivity lab tests (Kaczmarek et al., 2023); low-flow filed pumping tests; and seismic, electromagnetic, and ground-penetrating radar can be effectively integrated with ERI data.
Through open-source inversion algorithms, raw ERI data can be reprocessed to generate 2D- and 3D-inverted models (i.e., Cockett et al., 2015). Machine learning and statistical algorithms can be used for further interpretation of the inverted-resistivity data.
The study investigates the application of electrical resistivity imaging (ERI) to analyze the near-subsurface characteristics of a complex hydrogeological environment: the Rospuda River peatland in Poland. In recent years, interest in applications of the ERI method has increased, also in the context of peatland research and the assessment of climate change impacts on these fragile geological environments. The presented case study demonstrates the feasibility of ERI for detailed characterization of soil lithological layers, including their geometry, as well as for identification of the water table. Despite challenging field conditions, including wet and wintery weather, the acquired electrical resistivity data were of good quality. The study area, the Rospuda River valley, is a subglacial trough surrounded by eskers and located on an outwash plain. These geomorphological features play a crucial role in shaping local hydrogeological conditions. The study revealed a strong interaction between groundwater, characterized by a thick sandy aquifer, and surface water. In this system, surface present peat constitutes the dominant soil component within the contact zone between groundwater and surface water (with drainage river type). Variations in this relationship will have a direct impact on peat stability and associated hydrological processes.
Datasets used in this article are available at https://doi.org/10.17632/5m34cs5zn4.4 (Sinicyn et al., 2024).
GS: conceptualization, methodology, data collection, writing (review and editing). RM: methodology, data collection, data processing. ŁK: conceptualization, methodology, data collection, data processing, validation, writing (original draft preparation). SM: data collection, data processing. BB: data collection, writing (review and editing). KK: data collection, writing (review and editing). MG: writing (review and editing), funding acquisition. MGŁ: conceptualization, methodology, data collection, writing (original draft preparation).
The contact author has declared that none of the authors has any competing interests.
Publisher's note: Copernicus Publications remains neutral with regard to jurisdictional claims made in the text, published maps, institutional affiliations, or any other geographical representation in this paper. While Copernicus Publications makes every effort to include appropriate place names, the final responsibility lies with the authors.
The research leading to these results has received funding from the Norwegian Financial Mechanism 2014–2021 (project no. 2019/34/H/ST10/00711).
This paper was edited by Francesco Soldovieri and reviewed by three anonymous referees.
Aarhus Geosoftware: Aarhus Geosoftware Manual for RES2DINVx64 ver. 4.10 with multi-core and 64-bit support, Aarhus, https://ags-cloud.dk/AGS/Geotomo%20Manuals/Res2DInv_(Legacy)_Manual.pdf (last access: 6 May 2025), 2022.
Ber, A.: Objaśnienia do szczegółowej mapy geologicznej Polski, w skali 1 : 50 000, arkusz Augustów 147 (Explanations to the Detailed Geological Map of Poland, scale 1 : 50 000, Augustów sheet 147). PIG-PIB, Warszawa, ISBN 978-83-7372-996-4, 2007.
Carrière, S. D. and Chalikakis, K.: Hydrogeophysical monitoring of intense rainfall infiltration in the karst critical zone: A unique electrical resistivity tomography data set, Data Brief, 40, 107762, https://doi.org/10.1016/j.dib.2021.107762, 2021.
Chang, P. Y., Doyoro, Y. G., Lin, D. J., Puntu, J. M., Amania, H. H., and Kassie, L. N.: Electrical resistivity imaging data for hydrogeological and geological hazard investigations in Taiwan, Data Brief, 49, 109377, https://doi.org/10.1016/j.dib.2023.109377, 2023.
Cockett, R., Kang, S., Heagy, L. J., Pidlisecky, A., and Oldenburg, D. W.: SimPEG: an open source framework for simulation and gradient based parameter estimation in geophysical applications, Comput. Geosci., 85, 142–154, https://doi.org/10.1016/j.cageo.2015.09.015, 2015.
Coe, J. T., Brandenberg, S. J., Ahdi, S., and Kordaji, A.: Geophysical methods for determining the geotechnical engineering properties of earth materials, Temple University, https://dot.ca.gov/-/media/dot-media/programs/research-innovation-system-information/documents/final-reports/ca17-2111-finalreport-a11y.pdf (last access: 6 May 2025), 2018.
DeGroot-Hedlin, C. and Constable, S.: Occam's inversion to generate smooth, two-dimensional models from magnetotelluric data, Geophysics, 55, 1613–1624, https://doi.org/10.1190/1.1442813, 1990.
Grodzka-Łukaszewska, M., Sinicyn, G. I., Grygoruk, M., Mirosław-Świątek, D., Kardel, I., and Okruszko, T.: The role of the river in the functioning of marginal fen: a case study from the Biebrza Wetlands, PeerJ, 10, 1–20, https://doi.org/10.7717/peerj.13418, 2022.
Grodzka-Łukaszewska, M., Sinicyn, G., Grygoruk, M., Mirosław-Świątek, D., Kardel, I., and Okruszko, T.: The role of the river in the functioning of marginal fen: a case study from the Biebrza Wetlands, PeerJ, 10, e13418, https://doi.org/10.7717/peerj.13418, 2023.
Jabłońska, E., Chormański, J., Falkowski, T., Jarzombkowski, F., Kłosowski, S., Okruszko, T., and Pawlikowski, P.: Hydrologiczno-hydrochemiczne uwarunkowania zróżnicowania przestrzennego roślinności i przebiegu procesów sukcesyjnych w ekosystemach torfowiskowych na przykładzie doliny Rospudy (Hydrological and hydrochemical determinants of spatial differentiation of vegetation and the course of succession processes in peatland ecosystems on the example of the Rospuda valley), Project Report, University of Warsaw, Warsaw, 2010.
Jabłońska, E., Pawlikowski, P., Jarzombkowski, F., Chormański, J., Okruszko, T., and Kłosowski, S.: Importance of water level dynamics for vegetation patterns in a natural percolation mire (Rospuda fen, NE Poland), Hydrobiologia, 674, 105–117, https://doi.org/10.1007/s10750-011-0735-z, 2011.
Jabłońska, E., Falkowski, T., Chormański, J., Jarzombkowski, F., Kłosowski, S., Okuszko, T., Pawlikowski, P., Theuerkauf, M., Wassen, M., and Kotowski, W.: Understanding the Long Term Ecosystem Stability of a Fen Mire by Analyzing Subsurface Geology, Eco-Hydrology and Nutrient Stoichiometry – Case Study of the Rospuda Valley (NE Poland), Wetlands, 34, 815–828, https://doi.org/10.1007/s13157-014-0544-z, 2014.
Jabłońska, E., Pawlikowski, P., Jarzombkowski, F., Tarapata, M., and Kłosowski, S.: Thirty years of vegetation dynamics in the Rospuda fen (NE Poland), Mires Peat, 24, 05, https://doi.org/10.19189/MaP.2018.OMB.363, 2019.
Kaczmarek, Ł., Dąbska, A., and Popielski, P. Krótki przegląd badań współczynnika filtracji gruntów (Brief overview of soil hydraulic conductivity testing methods), Przegląd Geologiczny, 70, 410–416, https://geojournals.pgi.gov.pl/pg/article/view/33529/24579 (last access: 6 May 2025), 2022.
Kaczmarek, Ł. D., Sinicyn, G. I., Kochanek, K., Bednarz, B., Grygoruk, M., and Grodzka-Łukaszewska, M.: Electrical resistivity imaging data for hydrogeological and geological investigations of Szuszalewo peatland (North-East Poland), Data in Brief, 55, 1–12, https://doi.org/10.1016/j.dib.2024.110626, 2024.
Kaczmarek, Ł., Grodzka-Łukaszewska, M., Sinicyn, G., Grygoruk, M., Jastrzębska, M., and Szatyłowicz, J.: Hydraulic Conductivity Tests in the Triaxial Stress State: Is Peat an Aquitard or an Aquifer?, Water, 15, 1064, https://doi.org/10.3390/w15061064, 2023.
Kane, E. S., Veverica, T. J., Tfaily, M. M., Lilleskov, E. A., Meingast, K. M., Kolka, R. K., and Chimmer R. A.: Reduction-oxidation potential and dissolved organic matter composition in northern peat soil: Interactive controls of water table position and plant functional groups, J. Geophys. Res.-Biogeo., 124, 3600–3617, https://doi.org/10.1029/2019JG005339, 2019.
Kirsch, R.: Groundwater geophysics, 2nd edn., Springer, https://doi.org/10.1007/978-3-540-88405-7, 2009.
Kowalczyk, S., Zawrzykraj, P., and Mieszkowski, R.: Application of electrical resistivity tomography in assessing complex soil conditions, Geol. Q., 59, 367–372, https://doi.org/10.7306/gq.1172, 2014.
Kowalczyk, S., Żukowska, K., Mendecki, M. J., and Łukasiak, D.: Application of electrical resistivity imaging (ERI) for the assessment of peat properties: a case study of the Całowanie Fen, Central Poland, Acta Geophys., 65, 223–235, https://doi.org/10.1007/s11600-017-0018-9, 2017.
Limpens, J., Berendse, F., Blodau, C., Canadell, J. G., Freeman, C., Holden, J., Roulet, N., Rydin, H., and Schaepman-Strub, G.: Peatlands and the carbon cycle: from local processes to global implications – a synthesis, Biogeosciences, 5, 1475–1491, https://doi.org/10.5194/bg-5-1475-2008, 2008.
Loke, M. H.: Tutorial: 2-D and 3-D electrical imaging surveys, Geotomosoft, Gelugor, https://www.geotomosoft.com/downloads.php (last access: 5 October 2024), 2018.
Long, M., Paniagua, P., Grimstad, G., Trafford, A., Degago, S., and L'Heureux, J.-S.: Engineering properties of Norwegian peat for calculation of settlements, Eng. Geol., 308, 106799, https://doi.org/10.1016/j.enggeo.2022.106799, 2022.
Lu, D., Huang, D., and Xu, C.: Estimation of hydraulic conductivity by using pumping test data and electrical resistivity data in fault zones, Ecol. Indic., 129, 107861, https://doi.org/10.1016/j.ecolind.2021.107861, 2021.
Minasny, B., Berglund, Ö., Connolly, J., Hedley, C., de Vries, F., Gimona, A., Kempen, B., Kidd, D., Lilja, H., Malone, B., McBratney, A., Roudier, P., O'Rourke, S., Rudiyanto, Padarian, J., Poggio, L., ten Caten, A., Thompson, D., Tuve, C., and Widyatmanti, W. Digital mapping of peatlands – A critical review, Earth-Sci. Rev., 196, 102870, https://doi.org/10.1016/j.earscirev.2019.05.014, 2019.
Palacky, G.: Resistivity characteristics of geologic targets: in: Electromagnetic methods in applied geophysics, Investigations in Geophysics, 1, 52–129, https://doi.org/10.1190/1.9781560802631.ch3, 1988.
Paniagua, P., Long, M., and L'Heureux, J.-S.: Geotechnical characterization of Norwegian peat: database, IOP Conf. Ser.-Earth Environ. Sci., 710, 012016, https://doi.org/10.1088/1755-1315/710/1/012016, 2021.
Pezdir, V., Čeru, T., Horn, B., and Gosar, M.: Investigating peatland stratigraphy and development of the Šijec bog (Slovenia) using near-surface geophysical methods, Catena, 206, 105484, https://doi.org/10.1016/j.catena.2021.105484, 2021.
Sinicyn, G., Mieszkowski, R., Kaczmarek, Ł., Mieszkowski, S., Bednarz, B., Kochanek, K., Grygoruk, M., and Grodzka-Łukaszewska, M.: Electrical resistivity imaging data for hydrological and soil investigations of virgin Rospuda river peatland (North-East Poland) – original data, V4, Mendeley Data [data set], https://doi.org/10.17632/5m34cs5zn4.4, 2024.
Slater, L. and Reeve, A.: Investigating peatland stratigraphy and hydrogeology using integrated electrical geophysics, Geophysics, 67, 365–378, https://doi.org/10.1190/1.1468597, 2002.
Tarnawski, M. (Ed.): Investigation of the ground of structures. Field methods, PWN, Warsaw, p. 670, ISBN 978-83-01-21139-4, 2020.
van Loon, A., Schot, P., Griffioen, J., Bierkens, M., Batelaan, O., and Wassen, M.: Throughflow as a determining factor for habitat contiguity in a near-natural fen, J. Hydrol., 379, 30–40, https://doi.org/10.1016/j.jhydrol.2009.09.041, 2009.
Wolke, R. and Schwetlick, H.: Iteratively reweighted least squares: algorithms, convergence analysis, and numerical comparisons, SIAM J. Sci. Stat. Comput., 9, 907–921, https://doi.org/10.1137/0909062, 1988.
Word, C. S., McLaughlin, D. L., Strahm, B. D., Stewart, R. D., Varner, J. M., Wurster, F. C., Amestoy, T. J., and Link, N. T. Peatland drainage alters soil structure and water retention properties: Implications for ecosystem function and management, Hydrol. Process., 36, e14533, https://doi.org/10.1002/hyp.14533, 2022.
Xu, J., Morris, P. J., Liu, J., and Holden, J.: PEATMAP: Refining estimates of global peatland distribution based on a meta-analysis. University of Leeds [data set], https://doi.org/10.5518/252, 2017.