the Creative Commons Attribution 4.0 License.
the Creative Commons Attribution 4.0 License.
 | 21 Feb 2025
Crack damage stress in fully saturated rocks: a new detection procedure
Sandra Schumacher
Werner Gräsle
Crack damage stress, also known as the onset of dilatancy, indicates the long-term strength of a rock as it describes the transition from the stable to the unstable crack growth phase under loading. As such is it of significant interest, e.g., for long-term safety analyses of radioactive waste repositories. These long-term safety analyses are based on numerical models and thus require the incorporation of a constitutive equation for crack damage stress. However, such a constitutive equation is still missing, as a precise determination of crack damage stress is required to establish parameter dependencies. In this study, we propose a new procedure to determine crack damage stress which combines an innovative measurement technique using pore pressure diffusion with the well-known technique of finding the pore pressure maximum. The new technique monitors the true axial strain as an indicator of crack damage stress during a pore pressure diffusion test. In addition to the crack damage stress, this new true axial strain method simultaneously yields pore pressure diffusion coefficients, thereby maximizing the information gain. The true axial strain method was developed using a Bunter Sandstone sample, but it can be applied to other types of rocks, which is demonstrated on a multi-cycle, long-term experiment with one sample of Passwang Marl.
- Article
(5470 KB) - Full-text XML
- BibTeX
- EndNote


Understanding the hydromechanical behavior of rocks and soils under stress is of significant interest for many applications such as oil and gas extraction (e.g., David and Ravalec-Dupin, 2007; Zoback, 2007; Ahmed, 2018), nuclear waste disposal (e.g., Belmokhtar et al., 2017; Minardi et al., 2020; Crisci et al., 2024), CO2 storage (e.g., Zhou et al., 2010; Williams et al., 2014; Allen et al., 2020), geothermal energy production (e.g., Medici et al., 2023; Zhang et al., 2023a), sediment transport (e.g., van Damme, 2021), and levee construction (e.g., Girardi et al., 2023). For applications which require the soil or rock mass to provide an effective seal against fluid transport, more precise knowledge of the crack damage stress (σCD) is of vital importance as new fluid pathways form in the dilatant regime (e.g., European Commission et al., 1999; Naumann et al., 2007; Heap and Wadsworth, 2016; Zhao et al., 2021). Moreover, the crack damage stress defines the long-term strength of a rock under loading as it marks the transition from the stable into the unstable crack growth regime (e.g., Martin and Chandler, 1994; Zhang et al., 2023b).
Much work has already been done on the theoretical description of the processes leading to cracks and the processes occurring within the material during cracking. Most of these works are based on general ideas about cracking in solid materials, but the fundamental concepts described therein can also be applied to geomaterials such as rocks. The ideas first formulated by Griffith and Taylor (1921) concerning cracks are, e.g., still widely used in rock mechanics (e.g., Jaeger and Cook, 1979; Charlez, 1991; Fossen, 2010). Over the years, many studies have explored and expanded the theoretical background to crack formation (e.g., Landau and Lifshitz, 1976; Cherepanov, 1979; Atluri, 1986; Parton, 1992; Aleinikov et al., 2023).
During loading, two processes compete with each other. On the one hand, existing pores and cracks close, resulting in a compaction of the sample. On the other hand, the increasing load leads to the formation of new cracks, which causes the sample to expand (Heap and Wadsworth, 2016). The behavior of the rock due to these competing processes can be divided into four different phases (e.g., Martin and Chandler, 1994; Martin et al., 2001; Cai et al., 2004; Xue et al., 2014; Zhang et al., 2023b): in the first stage, the closure of pre-existing cracks and pore space occurs (Fig. 1) and the bulk sample volume decreases because of this. In the second stage, the rock deforms elastically, while in the third stage new fractures form within the rock while the closure of previously existing fractures and pores continues. Up until now, the bulk sample volume still decreases as the closure of pre-existing cracks outweighs the formation of new fractures. In the fourth stage, however, unstable crack growth sets in as cracks start to coalesce, ultimately resulting in the failure of the sample. This transition from stable to unstable crack growth is called the crack damage stress and the formation of new cracks will lead to an increase in bulk sample volume despite the continuing increase in load (Fig. 1).
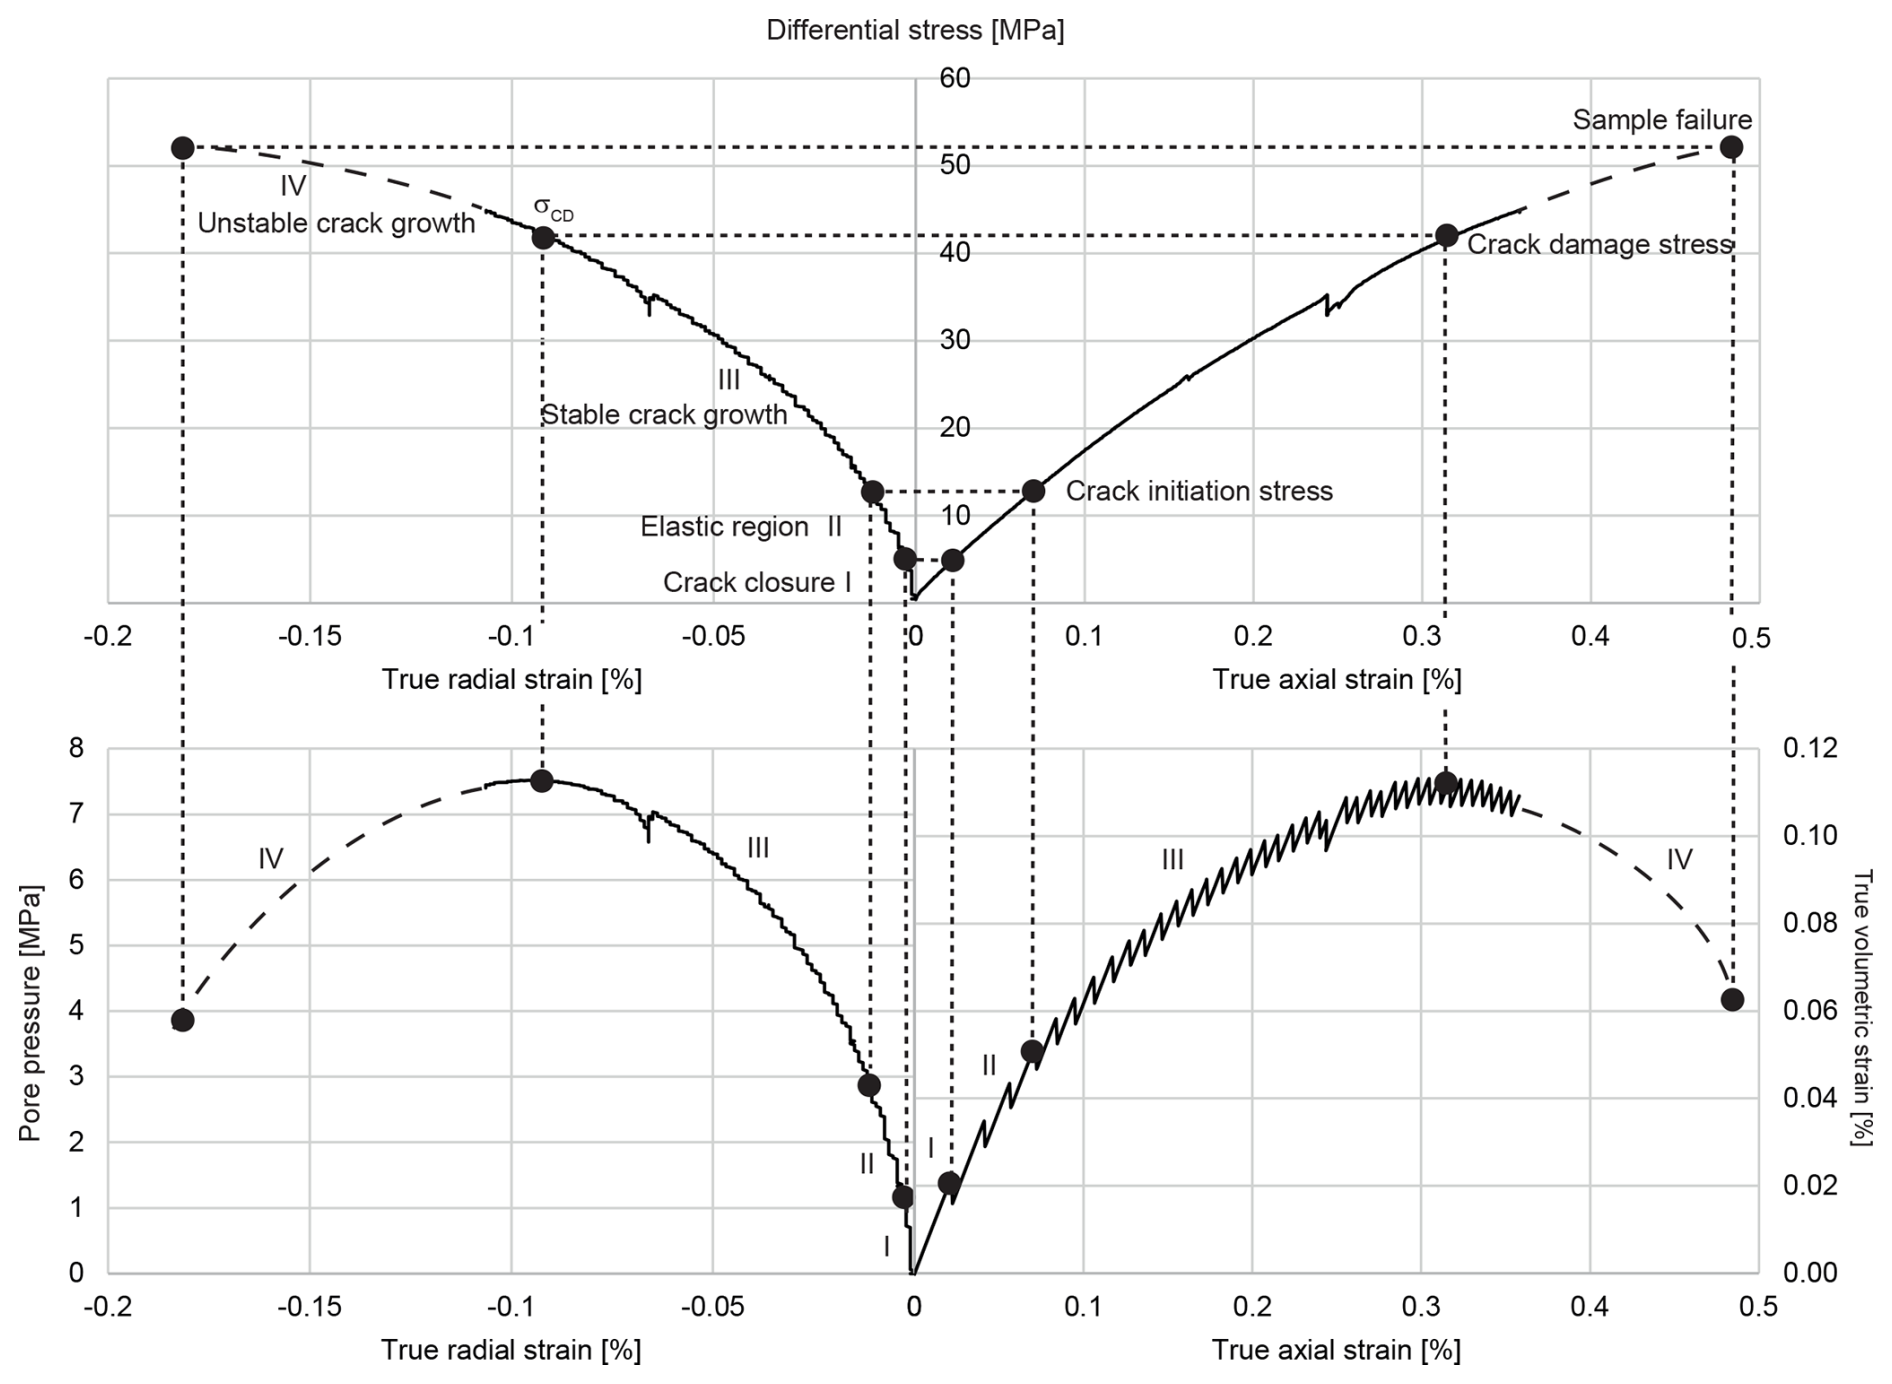
Figure 1Sketch of the stress–strain diagram partially using measurement data from the Bunter Sandstone sample, which are indicated by the continuous lines. The pore pressure evolution and the evolution of the true volumetric strain during are also shown. Dashed lines indicate extrapolated evolution curves.
This change from bulk sample volume decrease to increase under increasing differential stress is often used to define the crack damage stress (e.g., Martin, 1997; Palchik and Hatzor, 2002; Corkum, 2020; Taheri et al., 2020; Wen et al., 2023; Zhang et al., 2023b; Li et al., 2023; Xiao et al., 2023), which is identical to the onset of dilatancy (Alkan et al., 2007; Wu et al., 2018; Zhang, 2018) or the point of critical energy release (Bieniawski, 1967). Some authors (Chang and Lee, 2004; Taheri et al., 2020) define the crack damage stress as the point in the volumetric stiffness curve where stiffness values changed from positive to negative or as the point where cumulative acoustic emission curves increase abruptly. Under true triaxial conditions, the 0.5 value of the instantaneous Poisson value μ13, which is the ratio of the ϵ3 and ϵ1 strain rates, is also considered an indicator for crack damage stress (Kong et al., 2018). Crack damage stress can also be detected by identifying the axial stress at which the axial stress–volumetric strain curve reverses, a method which is often employed for unsaturated rocks under uniaxial compression (e.g., Martin, 1997; Palchik and Hatzor, 2002; Xue et al., 2014; Taheri et al., 2020) or true triaxial loading conditions (Gao et al., 2020; Zhang et al., 2023b). Especially for rocks in which no reversal of the axial stress–volumetric strain can be observed prior to failure, the stress threshold determination method using axial and lateral crack strains is proposed to determine the crack damage stress (Mo et al., 2024). Moreover, crack damage stress can be identified by analyzing acoustic emissions (Chang and Lee, 2004; Wu et al., 2021; Abbas et al., 2023).
In fully saturated rocks, tests under confined and undrained conditions (CU tests) can be used to determine the crack damage stress without measurements of the radial strain. In CU tests, the pore pressure is expected to increase with increasing load as the sample compacts. When the crack damage stress is reached, the sample volume starts to increase, which in turn leads to a drop in pore pressure (Fig. 1). Thus, in CU tests, the pore pressure maximum can act as an indicator for the reversal of the axial stress–volumetric strain curve and thus as an indicator for the occurrence of crack damage stress (Yoshinaka et al., 1997; Brandon et al., 2006).
Although the theoretical background to all of the above-described measurement techniques is well defined, achieving perfect boundary conditions in the laboratory is impossible. Each and every measurement technique is influenced by unwanted effects which can be mitigated but rarely – if ever – completely removed. Such unwanted effects, e.g., can be the response of the triaxial testing machine to the measurements such as the storage in the tubing system between the sample and pore pressure transducer or fluctuations in the room temperature which influence the recorded pore pressure. Small leakages within the system which develop over time are also a potential problem, which prevents measurements under perfect conditions. Thus, it is advisable to combine different detection methods which suffer from different unwanted influences in order to obtain the most reliable results for the crack damage stress. However, in the case of CU tests on fully saturated samples, no immediate complementing method to determination via the maximum pore pressure during loading exists. This is a problem as such tests – especially when performed on low-permeability rock and over a long period of time – tend to suffer, e.g., from pore pressure leakages, temperature variations, and drifting of sensors.
The objectives of our work were therefore to
- i.
find a measurement method which does not suffer from small pore pressure leakages like the methods which rely on the maximum pore pressure to detect crack damage stress,
- ii.
detect crack damage stress with the highest possible accuracy even in long-running experiments, and
- iii.
prove that the new method works for all types of fully saturated rocks.
We implemented this by testing a new method to measure crack damage stress using a Bunter Sandstone sample. Combining this new method with a conventional measurement method, we developed a new experimental procedure which allows validating the results of both methods. Using a long-running triaxial experiment with Passwang Marl, we show that the new procedure can be applied to sandstones but also to other types of fully saturated rocks as well, even if permeabilities are as low 10−20 m2.
The tests were conducted at the laboratory for rock physics of the Federal Institute for Geosciences and Natural Resources (BGR) in Hanover, Germany. Two different triaxial testing apparatuses were used for the two samples investigated in order to save time given that the individual experiments lasted months or years.
2.1 Triaxial testing apparatus for the Passwang Marl sample
The high-pressure triaxial testing apparatus employed for the Passwang Marl regulated the cell pressure on demand by means of a loading system with confining pressures up to 40 MPa and axial loads up to 1000 kN. Three linear variable differential transformers (LVDTs) with a resolution of 1 µm measured the axial displacement. The true axial strain (ϵa, %) was calculated using the arithmetic mean of the change in length of these three LVDTs:
where l0 is the initial length of the sample [mm] and Δl is the arithmetic mean of the change in length [mm] of the three installed LVDTs. No device to measure the circumferential displacement was installed.
In order to realize hydraulic testing, the back pressure at one front end of the sample (inlet pressure, bottom) could actively be regulated via a pressure pump (VPC 250/200, Wille-Geotechnik), while the back pressure at the other front end (top) could only change passively (outlet pressure) except for the possibility of a complete unloading by opening a valve. Both inlet pressure and outlet pressure were monitored using pressure transducers. From the pressure pump, the pore fluid is transported via a 3 m long tube with an inner diameter of 2 mm to the lower piston of the triaxial testing machine. It then flows through the piston into a porous disk of sintered metal which connects to the face of the sample. The porous disk has a diameter of 100 mm and a thickness of 19 mm and ensures that the pore fluid which is transported through the piston is distributed evenly over the face of the sample. On the other side of the sample, another porous disk is located between the sample face and upper piston. The pore fluid can flow through the upper piston into another tube which acts as a small reservoir and can be opened and closed by a valve, e.g., for de-airing the pore fluid system.
The temperature within the triaxial testing apparatus was kept constant at 30 °C ± 0.01 °C.
Initially, the rate of increase in differential stress was set to result in a true axial strain rate of . However, we realized that instead of aiming at a constant true axial strain rate, a constant increase in differential stress allowed for a smoother regulation of the triaxial testing apparatus, thereby resulting in less noise in the data. Thus, from day 335 of the experiment onwards, instead of using a constant strain rate for loading, we used a constant stress rate of 0.21 MPa h−1. This differential stress rate relates to an axial strain rate of about .
No circumferential measurement devices such as extensiometer chains were installed as this experiment initially did not aim to demonstrate the validity of the procedure proposed in this study. Instead we used this running experiment of a low-permeability rock to prove that the procedure also works for rocks with permeabilities as low as 10−20 m2.
2.2 Triaxial testing apparatus for the Bunter Sandstone sample
The high-pressure triaxial testing apparatus employed for the Bunter Sandstone regulated the cell pressure on demand by means of a loading system with confining pressures up to 60 MPa and axial loads up to 1500 kN. The true axial strain was measured and calculated as for the Passwang Marl sample. Three circumferential extensiometer chains (MTS 632.92H-03) were installed at 25 %, 50 %, and 75 % of sample length as this experiment on the Bunter Sandstone was deliberately set up to provide information on the sample's axial and volumetric deformation in order to substantiate the claims of this study. Using the data from the LVDTs and the extensiometer chains, the true volumetric strain (ϵv, %) was calculated as
where r0 is the initial radius of the sample [mm] and Δr the change in radius [mm] calculated from the arithmetic mean of the changes in length of the three extensiometer chains.
The inlet and outlet pressure measurement system was the same as for the Passwang Marl sample, with a different pressure pump (VPC 250/200-15, Wille-Geotechnik) being the only difference.
The strain rate was set to . This is higher than for the Passwang Marl. However, as the Bunter Sandstone is much more permeable, it was possible to use a higher strain rate and still obtain hydraulic equilibrium during the experiment. Thus, in order not to prolong the experiment unnecessarily, a higher strain rate than for the Passwang Marl was chosen.
To demonstrate the validity of the new detection method, samples from two different rock types were used. One sample consists of marl from the lower Passwang Formation, while the second sample consists of Bunter Sandstone.
3.1 Passwang Marl
The marl sample used for this study was cored from the lower Passwang Formation at the Mont Terri URL in Switzerland. The sample was cored with an angle of about 45° to the bedding (Z orientation) from borehole BPE-2 (Gygax et al., 2017), with a depth of 55.8 to 56 m. After preparation, the sample had a length of 199.96 mm and a diameter of 99.97 mm.
The depositional environment of the Passwang Formation is a shallow, mixed siliciclastic and carbonate depositional environment (Burkhalter, 1996), which is backed by the finding of, e.g., crinoids and ammonites (Hostettler et al., 2017). The sample used in this study derives from the lower part of the Passwang Formation, which is of late Aalenian age (Hostettler et al., 2017). The Passwang marls show a high variability of the mineralogy. For the sample used in this study, clay mineral content is expected to be 20 % weight content, total carbonate 61 %, and quartz and feldspar 17 %, with K-feldspar weight content reaching 2 %. Total carbonate is mainly made of calcite (50 %), but dolomite and ankerite are present in as much as 11 %, whereas siderite is absent. Pyrite as a major sulfur-bearing phase is present in small amounts of 0.5 % and organic carbon at 1.0 % (Waber and Rufer, 2017).
The porosity of Passwang marls varies between 6.1 % and 14.4 % (Waber and Rufer, 2017), while the permeability of this sample is in the range of 10−20 to 10−19 m2.
In order to avoid chemical alterations within the sample, which could lead to changes in the geomechanical properties (Ewy et al., 2008), so-called “Pearson water” with a composition as close as possible to the in situ conditions was used. (Pearson, 2002).
The sample was consolidated at 20 MPa confining pressure, which was kept constant for almost 27 d in order to close artificial (micro)fractures that formed during sample preparation. During this time, the true axial strain rates decreased from about to less than . Towards the end of the consolidation phase, deformation and therefore strain rates were often below the resolution limit of the LVDTs of about for measurements taken every minute. After reducing the confining stress to 2 MPa, true axial strain rates rapidly approached values of less than again, indicating a consolidated sample.
3.2 Bunter Sandstone
The sandstone was derived from well 4624IG0105 (ID number of the State Authority for Mining, Energy and Geology, Lower Saxony) from a depth of 12.1 to 12.5 m. The well is located in the vicinity of Hannoversch Münden in the very south of Lower Saxony, Germany. It is part of the Solling Formation of the Bunter Sandstone. Sandstones of the Solling Formation in the area of Hannoversch Münden have been identified to be of fluvial origin (Olsen, 1988) and were deposited about 249 Myr ago during the Olenekian (Heunisch et al., 2017; Deutsche Stratigraphische Kommission, 2022). The permeability of Bunter Sandstones has been determined to be in the range of 10−17 m2 with porosities of between 9 % and 18 % (Breede, 2006).
The main mineral of this sample is quartz with 60 % weight content, followed by orthoclase and muscovite with 11 % each. The sandstone also contains smectite (7 %), plagioclase (3 %), chlorite (3 %), kaolinite (2 %), calcite (2 %), hematite (1 %), and traces of rutile.
After preparation, the sample had a length of 199.94 mm and a diameter of 99.95 mm. To saturate the initially completely dry sample of Bunter Sandstone and for the further testing procedure, ordinary tap water was used as chemical alterations within the sample were considered to be irrelevant.
Consolidation of the sample occurred over 5 d in which the confining pressure was kept at 20 MPa. Over the course of the consolidation phase the strain rate decreased from about to less than where it stabilized.
4.1 Passwang Marl
The saturation phase for the this sample was comparatively quick with only three phases in less than 3 d (Fig. 2). In phase 1, with the confining pressure still at 2 MPa, the inlet pressure was set to 0.5 MPa for 2 d. In phase 2, the confining pressure was increased to 10 MPa and the inlet pressure to 9.5 MPa. While the outlet pressure did not show any reaction to the inlet pressure increase in phase 1, in phase 2 it started to increase after only 5 min. However, initially this increase was too small to be clearly seen in Fig. 2 (from 0.072 bar to 0.095 bar in the first 5 min). The outlet pressure approached a maximum value close to 3 MPa after 260 min. Due to technical problems, the inlet pressure decreased to 6.3 MPa over 30 min and increased back to 9.5 MPa within 6 min in phase 3. Less than 30 min later, the outlet pressure nearly reached the same value as the inlet pressure with a difference of less than 0.1 MPa.
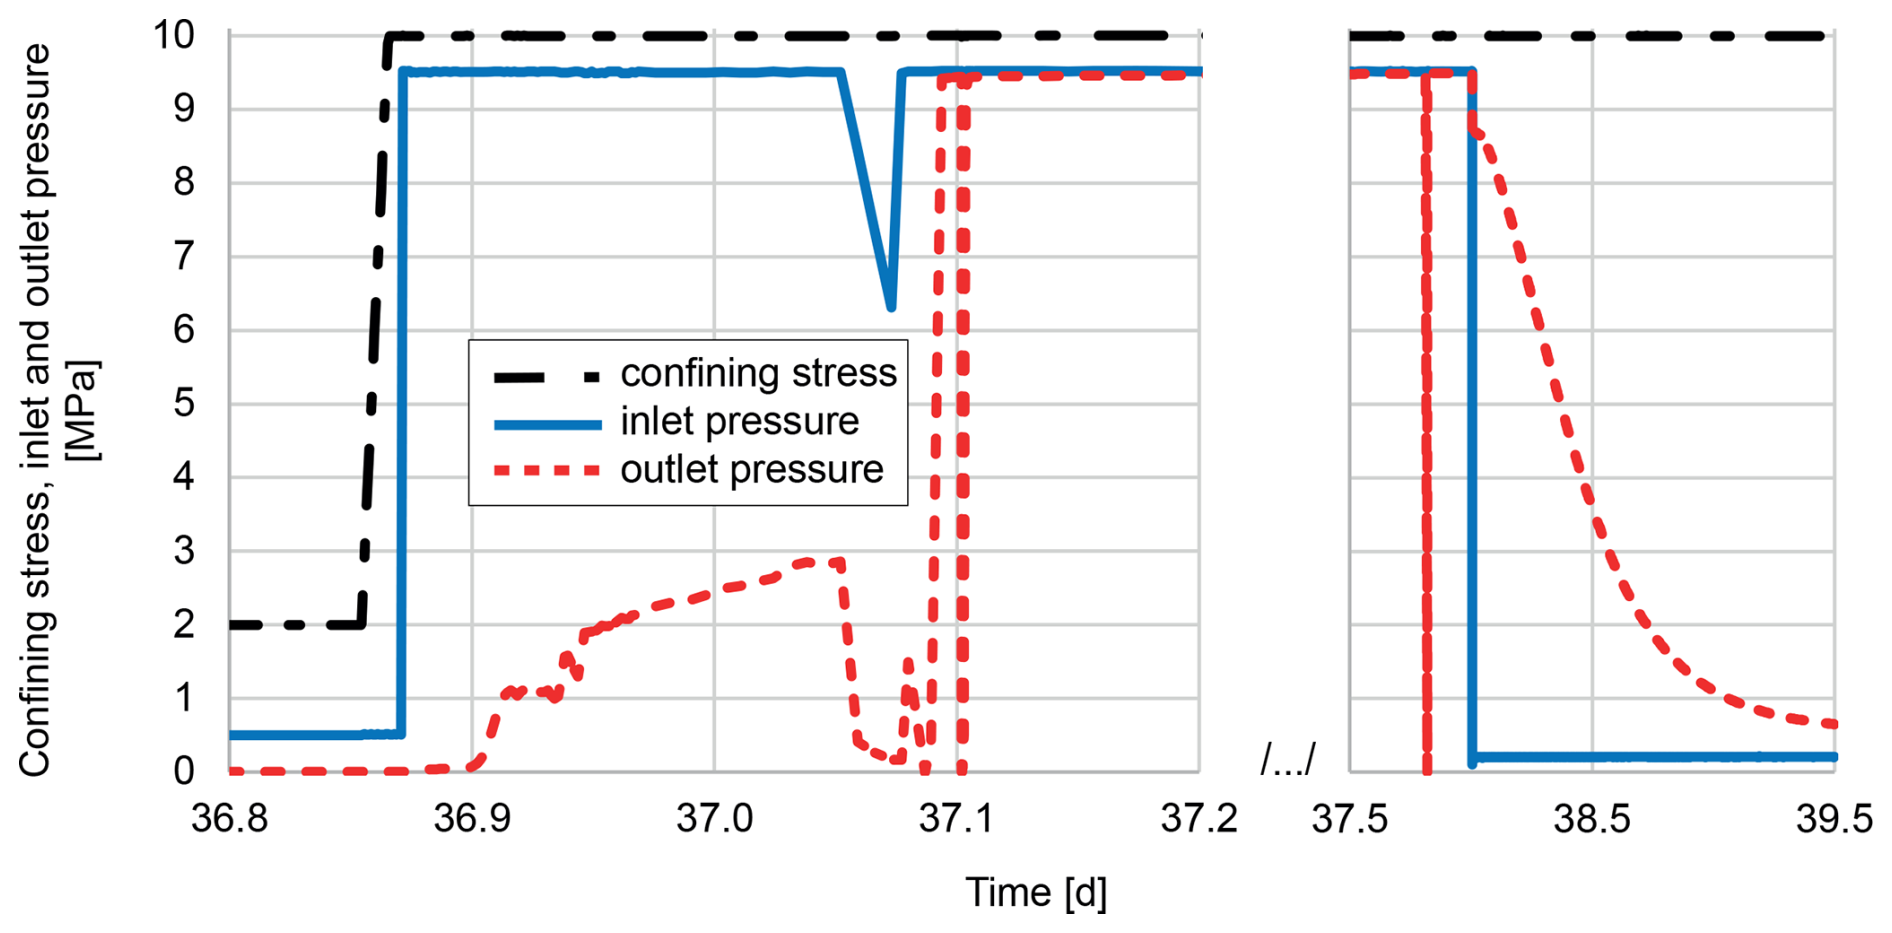
Figure 2The saturation phase for the sample used in this study. Note the different spacing of the x axis.
To verify this result, the valve for the outlet pressure was opened and closed again to observe the outlet pressure increase at a very high data rate of one measurement per 5 s shortly before and after day 37.1. This test showed a rapid increase in outlet pressure from 0 MPa to more than 9.4 MPa in less than 4 min.
A hydraulic shortcut was probably responsible for the observed fast increases in outlet pressure after de-airing shortly before and after day 37.1. This idea is supported by further data. When the inlet pressure was decreased from 9.5 to 2 MPa about a day later, the outlet pressure dropped synchronously for the first 0.8 MPa, as can be expected in the case of a hydraulic shortcut, and then settled into a typical pressure diffusion curve. It thus seems that for some part of the saturation process a hydraulic shortcut was active, which later closed and did not reopen again during the remainder of the experiment.
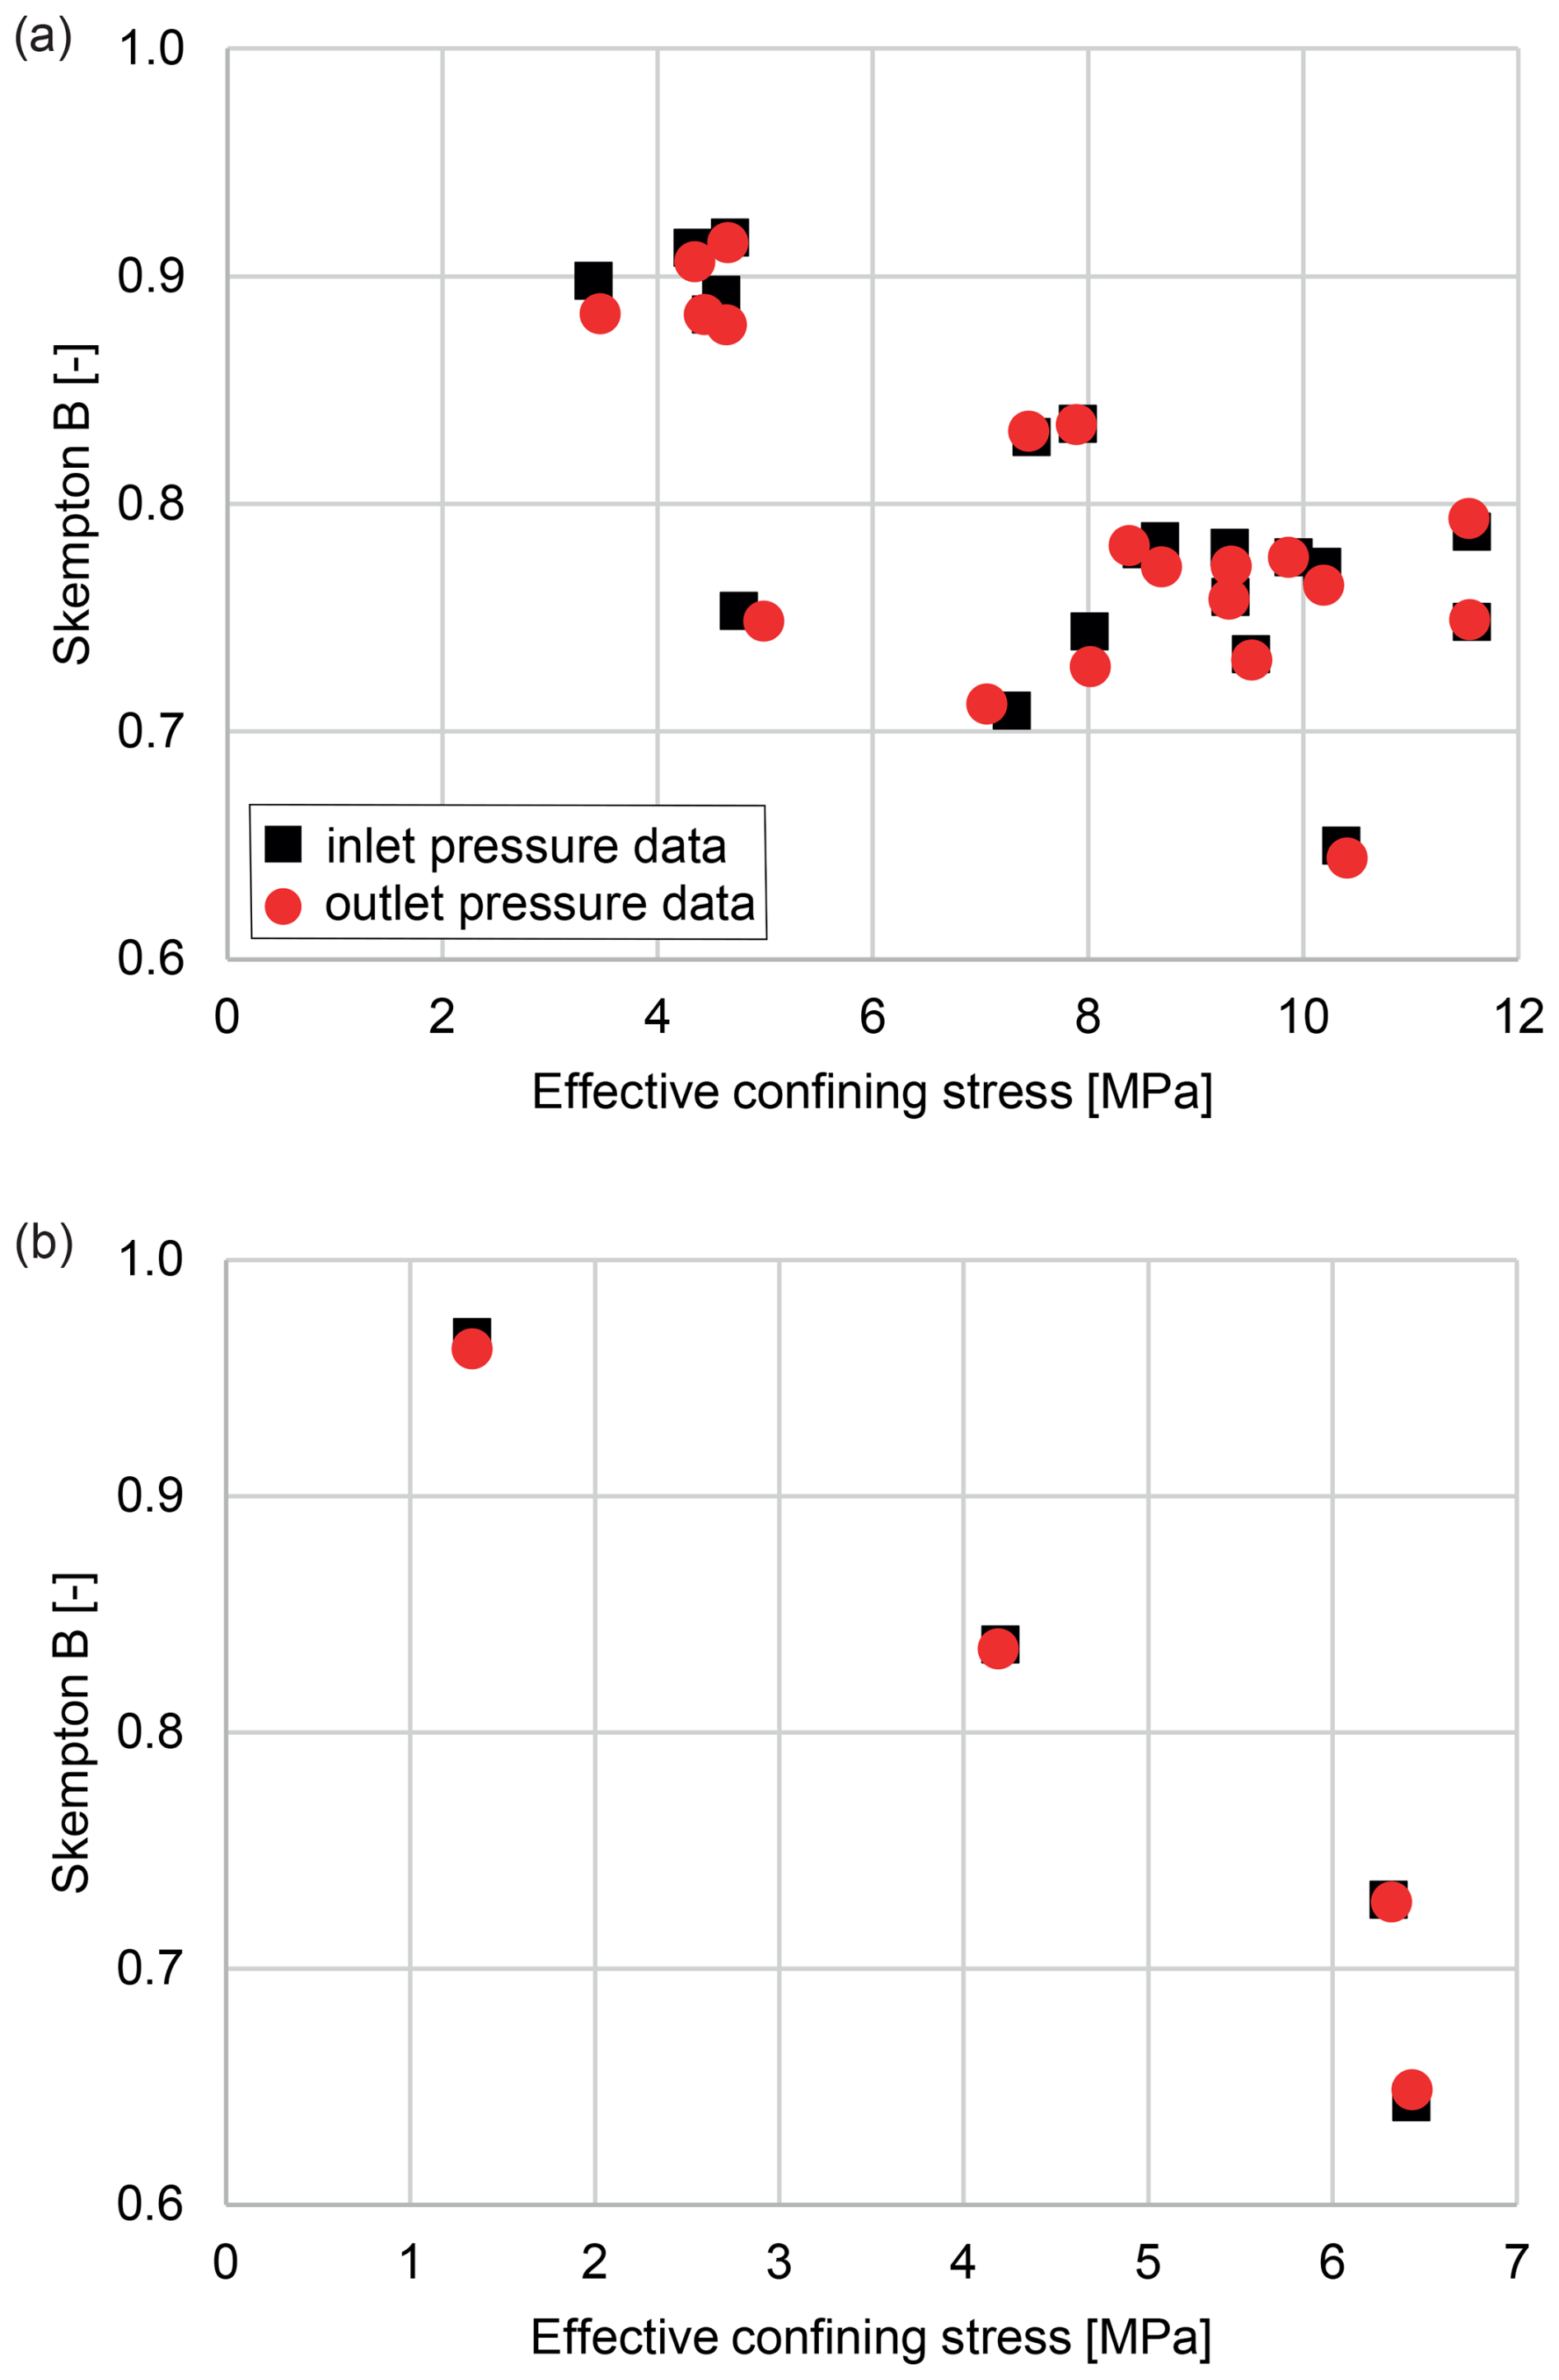
The saturation of the sample was determined by changing the confining stress under hydrostatic conditions and monitoring the response of the inlet and outlet pressure. The parameter Skempton B, which describes the saturation state of the sample, can be calculated from
where B is the Skempton parameter [–], Δu is the observed change in inlet or outlet pressure [MPa], and Δσ3 is the imposed change in confining stress [MPa].
For an effective confining stress of less than 5 MPa, most measurements indicate Skempton B values to be between 0.88 and 0.92. One Skempton B test, however, yielded values of only about 0.75. Yet, these values can be regarded as outliers given the general decrease in Skempton B values with increasing effective confining stress observed for this sample. For an effective confining stress of 10.3 MPa, values decrease to 0.65. Skempton B values derived from the response of the inlet and outlet pressure to the change in confining stress differed slightly across all measurements (see Fig. 3a). The decrease in Skempton B with increasing effective confining stress is in accordance with earlier findings for claystones (Wild et al., 2015; Wild and Amann, 2018; Favero et al., 2018) and other rock types (Mesri et al., 1976; Zimmerman, 1991).
The measurements for the Skempton B values shown in Fig. 3a were performed not only at the beginning but also over the course of the entire experiment.
Undrained conditions are required to precisely measure Skempton B. However, these undrained conditions cannot be realized completely as the porous disks at the front ends and the linings are also part of the tested reservoir and not only the sample itself. Thus, a certain fluid flow between the sample and inlet and outlet reservoir cannot be avoided if the confining stress is changed. As a consequence, the change in measured pore pressure due to a changing confining stress in perfect undrained conditions would be higher than the observed change (Wissa, 1969; Gutierrez et al., 2015). Therefore, the measured Skempton B parameter likely underestimates real conditions. The Passwang Marl sample was considered to be fully saturated due to the repeatedly measured high value of the Skempton B parameter.
4.2 Bunter Sandstone
The confining pressure was kept at 20 MPa for the saturation phase of the Bunter Sandstone. Initially, the inlet pressure was increased to 3 MPa for 5 d, in which the outlet pressure showed no response. Thus, the inlet pressure was increased to 6 MPa, which was kept constant for 32 d. During this time, the sample was de-aired 13 times until the outlet pressure response did not change any more. For this, a valve at the outlet pressure side was opened in order to let trapped gas escape to the atmosphere. During this process, pore fluid was present in the fluid lines on both sides of the valve to prevent atmospheric gases from entering the system. After this, four tests for Skempton B were performed (Fig. 3b), indicating a fully saturated sample. The tests also confirmed the dependency of the Skempton B parameter on the effective confining stress.
In this study, a new method is presented which allows the determination of the crack damage stress of a fully saturated sample under confined and drained conditions (CD test). This new method is compared with the conventional method used in CU tests. The conventional method is hereafter called the maximum pore pressure method (MPP method), while the new method is called the true axial strain method (TAS method). The combination of both methods yields the proposed new experimental procedure, which is shown in Fig. 4. It depicts a single cycle of the entire experiment, which consists of repeated cycles at different effective confining stresses.
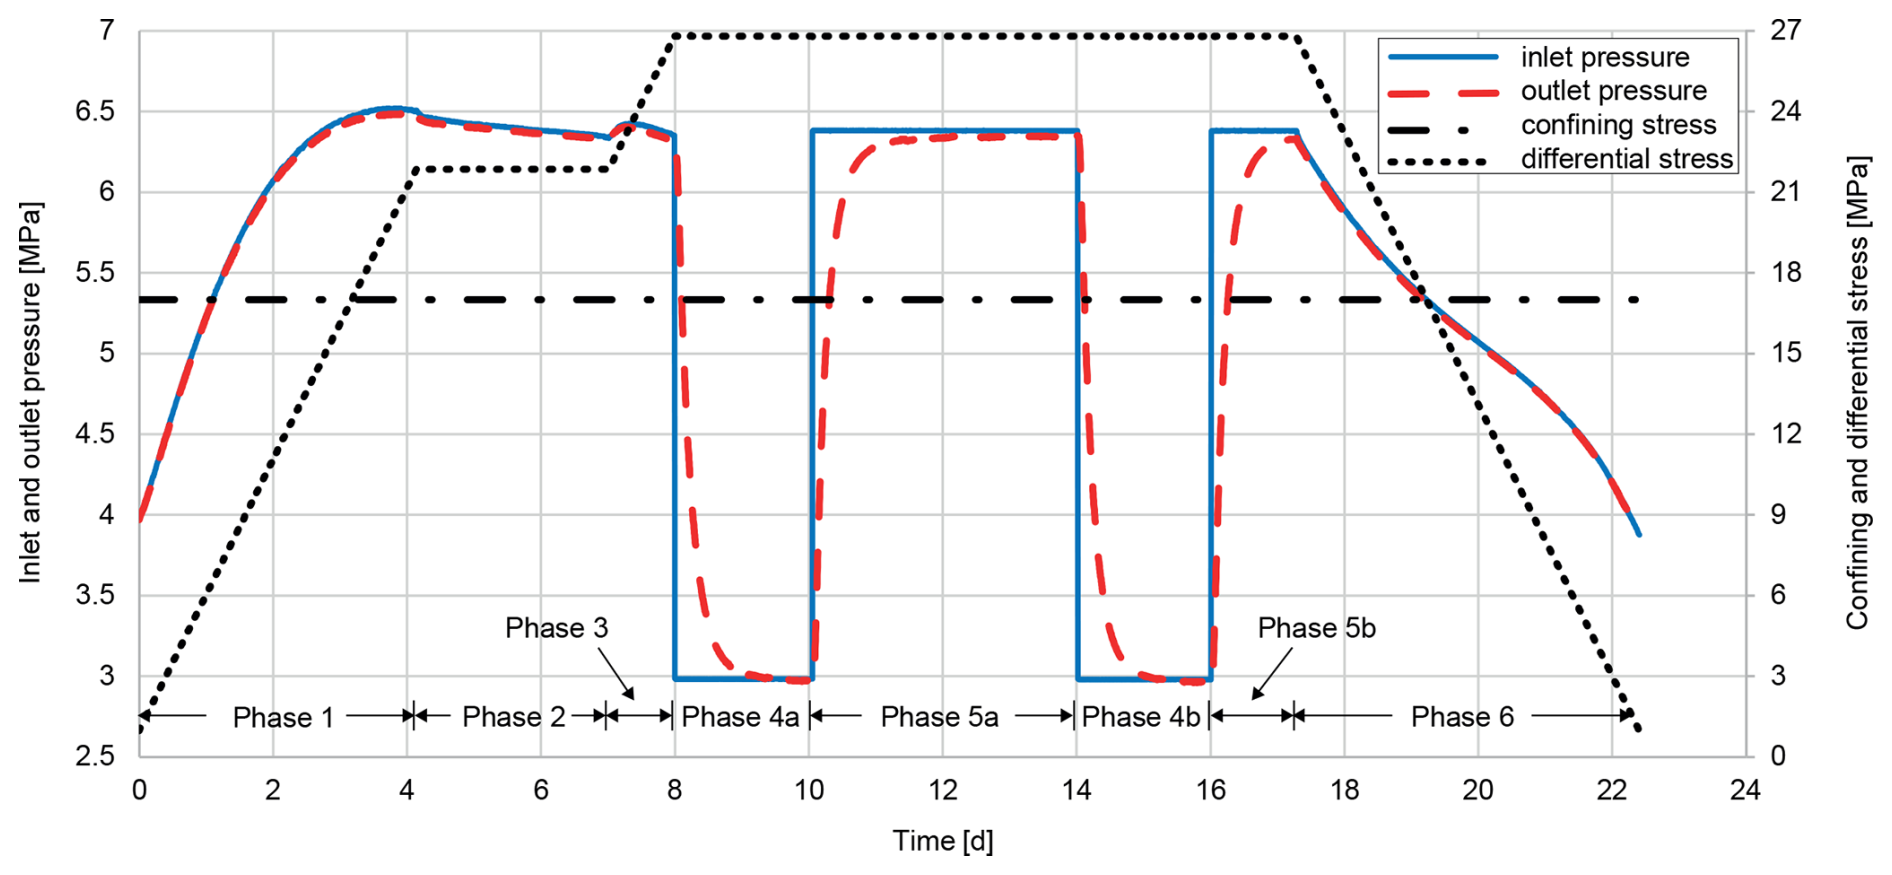
In the cycle shown in Fig. 4, the MPP method encompasses phases 1 to 3, while the new TAS method is covered by phases 4 and 5 (detailed below).
In Fig. 4, the denoted time refers to the time since the start of the experiment cycle. In all subsequent figures, the denoted time refers to the start of a single phase of the respective experiment cycle.
Both methods rely on bringing the sample into the dilatant regime by changing the effective confining stress, which was shown to be critical for the crack damage stress (Wu et al., 2018). The effective confining stress is defined as
where σ3 is the confining stress [MPa], α the Biot coefficient [–], I the identity matrix [–], and u the pore pressure [MPa]. The effective confining stress is applied to the sides of the sample, while the differential stress q acts in the axial direction and is defined as
where σ1 is the normal stress acting in the axial direction on the sample [MPa]. Changing the effective confining stress can be achieved by changing either the confining stress or the pore pressure within the sample. Both methods presented in this paper rely on changing the pore pressure to change the effective confining stress.
The new procedure, which combines the two methods, consists of several different phases in which the confining stress is kept constant throughout.
-
Phase 1: in a CU test, the differential stress is increased until the (apparent) pore pressure maximum has been reached. Phase 1 is identical to the conventional way of determining crack damage stress by the MPP method.
-
Phase 2: all stresses are kept constant for a minimum of 2 d to detect any possible leakages (indicated by a pore pressure decrease) and if necessary to determine a leakage correction term.
-
Phase 3: the differential stress is increased again until the maximum pore pressure (after applying the leakage correction term) has been reached.
-
Phase 4: in a CD test, the differential stress is kept constant, while the inlet pressure is decreased by typically several megapascals (MPa). This phase lasts until the outlet pressure has stabilized.
-
Phase 5: the inlet pressure is increased up to its value at the start of phase 4. Again, this phase lasts until the outlet pressure has stabilized. In this phase, the detection of crack damage stress by the TAS method is possible.
-
Phase 6: under CU conditions, the differential stress is decreased to its value at the beginning of phase 1. This marks the end of one test cycle.
Depending on the response of the sample, phases 4 and 5 can be repeated several times in one test cycle, which in Fig. 4 is indicated by the annotations “a” and “b”.
In the following, we show that the proposed new experimental procedure is the most effective way to gain accurate results and to overcome deficiencies of the conventional MPP method.
5.1 Maximum pore pressure method (MPP method)
For the conventional MPP method, the differential stress in a CU test is increased until the maximum pore pressure is reached and the pore pressure starts to decrease (phase 1 in Fig. 4). The point where the pore pressure maximum occurs is then identified as the crack damage threshold and the acting axial stress as crack damage stress (Yoshinaka et al., 1997; Brandon et al., 2006). However, a closer look at this measurement technique revealed some weaknesses which can prevent an accurate detection of crack damage stress. The most important one is potential leakage, which can develop in the course of an experiment even if the utmost care is taken to ensure a tight system at the start of the experiment. Such a leakage manifests itself as a drop in pore pressure, while all stresses are kept constant (Fig. 4, phase 2).
In the experiments used for this study, the leakage was so small (<0.1 mL d−1) that it was impossible to detect its origin and to stop it. But even though the amount of fluid loss was tiny, the influence on the pore pressure was obvious and had to be taken into account for determining the crack damage stress. This was achieved by determining a leakage correction term using the pore pressure drop observed in phase 2. As in the initial part of phase 2 the pore pressure drop is influenced not only by the leakage but also by a slight axial compaction of the sample due to time-dependent elasto-plastic processes, it is essential to wait until the decrease in pore pressure is relatively constant. In our experiments, 2 d was sufficient for phase 2 to establish a linear leakage correction term.
Another factor which negatively impacted our experiments was variation in room temperature, which led to changes in pore pressure. This effect is also reported by other authors and usually causes pore pressure oscillations on a daily basis (Giger et al., 2018). Figure 5 demonstrates how the changes in pore pressure due to room temperature variations can impact the accurate detection of the crack damage threshold.
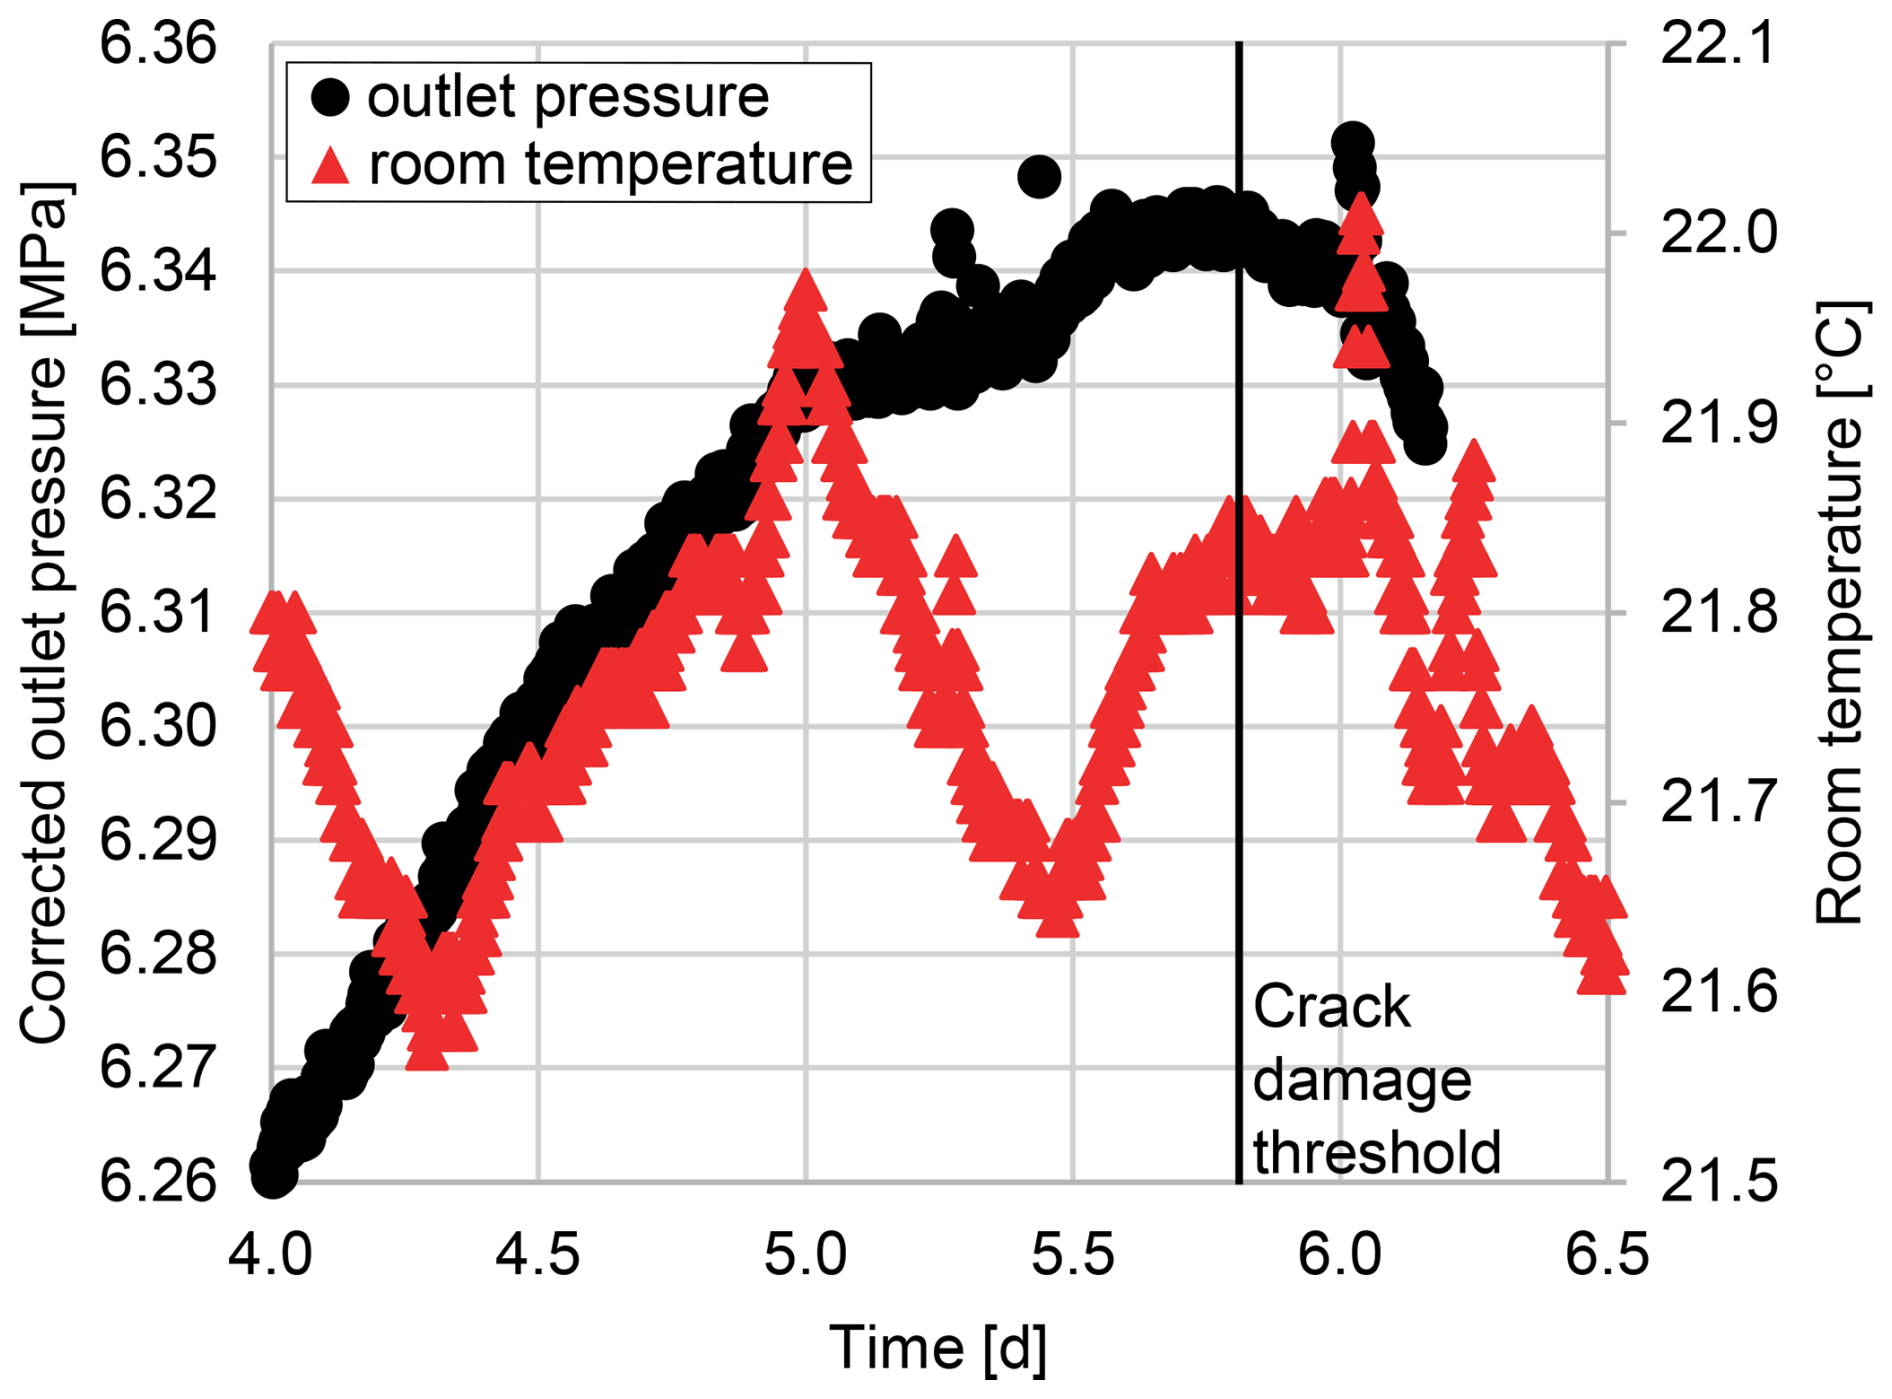
Figure 5Crack damage threshold as detected by the MPP method (Passwang Marl) during phase 1.
5.2 True axial strain method (TAS method)
The crack damage stress depends on the effective confining stress (Wu et al., 2018) or the mean effective stress (Khaledi et al., 2023). If the confining stress is kept constant, there are two ways to change the effective confining stress by manipulating the pore pressure: 1. the load is increased and as a result the pore pressure changes in a CU test; 2. the pore pressure is changed directly, while the load is kept constant in a CD test. While the MPP method uses the first possibility, the new TAS method relies on the second one.
For the new TAS method, the sample already has to be in the dilatant regime, which can be established by using the MPP method first (Fig. 4, phases 1 to 3). When the sample has crossed into the dilatant regime, all stresses (differential and confining stress) are kept constant and the pore pressure is first reduced by several megapascals (MPa) (Fig. 4, phase 4). This increases the effective confining stress and the sample crosses back into the non-dilatant regime. After the pore pressure has stabilized, it is increased back to its initial value (Fig. 4, phase 5); i.e., the effective confining stress is decreased and the sample again enters the dilatant regime. The crack damage threshold is then indicated by the minimum in true axial strain in phase 5. To be more precise, at the crack damage stress, the true axial strain stops decreasing and starts increasing (Fig. 6). For this study, positive true axial strains indicate compaction of the sample.
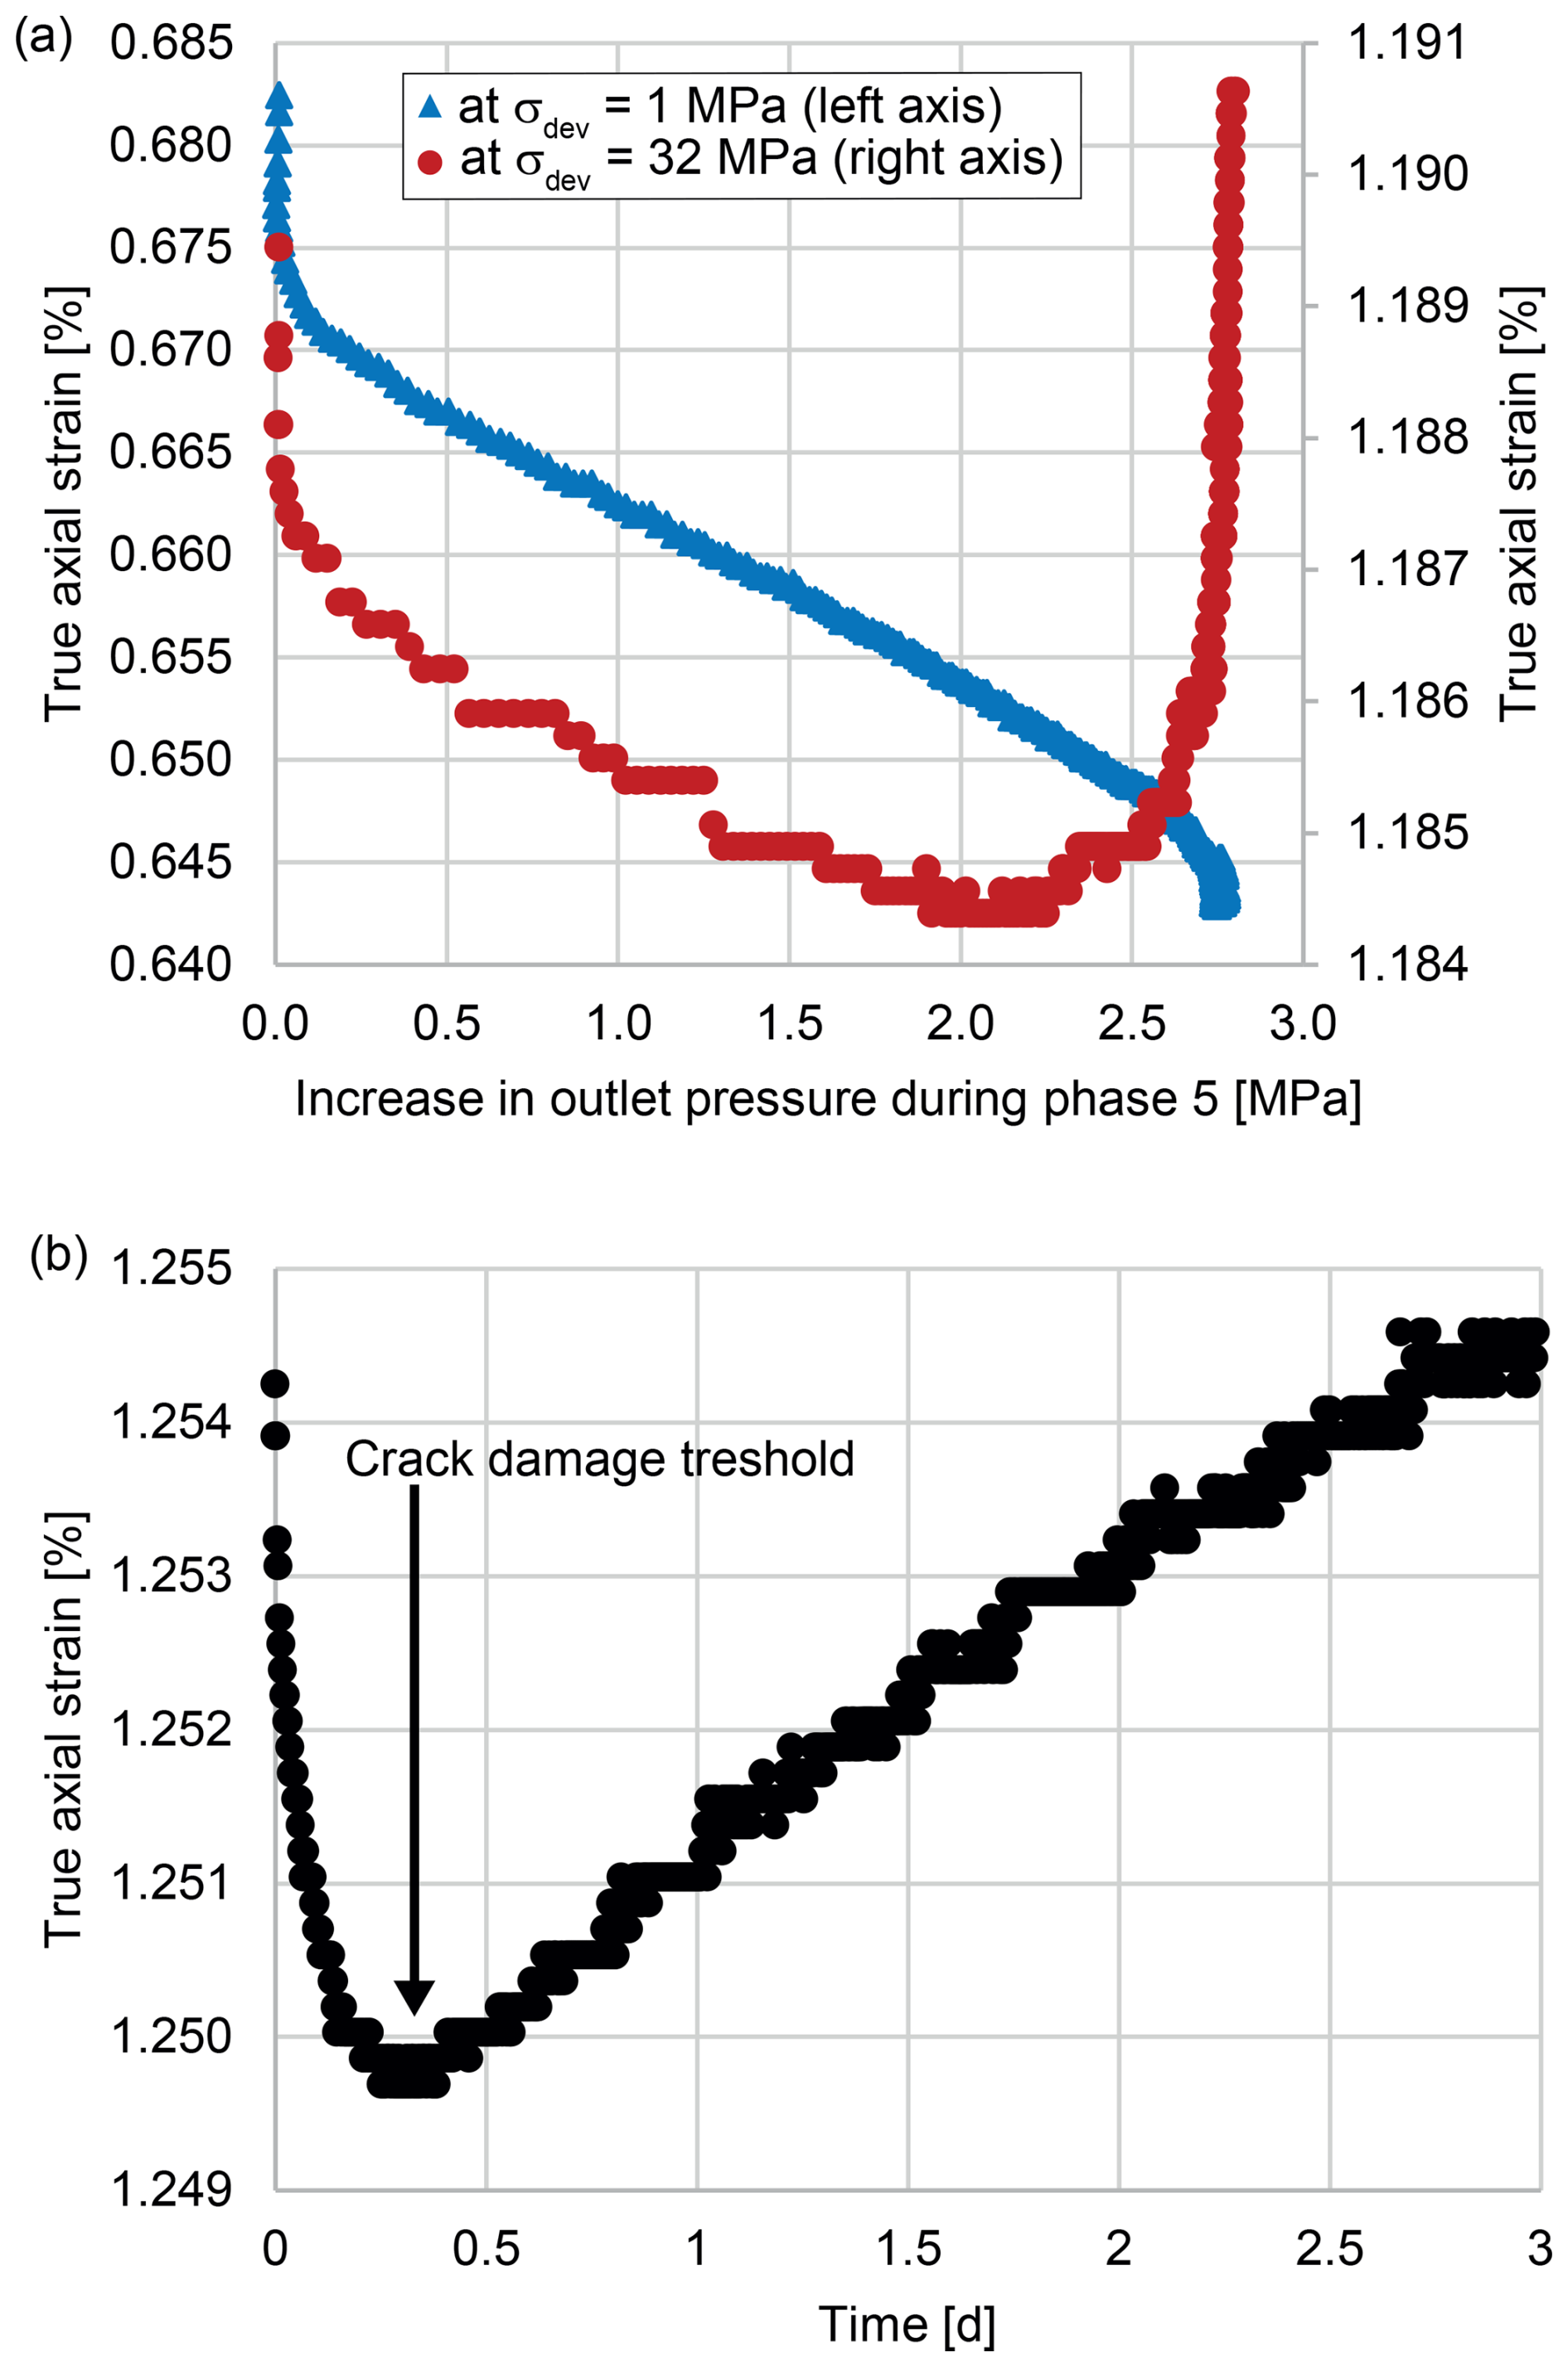
Figure 6Evolution of true axial strain for Passwang Marl. (a) Comparison for two differential stresses. Note the different ranges of the y axes. (b) Crack damage threshold as seen in the true axial strain during phase 5.
If the evolution of the true axial strain is analyzed, a remarkable difference between the evolution at low and high differential stresses can be observed (Fig. 6a). The true axial strain showed a continuous decrease for increasing pore pressure within the sample for low differential stresses (below the dilatant regime). For high differential stresses, however, where an increase in pore pressure resulted in a shift into the dilatant regime, the true axial strain exhibited a sudden increase after the initial decrease. The point where the true axial strain was minimal marked the crack damage threshold.
The change in true axial strain due to a pore pressure increase was smaller for high than for low differential stresses (Fig. 6a). However, the minimum of the curve could still be determined with a high accuracy. The crack damage threshold can also be clearly identified if the true axial strain is plotted against the duration of phase 5 (Fig. 6b).
Figure 7 illustrates the different development of the main parameters of the MPP method (CU test) and the TAS method (CD test). Even though both methods can be used to detect the crack damage stress, a direct comparison is impossible due to the different stress paths and parameters involved for each method.
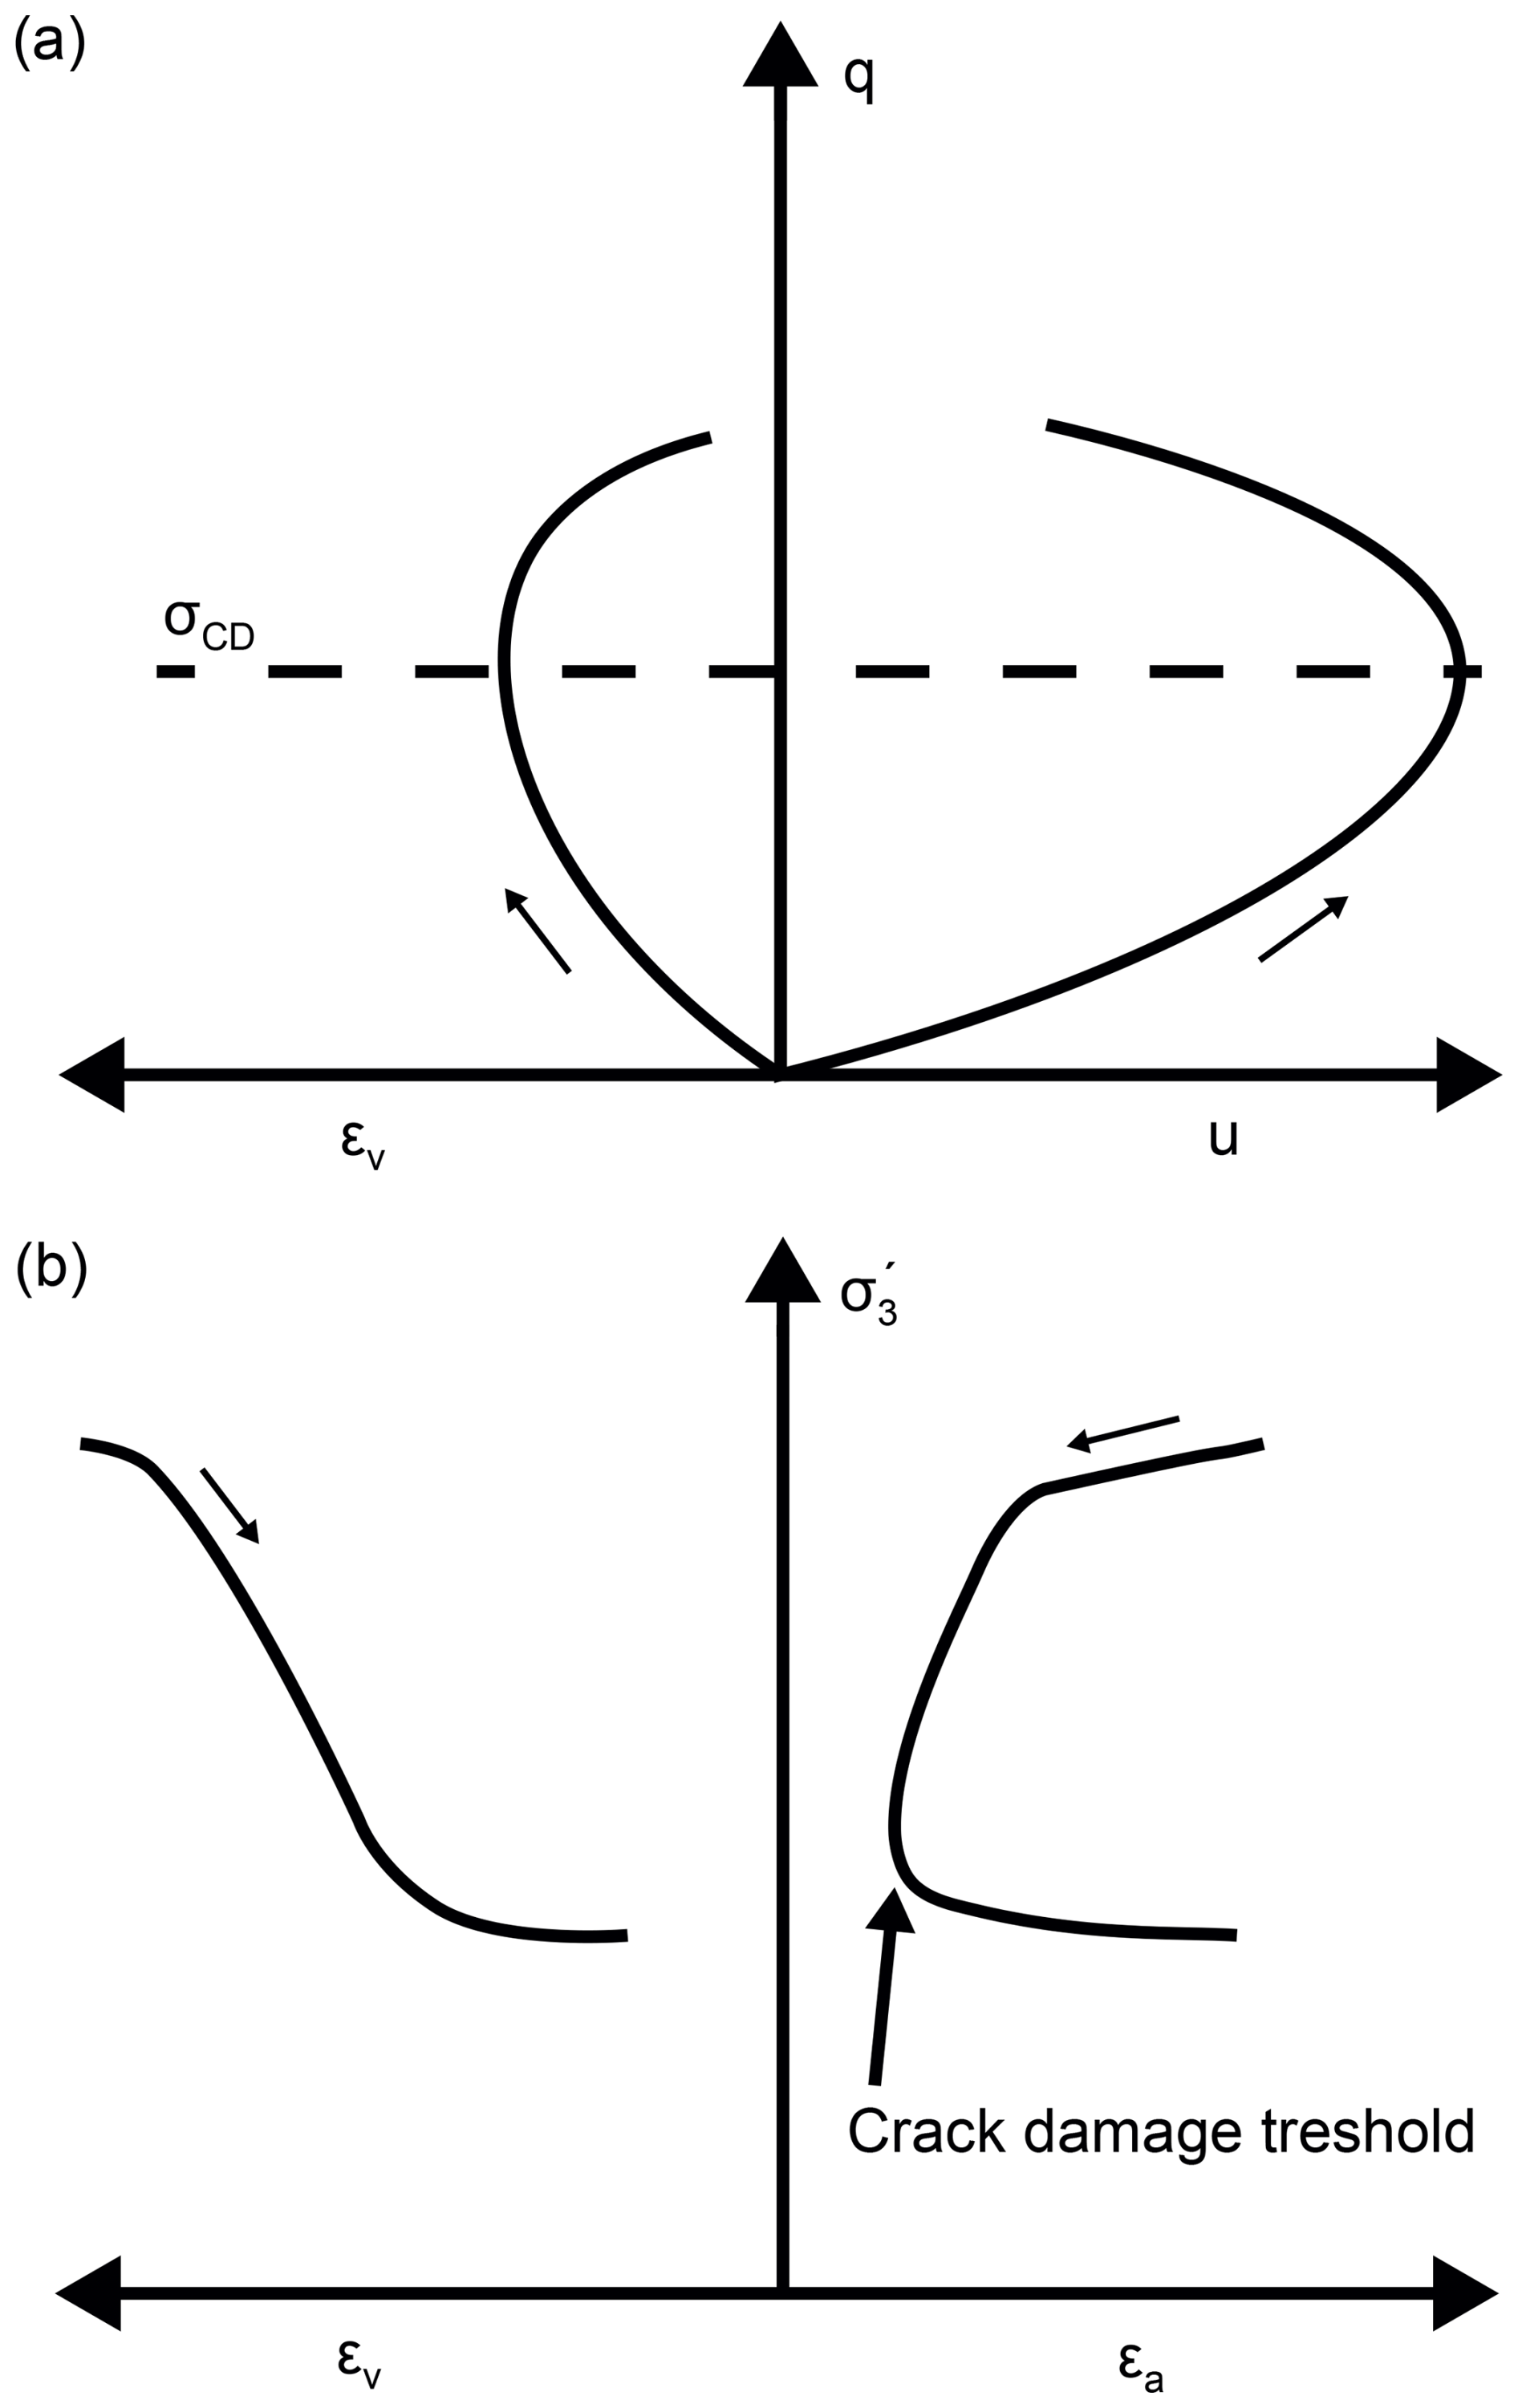
Figure 7Sketch of the evolution of the main parameters during the experiment: (a) MPP method and (b) TAS method. Small arrows indicate the direction of the process.
6.1 Validity of the TAS method
In order to prove the validity of the new method for detecting crack damage stress, it has to be shown that the minimum in true axial strain during phase 5 indeed indicates the crack damage threshold, i.e., for each state of the system which fulfills the condition of the TAS method at this point,
Also, the condition for the crack damage stress according to the MPP method (phases 1 and 3),
is fulfilled. Since at the point of the pore pressure maximum du=0 holds, Eq. (7) becomes equivalent to
In general, the relationship between the differential change in the effective stress (dσ′) and the differential change in the strain (dϵ) is described by the constitutive equation,
where S is the compliance matrix of the material (a fourth-order tensor), which is identical to the inverse of the stiffness tensor C (i.e., ).
Using the notation of Voigt, Eq. (9) gets the form
It has to be kept in mind that the Voigt notation of the compliance matrix is symmetrical in all coordinate systems and for arbitrary anisotropies of the material, i.e.,
is always true. In its principal coordinate system, the stress change is
In this coordinate system, from Eqs. (10) and (12) it follows for the diagonal elements of the strain tensor that
which gives for the volumetric strain
For the conditions of the loading path of the TAS method (i.e., ), Eq. (13) yields
For the condition of the loading path of the crack damage stress (i.e., ), Eq. (14) yields
Due to the symmetry of the compliance matrix (Eq. 11), Eq. (18) is equivalent to
Using Eqs. (15) and (19), it follows that
This shows that Eqs. (6) and (8) are equivalent.
It has to be noted that in this argumentation both conditions refer to the same system state. Thus, this argumentation is also valid if the compliance tensor depends on the stress state and perhaps also the stress history.
6.2 True axial strain versus true volumetric strain
The physical derivation of the behavior of the true axial strain at the crack damage stress using the TAS method is confirmed by experimental observations. Figure 6a shows that during phases of pore pressure increases the true axial strain evolves differently for samples under high and low differential stresses. Under high differential stress, the true axial strain changes from decrease to increase (i.e., compaction) for increasing pore pressure.
The results of the experiment with fitted extensiometer chains (Fig. 8a) demonstrate that the radial strain continues to decrease even while the true axial strain begins to increase. Equivalent volumetric strains are calculated using the true axial strain as well as the radial strain measured by only one extensiometer chain as input data. Most of the radial strain occurs in the upper part of the Bunter Sandstone sample (illustrated by the large decay in equivalent volumetric strain), indicating that dilatancy is not uniformly distributed over the sample's length. The true volumetric strain shows a continuous decrease even though the true axial strain decreases at the beginning of phase 5 followed by an increase (Fig. 8b). Thus, the sample proceeds to expand in volume despite the fact that compaction occurs in the axial direction.
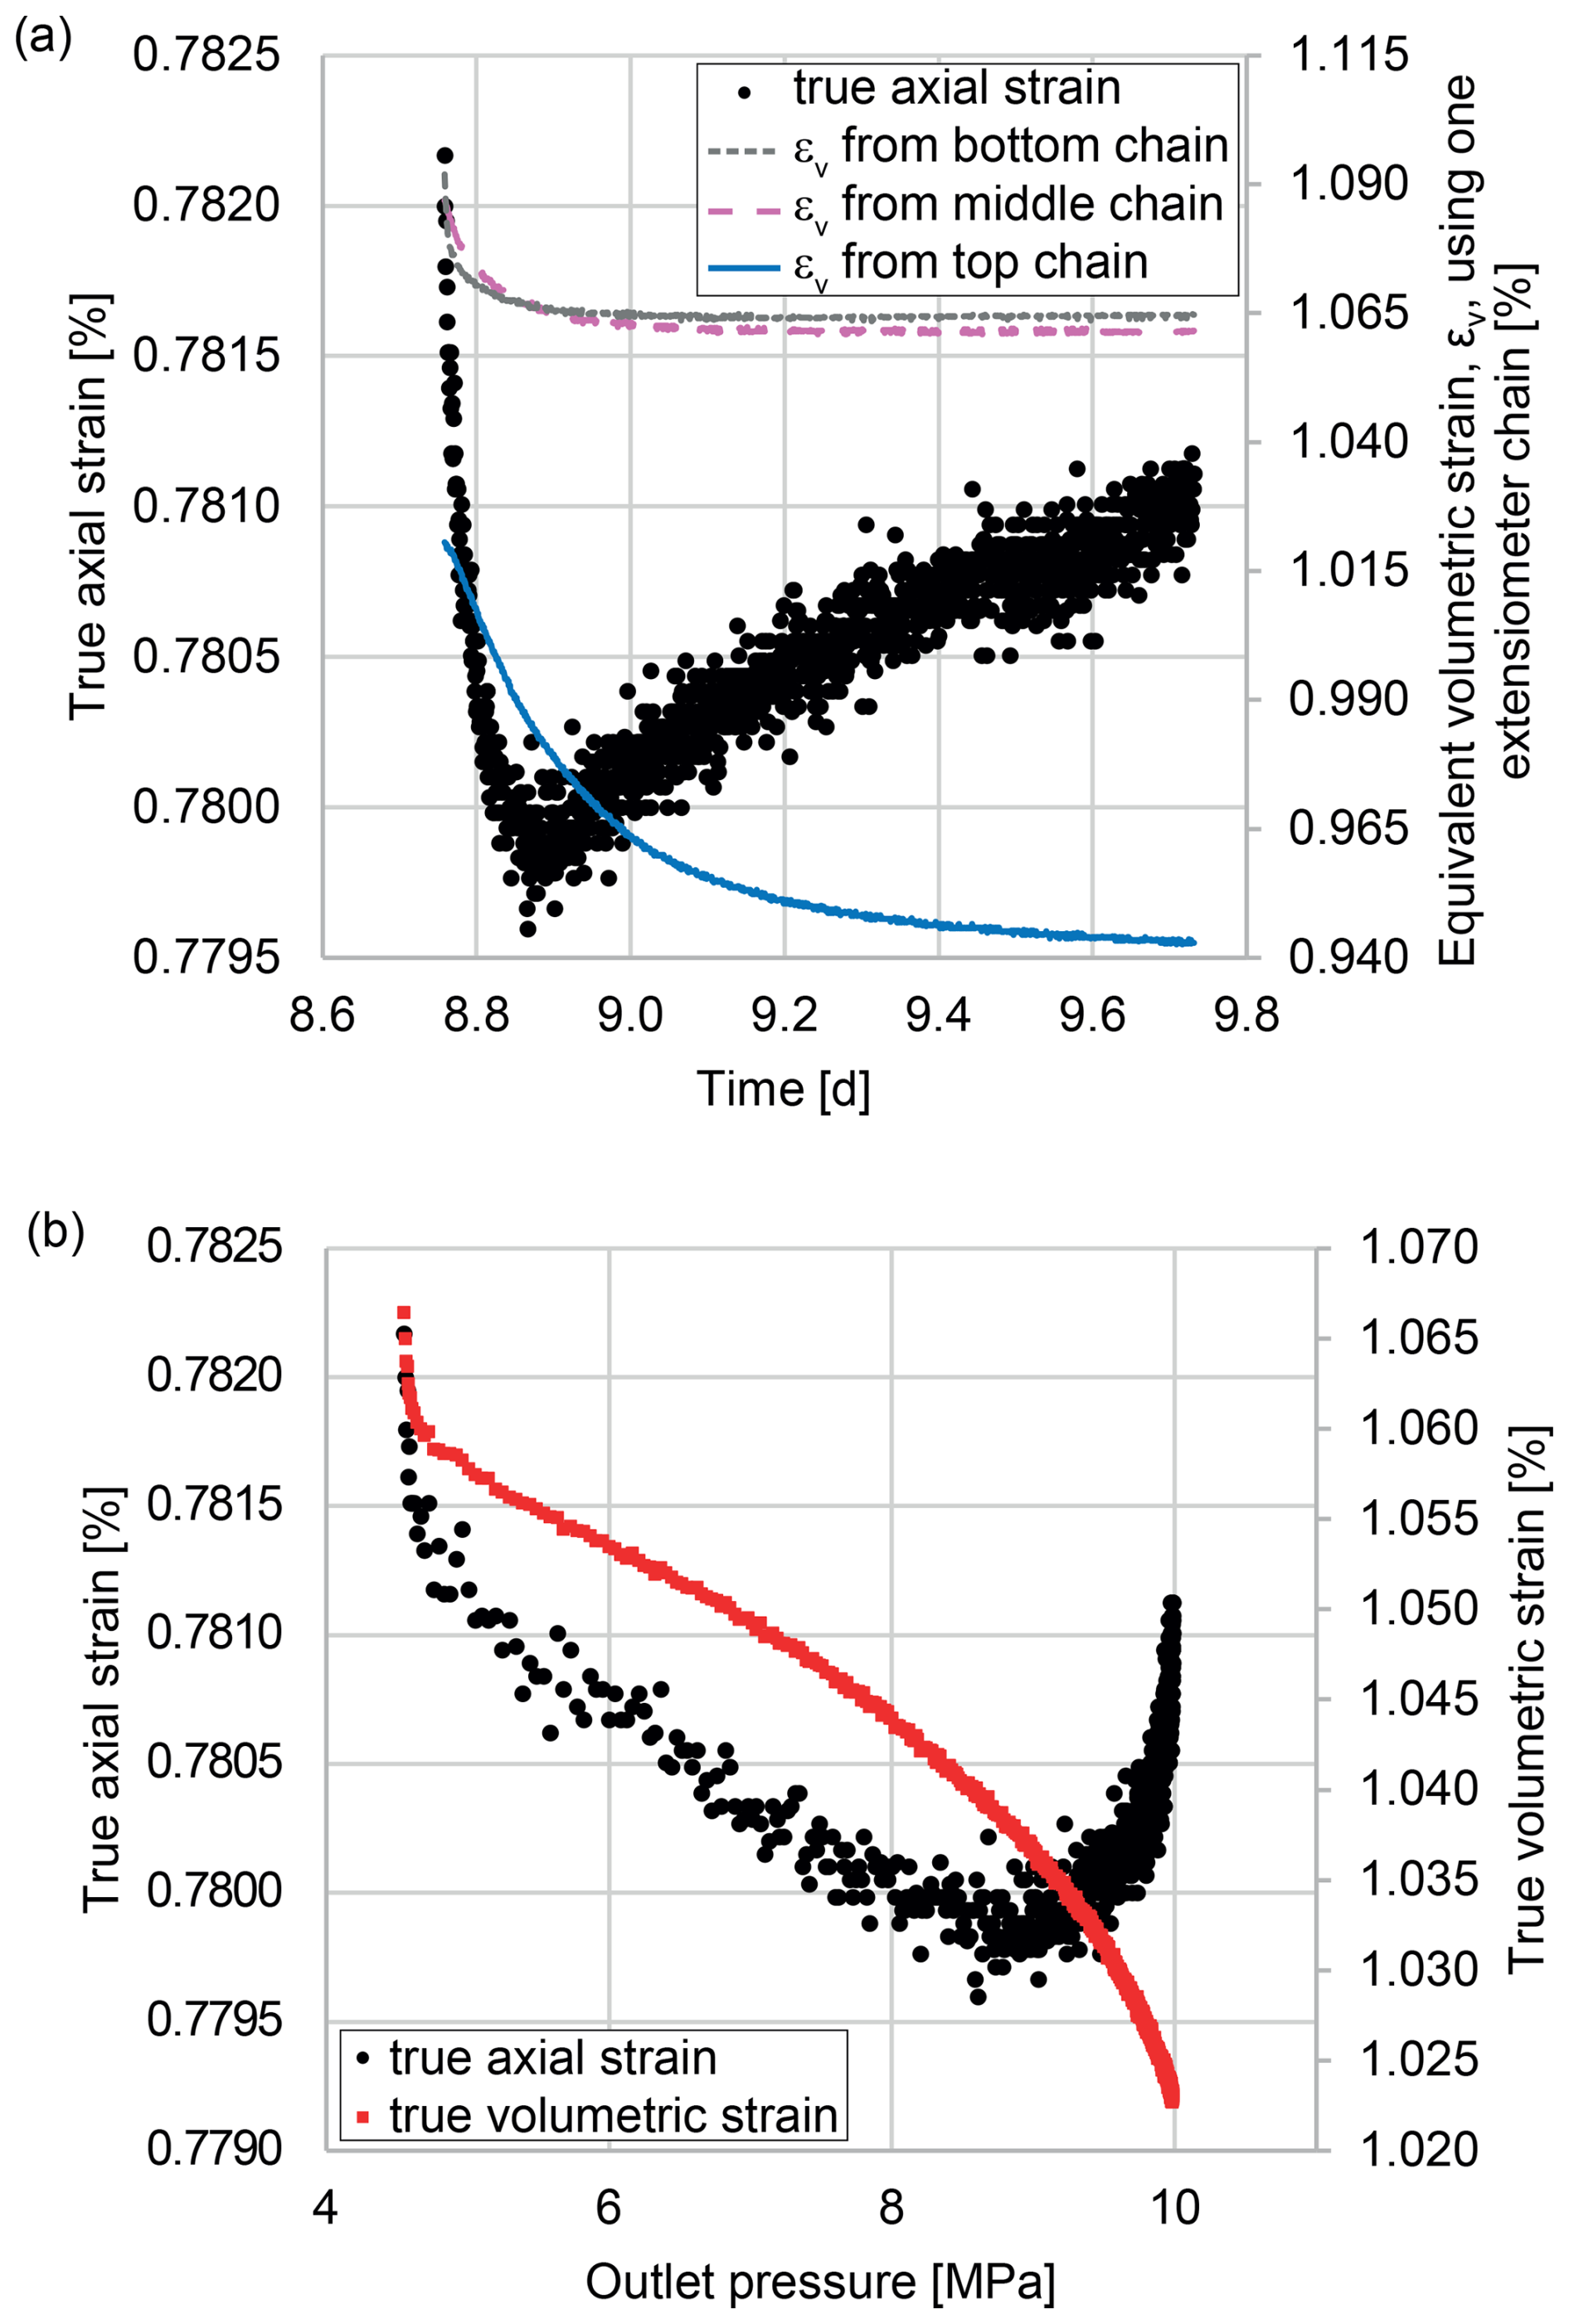
Figure 8 Evolution of true axial strain for Bunter Sandstone. (a) Crack damage stress as seen in the true axial strain during phase 5. (b) Comparison of true axial strain and true volumetric strain evolution. Note the different ranges of the y axes.
6.3 Multiple measurements of crack damage stress
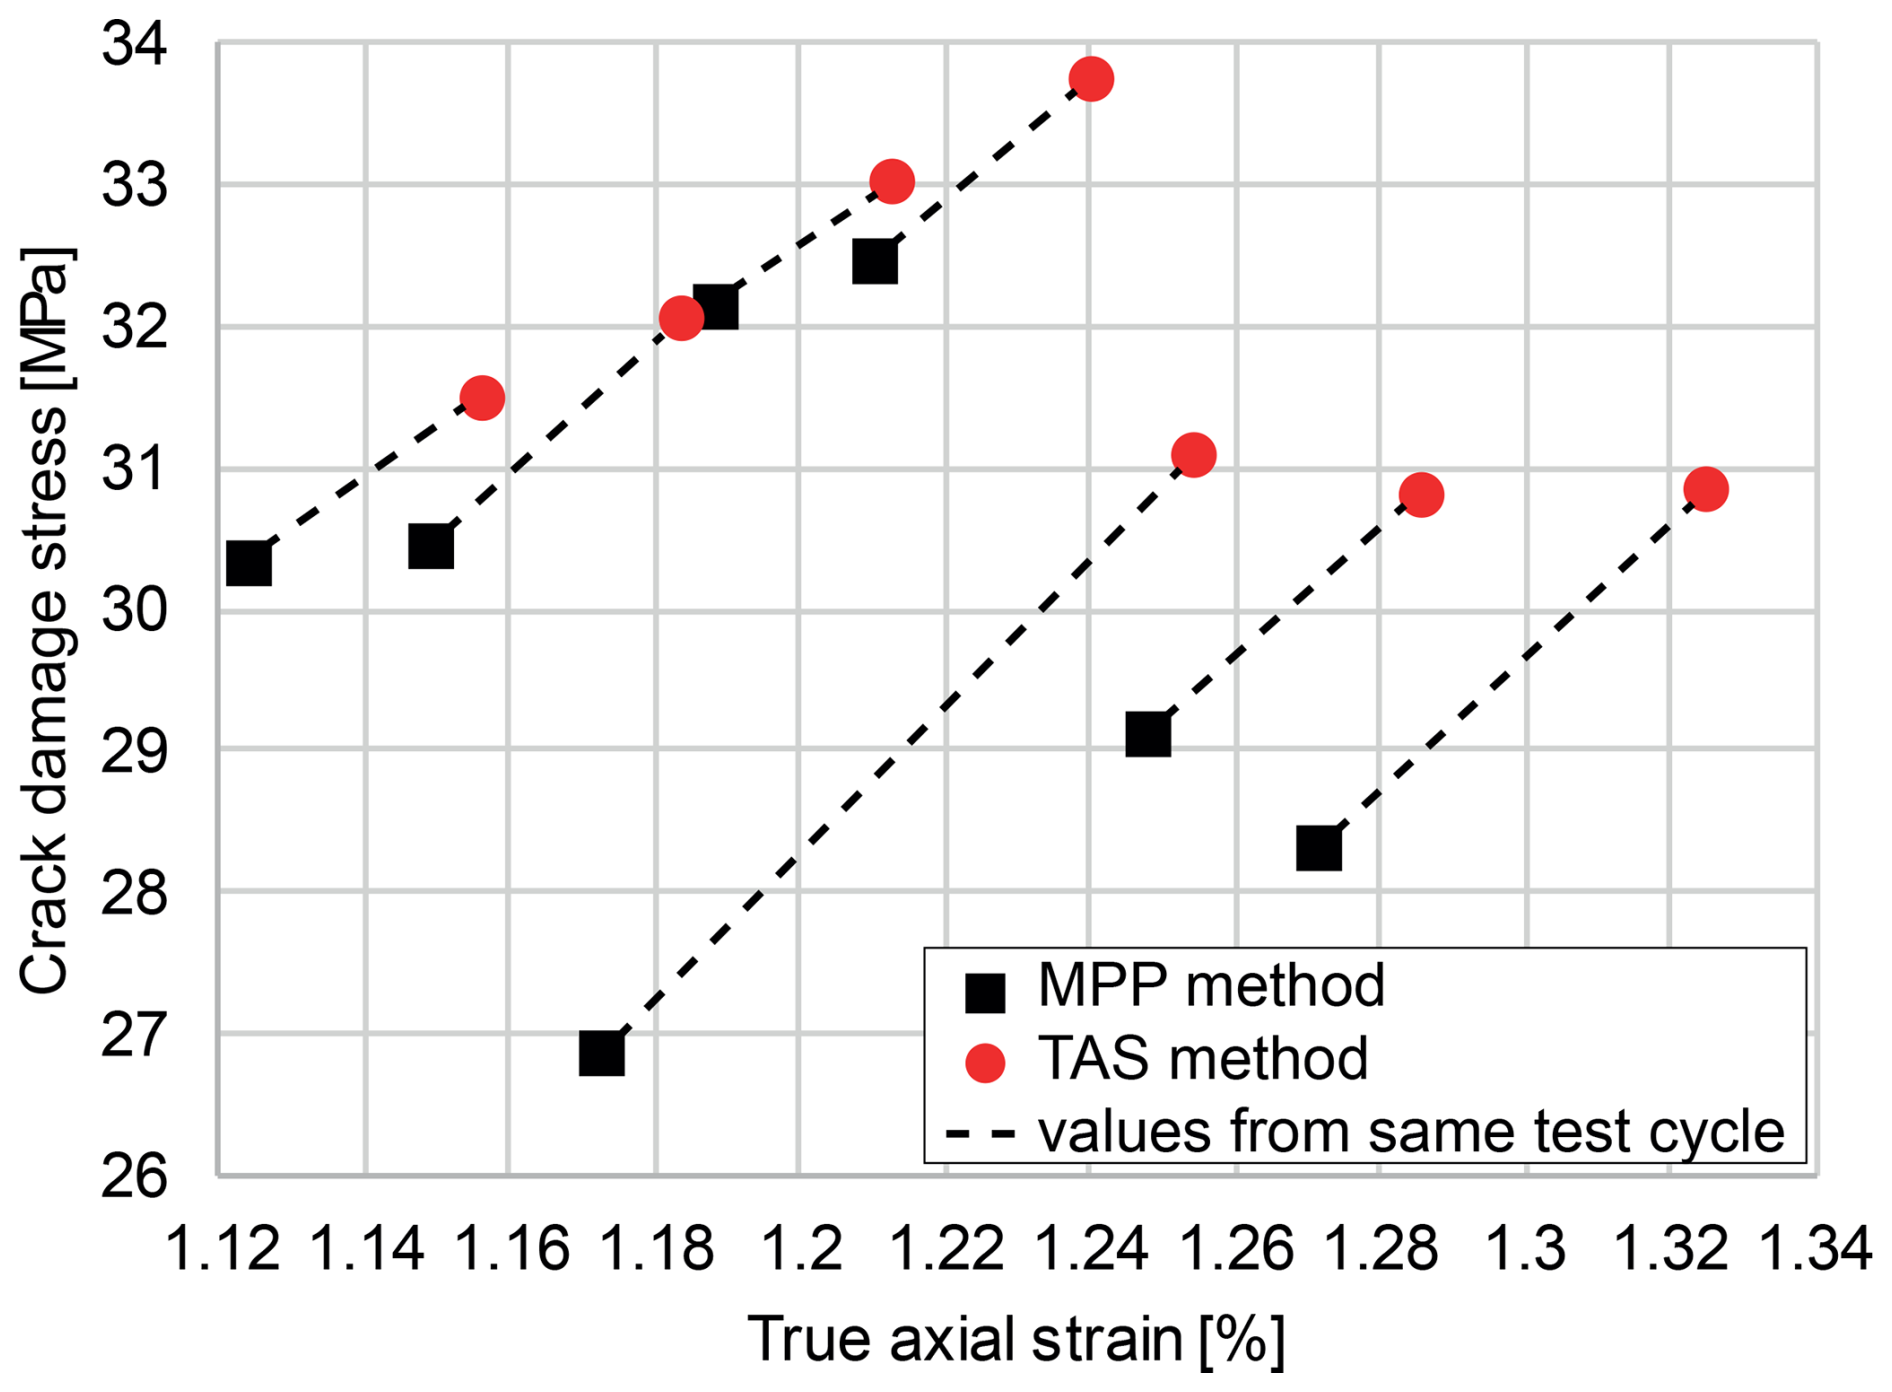
Results from both methods are displayed for comparison in Fig. 9 for several test cycles of Passwang Marl. Values which are derived from the same test cycle are connected by dashed lines. The onsets of dilatancy derived by both methods cannot be identical as the sample undergoes plastic deformation between the measurements of a single test cycle. However, the very similar gradients of the connecting lines indicate that both methods yield consistent results even if a certain amount of plastic deformation occurred between the measurements. Therefore, multiple testing of the same sample with respect to the crack damage stress is possible and produces reliable results. As a consequence, it is advantageous to use measurement techniques – such as the proposed TAS method – which allow multiple measurements in a comparatively short period of time. The stresses depicted for the crack damage stress are the differential stresses (σ1−σ3), which occur at pore pressure maximum (MPP method) or true axial strain minimum (TAS method).
In Fig. 10 the results of both methods are displayed for the Bunter Sandstone sample. The results for the true axial strain (Fig. 10a) as well as for the true volumetric strain (Fig. 10b) are shown as for this sample true volumetric strains were also available. Here, the dashed lines connect the results derived by the MPP method (Fig. 4, phase 1) and the first results from the TAS method (Fig. 4, phase 5a). Subsequent results measured by the TAS method in the same cycle but in different phases (phases 5b and following) are displayed but not connected by dashed lines.
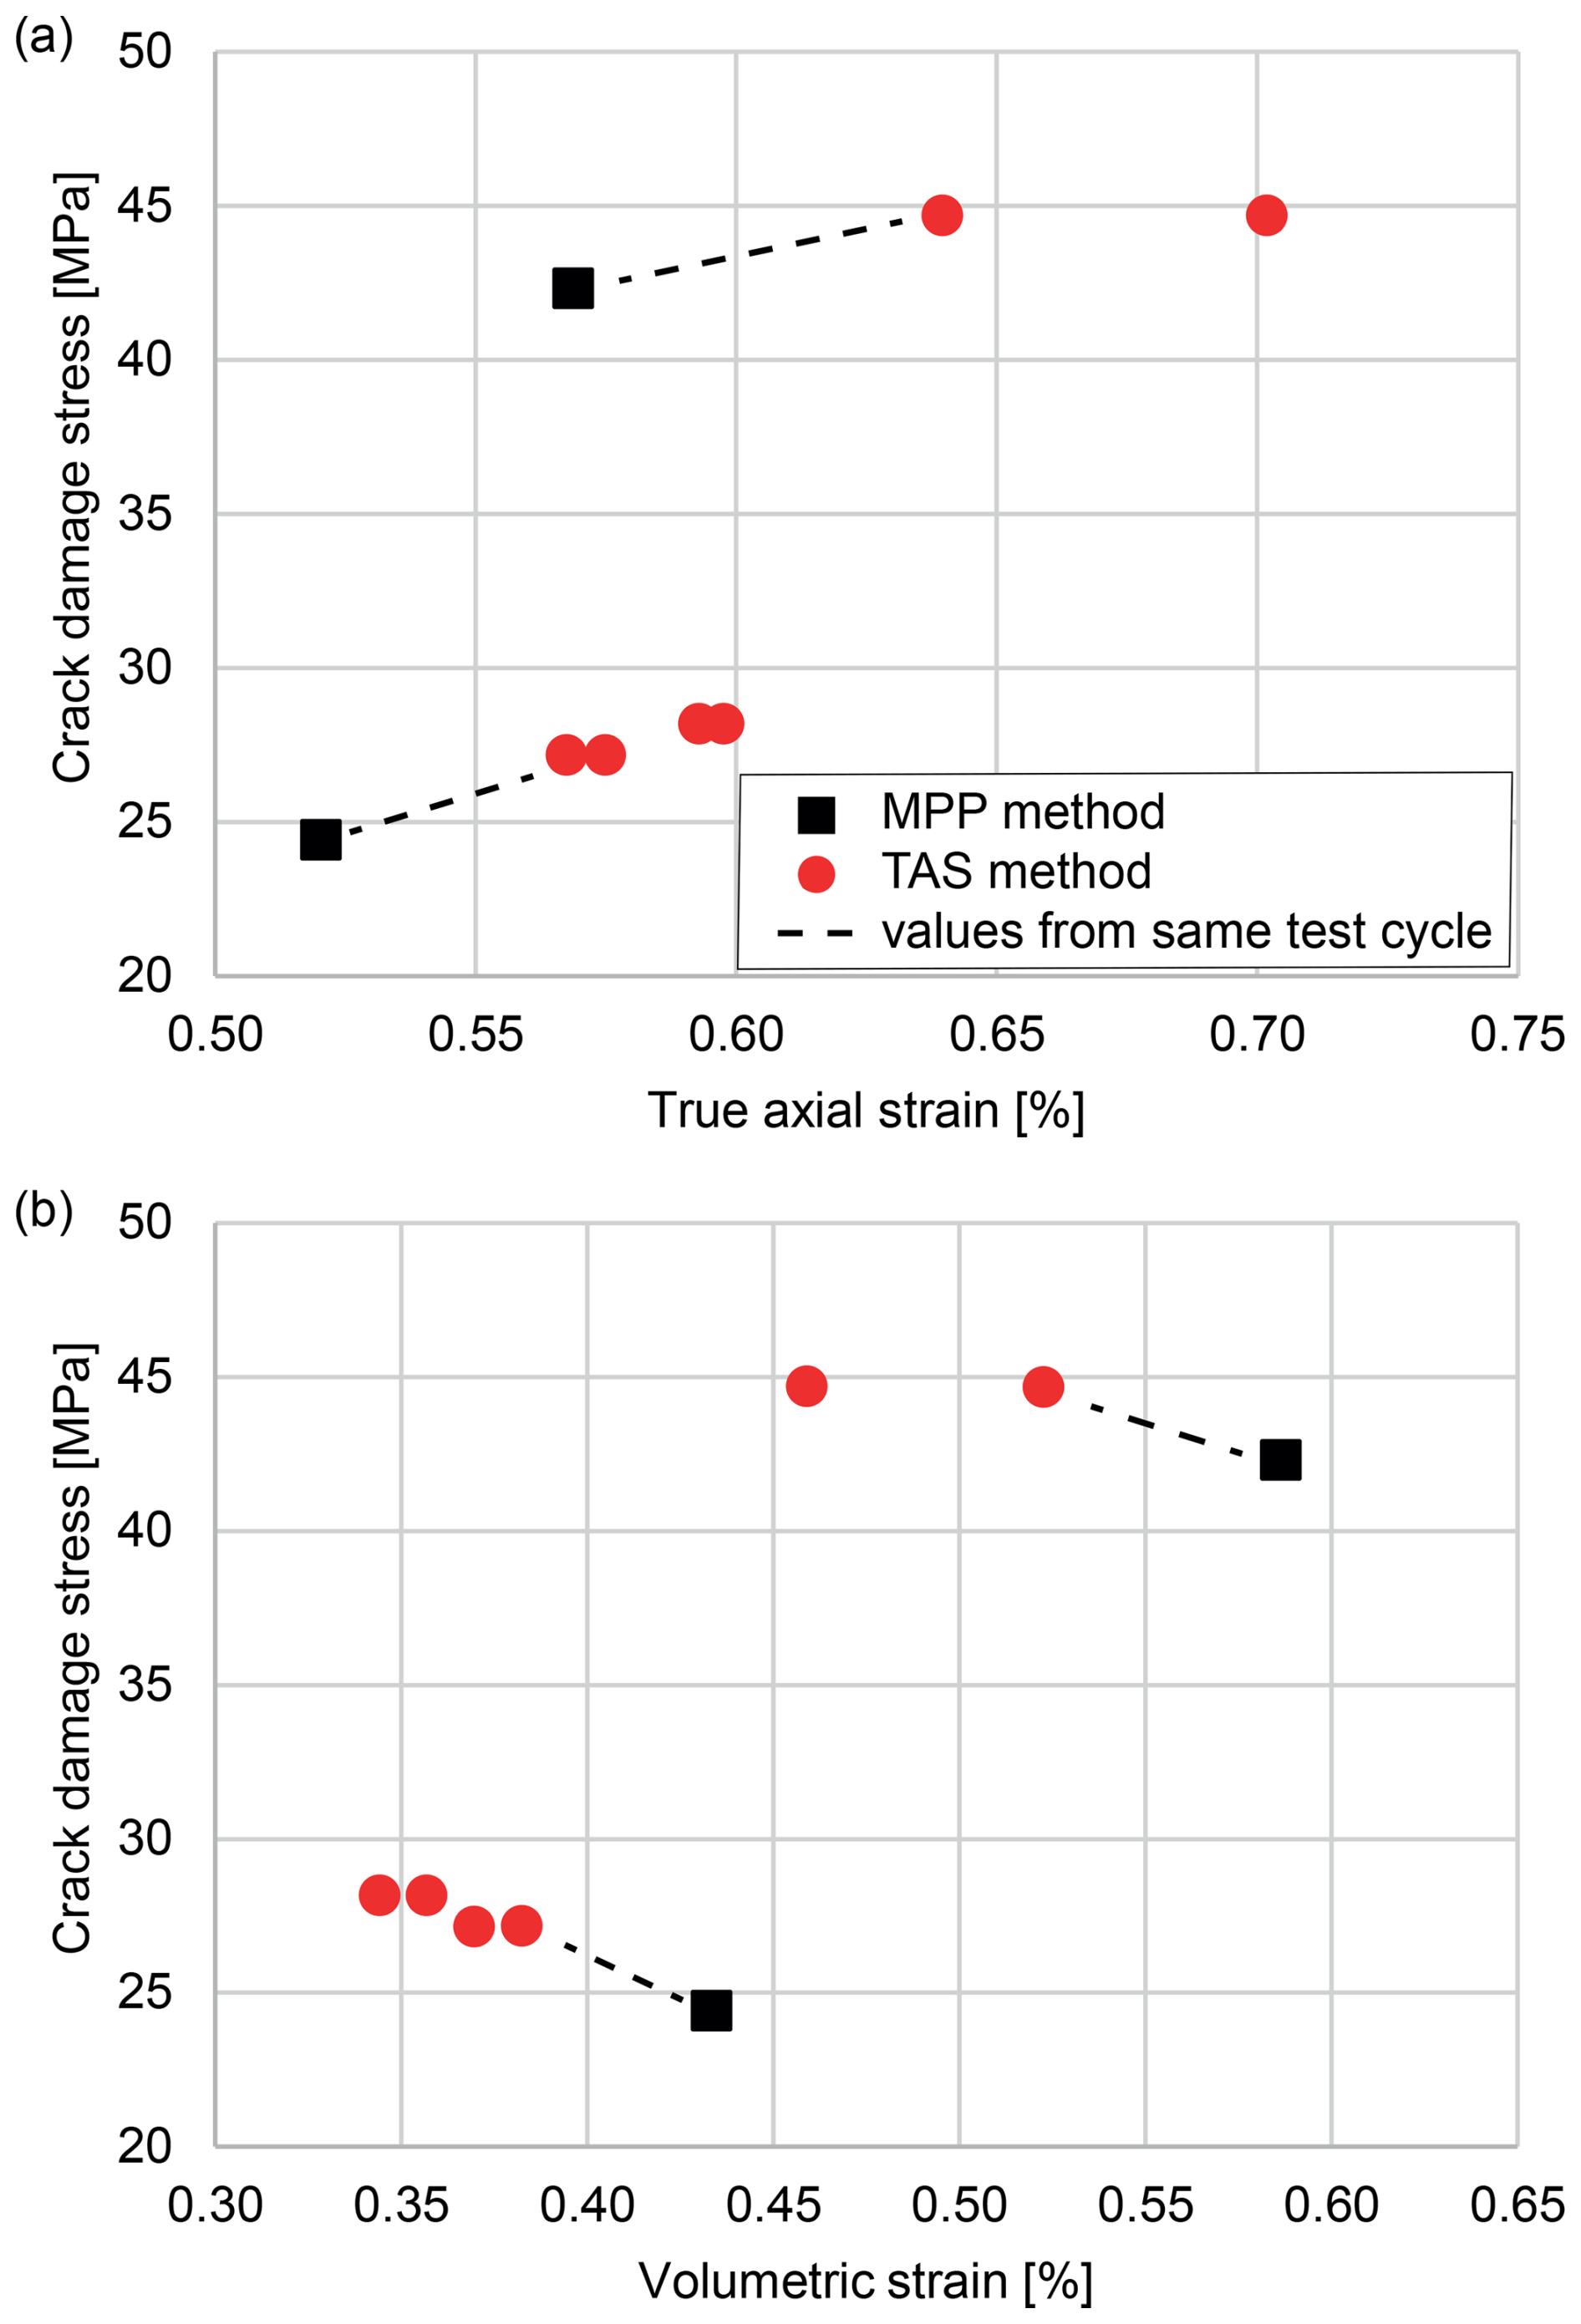
Figure 10Comparison of crack damage stresses detected with both methods for Bunter Sandstone; (a) results with respect to the true axial strain and (b) results with respect to the volumetric strain.
Further proof that both methods yield reliable results and that fast, multiple measurements of the crack damage stress are necessary is shown in Fig. 11 and in a movie in the Supplement. Both demonstrate that crack damage stress does not depend on one parameter but on two – the effective confining stress and the true volumetric strain. If both parameters are considered in such a bilinear fit taking into account the results of both methods, the coefficient of correlation is 0.990 (compared to 0.626 for Fig. 10b), impressively demonstrating that the results of both methods match. However, this bilinear behavior of the crack damage stress necessitates multiple measurements which cover a significant section of the state space to determine the dilatant behavior of the sample in a robust manner.
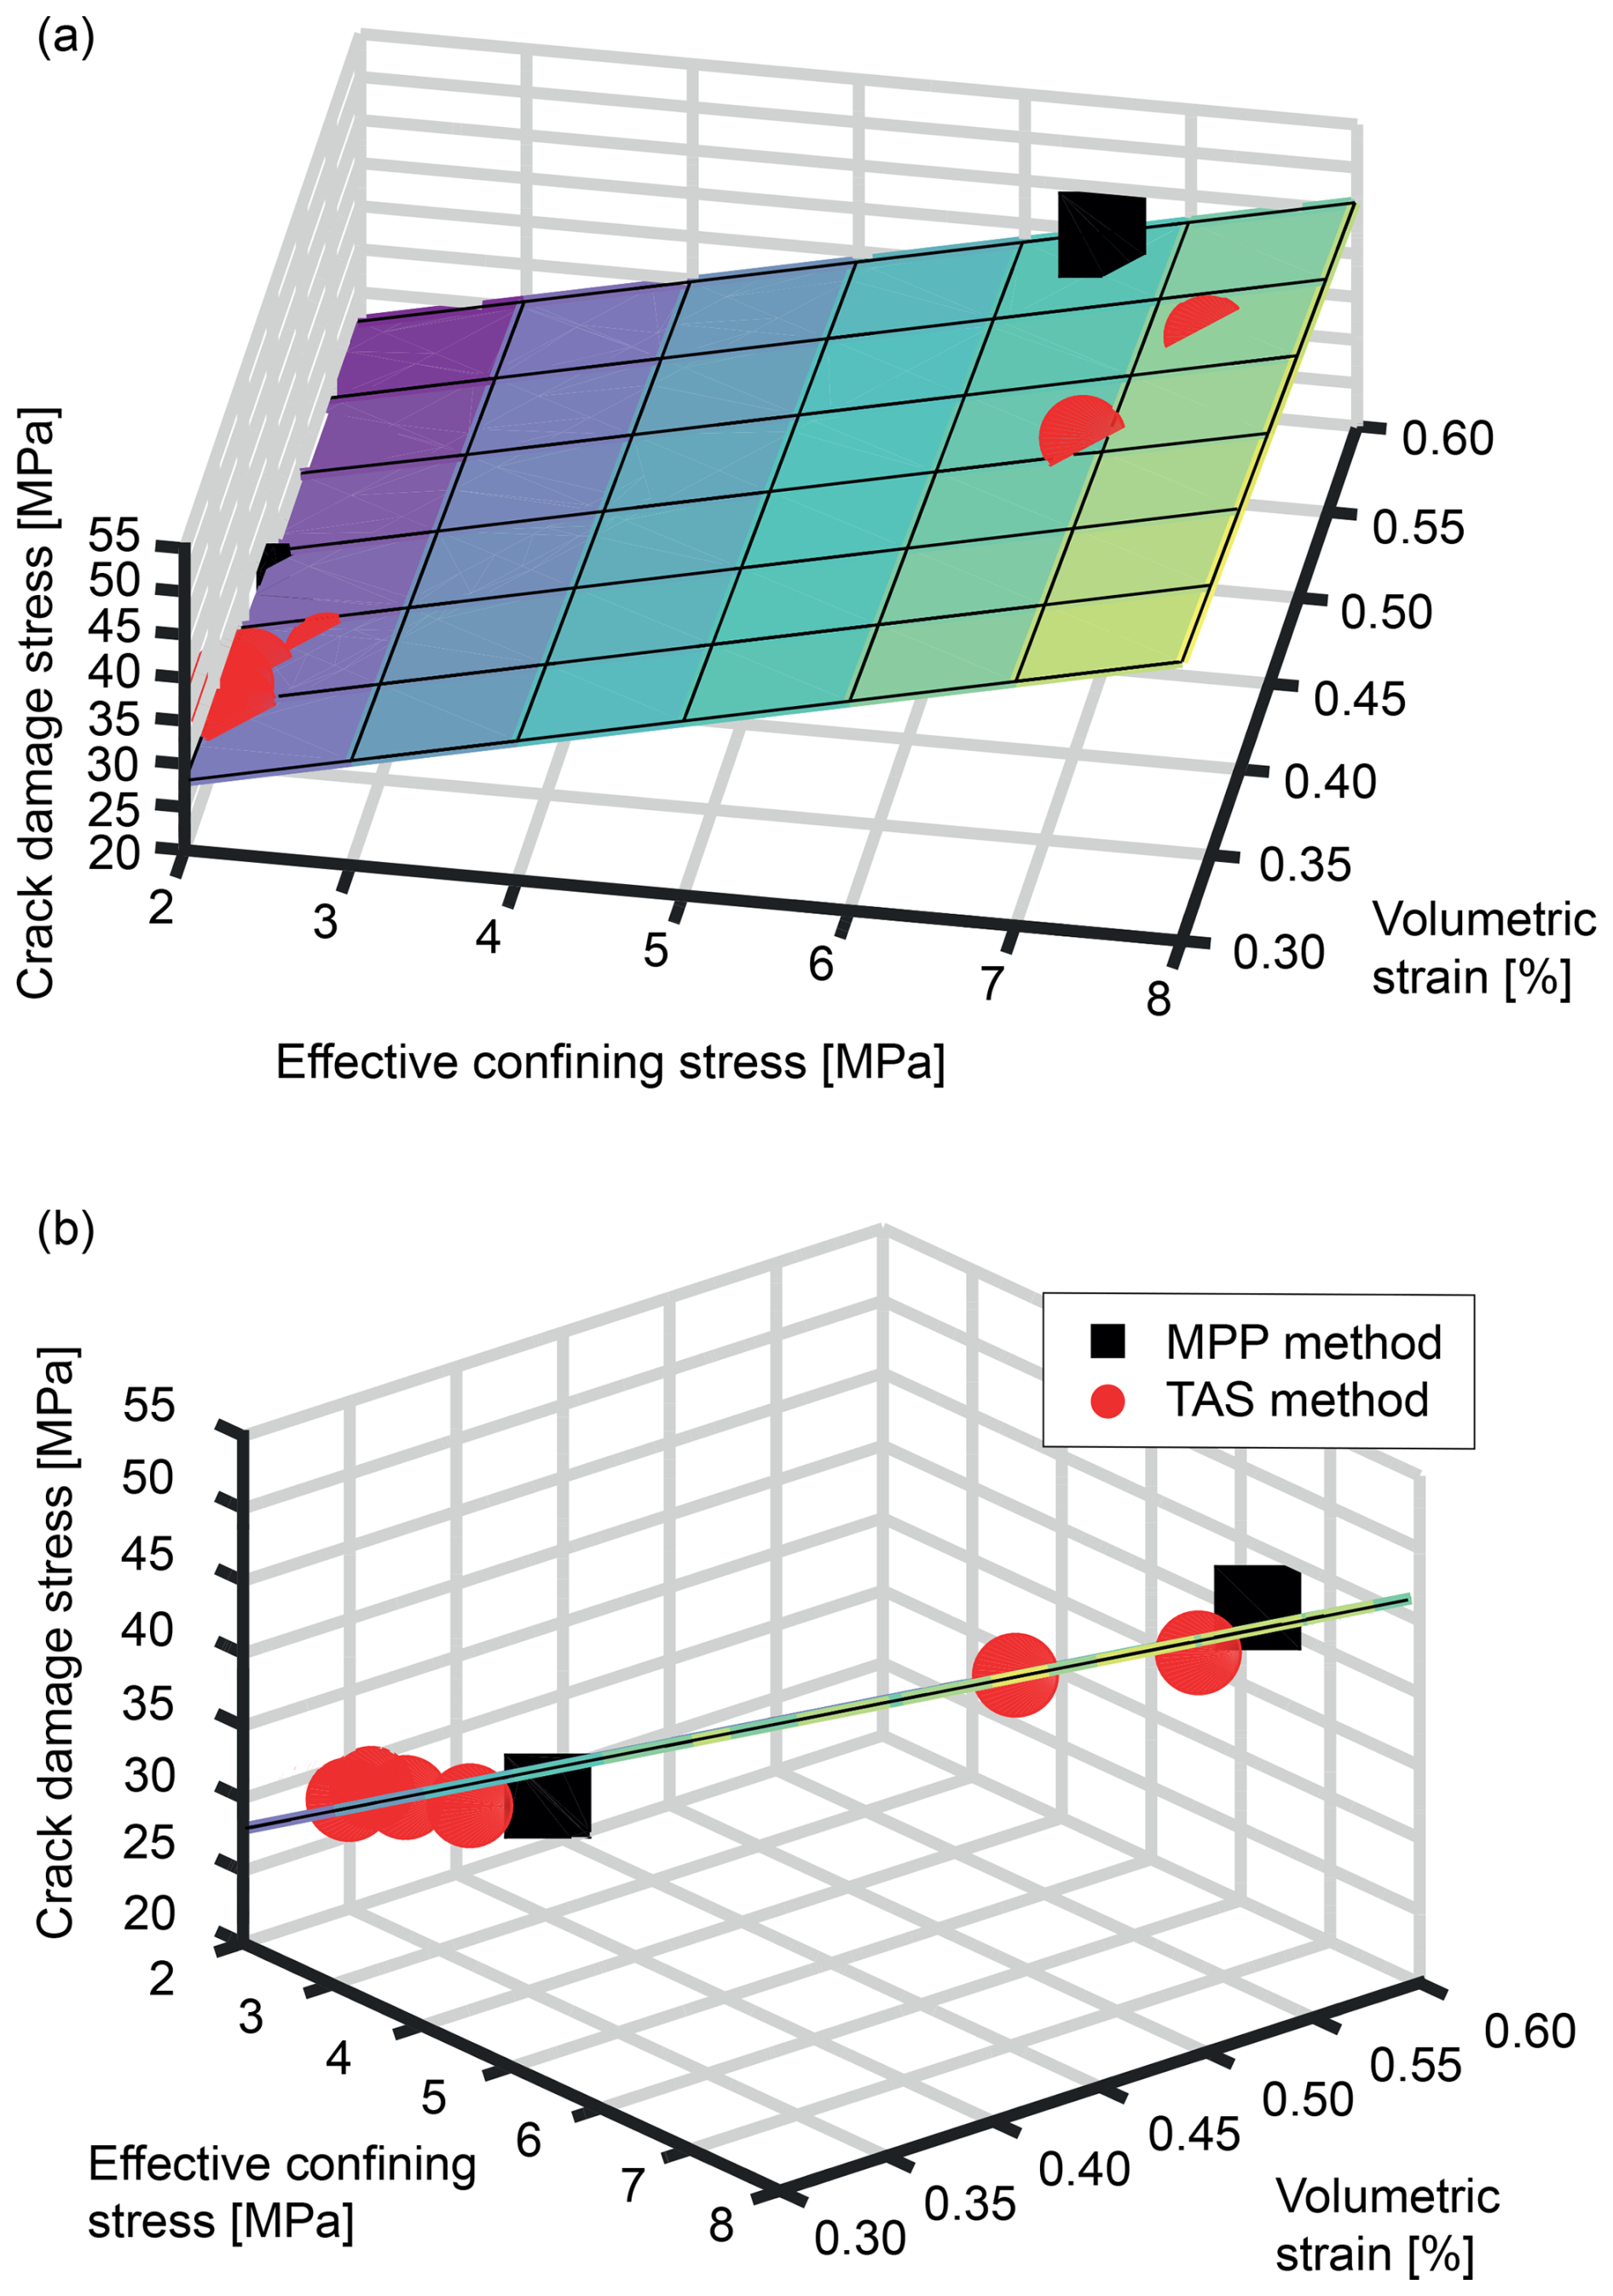
Figure 11Bilinear fits for the dependence of the crack damage stress on effective confining stress and volumetric strain for Bunter Sandstone under two different viewing angles.
6.4 Advantages of the TAS method
The TAS method proposed in this study offers the possibility to achieve more accurate measurements of crack damage stress than before by not only combining two measurement techniques which are completely independent but also by offering the chance to quantify and correct some problems affecting the conventional MPP method. Using two different machine setups to demonstrate the TAS method also shows that it is applicable under varying measurement conditions as the detection of crack damage stress was possible in both experiments. Moreover, the application of the new TAS method yields a maximum of information in a minimum amount of time. Below, we will discuss these points in more detail.
6.4.1 More accurate and faster measurements
The true axial strain is unaffected by changes in room temperature as the relevant components and measuring equipment are located inside the temperature-regulated inner cell of the triaxial testing apparatus. Thus, the signal which is used for detecting crack damage stress is free of influences caused by outside sources. Consequently, crack damage stress can be detected with much greater accuracy than with the MPP method.
Moreover, the detection of crack damage stress by the TAS method is free of any leakage influence. Any leakage can be compensated for by the pressure pump and thus does not influence the results as the pore pressure within the sample is actively regulated during phase 5, in which the detection takes place. Hence, a critical factor which can significantly complicate detecting crack damage stress by the MPP method is not relevant for the new method.
The MPP method is hampered not only by external influences which impede the precise determination of crack damage stress but also by the time lag occurring between the crack damage stress in the center of the sample, where the differential stress due to friction at the front ends is maximal, and its detection at the front ends of the sample. For materials such as the Bunter Sandstone, this time lag in detection may be small, but for materials with lower permeability such as the Passwang Marl used in this study, it can be significant.
The true axial strain does not experience such a time lag and therefore an immediate detection of the crack damage stress is possible. Thus, the TAS methods allows for a more accurate identification of crack damage stress as the uncertainty of the results is much smaller at, e.g., 0.02 MPa compared to 1.2 MPa for the MPP method.
An additional benefit is that as the true axial strain is measured over the entire sample length; thus, the crack damage stress detected by its minimum gives a value which integrates over the entire sample. It therefore avoids the discrepancies between the inlet and outlet pressure signal which may occur for certain samples, e.g., the Bunter Sandstone used in this study.
6.4.2 Gain in information
The TAS method enables not only the determination of the crack damage stress but also of pressure diffusion coefficients, which can be used to calculate permeabilities as they are identical to coefficients of consolation (the difference being the method by which they are determined) (Wang, 1993; Robinson, 1998; Abuel-Naga and Pender, 2012; Di Francesco, 2013). In contrast to the crack damage stress, where only phase 5 yields results, pressure diffusion coefficients can be calculated from the outlet pressure changes in phases 4 and 5. Thus, a full test cycle can provide a plethora of data. The test cycle depicted in Fig. 4 provided four validated values for crack damage stress (phases 1, 3, 5a, and 5b) and four pressure diffusion coefficients (phases 4a to 5b), thereby maximizing the information output for this type of experiment.
6.4.3 Independent verification
The TAS method can provide an independent verification of the results of the MPP method as it is not subjected to unwanted influences on the results such as room temperature changes or leakage. The quality of the results of the MPP method depends on the correct application of correction terms and is thus more susceptible to errors. However, if the results of both methods match as well as in Fig. 9, it can be concluded that the results obtained by the MPP method are reliable and that the applied correction terms are correct. This is especially important for experiments with runtimes in the range of months to years, in which leakages may develop over time. These experiments do not need to be stopped because of the leakage but can be continued and the quality of their results continually verified via the TAS method.
The proposed new experimental procedure which combines two techniques – the well-known MPP method (for CU tests) and the newly developed TAS method (for CD tests) – enables a faster and more accurate detection of crack damage stress in fully saturated samples than before. Both factors are of high relevance for the determination of a constitutive equation for crack damage stress.
Especially with the new TAS method presented in this study, a more precise determination of crack damage stress is possible. For the TAS method, a pressure diffusion test is performed where the pore pressure is increased at high constant axial loads. The crack damage stress is reached when the true axial strain changes its trend from expansion to compaction during the pore pressure increase. Potentially occurring leakages, which, e.g., can hamper the detection of crack damage stress with the MPP method, cannot disturb the measurement as for the TAS method the pore pressure is actively regulated. Thus, the TAS method allows for a more robust determination of crack damage stress than the MPP method.
Additionally, this new technique not only provides information on the crack damage stress but also allows the determination of pore pressure diffusion coefficients and thus permeabilities at the same time.
The proposed new experimental procedure is applicable to all types of fully saturated, permeable rocks as has been successfully demonstrated by applying it to hydraulically tight Passwang Marl as well as permeable Bunter Sandstone.
The data that support the findings of this study are openly available on Zenodo at https://zenodo.org (last access: 30 January 2025) for the Passwang Marl, Z orientation, (https://doi.org/10.5281/zenodo.4063577) (Schumacher and Gräsle, 2020b), and Bunter Sandstone (https://doi.org/10.5281/zenodo.4063823) (Schumacher and Gräsle, 2020a).
An additional supporting video can be found on Zenodo (https://doi.org/10.5281/zenodo.14412332, Schumacher and Gräsle, 2024).
SaS: conceptualization, methodology, formal analysis, investigation, writing (original draft), visualization. WG: conceptualization, formal analysis, writing (review and editing).
The contact author has declared that neither of the authors has any competing interests.
Publisher’s note: Copernicus Publications remains neutral with regard to jurisdictional claims made in the text, published maps, institutional affiliations, or any other geographical representation in this paper. While Copernicus Publications makes every effort to include appropriate place names, the final responsibility lies with the authors.
The authors thank Uwe Brockmann and Sebastian Klösters for operating and maintaining the triaxial testing apparatus.
We also thank Herbert Röhm from the State Authority for Mining, Energy and Geology, Lower Saxony, for providing the Bunter Sandstone sample and Kristian Ufer (BGR) for its mineralogical analysis.
This paper was edited by Lev Eppelbaum and reviewed by Thomas Poulet and one anonymous referee.
Abbas, H. A., Mohamed, Z., and Abdul Kudus, S.: Deformation behaviour, crack initiation and crack damage of weathered composite sandstone-shale by using the ultrasonic wave and the acoustic emission under uniaxial compressive stress, Int. J. Rock Mech. Min., 170, 105497, https://doi.org/10.1016/j.ijrmms.2023.105497, 2023. a
Abuel-Naga, H. M. and Pender, M. J.: Modified Terzaghi consolidation curves with effective stress-dependent coefficient of consolidation, Geotech. Lett., 2, 43–48, https://doi.org/10.1680/geolett.12.00005, 2012. a
Ahmed, T.: Reservoir Engineering Handbook, Gulf Professional Publishing, 5 edn., ISBN 978-0-12-813649-2, 2018. a
Aleinikov, A. L., Belikov, V. T., Eppelbaum, L. V., and Nemzorov, N. I.: Rock Destruction and Dangerous Geodynamic Processes in the Earth: A Review, FRAPS-V1, 141–183, https://doi.org/10.9734/bpi/fraps/v1/9744F, 2023. a
Alkan, H., Cinar, Y., and Pusch, G.: Rock salt dilatancy boundary from combined acoustic emission and triaxial compression tests, Int. J. Rock Mech. Min., 44, 108–119, https://doi.org/10.1016/j.ijrmms.2006.05.003, 2007. a
Allen, M. J., Faulkner, D. R., Worden, R. H., Rice-Birchall, E., Katirtsidis, N., and Utley, J. E.: Geomechanical and petrographic assessment of a CO2 storage site: Application to the Acorn CO2 Storage Site, offshore United Kingdom, Int. J. Greenh. Gas Con., 94, 102923, https://doi.org/10.1016/j.ijggc.2019.102923, 2020. a
Atluri, S. N. (Ed.): Computational Methods in the Mechanics of Fracture, vol. 2, North-Holland, Amsterdam, ISBN 0 444 87955 2, 1986. a
Belmokhtar, M., Delage, P., Ghabezloo, S., Tang, A.-M., Menaceur, H., and Conil, N.: Poroelasticity of the Callovo–Oxfordian Claystone, Rock Mech. Rock Eng., 50, 871–889, https://doi.org/10.1007/s00603-016-1137-3, 2017. a
Bieniawski, Z.: Mechanism of brittle fracture of rock: Part I – theory of the fracture process, Int. J. Rock Mech. Min., 4, 395–406, https://doi.org/10.1016/0148-9062(67)90030-7, 1967. a
Brandon, T. L., Rose, A. T., and Duncan, J. M.: Drained and Undrained Strength Interpretation for Low-Plasticity Silts, J. Geotech. Geoenviron., 132, 250–257, https://doi.org/10.1061/(ASCE)1090-0241(2006)132:2(250), 2006. a, b
Breede, K.: SIP-Messungen an Sandsteinen, Master's thesis, Technische Universität Clausthal, Institut für Geophysik, 2006. a
Burkhalter, R. M.: Die Passwang-Alloformation (unteres Aalénien bis unteres Bajocien) im zentralen und nördlichen Schweizer Jura, Eclogae Geol. Helv., 89, 875–934, 1996. a
Cai, M., Kaiser, P., Tasaka, Y., Maejima, T., Morioka, H., and Minami, M.: Generalized crack initiation and crack damage stress thresholds of brittle rock masses near underground excavations, Int. J. Rock Mech. Min., 41, 833–847, https://doi.org/10.1016/j.ijrmms.2004.02.001, 2004. a
Chang, S.-H. and Lee, C.-I.: Estimation of cracking and damage mechanisms in rock under triaxial compression by moment tensor analysis of acoustic emission, Int. J. Rock Mech. Min., 41, 1069–1086, https://doi.org/10.1016/j.ijrmms.2004.04.006, 2004. a, b
Charlez, P. A.: Rock Mechanics, vol. 1, Édition Technip, Paris, ISBN 9782710805854, 1991. a
Cherepanov, G. P.: Mechanics of Brittle Fracture, McGraw-Hill, New York, ISBN 978-0070107397, 1979. a
Corkum, A. G.: A Model for Pore Pressure Response of a Claystone due to Liberated Residual Stress Dilation, Rock Mech. Rock Eng., 53, 587–600, https://doi.org/10.1007/s00603-019-01938-x, 2020. a
Crisci, E., Giger, S., Laloui, L., Ferrari, A., Ewy, R., Stankovic, R., Stenebråten, J., Halvorsen, K., and Soldal, M.: Insights from an extensive triaxial testing campaign on a shale for comparative site characterization of a deep geological repository, Geomech. Energy Envir., 38, 100508, https://doi.org/10.1016/j.gete.2023.100508, 2024. a
David, C. and Ravalec-Dupin, M. L.: Rock physics and geomechanics in the study of reservoirs and repositories, Geol. Soc., London, Spec. Publ., 284, 1–14, https://doi.org/10.1144/SP284.1, 2007. a
Deutsche Stratigraphische Kommission: Stratigraphic Table of Germany Compact 2022, Potsdam, GFZ German Research Centre for Geosciences, 2 pp., https://doi.org/10.48440/dsk.stgc.2022, 2022. a
Di Francesco, R.: Exact Solution of Terzaghi's Consolidation Equation and Extension to Two/Three-Dimensional Cases, Appl. Math., 4, 713–717, https://doi.org/10.4236/am.2013.44099, 2013. a
European Commission, Directorate-General for Research and Innovation, Rodwell, W., Horseman, S., and Harris, A.: Gas migration and two-phase flow through engineered and geological barriers for a deep repository for radioactive waste – A joint EC/NEA status Report, Publications Office, ISBN 92-828-8132-6, 1999. a
Ewy, R. T., Bovberg, C. A., and Stankovich, R.: Shale triaxial strength alteration due to brine exposure, 42nd US Rock Mechanics Symposium and 2nd USA-Canada Rock Mechanics Symposium, San Francisco, California, June 2008, ARMA 08-304, 2008. a
Favero, V., Ferrari, A., and Laloui, L.: Anisotropic Behaviour of Opalinus Clay Through Consolidated and Drained Triaxial Testing in Saturated Conditions, Rock. Mech. Rock. Eng., 51, 1305–1319, https://doi.org/10.1007/s00603-017-1398-5, 2018. a
Fossen, H.: Structural Geology, Cambridge University Press, Cambridge, https://doi.org/10.1017/CBO9780511777806, 2010. a
Gao, Y., Feng, X.-T., Zhang, X., Zhou, Y., and Zhang, Y.: Generalized crack damage stress thresholds of hard rocks under true triaxial compression, Acta Geotech., 15, 565–580, https://doi.org/10.1007/s11440-019-00900-z, 2020. a
Giger, S. B., Ewy, R. T., Favero, V., Stankovic, R., and Keller, L. M.: Consolidated-undrained triaxial testing of Opalinus Clay: Results and method validation, Geomech. Energy Environ., 14, 16–28, https://doi.org/10.1016/j.gete.2018.01.003, 2018. a
Girardi, V., Ceccato, F., Rohe, A., Simonini, P., and Gabrieli, F.: Failure of levees induced by toe uplift: Investigation of post-failure behavior using material point method, J. Rock Mech. Geotech. Eng., 15, 970–983, https://doi.org/10.1016/j.jrmge.2022.07.015, 2023. a
Griffith, A. A. and Taylor, G. I.: VI. The phenomena of rupture and flow in solids, Philos. T. R. Soc. Lond., 221, 163–198, https://doi.org/10.1098/rsta.1921.0006, 1921. a
Gutierrez, M., Katsuki, D., and Tutuncu, A.: Determination of the continuous stress-dependent permeability, compressibility and poroelasticity of shale, Mar. Petrol. Geol., 68, 614–628, https://doi.org/10.1016/j.marpetgeo.2014.12.002, 2015. a
Gygax, E., Schefer, S., and Jaeggi, D.: PE Experiment: Drillcore documentation of prospection boreholes BPE-1, BPE-2 and BPE-3, including an adapted geological map of the Mont Terri rock laboratory, Tech. rep., Federal Office of Topography (Swisstopo), Wabern, Switzerland, Mont Terri Technical Note TN 2017-52, 2017. a
Heap, M. J. and Wadsworth, F. B.: Closing an open system: Pore pressure changes in permeable edifice rock at high strain rates, J. Volcanol. Geoth. Res., 315, 40–50, https://doi.org/10.1016/j.jvolgeores.2016.02.011, 2016. a, b
Heunisch, C., Caspers, G., Elbracht, J., Langer, A., Röhling, H.-G., Schwarz, C., and Streif, H.: Erdgeschichte von Niedersachsen, Geologie und Landschaftsentwicklung, GeoBerichte 6, Landesamt für Bergbau, Energie und Geologie, ISSN 1864-7529, 2017. a
Hostettler, B., Reisdorf, A. G., Jaeggi, D., Deplazes, G., Bläsi, H., Morard, A., Feist-Burkhardt, S., Waltschew, A., Dietze, V., and Menkveld-Gfeller, U.: Litho- and biostratigraphy of the Opalinus Clay and bounding formations in the Mont Terri rock laboratory (Switzerland), Swiss J. Geosci., 110, 23–37, https://doi.org/10.1007/s00015-016-0250-3, 2017. a, b
Jaeger, J. C. and Cook, N. G. W.: Fundamentals of Rock Mechanics, Halsted Press, New York, 3 edn., ISBN 9780470268049, 1979. a
Khaledi, K., Winhausen, L., Jalali, M., and Amann, F.: Constitutive modeling of clay shales in undrained conditions and its experimental verification for Opalinus Clay, Int. J. Rock Mech. Min. Sci., 171, 105588, https://doi.org/10.1016/j.ijrmms.2023.105588, 2023. a
Kong, R., Feng, X.-T., Zhang, X., and Yang, C.: Study on crack initiation and damage stress in sandstone under true triaxial compression, Int. J. Rock Mech. Min. Sci., 106, 117–123, https://doi.org/10.1016/j.ijrmms.2018.04.019, 2018. a
Landau, L. D. and Lifshitz, E. M.: Mechanics, Butterworth-Heinemann, 3 edn., ISBN 0-7506-2896-0, 1976. a
Li, H., Liu, L., Fu, S., Liu, B., and Li, X.: Rate-dependent strength and crack damage thresholds of rocks at intermediate strain rate, Int. J Rock. Mech. Min., 171, 105590, https://doi.org/10.1016/j.ijrmms.2023.105590, 2023. a
Martin, C. and Chandler, N.: The progressive fracture of Lac du Bonnet granite, Int. J. Rock Mech. Min., 31, 643–659, https://doi.org/10.1016/0148-9062(94)90005-1, 1994. a, b
Martin, C., Christiansson, R., and Soederhaell, J.: Rock stability considerations for siting and constructing a KBS-3 repository Based on experiences from Aespoe HRL, AECL's URL, tunnelling and mining, Tech. Rep. 1404-0344, SKB-TR–01-38, ISSN 1404-0344, 2001. a
Martin, C. D.: Seventeenth Canadian Geotechnical Colloquium: The effect of cohesion loss and stress path on brittle rock strength, Can. Geotech. J., 34, 698–725, https://doi.org/10.1139/t97-030, 1997. a, b
Medici, G., Ling, F., and Shang, J.: Review of discrete fracture network characterization for geothermal energy extraction, Front. Earth. Sci., 11, 1–17, https://doi.org/10.3389/feart.2023.1328397, 2023. a
Mesri, G., Adachi, G., and Ullrich, C. R.: Pore-pressure response in rock to undrained change in all-round stress, Géotechnique, 26, 317–330, https://doi.org/10.1680/geot.1976.26.2.317, 1976. a
Minardi, A., Giger, S. B., Ewy, R. T., Stankovic, R., Stenebråten, J., Soldal, M., Rosone, M., Ferrari, A., and Laloui, L.: Benchmark study of undrained triaxial testing of Opalinus Clay shale: Results and implications for robust testing, Geomech. Energy. Environ., 25, 100210, https://doi.org/10.1016/j.gete.2020.100210, 2020. a
Mo, Z., Qian, L., Yao, T., Gao, Y., Zhang, J., Zhang, R., Liu, E., and Jiang, H.: Stress Threshold Determination Method and Damage Evolution Modelling Based on Micritic Bioclastic Limestone, Rock Mech. Rock Eng., 57, 45–60, https://doi.org/10.1007/s00603-023-03524-8, 2024. a
Naumann, M., Hunsche, U., and Schulze, O.: Experimental investigations on anisotropy in dilatancy, failure and creep of Opalinus Clay, Phys. Chem. Earth, 32, 889–895, https://doi.org/10.1016/j.pce.2005.04.006, 2007. a
Olsen, H.: The architecture of a sandy braided-meandering river system: an example from the lower Triassic Solling Formation (M. Buntsandstein) in W-Germany, Geol. Rundsch., 77, 797–814, https://doi.org/10.1007/BF01830186, 1988. a
Palchik, V. and Hatzor, Y.: Crack damage stress as a composite function of porosity and elastic matrix stiffness in dolomites and limestones, Eng. Geol., 63, 233–245, https://doi.org/10.1016/S0013-7952(01)00084-9, 2002. a, b
Parton, V. Z.: Fracture Mechanics: From Theory to Practice, CRC Press, ISBN 9782881247804, 1992. a
Pearson, F.: PC experiment: recipe for artificial pore water, Mont Terri Technical Note 2002-17, Switzerland Federal Office of Topography (swisstopo), Wabern, Switzerland, 2002. a
Robinson, R. G.: Effect of Clay Mineralogy on Coefficient of Consolidation, Clay. Clay Miner., 46, 596–600, https://doi.org/10.1346/CCMN.1998.0460514, 1998. a
Schumacher, S. and Gräsle, W.: Triaxial test of Bunter Sandstone, Zenodo [data set], https://doi.org/10.5281/zenodo.4063823, 2020a. a
Schumacher, S. and Gräsle, W.: Long-term triaxial test of Passwang Marl, Z-orientation, Zenodo [data set], https://doi.org/10.5281/zenodo.4063577, 2020b. a
Schumacher, S. and Gräsle, W.: Crack damage stress of Bunter Sandstone sample, Zenodo [video], https://doi.org/10.5281/zenodo.14412332, 2024. a
Taheri, A., Zhang, Y., and Munoz, H.: Performance of rock crack stress thresholds determination criteria and investigating strength and confining pressure effects, Constr. Build. Mater., 243, 118263, https://doi.org/10.1016/j.conbuildmat.2020.118263, 2020. a, b, c
van Damme, M.: Detachment of dilatant soil due to high hydraulic shear stresses explained, J. Hydraul. Res., 59, 51–60, https://doi.org/10.1080/00221686.2020.1714758, 2021. a
Waber, H. N. and Rufer, D.: Porewater Geochemistry, Method Comparison and Opalinus Clay-Passwang Formation Interface Study at the Mont Terri URL, Mont Terri Project, TR 2017-02, Rock-Water Interaction, Institute of Geological Sciences University of Bern, Switzerland, 2017. a, b
Wang, H. F.: Quasi-static poroelastic parameters in rock and their geophysical applications, Pure Appl. Geophys., 141, 269–286, https://doi.org/10.1007/BF00998332, 1993. a
Wen, D., Wang, X., Ding, H., and Fu, Z.: Estimation of Crack Initiation Stress Based on Axial Crack Strain Expansion Rate, Rock Mech. Rock Eng., 56, 1025–1041, https://doi.org/10.1007/s00603-022-03113-1, 2023. a
Wild, K., Amann, F., Martin, D., Wassermann, J., David, C., and Barla, M.: Dilatancy of clay shales and its impact on pore pressure evolution and effective stress for different triaxial stress paths, 49th US Rock Mechanics/Geomechanics Symposium, San Francisco, California, June 2015, ARMA 15-0496, 2015. a
Wild, K. M. and Amann, F.: Experimental study of the hydro-mechanical response of Opalinus Clay – Part 1: Pore pressure response and effective geomechanical properties under consideration of confinement and anisotropy, Eng. Geol., 237, 32–41, https://doi.org/10.1016/j.enggeo.2018.02.012, 2018. a
Williams, J. D. O., Holloway, S., and Williams, G. A.: Pressure constraints on the CO2 storage capacity of the saline water-bearing parts of the Bunter Sandstone Formation in the UK Southern North Sea, Petrol. Geosci., 20, 155–167, https://doi.org/10.1144/petgeo2013-019, 2014. a
Wissa, A. E. Z.: Pore Pressure Measurement in Saturated Stiff Soils, J. Soil Mech. Found. Div., 95, 1063–1074, 1969. a
Wu, C., Gong, F., and Luo, Y.: A new quantitative method to identify the crack damage stress of rock using AE detection parameters, B. Eng. Geol. Environ., 80, 519–531, https://doi.org/10.1007/s10064-020-01932-6, 2021. a
Wu, J., Feng, M., Yu, B., Zhang, W., Ni, X., and Han, G.: Experimental investigation on dilatancy behavior of water-saturated sandstone, Int. J. Min. Sci. Technol., 28, 323–329, https://doi.org/10.1016/j.ijmst.2017.09.003, 2018. a, b, c
Xiao, Y., Qiao, Y., He, M., and Li, A.: Strain Rate Effect of Siltstone Under Triaxial Compression and Its Interpretation from Damage Mechanics, Rock Mech. Rock Eng., 56, 8643–8656, https://doi.org/10.1007/s00603-023-03528-4, 2023. a
Xue, L., Qin, S., Sun, Q., Wang, Y., Lee, L. M., and Li, W.: A Study on Crack Damage Stress Thresholds of Different Rock Types Based on Uniaxial Compression Tests, Rock Mech. Rock Eng., 47, 1183–1195, https://doi.org/10.1007/s00603-013-0479-3, 2014. a, b
Yoshinaka, R., Tran, T., and Osada, M.: Pore pressure changes and strength mobilization of soft rocks in consolidated-undrained cyclic loading triaxial tests, Int. J. Rock Mech. Min., 34, 715–726, https://doi.org/10.1016/S1365-1609(97)00006-5, 1997. a, b
Zhang, C.-L.: Thermo-hydro-mechanical behavior of clay rock for deep geological disposal of high-level radioactive waste, J. Rock Mech. Geotech. Eng., 10, 992–1008, https://doi.org/10.1016/j.jrmge.2018.03.006, 2018. a
Zhang, W., Wang, D., Wang, Z., Guo, T., Wang, C., He, J., Zhang, L., Zheng, P., and Qu, Z.: Study on permeability evolution and damage mechanism along the EGS fracture in heat mining stage under thermal stress/cracking, Geotherm. Energy, 11, 31, https://doi.org/10.1186/s40517-023-00274-2, 2023a. a
Zhang, Z., Liang, Z., Tang, C., and Kishida, K.: A Comparative Study of Current Methods for Determining Stress Thresholds of Rock Subjected to Compression, Rock Mech. Rock Eng., 56, 7795–7818, https://doi.org/10.1007/s00603-023-03480-3, 2023b. a, b, c, d
Zhao, H., Liu, C., and Huang, G.: Dilatancy behaviour and permeability evolution of sandstone subjected to initial confining pressures and unloading rates, R. Soc. Open Sci., 8, 201792, https://doi.org/10.1098/rsos.201792, 2021. a
Zhou, X., Zeng, Z., and Liu, H.: Laboratory Testing On Pierre Shale For CO2 Sequestration Under Clayey Caprock, 44th U.S. Rock Mechanics Symposium and 5th U.S.-Canada Rock Mechanics Symposium, Salt Lake City, Utah, June 2010, ARMA–10–107, 2010. a
Zimmerman, R. W.: Compressibility of sandstones, 29: Developments in petroleum science, Elsevier, Amsterdam, v. II, 173 pp., ISBN 0-444-88325-8, 1991. a
Zoback, M. D.: Reservoir Geomechanics, Cambridge University Press, ISBN 978-0-521-14619-7, https://doi.org/10.1017/CBO9780511586477, 2007. a