the Creative Commons Attribution 4.0 License.
the Creative Commons Attribution 4.0 License.
 | 28 Jul 2025
Application of non-contact infrared monitoring technology in marine controlled-source electromagnetic transmission systems
Chentao Wang
Ming Deng
Zhibin Ren
Meng Wang
In recent years, marine controlled-source electromagnetic (MCSEM) systems have become increasingly crucial for offshore resource exploration. However, the high-power operation of these systems poses significant safety challenges, mainly stemming from undetectable thermal anomalies. This study introduces a novel integration of non-contact infrared thermal imaging technology into MCSEM transmission systems, superseding conventional contact-point temperature measurement methods with comprehensive, real-time surface thermal monitoring. The proposed system effectively resolves several critical issues specific to MCSEM operations, particularly electromagnetic interference (EMI) resilience, high-temperature operational stability, and data transmission bandwidth limitations. Our hardware–software co-design methodology achieves dual optimization of measurement efficiency and operational safety. Hardware advancements incorporate Gigabit Ethernet for enhanced data throughput, EMI-resistant circuitry for improved signal integrity, and motorized zoom lenses for adaptive infrared imaging capabilities. Concurrently, our software architecture facilitates real-time thermal visualization, robust offline data storage, and intelligent region-of-interest temperature alert mechanisms. This research establishes a new operational paradigm for MCSEM monitoring systems, significantly enhancing safety protocols and enabling proactive risk management in high-power offshore applications.
- Article
(8670 KB) - Full-text XML
- BibTeX
- EndNote


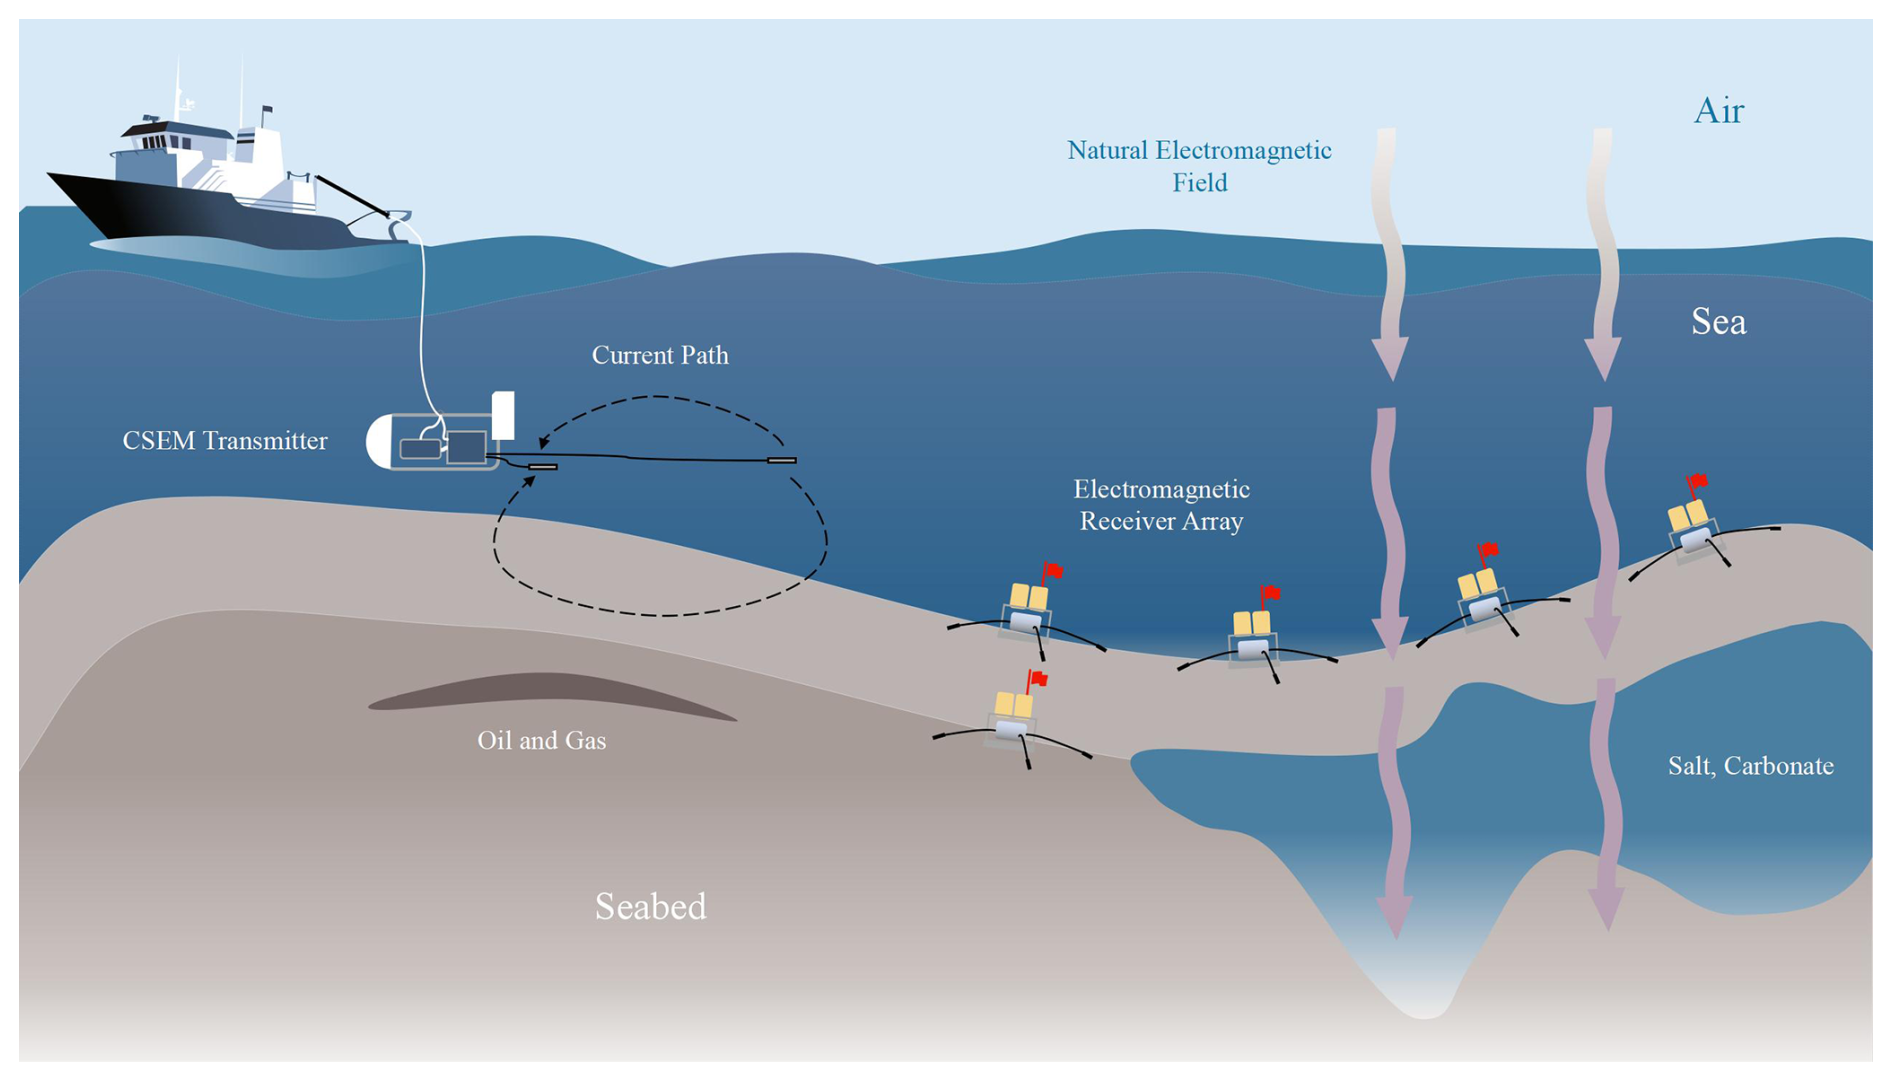
The marine electromagnetic method, which initially emerged as a specialized field in the 1970s primarily for military detection purposes, has evolved significantly over the decades. This evolution was driven by the recognition of its economic potential, particularly in marine oil and gas exploration applications (Constable, 2010). Marine electromagnetic technology has matured into a crucial resource exploration tool (Kasaya et al., 2023; Menezes et al., 2023; Constable et al., 1986). As shown in Fig. 1, a standard marine controlled-source electromagnetic (MCSEM) system consists of two primary components: (1) electromagnetic transmitters and (2) seabed receivers. In this method, electrical anomaly bodies react to the electromagnetic waves emitted by the transmitter, and the receiver captures and analyzes these responses to pinpoint the location and attributes of the anomaly (Constable and Srnka, 2007).
The current developmental emphasis of the MCSEM transmission system is on high-power applications, which introduces a spectrum of security challenges. Addressing these challenges effectively necessitates a thorough comprehension of the prevalent high-power components integral to the transmission system. In the transmission system conceptualized by Wang et al. (2022), the high-power constituents predominantly encompass the power located at the deck end and the transmitter situated under water. In the development of MCSEM, researchers have established several monitoring methods to ensure the safety of its offshore operations. Deng et al. (2013) paved the way for data acquisition in deep-water magnetotelluric studies, emphasizing the importance of collecting voltage and current data within the transmitter. Simultaneously, Wang et al. (2013) developed the MCSEM deck monitoring system in the same year, employing a serial port for data transmission, and the deck monitoring system was utilized in marine experiments in 2013, tracking indicators such as emission current, bus voltage, cabin temperature, and battery voltage. Xu et al. (2017) introduced a remote monitoring device for MCSEM, utilizing photoelectric composite cable technology. This device essentially facilitated the transmission of serial port information through a conversion module. Deng et al. (2022) applied the electric insulation online monitoring unit to the marine experiments. Following this, Wang et al. (2023) developed an online transmission system for the complete current data file of the transmitter, significantly enhancing the data transmission efficiency. In the newly designed 2000A-class high-power transmitter of Wang et al. (2024), the critical role of temperature control in MCSEM transmission systems is highlighted further.
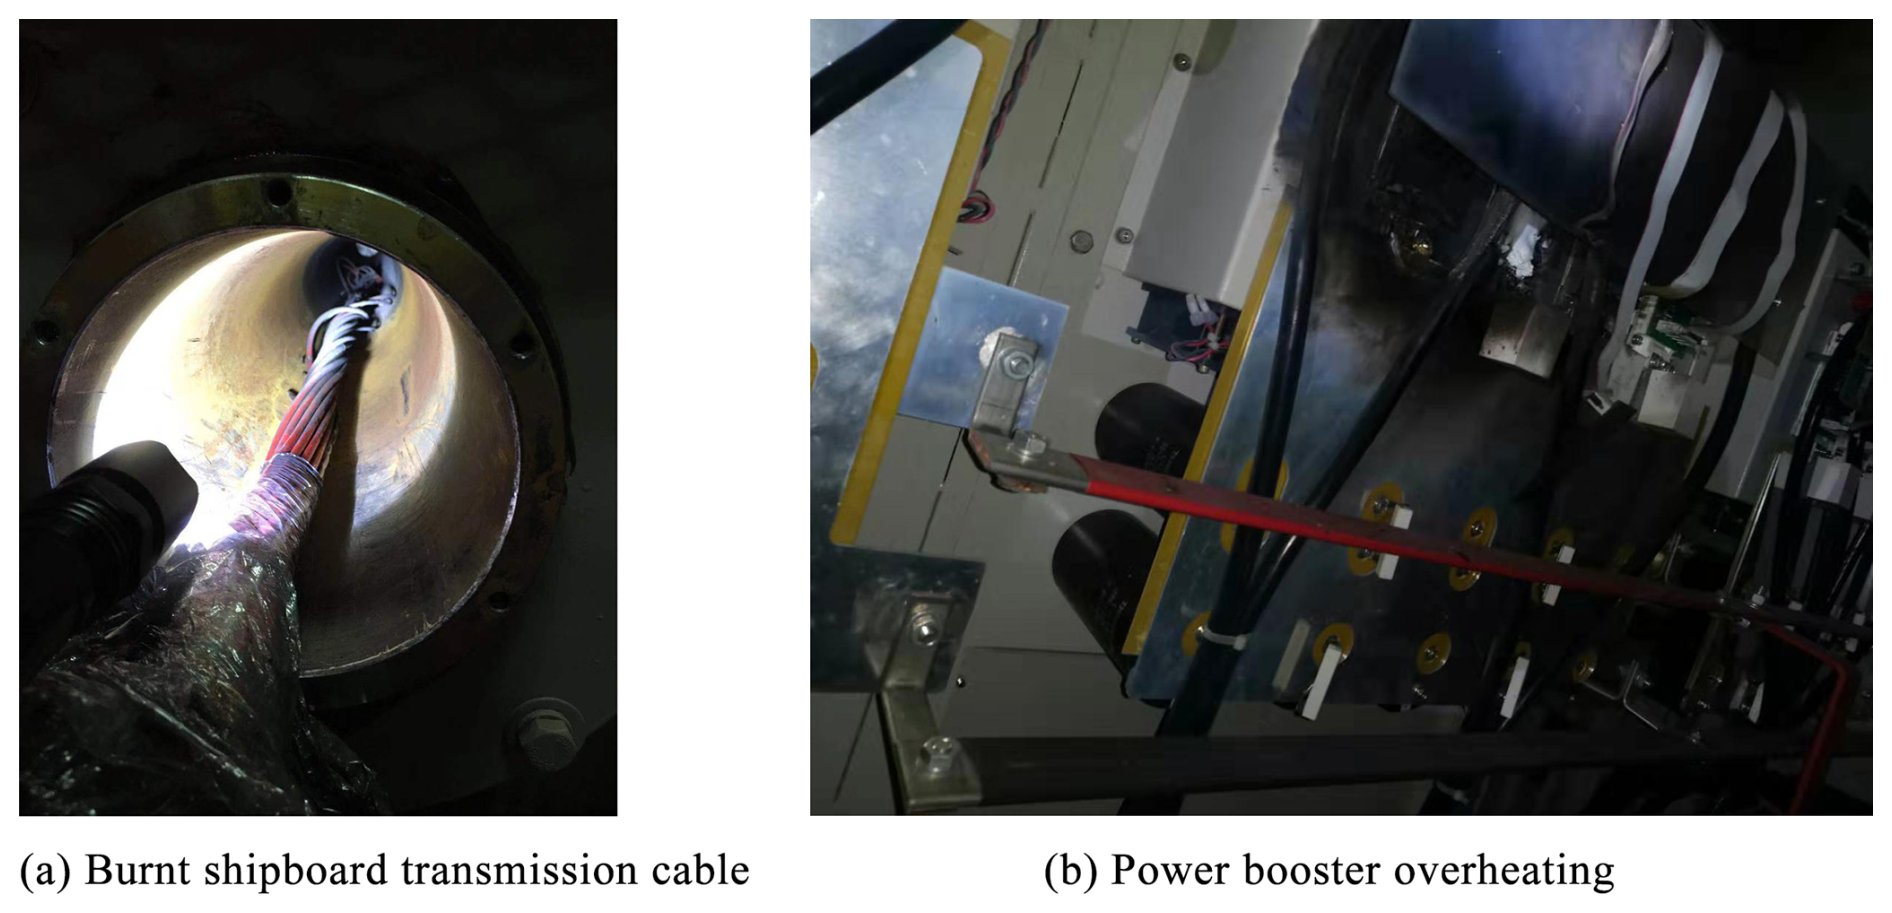
Nevertheless, despite these advancements, the primary monitored parameters in these systems remain limited to voltage and current, while temperature monitoring is only implemented at selected nodes through contact-based measurements. During a marine experiment conducted in the South China Sea in 2023, observable black marks indicative of high temperatures were found in the deck power booster unit and transmitter, as depicted in Fig. 2a and b. Unfortunately, the existing monitoring systems failed to detect these anomalies, which not only posed significant safety hazards but also ultimately led to substantial economic losses.
In summary, the existing MCSEM temperature monitoring system exhibits several limitations. Conventional temperature measurements have primarily employed contact-based sensors such as PT200, typically deployed at a limited number of internal nodes within the transmitter. However, during high-power operations, critical risk areas extend beyond these nodes to encompass the power supply unit, the photoelectric composite cable, and various internal regions of the transmitter. Non-contact infrared measurement offers benefits such as a wide recognition area, a fast response time, safety in use, and a long lifespan compared to traditional contact-based systems (Sullivan et al., 2021; Shen et al., 2017). Despite these advantages, currently available infrared surveillance equipment lacks compatibility with MCSEM systems, particularly in addressing the unique challenges presented by harsh MCSEM operating conditions. The MCSEM operations are often subject to intense electromagnetic interference and extreme temperature fluctuations, which can severely compromise the reliability and accuracy of conventional monitoring devices. Moreover, seabed-deployed equipment must incorporate substantial offline storage capacity to maintain continuous data recording during unexpected disconnections, which frequently occur in deep-sea operations. Additionally, both data transmission speed and methodology require meticulous design to ensure seamless integration with existing marine electromagnetic infrastructure, ensuring uninterrupted and efficient data flow.
To address these challenges, we developed a novel non-contact temperature monitoring system for MCSEM applications through comprehensive optimization of electrical circuits, mechanical configurations, and optical architectures. Corresponding temperature early-warning algorithms and monitoring software were also developed. This innovation transforms the traditional contact-based point measurement approach of MCSEM systems into a non-contact surface measurement paradigm. The proposed system significantly expands the monitoring coverage, enhances measurement efficiency, and ensures both data integrity and operational safety in marine environments.
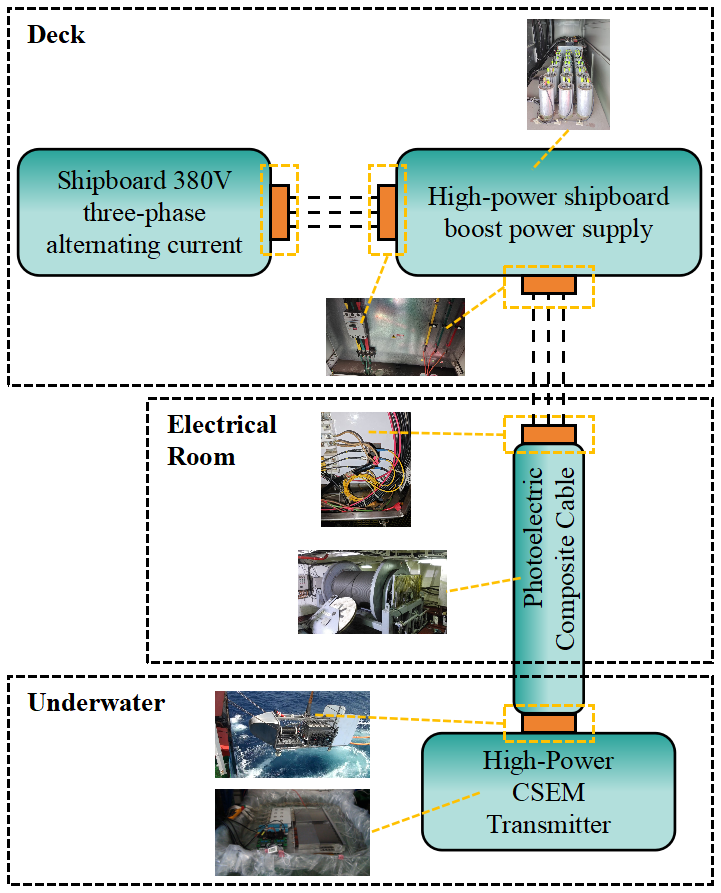
As shown in Fig. 3, multiple critical power nodes are distributed throughout the MCSEM offshore operation system, spanning the deck, ship's hold, and underwater transmitter. However, the traditional contact-based temperature measurement method is only applied to the insulated gate bipolar transistor (IGBT) nodes inside the underwater transmitter. This single method is clearly insufficient to meet the safety requirements of offshore operations. Therefore, it is essential to deploy suitable temperature measurement systems at each of these key nodes.
2.1 Hardware design scheme
The hardware circuit design is centered around the PLUG617 infrared core provided by GSTiR. The parameter mode of the scene source data supported by PLUG617 is the Y16 + parameter line, with a resolution of 640 × 513 and a frame rate of 30 Hz. The required data transmission rate is at least
Consequently, Gigabit Ethernet constitutes the minimum requirement to satisfy both the video data transmission rate demands and the control signal communication needs. Furthermore, MCSEM operational constraints necessitate local data storage within underwater equipment to ensure data security. In traditional marine electromagnetic instruments, conventional microcontrollers, such as the STM32F4 series, are typically employed. However, such microcontrollers lack the computational throughput and memory bandwidth required for (1) high-volume video data transmission and (2) large-capacity storage access – both critical for video transmission system functionality. To address these limitations, we have adopted the A40I platform from Forlinx and installed the Linux operating system to fulfill our needs. The hardware circuit design focuses primarily on transmission speed and storage capacity (Sun et al., 2022). The system architecture is illustrated in Fig. 4.
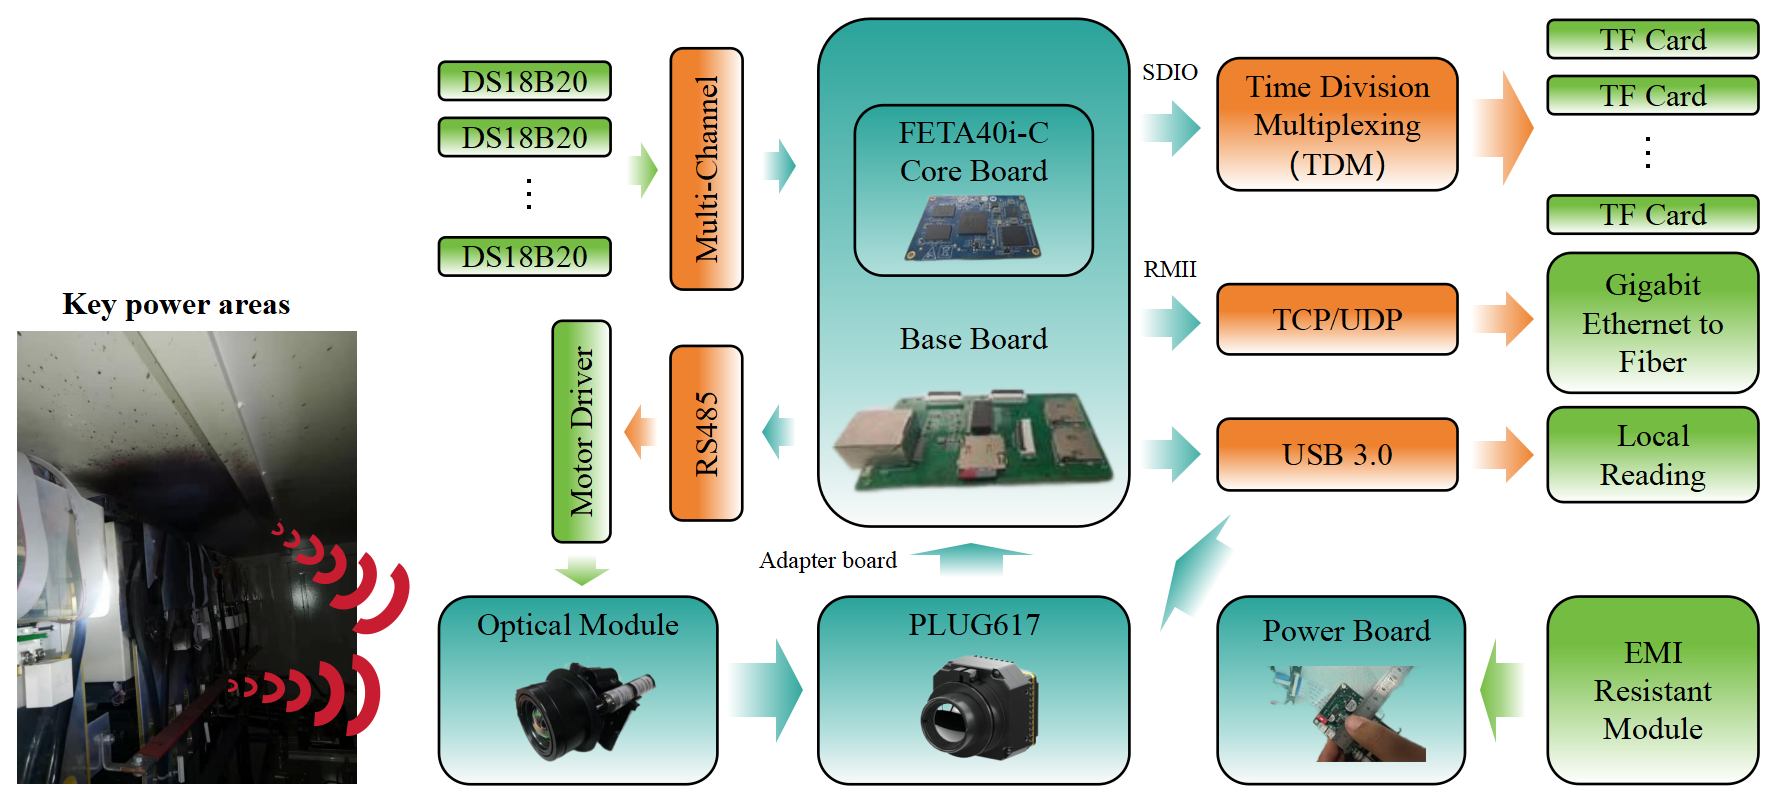
The primary hardware architecture of the system encompasses three circuits: the main control board, the power supply board, and the A40I platform. To facilitate the zoom functionality of the infrared lens, an additional motor system has been integrated to control the optical module, which is connected to the main control board via a 485 interface. Moreover, leveraging time-division multiplexing technology, the system is capable of accommodating multiple high-capacity trans flash (TF) cards for offline storage. Given that the internal circuitry of the instrument generates a significant amount of heat during extensive data production, which is non-negligible, multiple DS18B20 sensors have been deployed within the device for temperature monitoring and subsequent calibration of temperature data. The system communicates with external devices through a reduced media independent interface (RMII) interface for Gigabit Ethernet connectivity, and data are transmitted over long distances via a network-to-fiber module.
2.2 Anti-electromagnetic-interference(EMI) design
During operation, marine electromagnetic transmitters generate substantial currents (102–104 A), creating a potent source of EMI. Ensuring the integrity and accuracy of large amounts of data transmission in such close proximity to such a strong interference source is a formidable challenge. Duan et al. (2018) utilized CAN isolation as a measure for tackling EMI affecting communication lines, thus partially enhancing communication stability. Nevertheless, it is crucial to recognize that EMI incidents commonly manifest at various levels, necessitating the management of both external interferences in internal circuits and self-generated electromagnetic disturbances.
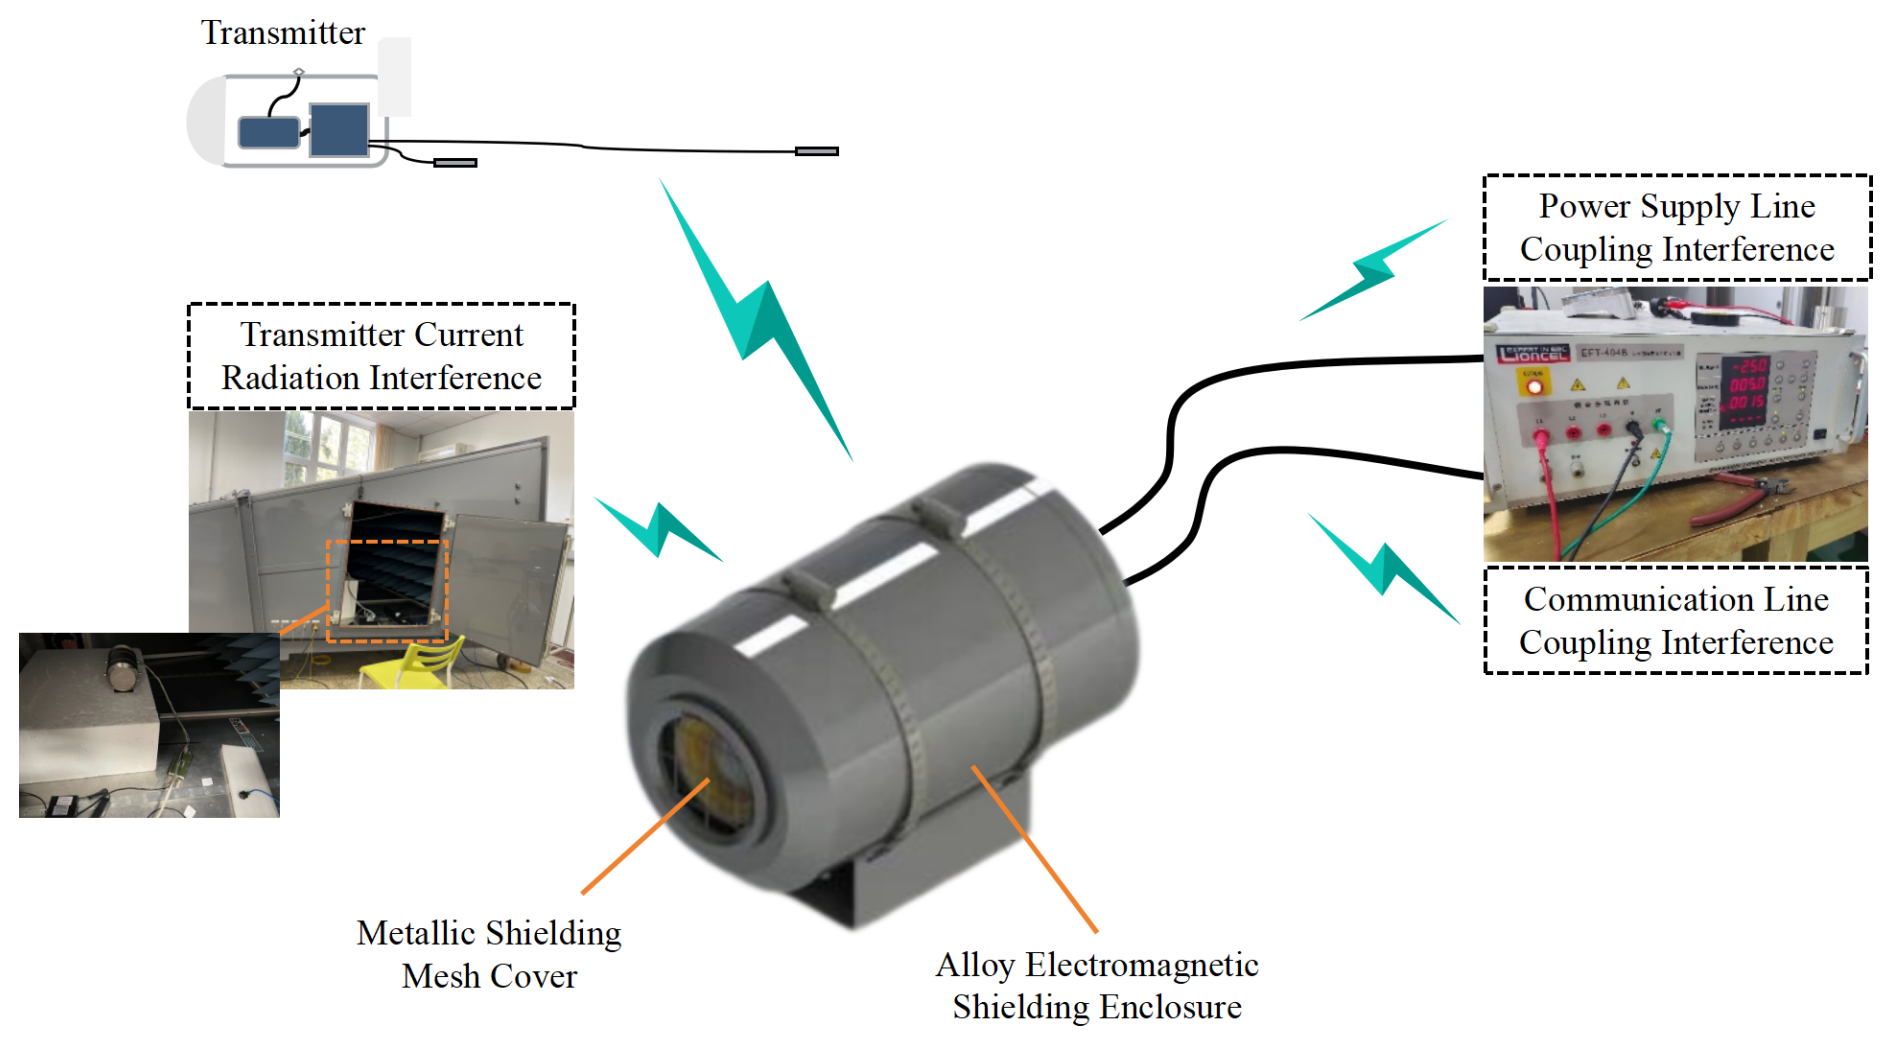
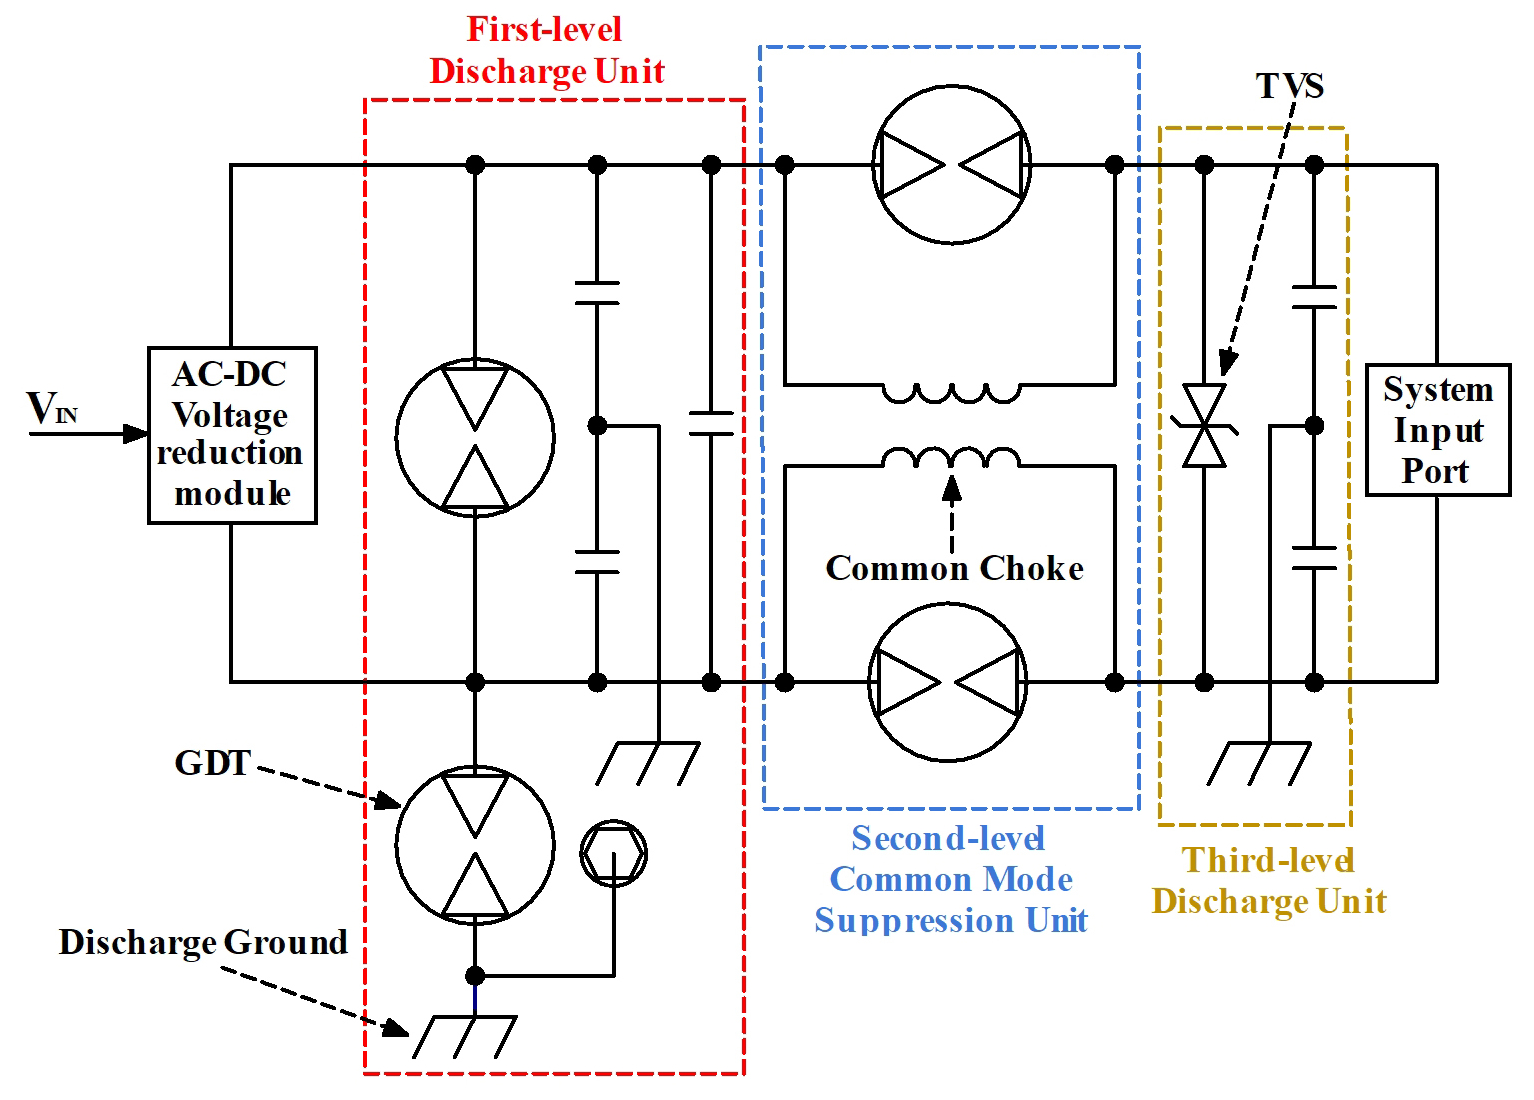
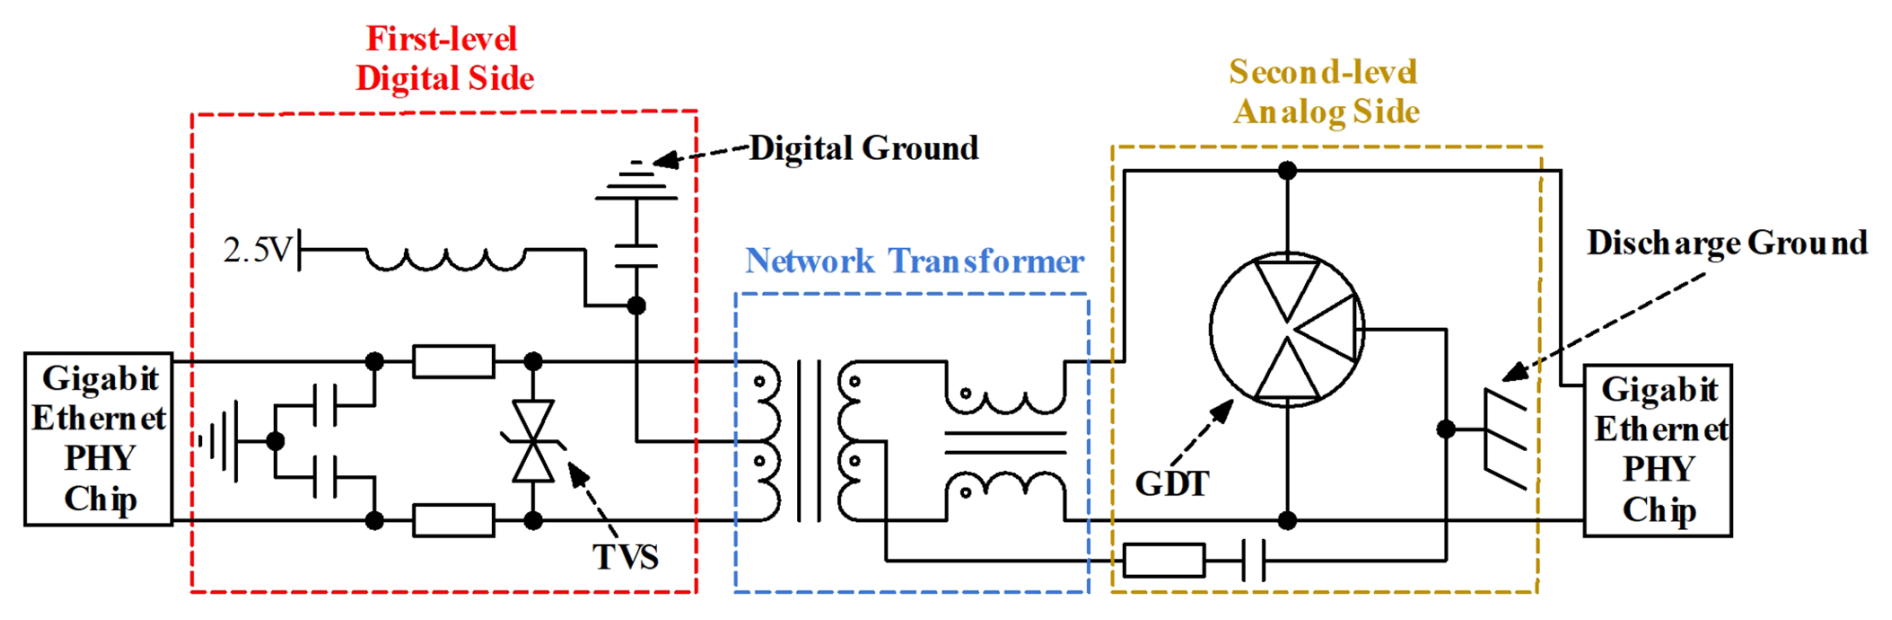
The sources of electromagnetic interference are illustrated in Fig. 5. Although the system's metallic enclosure and metallic shielding mesh cover can largely protect from electromagnetic interference, interference may still couple onto the connection lines between the circuits and the external environment. Therefore, we have implemented anti-electromagnetic-interference designs for both the power input interface and the Ethernet interface. Figures 6 and 7 show the design of our system's power input and data output interfaces. The design in Fig. 6 primarily includes (1) placing a GDT (gas discharge tube) at the first stage to dissipate instantaneous high voltage, with capacitors used to filter out common-mode and differential-mode interference; (2) positioning a common-mode inductor at the second stage and constructing a feedback loop with a GDT to further filter out common-mode interference introduced from the outside; and (3) placing a TVS (transient voltage suppressor) at the third stage to eliminate residual energy not absorbed by the previous stages, ensuring the output voltage remains within a reasonable range. Common-mode filtering capacitors and differential-mode filtering capacitors are employed to suppress different types of noise interference. In Fig. 7, we employ network transformers to divide the circuit into digital and analog ends, isolating interference while enhancing the signal. Additionally, a GDT is introduced at the later stage to prevent instantaneous high currents. This approach enables longer transmission distances while isolating the chip end from the external environment, thereby enhancing the anti-interference capability.
2.3 Optical system structure design
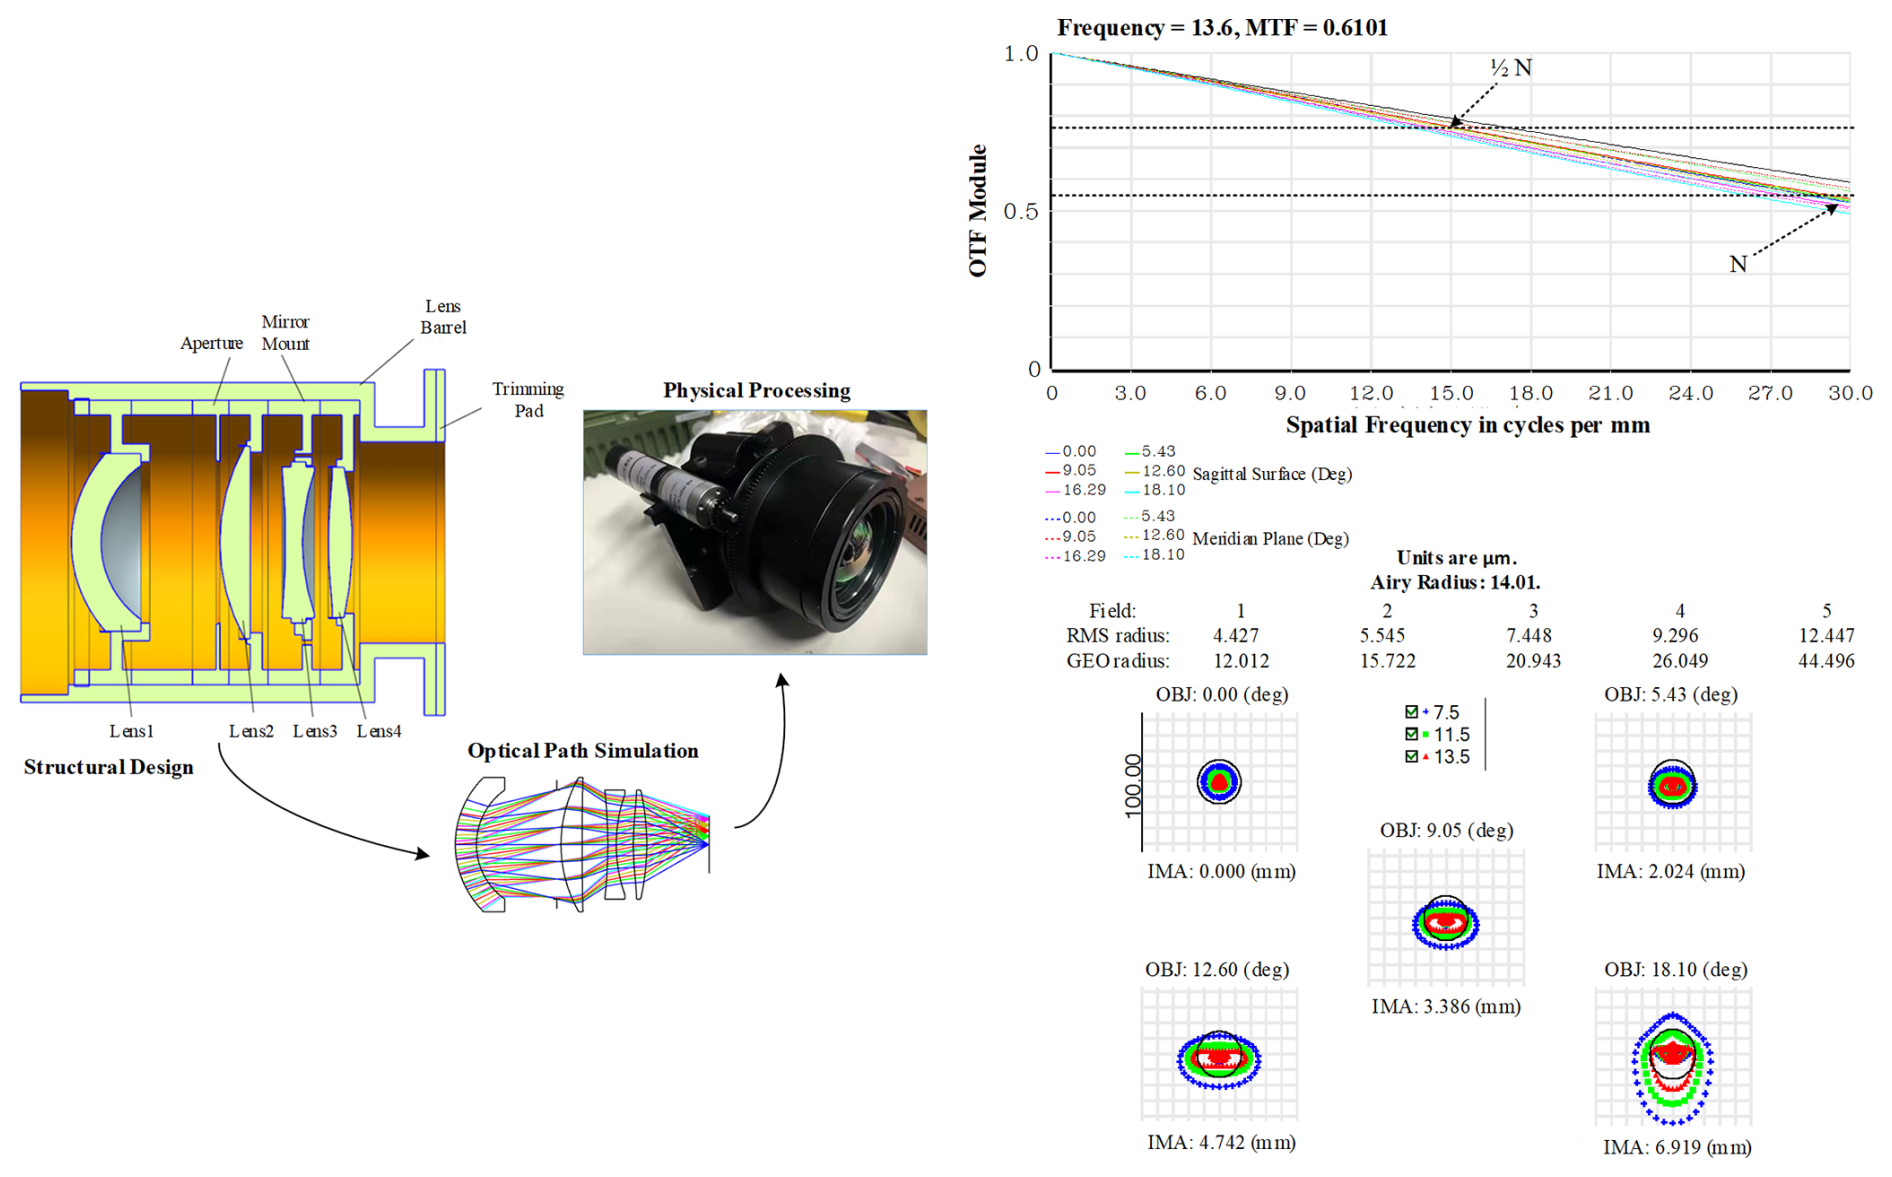
In addition to the accuracy of the infrared sensor itself, the accuracy of the optical system will introduce certain errors. Therefore, we carry out precise measurements and optical recalculation after the processing of optical components and structural components to reduce the impact of processing errors. At the same time, according to the sensitivity analysis results, a reflective collimator is used for the assembly of components with relatively strict requirements to ensure assembly accuracy. The overall structure of the optical system is shown in Fig. 8 and is a four-lens and five-aperture structure. The external support structure is made of 2A12 aluminum alloy to reduce its weight, and it can withstand a maximum stress of 102 MPa. The occurrence site is at the interface of the electrical box installation. Ensure that the component tilt is less than 2 arcmin, the eccentricity of the original component is less than 0.03, and the surface tilt is less than 0.015°. Modulation transfer function (MTF) and spot diagrams were used for aberration performance analysis of the optimized system (Zhang et al., 2022). The pixel pitch of the infrared sensor we use is 17, so the Nyquist frequency N is
where a is the pixel size. As shown in Fig. 11a, at the Nyquist frequency of 15 lp mm−1, the MTF value is greater than 0.7, the MTF value in the full FOV (field of view) is greater than 0.5, and the lens can achieve a fairly good performance of up to 30 lp mm−1. The airy spot radius is 14.01 µm, and the rms spot radius of the system is 4.427 µm, which is within an acceptable error. The imaging quality reaches close to the diffraction-limited performance, the imaging performance is uniform across all FOVs, and the optical system has good energy collection in various FOVs.
2.4 Mechanical structure design and stability verification
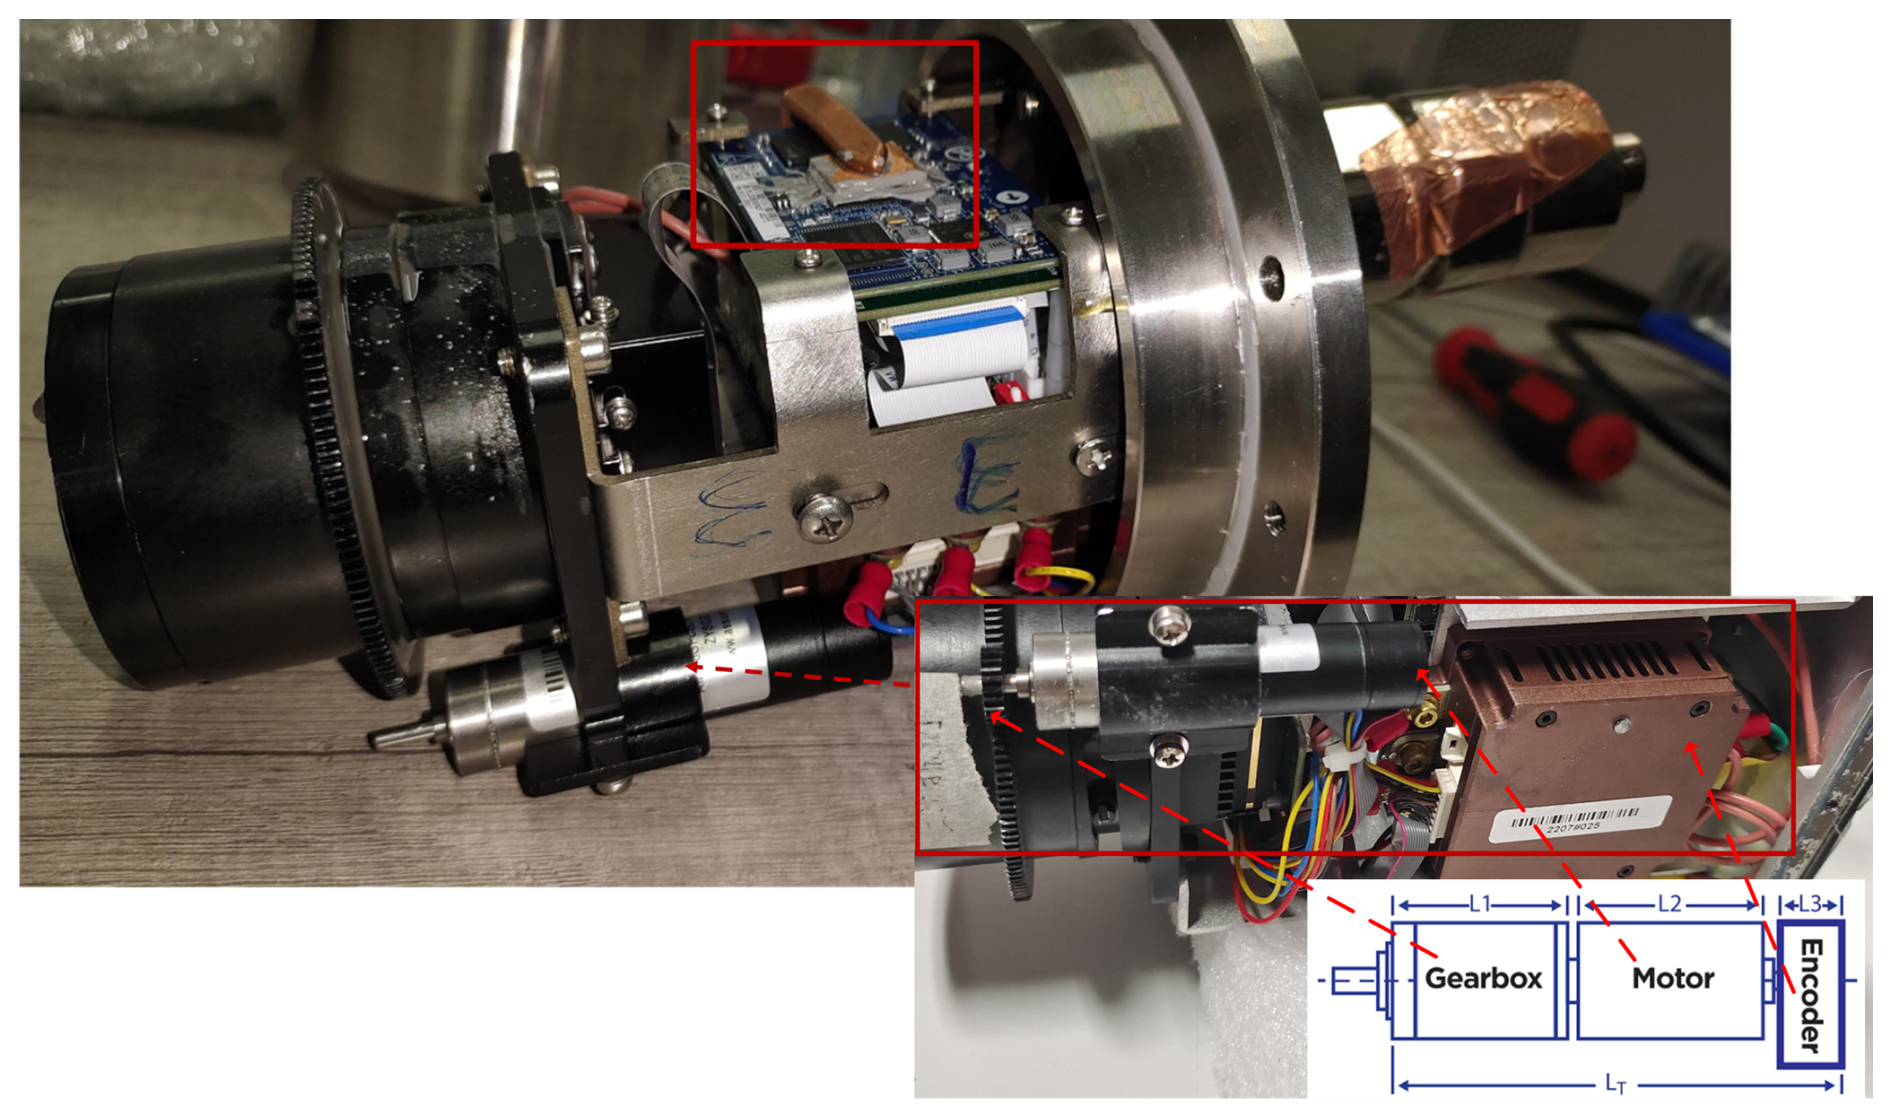
Previous studies have demonstrated that measurement distance significantly affects the accuracy of infrared temperature measurement systems (Long, 2016; Machado et al., 2024). To mitigate errors stemming from distance, we plan to incorporate a zoom system into our design. By incorporating a zoom lens controlled by a motor into the infrared sensor, as illustrated in Fig. 9, we aim to enhance the precision of our measurements. Furthermore, the integration of a zoom system brings increased flexibility in deploying our equipment. The motor communicates with the main control board through RS485. This allows real-time monitoring of the motor's status and position. Due to high-speed data transmission and processing, chips generate a significant amount of heat. If this heat is not properly managed, it can lead to device malfunction. Therefore, we utilize copper plates and thermal grease to conduct the heat from the chips, as depicted in Fig. 9.
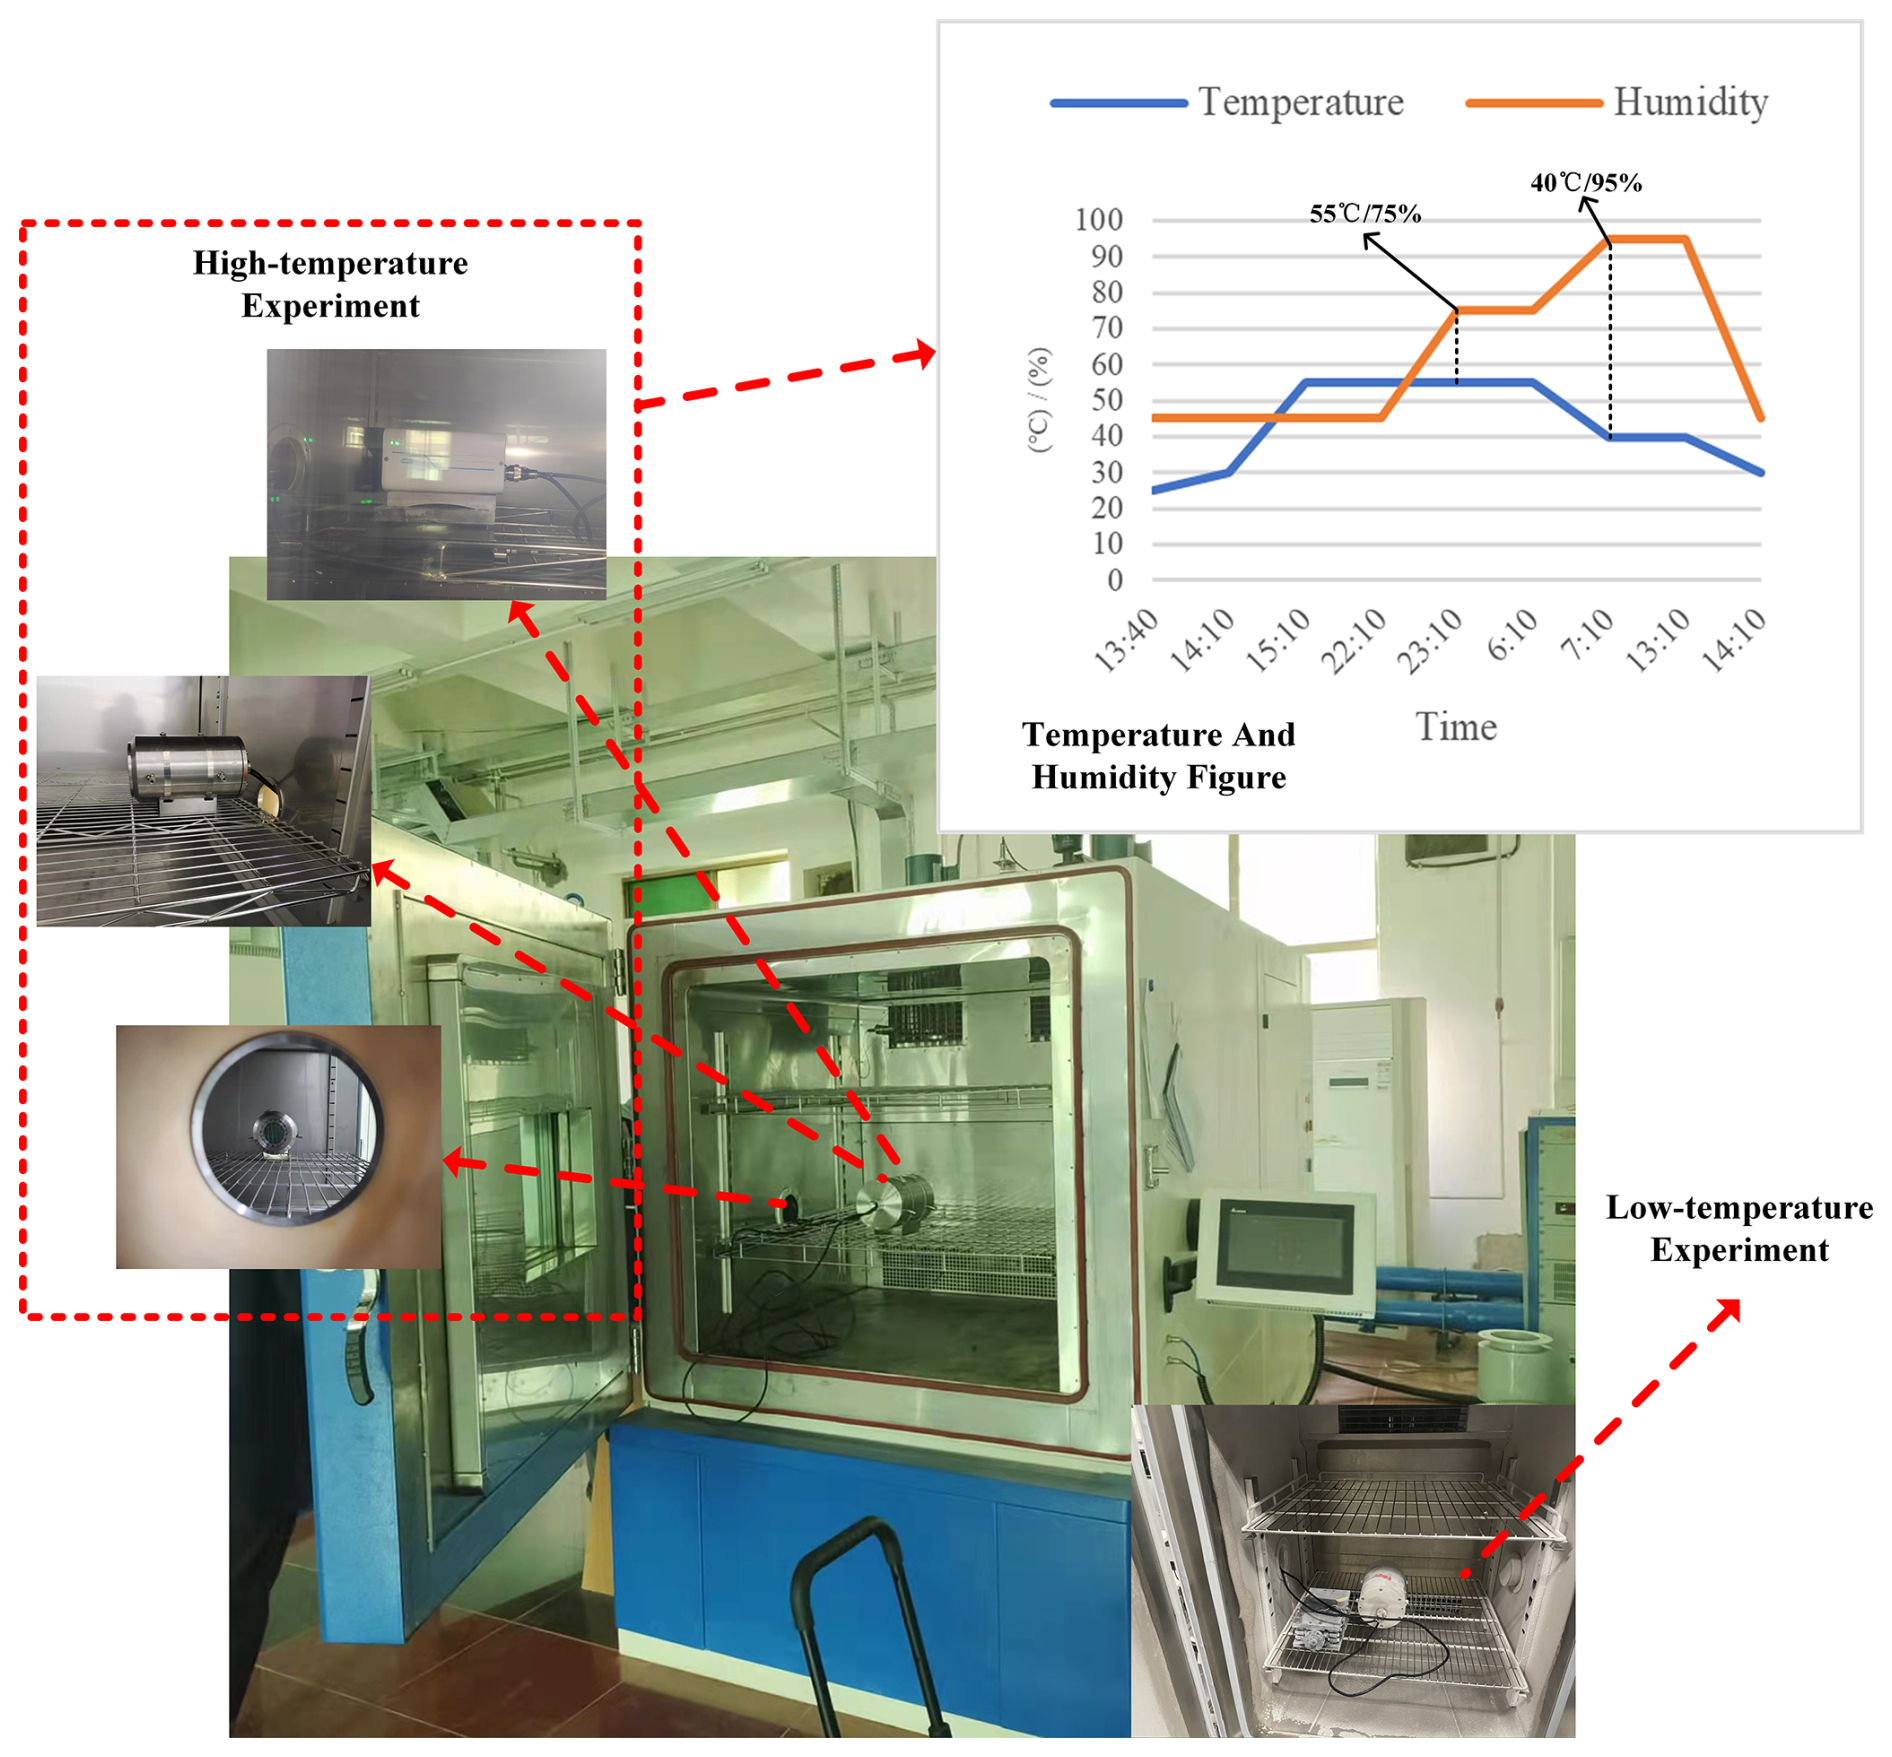
In order to evaluate the system's resilience under hostile environmental conditions, we began by subjecting the equipment to temperature and humidity tests, as depicted in Fig. 10. The instrument underwent long-term performance assessments at 55 °C and 75 % humidity as well as at 40 °C and 95 % humidity, confirming its operational stability. Moreover, we explored the system's adaptability to low-temperature and high-humidity settings. Notably, the image captured frost formation on the casing of the instrument.
In conclusion, we have successfully adapted the infrared system for MCSEM applications through comprehensive modifications in circuit design, optical system configuration, and mechanical housing, accompanied by rigorous testing. This adaptation ensures reliable operation of the infrared system under the challenging conditions of MCSEM deployment, including harsh electromagnetic interference, elevated temperature and humidity levels, and diverse environmental settings. Nevertheless, to fully realize multi-node synchronization, efficient data processing, and functional implementation via the existing MCSEM communication infrastructure, additional software development remains necessary to complete and optimize these operational aspects.
The software is an important component of the entire infrared temperature measurement system, including embedded software and user-oriented operation software on the PC side. Hermann et al. (2020) released open-source hardware and software for an infrared system, primarily designed for offline storage-based infrared monitoring of underwater objects. Yu et al. (2023) also provided a real-time temperature measurement solution, which achieved real-time identification of characteristic phenomenon changes through hardware data collection and online software analysis. Beyond conventional infrared monitoring capabilities, our offshore deployment scenario necessitates robust features, including (1) offline data caching with scheduled upload, (2) autonomous connection recovery, and (3) region-of-interest alert mechanisms. These advanced operational requirements mandate close coordination between the embedded control software and the PC-based management interface.
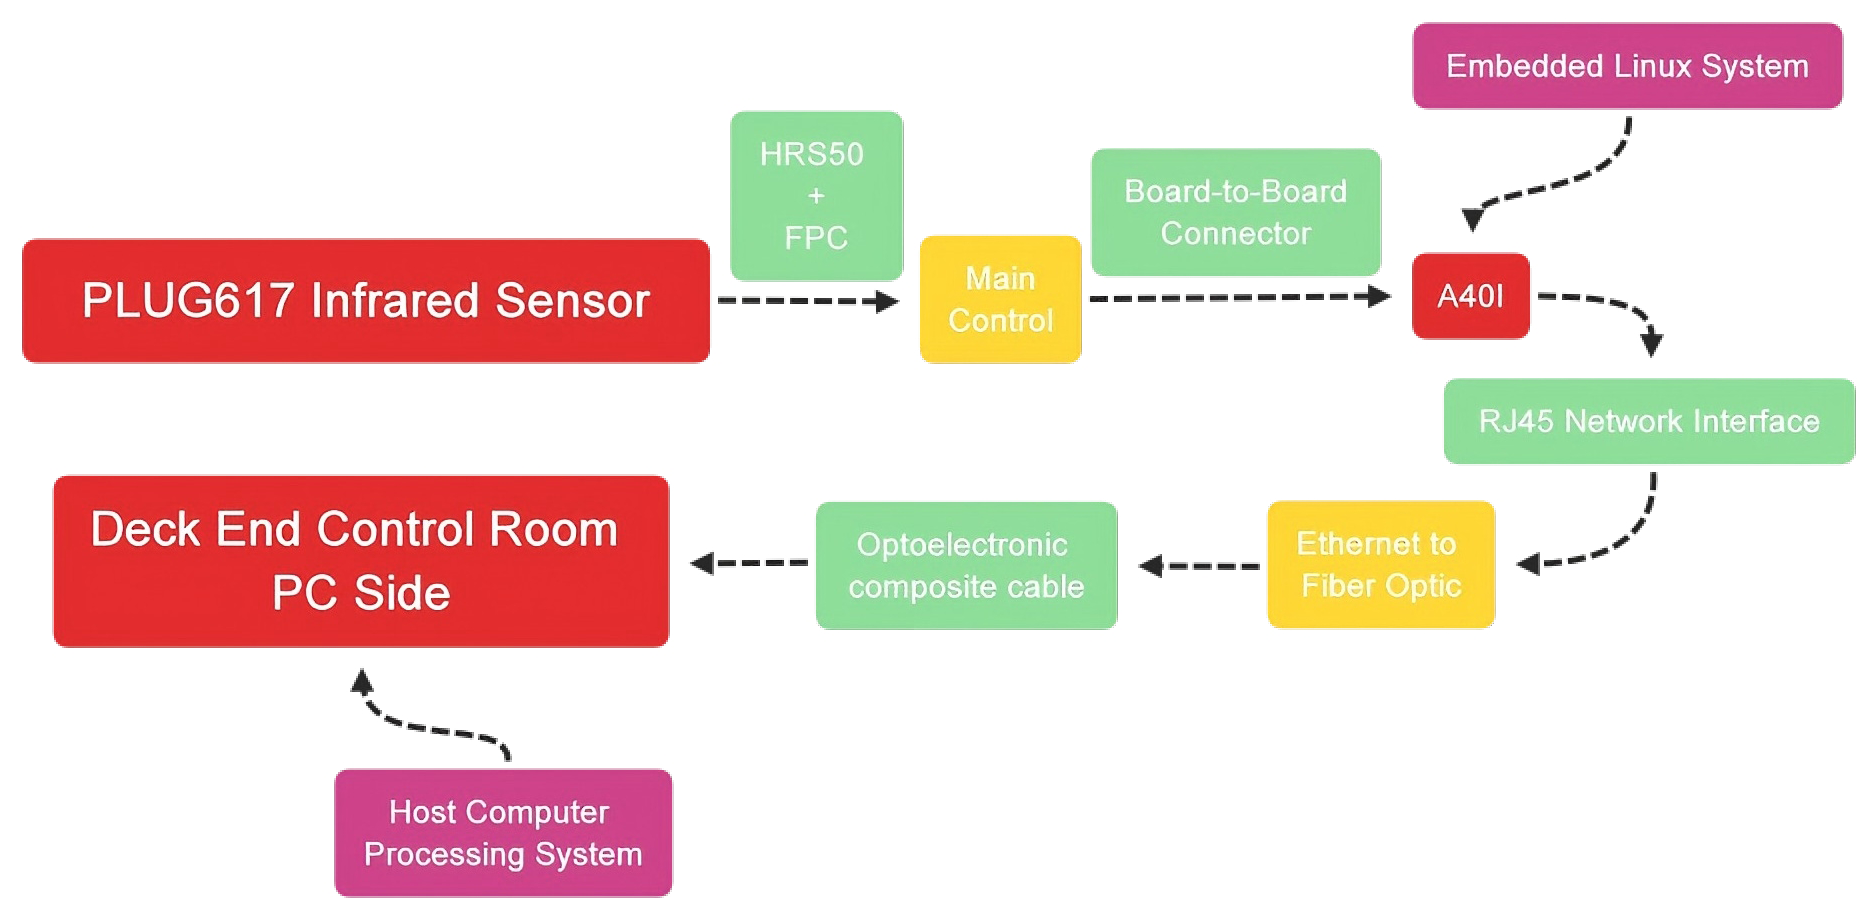
Figure 11 illustrates the data flow of the infrared system. Initially, data generated by the infrared sensor are transmitted to the main control board via the HRS and FPC connectors. The main control board subsequently transfers these data to the A40I processor via board-to-board connectors. The A40I processor then encapsulates and reorganizes the data before transmitting them to the deck-end computer through the network and fiber optic equipment for display using the host computer software. As part of our study, we will delineate the implementation of the functions required by MCSEM into discrete components, i.e., the embedded system and the host computer software.
3.1 Embedded software development and lens data acquisition
A40I is embedded with the Linux kernel, and the software environment mainly includes the Lichee development kit and the Qt development kit. The main architecture of the program is shown in Fig. 12.
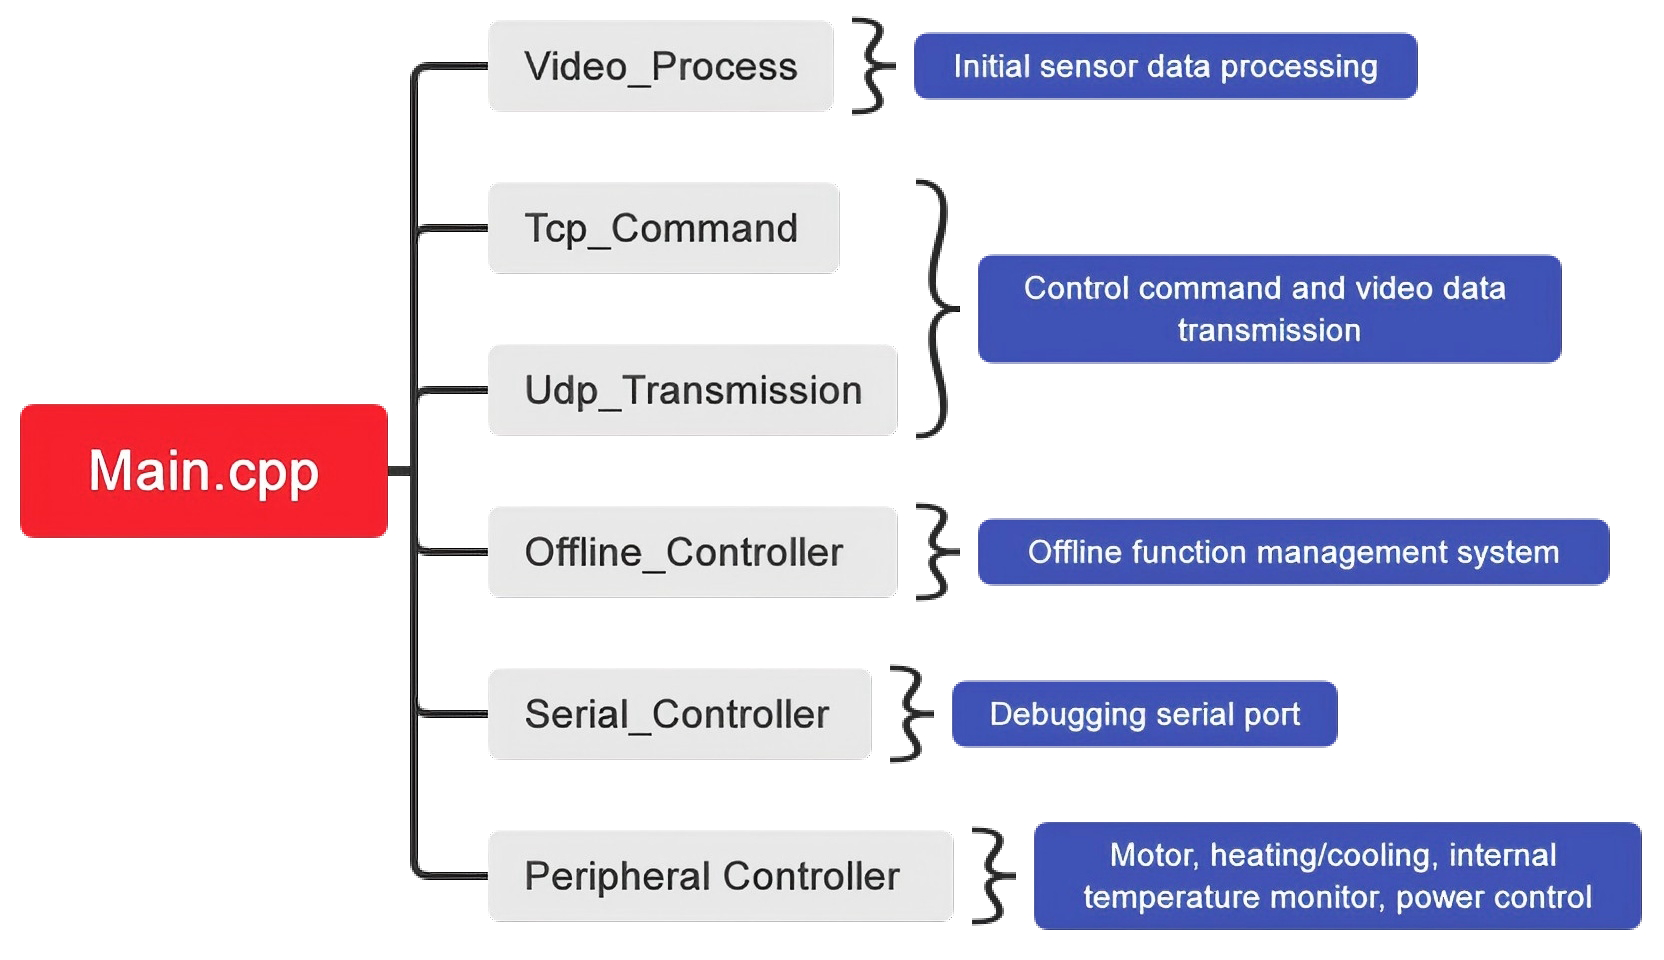
In the initial data processing phase, the data provided by the sensor contain a variety of information, including temperature measurement data and other data frames, necessitating the segmentation and repackaging of the received data. This processing stage is carried out in the “Video_Process” thread. To support data transmission efficiently, we utilized a specialized approach that involves employing both TCP and UDP rather than relying on a single communication channel. TCP is used to establish a reliable communication channel and facilitate command exchange, while UDP is leveraged for transmitting large volumes of video data at high speeds. The coordination of these communication methods is overseen by two distinct threads: “Tcp_Command” and “Udp_Transmission”.
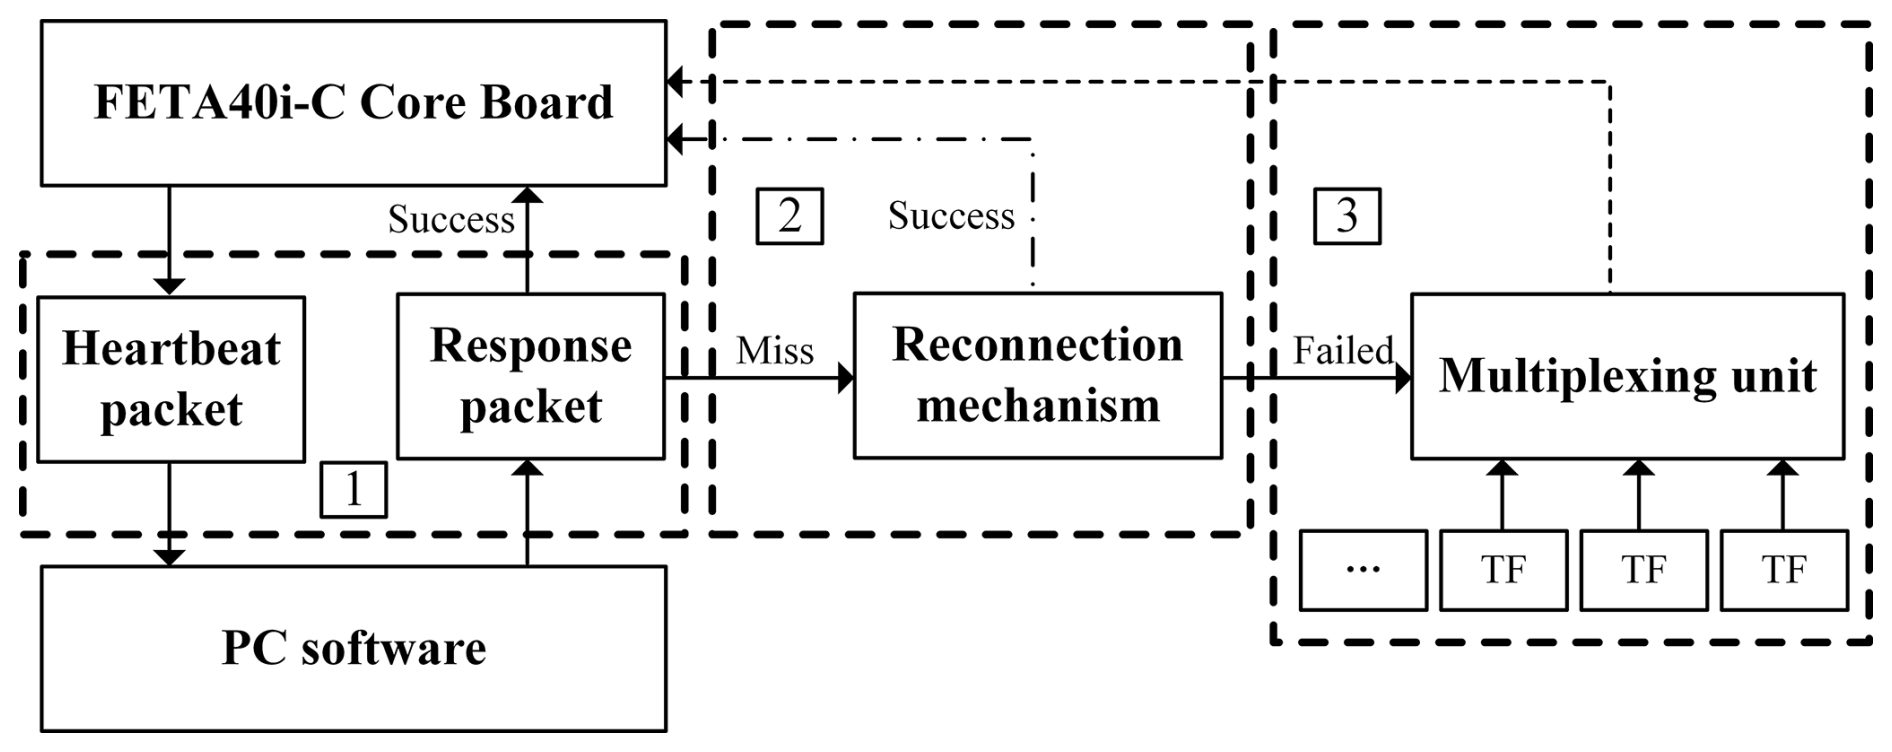
Ocean operations, particularly underwater missions, present significantly greater monitoring challenges compared to land-based operations, inevitably leading to connection disruptions. Therefore, implementing mechanisms to manage such situations and enhance data security becomes essential. The “Offline_Controller” offers a processing approach illustrated in Fig. 13. The system employs a heartbeat packet mechanism to verify connection stability, requiring prompt PC responses to each heartbeat signal. When the A40I processor fails to receive a response, it activates the reconnection module to restore PC communication. Persistent disconnections beyond a predefined threshold trigger the system to identify a connection failure and engage the local storage module for data preservation. Once a connection is re-established, the data are automatically re-uploaded. To tackle restricted hardware storage channels during local storage, stacking technology is employed alongside a storage multiplexing pathway design. The system seamlessly switches to an alternative storage block when the current one is full. This feature allows for the potential deployment of exceedingly large storage units given adequate hardware space. The current configuration employs three 1 TB storage units, selected according to operational demands. Notably, this capability sets it apart from similar products like Hikvision's DS-2TD2537T-15/Q. Through this strategic design, the issue of connection interruptions in MCSEM is effectively resolved without requiring manual intervention.
3.2 Upper computer software design and temperature calibration
The software is based on the Qt development environment. It integrates the SQLite lightweight database, OpenCV visual library, and plugins such as QCharts and QMultimedia for the development of temperature measurement software. Figure 14 provides a brief overview of the functions of the PC software.
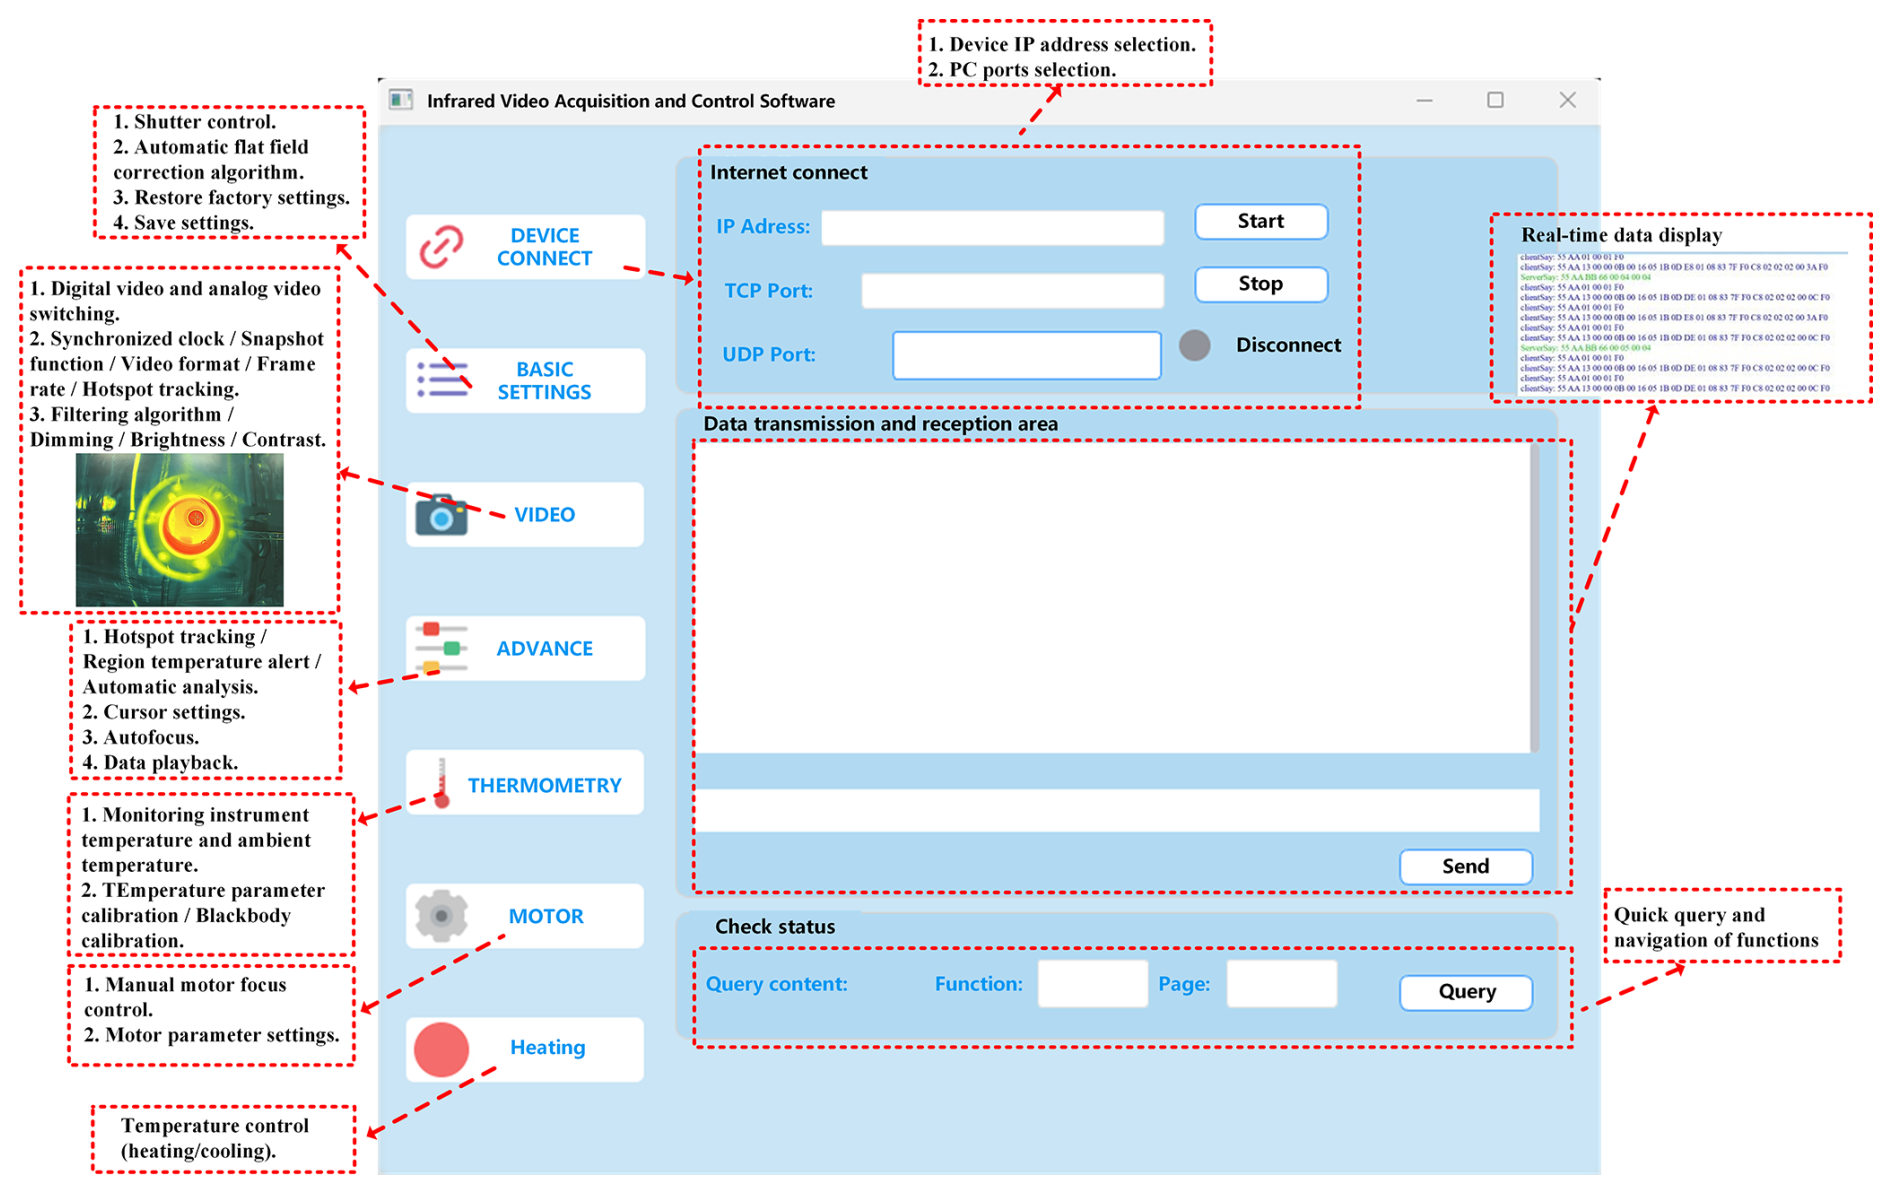
Figure 14Introduction to the PC software.
Since our device only encapsulates the sensor data, the conversion from raw data to visualized video needs to be done on the PC side to convert grayscale values to their corresponding temperature values, and this is the most important task of the software. According to Planck's law, we can determine the spectral distribution of blackbody radiation:
where c1 is the first radiation constant and c2 is the second radiation constant. An object with a nonzero absolute temperature T can emit electromagnetic waves outward, and its radiation intensity satisfies the Stefan–Boltzmann law:
where σ is the Stefan–Boltzmann constant. For an absolute black body with a certain temperature, its spectral radiance has a maximum value and, corresponding to this maximum value, the wavelength of light follows Wien's displacement law. There is a relationship between the blackbody temperature T and the peak wavelength, which can be expressed as
Then use ε, commonly known as the emissivity, to characterize the radiation coefficient that varies with material properties and surface conditions:
M means the total radiated power of an object, and M0 means the amount of radiation emitted by a black body at the same temperature. Therefore, the radiated energy of a general object satisfies the following equation:
So, as long as the radiated energy of the object is measured and the emissivity of the object is known, the temperature of the object can be calculated as
where λ1 is the lower limit of the spectral response of the detector and λ2 is the upper limit of the spectral response of the detector. At the same time, we need to pay attention to the three aspects of effective radiation observed by the thermal detector: the target's own radiation, the environmentally reflected radiation, and atmospheric radiation. So, the basic formula for temperature measurement can be represented as follows:
where εr is the target atmospheric emissivity. When the measured temperature is significantly higher than the ambient temperature, the environmental radiation can be ignored. Similarly, when conducting indoor measurements, atmospheric radiation can be neglected. Therefore, our software has provided APIs for these parameters to accommodate different environments and obtain temperature measurements that are as accurate as possible. In this case, we obtain the relationship between the grayscale average of the thermal images output by the thermal detector and the radiant intensity received by the thermal detector. By using this relationship, we can measure the temperature by deducing the radiant intensity of the object from the grayscale average of the thermal image displayed by the thermal detector, and then we can use the relationship between radiant intensity and temperature.
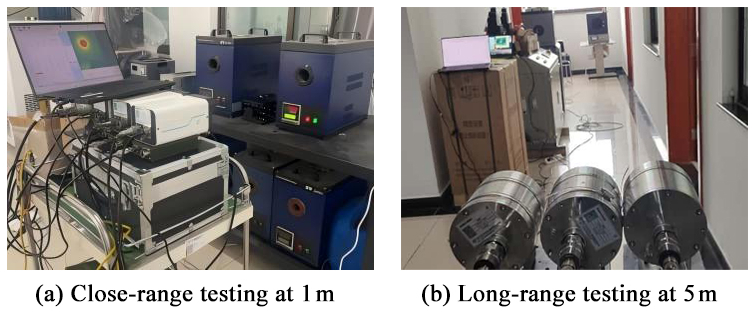
As shown in Fig. 15, after configuring the environmental parameters of the software, we conducted tests on the devices using the standard black body. According to the characteristics of the sensor, we divide the temperature measurement range into two levels: the first level is −20–150 °C, and the second level is 0–350 °C. At the same time, in order to mitigate the impact of discrepancies between the displayed temperature and the actual temperature on the data results, we further calibrated the infrared body. The relationship between the actual temperature of the infrared body and the grayscale values is presented in Table 1.
Table 1The relationship between the actual temperature of the infrared body and the grayscale values at 1 m.
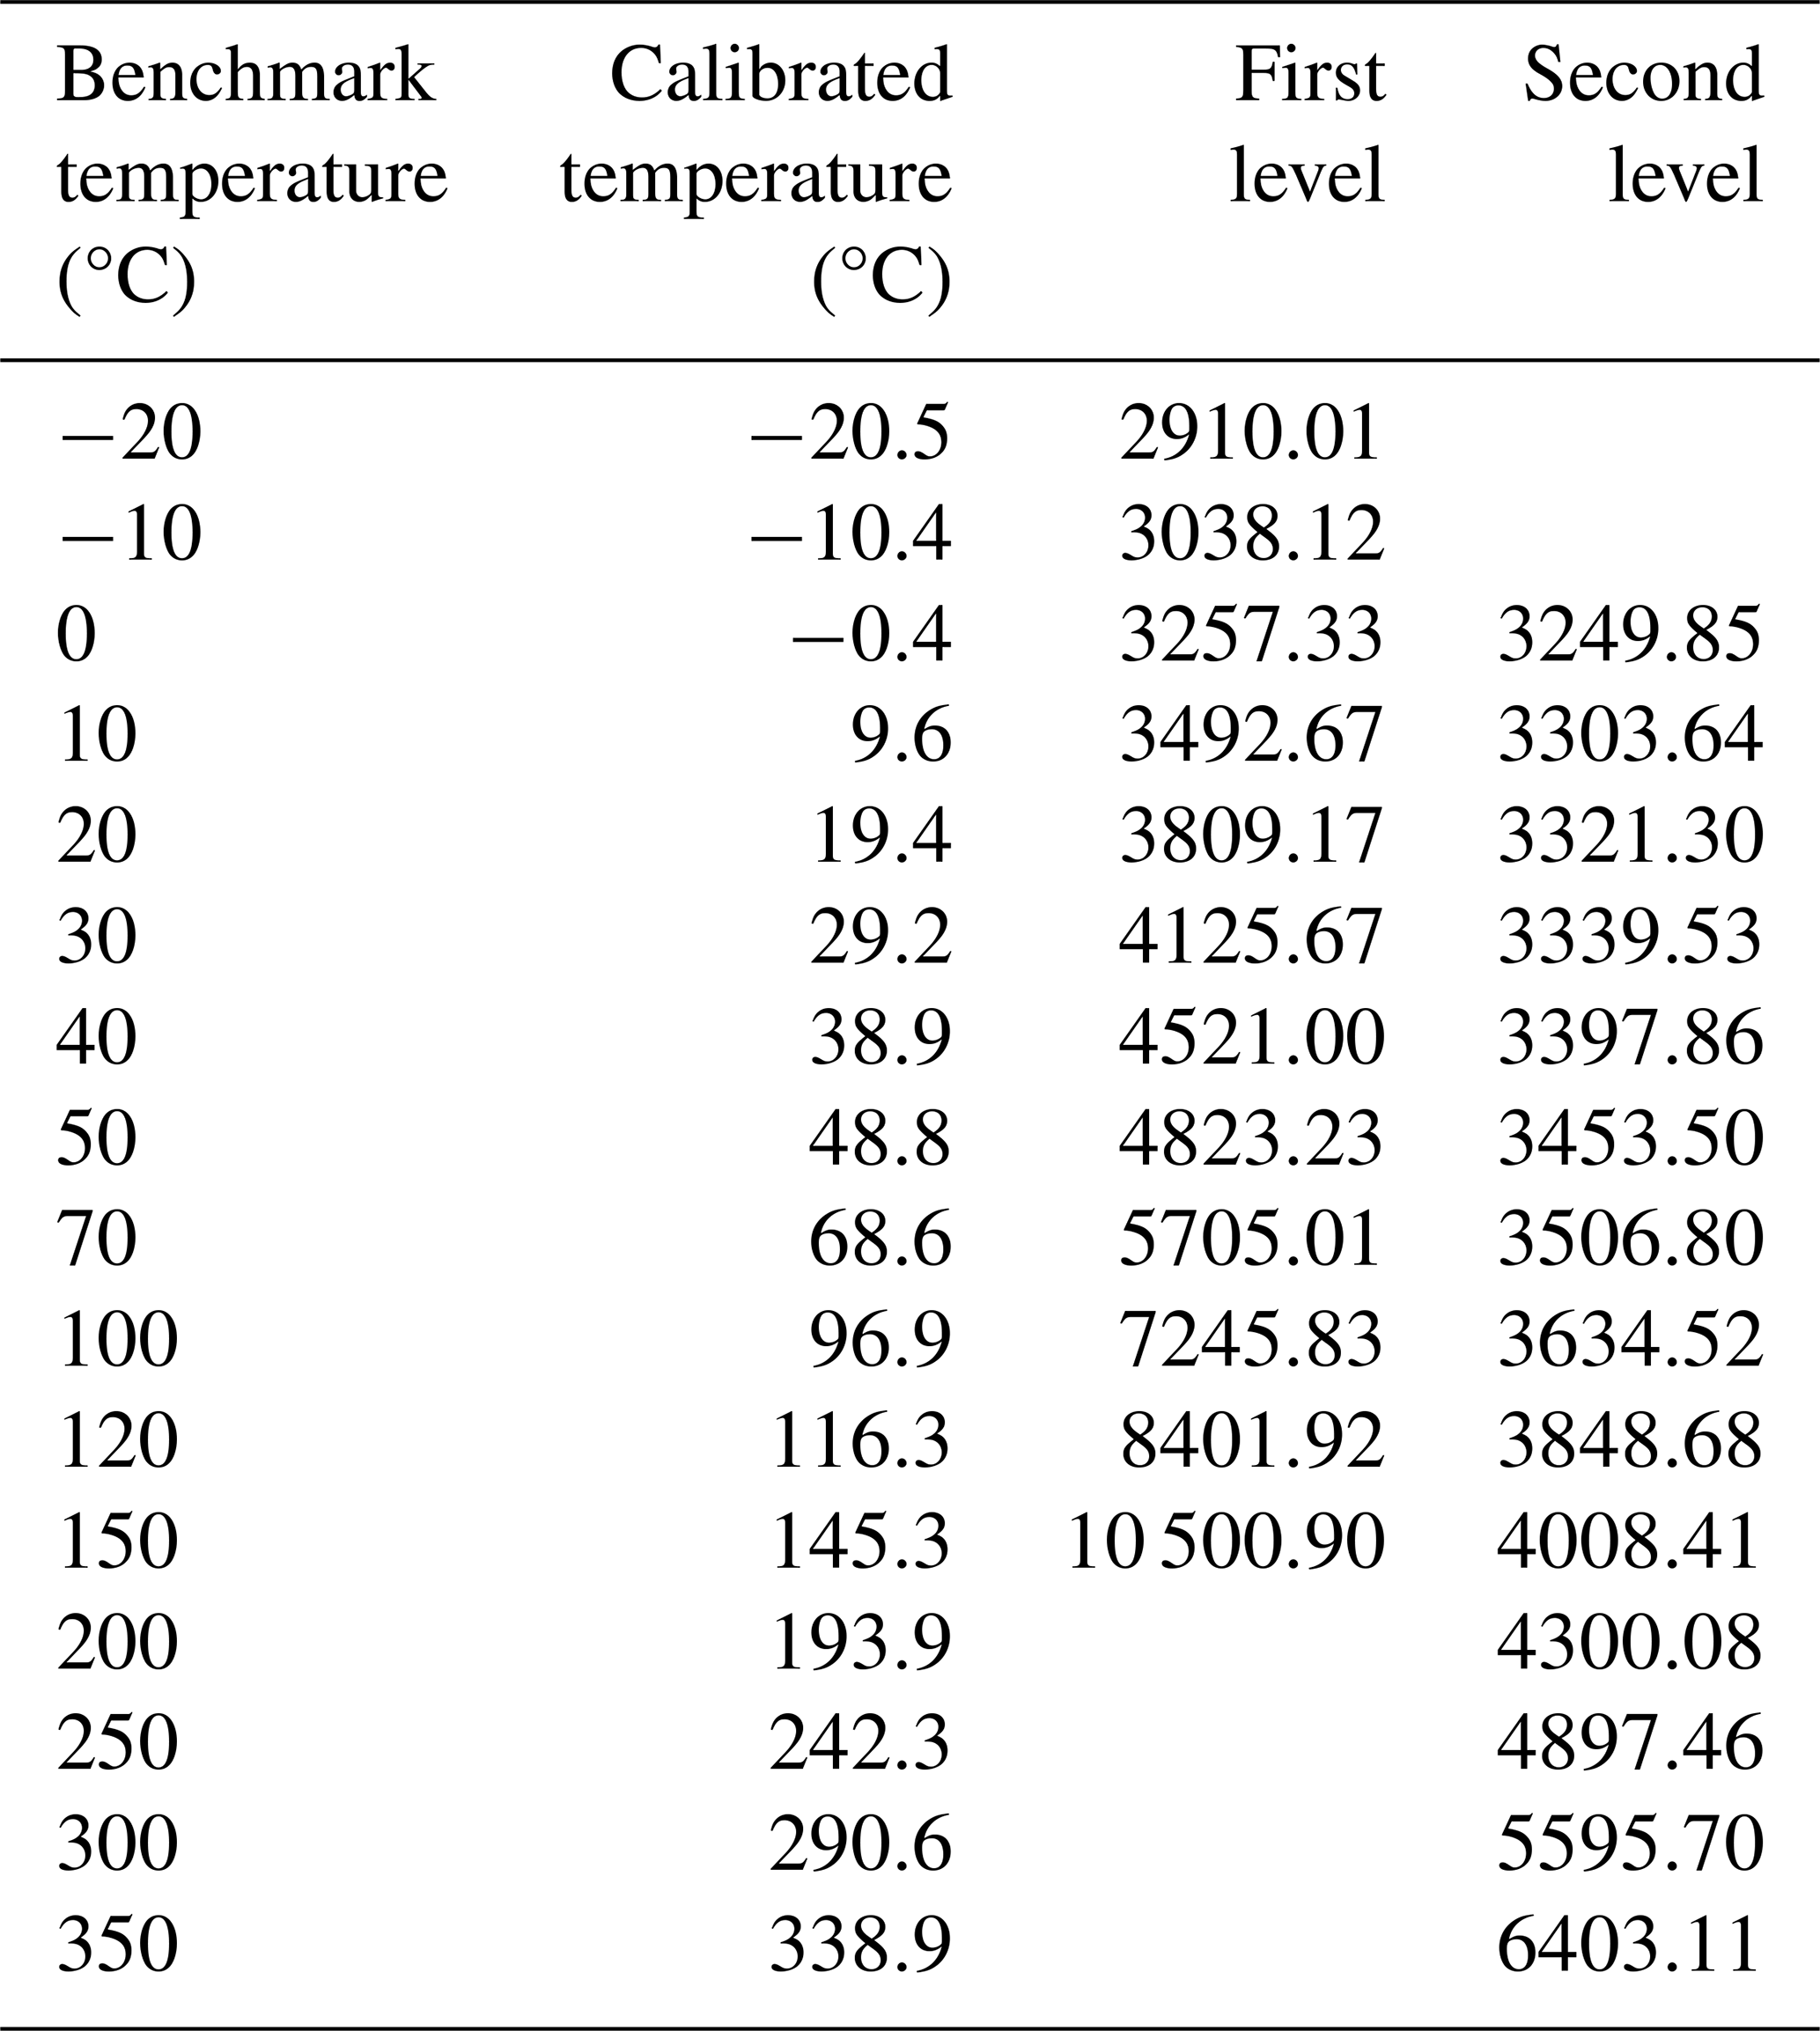
We can clearly observe from the table that there is a certain linear relationship between grayscale values and actual temperature values. Moreover, at the second level, the highest temperature range exceeds 350 °C. At 350 °C at the second level, the grayscale value is still lower than the grayscale value at 150 °C at the first level. However, according to the empirical values in MCSEM, we do not require such a high temperature range. Therefore, we do not focus on grayscale values at higher temperatures.
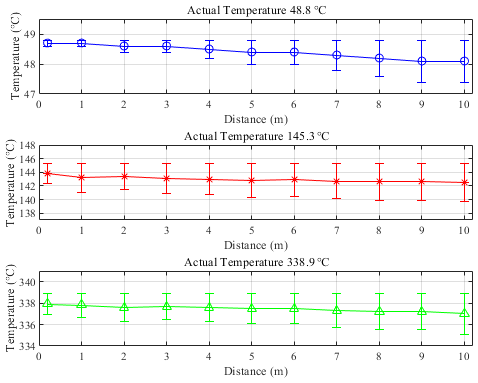
Following the aforementioned process, we calibrated multiple instruments. Considering various environmental parameters, we fitted the temperature function and incorporated it into the software's data processing pipeline. After practical testing, we obtained temperature measurement curves at the software level for several devices, as depicted in Fig. 16. We have selected three temperature points of particular interest for testing, with the instrument operating at a normal temperature of 50 °C (actually 48.8 °C), a warning temperature of 150 °C (actually 145.3 °C), and an upper temperature limit for measurement of 350 °C (actually 338.9 °C). It can be seen that, after calibration, the measurement error of the instrument has fallen to an acceptable range.
In light of the design highlighted above, our instrument is compared in two dimensions. The first dimension involves a comparison with the original MCSEM monitoring system developed by Wang Meng et al. (2024), whereas the second dimension entails a comparison with the well-established explosion-proof infrared temperature measurement system available on the market.
We have improved the measurement method in our system compared to the traditional MCSEM system by changing from contact-point measurement to global surface measurement. This enhancement allows for more intuitive and comprehensive temperature monitoring and early-warning capabilities. Additionally, our design upgrades the transmission method to Gigabit Ethernet for voltage, current, and temperature monitoring, in contrast to traditional serial port transmission, resulting in a significant improvement in transmission speed. Furthermore, we have addressed electromagnetic interference at the circuit level, a feature not present in traditional monitoring systems.
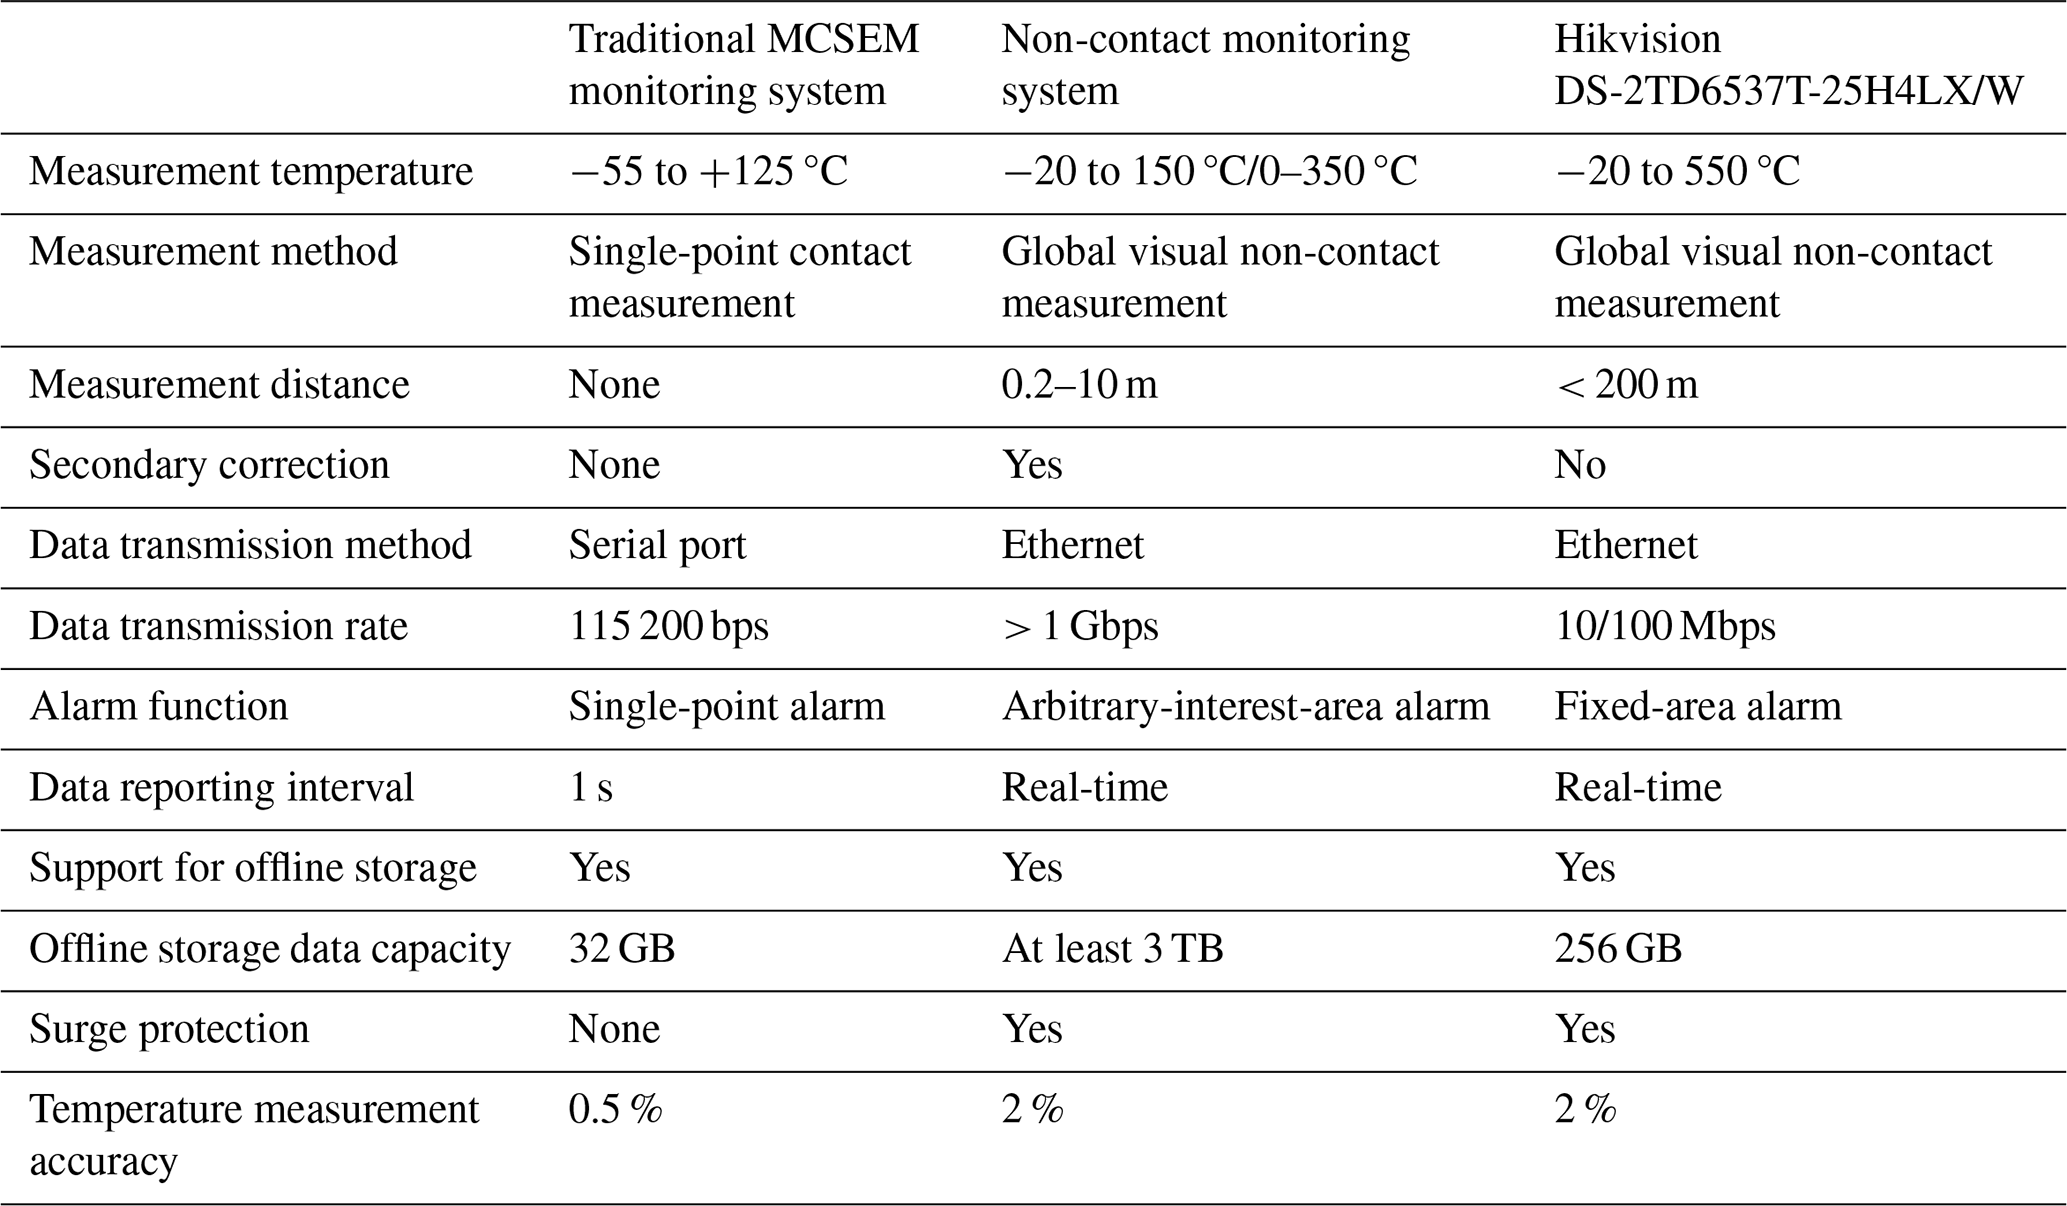
Compared to Hikvision's commercial DS-2TD6537T-25H4LX/W, our system has the ability of secondary correction, which can further calibrate the temperature through parameter settings when used in different environments. Meanwhile, we have a larger data transmission bandwidth than DS-2TD6537T-25H4LX/W, which can meet higher frame rates and larger data packet transmission. In addition to global temperature warning, based on the requirements of MCSEM, we have added region-of-interest warning, which makes it more convenient to focus on specific locations. Through memory stacking technology, we have achieved at least 3 TB of data storage space, greatly extending the offline storage time. In terms of temperature measurement accuracy, we have achieved the same 2 % as DS-2TD6537T-25H4LX/W, but this is lower than the contact temperature measurement of 0.5 %. However, this is acceptable for MCSEM because we focus on temperature changes in a larger-scale range. The detailed technical comparison is shown in Table 2. In conclusion, it can be seen that our design excels in its adaptability to the marine electromagnetic field, enabling better utilization of existing marine electromagnetic equipment (such as optoelectronic composite cables). It can also meet the requirements of more demanding environments (offline mechanisms, local storage, area-of-interest alarms, and secondary calibration functionality).
This article discusses the security issues of MCSEM and points out the lack of effective security monitoring methods in the development process of MCSEM for high voltage and high current. The article proposes the application of infrared monitoring systems in MCSEM to achieve real-time visualization of structure and temperature. However, the commonly available infrared devices on the market cannot fully meet the requirements of MCSEM, and there is also a lack of compatible software systems. Hence, starting from the circuit design, we applied electromagnetic interference resistance technology and storage space stacking technology to ensure data stability and security. To adapt to the complex marine environment, we customized variable focal length lenses for infrared sensors and equipped them with high-precision motor systems for control. In terms of embedded software, a three-stage dropout handling algorithm for maritime communication situations was developed, leveraging TCP and UDP parallel technology for gigabit-level data transmission. Upper computer software was developed independently, and data were calibrated based on fundamental theories to ensure reliability. This transformation from point monitoring to area monitoring in MCSEM software has redefined the landscape of monitoring systems in the field in multiple respects. This paper introduces a new approach for monitoring systems in the field of MCSEM, advocating for the use of non-contact infrared technology over traditional contact-based measurements. These advancements can better cater to offshore operations, ensuring the safety of equipment and personnel.
Due to our laboratory policies or confidentiality agreements, we are unable to provide the raw data and code.
CW contributed to the conceptualization, methodology, writing of the original draft, and instrument design. MD provided the initial idea, supervised the project, and oversaw its administration. ZR was responsible for the visualization, data curation, and figure preparation. MW provided the resources, acquired the funding acquisition, and provided overall project support. All of the authors have reviewed and approved the final manuscript and agree to be accountable for all aspects of the work.
The contact author has declared that none of the authors has any competing interests.
Publisher's note: Copernicus Publications remains neutral with regard to jurisdictional claims made in the text, published maps, institutional affiliations, or any other geographical representation in this paper. While Copernicus Publications makes every effort to include appropriate place names, the final responsibility lies with the authors.
This research has been supported by the Dedicated Fund for Marine Economic Development in Guangdong Province (grant no. GDNRC [2023]40), the Natural Science Foundation of China (grant nos. 42374221 and 42327901), and the National Key Technologies R&D Program (grant no. 2022YFC2807900).
This paper was edited by Alessandro Fedeli and reviewed by two anonymous referees.
Constable, S.: Ten years of marine CSEM for hydrocarbon exploration, Geophysics, 75, 75A67–75A81, https://doi.org/10.1190/1.3483451, 2010.
Constable, S. and Srnka, L. J.: An introduction to marine controlled-source electromagnetic methods for hydrocarbon exploration, Geophysics, 72, WA3–WA12, https://doi.org/10.1190/1.2432483, 2007.
Constable, S., Cox, C., and Chave, A.: Offshore electromagnetic surveying techniques, SEG Tech. Prog. Expand. Abstr., 1986, 81–82, https://doi.org/10.1190/1.1892948, 1986.
Deng, M., Wei, W.-B., Sheng, Y., Jing, J.-E., He, S.-Y., Luo, X.-H., and Shi, X.-Y.: Several theoretical points and instrument technology of magnetotelluric data acquisition in deep water, Chin. J. Geophys., 56, 3610–3618, https://doi.org/10.6038/cjg20131102, 2013.
Deng, M., Wang, M., and Wu, W.: Online insulation monitoring technology for a marine controlled source electromagnetic transmitter system, Geophys. Geochem. Explor., 46, 537–543, https://doi.org/10.11720/wtyht.2022.1460, 2022.
Duan, N., Wang, M., Wang, G., Yu, P., Deng, M., and Li, X.: Research on the isolation and collection method of multi-channel temperature and power supply voltage under strong marine controlled source EMI, IEEE Access, 7, 6400–6411, https://doi.org/10.1109/ACCESS.2018.2889887, 2018.
Hermann, A., Chladek, J., and Stepputtis, D.: iFO (infrared Fish Observation) – An open source low-cost infrared underwater video system, HardwareX, 8, e00149, https://doi.org/10.1016/j.ohx.2020.e00149, 2020.
Kasaya, T., Nogi, Y., and Kitada, K.: Advanced magnetic survey system and method for detailed magnetic field mapping near the sea bottom using an autonomous underwater vehicle, Explor. Geophys., 54, 205–216, https://doi.org/10.1080/08123985.2022.2089013, 2023.
Long, G.: Design of a non-contact infrared thermometer, Int. J. Smart Sens. Intell. Syst., 9, 1110–1129, https://doi.org/10.21307/ijssis-2017-928, 2016.
Machado, Á. S., Cañada-Soriano, M., Jimenez-Perez, I., Gil-Calvo, M., Carpes, F. P., Perez-Soriano, P., and Priego-Quesada, J. I.: Distance and camera features measurements affect the detection of temperature asymmetries using infrared thermography, Quant. InfraRed Thermogr. J., 21, 69–81, https://doi.org/10.1080/17686733.2022.2143227, 2024.
Menezes, P. T., Ferreira, S. M., Correa, J. L., and Menor, E. N.: Twenty Years of CSEM Exploration in the Brazilian Continental Margin, Minerals, 13, 870, https://doi.org/10.3390/min13070870, 2023.
Shen, C.-H., Chang, T.-D., and Chen, S.-J.: Modelling and infrared radiation compensation for non-contact temperature measurement, IOP Conf. Ser.-Mater. Sci. Eng., 383, 012023, https://doi.org/10.1088/1757-899X/383/1/012023, 2017.
Sullivan, S. J., Seay, N., Zhu, L., Rinaldi, J. E., Hariharan, P., Vesnovsky, O., and Topoleski, L. T.: Performance characterization of non-contact infrared thermometers (NCITs) for forehead temperature measurement, Med. Eng. Phys., 93, 93–99, https://doi.org/10.1016/j.medengphy.2021.06.002, 2021.
Sun, T., Pei, X., Shan, Y., and Jiang, D.: Submodule switching-state based EMI modeling and mixed-mode EMI phenomenon in MMC, IEEE Trans. Power Electron., 38, 1831–1843, https://doi.org/10.1109/TPEL.2022.3214990, 2022.
Wang, C., Deng, M., Duan, N., Ma, X., and Wang, M.: Research on online data transmission technology in a marine controlled-source electromagnetic transmitter, Geosci. Instrum. Method. Data Syst., 12, 187–200, https://doi.org/10.5194/gi-12-187-2023, 2023.
Wang, M., Zhang, H. Q., Wu, Z. L., Sheng, Y., Luo, X. H., Jing, J. E., and Chen, K.: Marine controlled source electromagnetic launch system for natural gas hydrate resource exploration, Chin. J. Geophys., 56, 3708–3717, https://doi.org/10.6038/cjg20131112, 2013.
Wang, M., Deng, M., Yu, P., Yin, C., Chen, K., and Luo, X.: High-power time-frequency transmission and multi-chain cable multi-component electromagnetic system for deep-water exploration, Chin. J. Geophys., 65, 3664–3673, 2022.
Wang, M., Wu, Z., Yu, P., Deng, M., Ren, Z., and Wang, C.: 2000A class marine controlled source electromagnetic transmitter system, Chin. J. Geophys., 67, 4482–4492, https://doi.org/10.6038/cjg2024S0105, 2024.
Xu, C. S., Wang, M., Zhang, N., and Jiang, Y. L.: Research of MCSEM transmitter remote measure and control technology, Prog. Geophys., 32, 414–420, 2017.
Yu, J. W., Hanafusa, H., and Higashi, S.: Development of a real-time temperature measurement technique for SiC wafer during ultra-rapid thermal annealing based on optical-interference contactless thermometry (OICT), Jpn. J. Appl. Phys., 62, SC1075, https://doi.org/10.35848/1347-4065/acb1bb, 2023.
Zhang, J., Qin, T., Xie, Z., Sun, L., Lin, Z., Cao, T., and Zhang, C.: Design of Airborne Large Aperture Infrared Optical System Based on Monocentric Lens, Sensors, 22, 9907, https://doi.org/10.3390/s22249907, 2022.