the Creative Commons Attribution 4.0 License.
the Creative Commons Attribution 4.0 License.
 | 12 Dec 2025
Real-time plotting and evaluation of the data quality control from the CSIR-NGRI magnetic observatories
Pavan Kumar Vengala
Phani Chandrasekhar Nelapatla
Sai Vijay Kumar Potharaju
Earth's magnetic field, a dynamic shield influenced by internal and external forces, holds critical insights into space weather forecasting and the planet's core dynamics. The Choutuppal (CPL) and Hyderabad (HYB) magnetic observatories in India are pioneering this field by delivering high-resolution geomagnetic data to INTERMAGNET with unprecedented speed and precision. Utilizing a novel, low-cost protocol, CPL transmits 1 s resolution data and HYB provides 1 min data, both achieving a latency of less than 300 s, making CPL one of the first Indian observatories to send 1 s real-time data to GIN (Geomagnetic Information Node). This rapid data transmission enhances global collaboration in space weather prediction, safeguarding critical infrastructure like satellites and power grids from solar storms.
To further elevate data utility, we developed Python-based software for real-time visualization and quality control at both observatories. This tool generates plots, performs initial quality checks, and computes first differences at 1 s and 1 min intervals, with a latency under 300 s. By enabling daily evaluation of data quality, the software facilitates the identification of anomalies and noise, supporting the preparation of quasi-definitive data essential for geomagnetic research. Our Python server and web applications are designed with the future in mind, integrating artificial intelligence (AI) and machine learning (ML) capabilities. These advancements at CPL and HYB are set to transform the processing, forecasting, and visualization of geomagnetic data. By improving both the accuracy and accessibility of these data, we aim to revolutionize geomagnetic research, making it more precise, accessible, and actionable.
- Article
(5847 KB) - Full-text XML
- BibTeX
- EndNote


Geomagnetic observatories are fixed locations on the Earth's surface that continuously monitor the geomagnetic field. The continuous time series data from these observatories reflect various physical processes associated with solar and Earth activities. The reliability and accuracy of the data are crucial for both scientific research and commercial applications (Matzka et al., 2010; Zhang et al., 2016). Each observatory is equipped with at least two tri-axial fluxgates to record variations along with Overhauser magnetometers. Additionally, it has one fluxgate theodolite and Overhauser/proton precession magnetometer for absolute measurements.
The Hyderabad Magnetic Observatory (HYB) of CSIR-NGRI has maintained 60 years of uninterrupted and stable recordings of magnetic variations. In 2009, with upgraded instruments, HYB became an INTERMAGNET observatory. Due to rapid urbanization and the introduction of the Hyderabad Metro Rail project nearby, it became essential to establish an observatory to ensure the continuity of the geomagnetic data series. The campus of the former Choutuppal (CPL) Geo-electric Observatory provided an ideal location for recording magnetic measurements at 1 s intervals. Preliminary 1 min observations began in 2012, and 1 s data recording was initiated in 2015, and the ongoing data collection led to CPL being recognized as an INTERMAGNET observatory in 2019. The high-quality 1 s definitive data from CPL are currently being submitted to INTERMAGNET, making it one of the first observatories in this region to achieve this status (Arora et al., 2016). The HYB and CPL observations have made significant contributions to global data, alongside other observatories worldwide, for the main model of the Earth's magnetic field. These observations have also supported various studies of low-latitude magnetic phenomena (Dwivedi and Chandrasekhar, 2024) and regional induction anomalies (Edara and Arora, 2023).
For any observatory, the quality of the data is very important to achieve and maintain INTERMAGNET status (Clarke et al., 2013). Many scholars have developed various quality control methods for geomagnetic data (Curto and Marsal, 2007, and references therein). Clarke et al. (2013) developed automated data processing software that integrates daily extrapolated baseline values of H, D, and Z, derived from baseline functions, with H, D, and Z variometer data. 1 min data are delivered to the Edinburgh INTERMAGNET Geomagnetic Information Node (GIN) in near-real time and on the following day. After implementing a few procedures, the quality data are prepared and delivered to GIN by running the data processing software in manual mode on the next working day. Phani Chandrasekhar et al. (2017) discussed the challenges involved in measuring 1 s variations in the geomagnetic field to meet the standards set by INTERMAGNET for quality and data transmission at observatories over extended periods. They also provided a detailed account of the progressive steps that led to the successful establishment of these measurements at the CPL observatory. Khomutov et al. (2017) developed a new method for the noise identification in the data at observatories of IKIR FEB RAS (Russia) and CSIR-NGRI (India). They also presented a review of commonly used methods for noise identification in practical situations, highlighting the potential for reducing the impact of noise on data through various examples. He et al. (2022) proposed a method that combines genetic algorithms and linear regression to evaluate geomagnetic data quality. Their approach considers factors such as observational data, attitude angle, scale factor, long-term drift, and temperature. They highlight that agreement among geomagnetic vector observations is crucial for assessing data quality and utilize Bland–Altman plots, applying a 95 % confidence interval to evaluate this agreement quantitatively and qualitatively. Lingala et al. (2022) discussed the observed noticeable differences in the noise levels present in vector and scalar variation data, due to the vehicular noise observed before and during the COVID lockdown period, and also discussed the details of increased data quality in the absence of traffic-generated noise sources. da Silva et al. (2023) developed the Magnetic Observatories and Stations Filtering Tool (MOSFiT), a Python package designed to visualize and filter data from magnetic observatories and magnetometer stations. This tool can also be utilized for quality control of geomagnetic observatory data, similar to the methods implemented by the British Geological Survey as described by Macmillan and Olsen (2013). Several studies have discussed the quality of geomagnetic observatory data and improved protocols for addressing noise in the data (Zhang et al., 2024, and references therein).
Apart from data quality, another important aspect of any geomagnetic observatory is remote site data transfer, which is crucial for various applications, including environmental monitoring and scientific research. All data from INTERMAGNET observatories worldwide are collected by Geomagnetic Information Nodes (GINs), which serve as central points for real-time data collection and are connected to the observatories through satellite, computer, and telephone networks. GINs operate in five different countries: the UK, USA, Japan, Canada, and France. They utilize four satellites, GOES-E, GOES-W, METEOSAT, and GMS to receive real-time data from INTERMAGNET observatories worldwide (https://intermagnet.org/gins.html, last access: 6 June 2025). Although these satellites were used in the past, the preferred way to send data to the GINs now is through the internet, and satellite channels are only used as a backup option.
Numerous observatories around the globe transfer 1 min to 1 s data in real time to various GINs using different technologies. These technologies include satellite communication, ISDN telephone links, FTP, VPN router servers, in-house built NDL HSS, MQTT, and various third-party software and tools (Torta et al., 2009; Clarke et al., 2013; Chulliat and Chambodut, 2014; Thomson, 2014; Gvishiani et al., 2016; Reda and Neska, 2016; Zhang et al., 2016)
Recently, Potharaju and Nelapatla (2022) addressed the challenges of data transmission for both 1 s and 1 min intervals. They detailed the step-by-step development process, algorithm creation, function libraries, and the implementation of real-time data transmission from a remote observatory. Using the Python programming language, they developed an algorithm to automate the transmission of high-resolution real-time magnetic data from CPL and HYB to Edinburgh GIN, all while relying on minimal internet connectivity. The automation system securely transfers data in an encrypted manner using SSH (Secure Shell) keys, while also saving the same dataset on a local server at CSIR-NGRI. Data from both observatories are sent to GIN in real time within a time frame of less than 300 s. After successfully transmitting 1 min geomagnetic data in real time from the CPL and HYB observatories to Edinburgh GIN, the transmission of CPL's 1 s real-time data also commenced. This achievement makes CPL one of the first Indian observatories to send 1 s real-time data to GIN.
In this paper, we outline the processes involved in upgrading the Python tool package that facilitates real-time data quality control checks at the CSIR-NGRI magnetic observatories, HYB and CPL, for both 1 s and 1 min data intervals. Additionally, we discuss the various options for installing and implementing our package, ensuring it integrates smoothly with the available resources for real-time data transmission and quality checks.
The real-time geomagnetic data, both vector and scalar, are initially collected by the MAGREC-4B logger. These data are then transmitted to a local machine running the CentOS operating system, which is deployed at the observatory (CPL/HYB). A secure communication is established via SSH using key-based authentication. Initially, an SSH key pair is generated, and to enhance security, this key is changed every 2 weeks to prevent unauthorized access.
Once the data are received on the CentOS machine, they are processed and prepared for transfer to the centralized server located at the NGRI-HYB Observatory. The secure transfer to the observatory server is conducted using the same SSH protocol, ensuring a robust and encrypted handshake for optimal data integrity and confidentiality. Upon arrival at the NGRI-HYB Observatory server, the collected data are methodically organized based on its temporal granularity. The data are categorized and stored in specific directories, namely “minute data” and “second data”, facilitating organized data management and easy access for analysis.
The segregated data from the HYB server are then prepared for transmission to the INTERMAGNET GIN located in Edinburgh, UK. This transmission process is automated using Python scripts and daemon processes that run in the background. These scripts are designed to execute every 300 s, ensuring timely and regular data updates without duplication. The Python code handles data packaging, error checking, and retransmission logic to ensure reliable data delivery.
Throughout the entire process, various security measures are implemented, including regular updates to SSH keys and continuous monitoring of data transfer processes. Logs are maintained to track data transfer activities and to quickly identify and rectify any anomalies or issues. By employing this comprehensive workflow, the system guarantees secure, efficient, and reliable data transfer from the MAGREC-4B logger to the INTERMAGNET GIN, thereby facilitating continuous monitoring and analysis of geomagnetic data (Potharaju and Nelapatla, 2022).
PHP (Hypertext Preprocessor) (https://www.php.net, last access: 6 June 2025) is a widely used server-side scripting language primarily designed for web development. It is embedded within HTML and executed on the server, generating dynamic content that can be displayed on web browsers. PHP offers flexibility, simplicity, and compatibility with various databases, making it a popular choice for developing interactive and data-driven web applications. Real-time data visualization is essential in various domains, including geomagnetic observatories, seismic monitoring, and IoT applications. PHP, in combination with Plotly (a JavaScript-based visualization library) (https://plotly.com/javascript, last access: 5 June 2025), facilitates the rendering of real-time plots by handling server-side data processing and sending the results to the client.
Since data from both observatories are available in real time, we have developed a PHP server that simultaneously plots the data from both locations. The screen refreshes every 300 s to display the updated trends for each component and continues till the end of the day. This server is designed to initially store a weekday's data at 1 min sampling rate, as illustrated in Fig. 1.
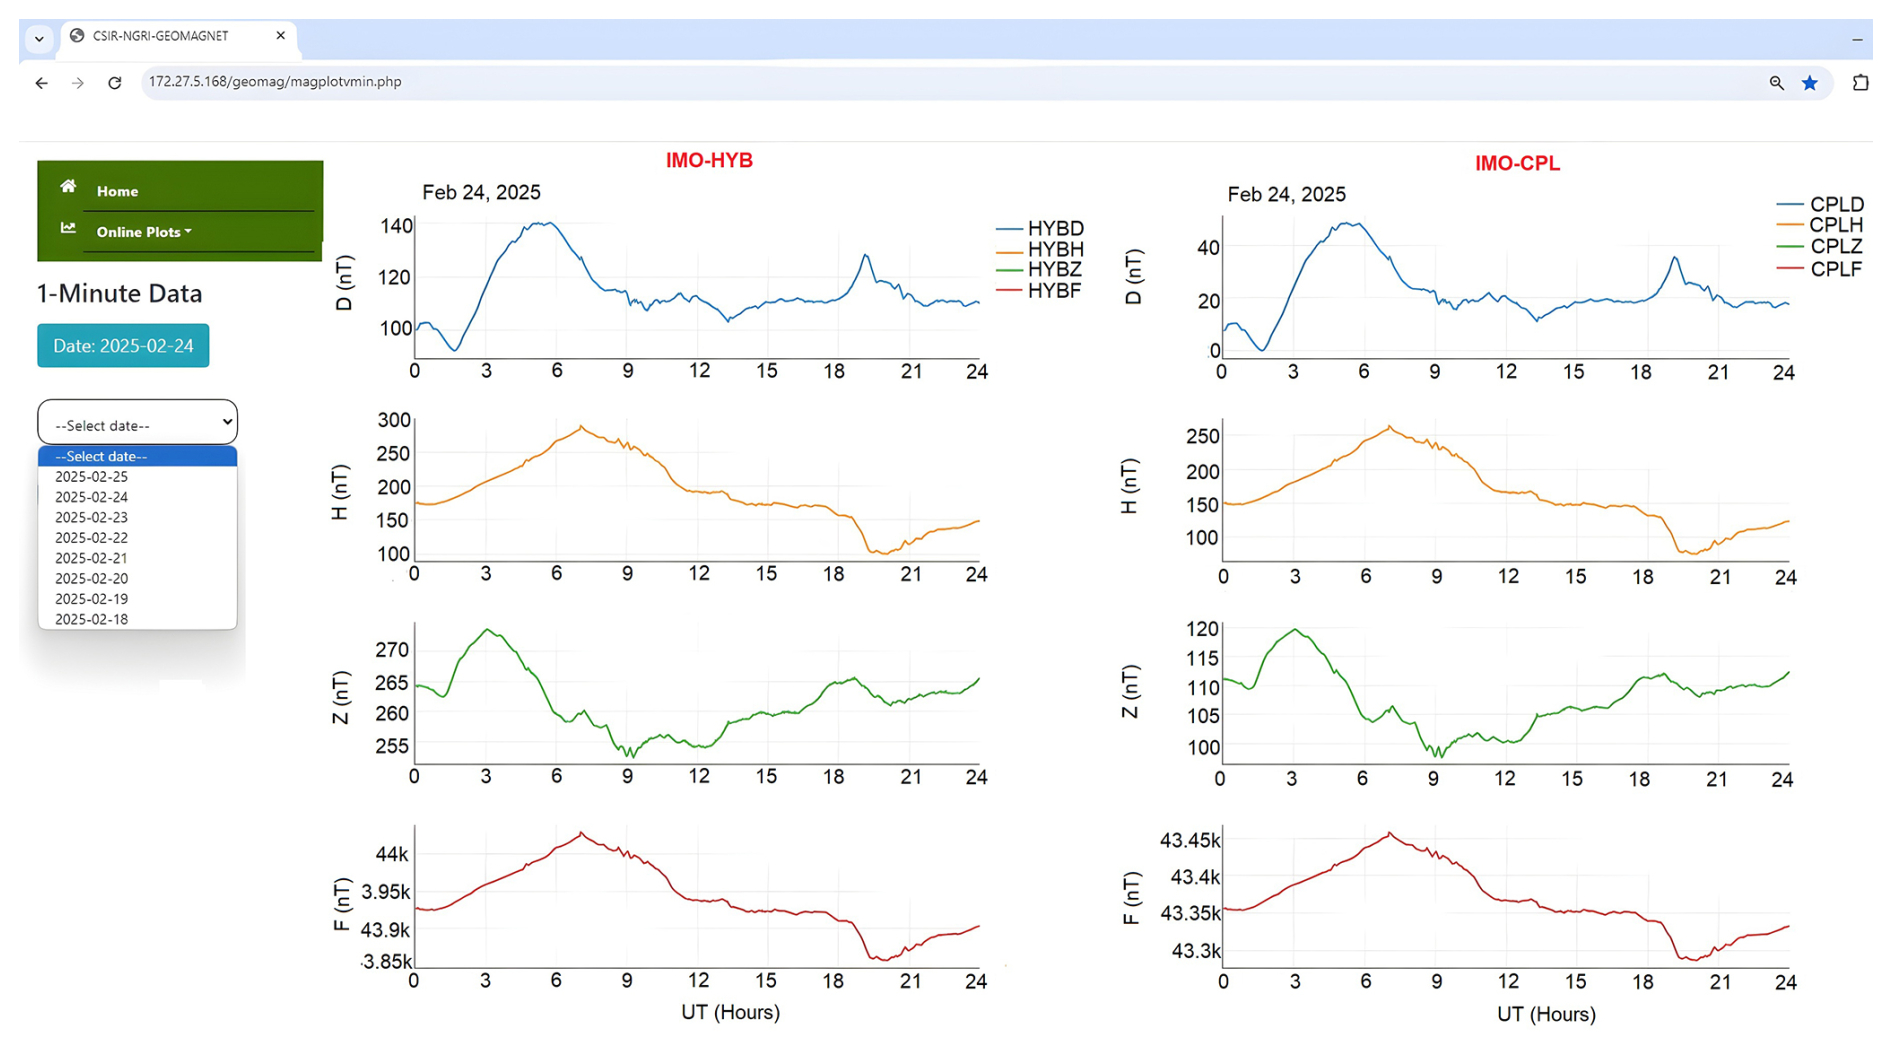
Figure 1Real-time plotting of vector and scalar data at 1 min sampling interval from the HYB (left) and CPL (right) observatories of CSIR-NGRI.
Real-time data visualization is crucial in various fields, including geomagnetism, seismology, seismic, and many other geophysical applications, where continuous monitoring and dynamic plotting are essential. Traditionally, PHP has been a popular choice for web-based data visualization due to its simplicity and widespread usage. However, with the increasing demand for scalability, performance, and flexibility, Python Django (https://www.djangoproject.com/, last access: 6 June 2025) has emerged as a more powerful alternative.
Upgrading from PHP to Django for real-time plotting provides significant advantages in terms of performance, scalability, and maintainability. Django's powerful framework, combined with Python's rich ecosystem, allows efficient handling of large datasets, real-time updates, and seamless integration with machine learning models. Although the migration process involves challenges such as database compatibility and code refactoring, the long-term benefits in flexibility, performance, and extensibility make Django a superior choice for real-time plotting applications.
Django is a high-level Python web framework that promotes rapid development and clean design. Python's libraries (e.g. Pandas, NumPy) enable complex data analysis and enhances the efficient backend processing. Django channels and WebSockets provide low-latency, real-time data streaming. Its ORM (Object-Relational Mapping) simplifies database interactions. Django provides a modular architecture, making the application easier to scale and maintain.
Django, combined with Bokeh (https://bokeh.org/, last access: 6 June 2025), a powerful visualization library, offers an efficient solution for rendering real-time plots. Bokeh's interactive plotting capabilities, when integrated with Django's backend, enable dynamic and responsive data visualizations. Bokeh is a Python library for creating interactive and real-time visualizations,; it generates JavaScript-powered visualizations directly in the browser. It supports streaming data sources for dynamic, live-updating plots. It provides interactive tools like panning, zooming, and hovering functionalities for better data exploration.
With the increasing availability of geomagnetic data from observatories and satellites, AI and ML techniques are transforming the field by enabling the following: (a) real-time monitoring and forecasting of geomagnetic events, (b) anomaly detection for space weather and magnetic storms, (c) data-driven insights for understanding magnetic field variations, and (d) predictive models for geomagnetic hazards.
To achieve the above-mentioned applications, Python offers a robust ecosystem of AI/ML libraries that can be directly integrated into Django-based geomagnetic applications. Django serves as the API layer or backend framework for delivering AI/ML model predictions as web services. Django + Python + AI/ML provides a future-proof, scalable, and efficient framework for geomagnetic data processing, visualization, and prediction. Figure 2 illustrates the schematic diagram of the processes involved in the automated quality control and data transfer pipeline for the HYB and CPL observatories.
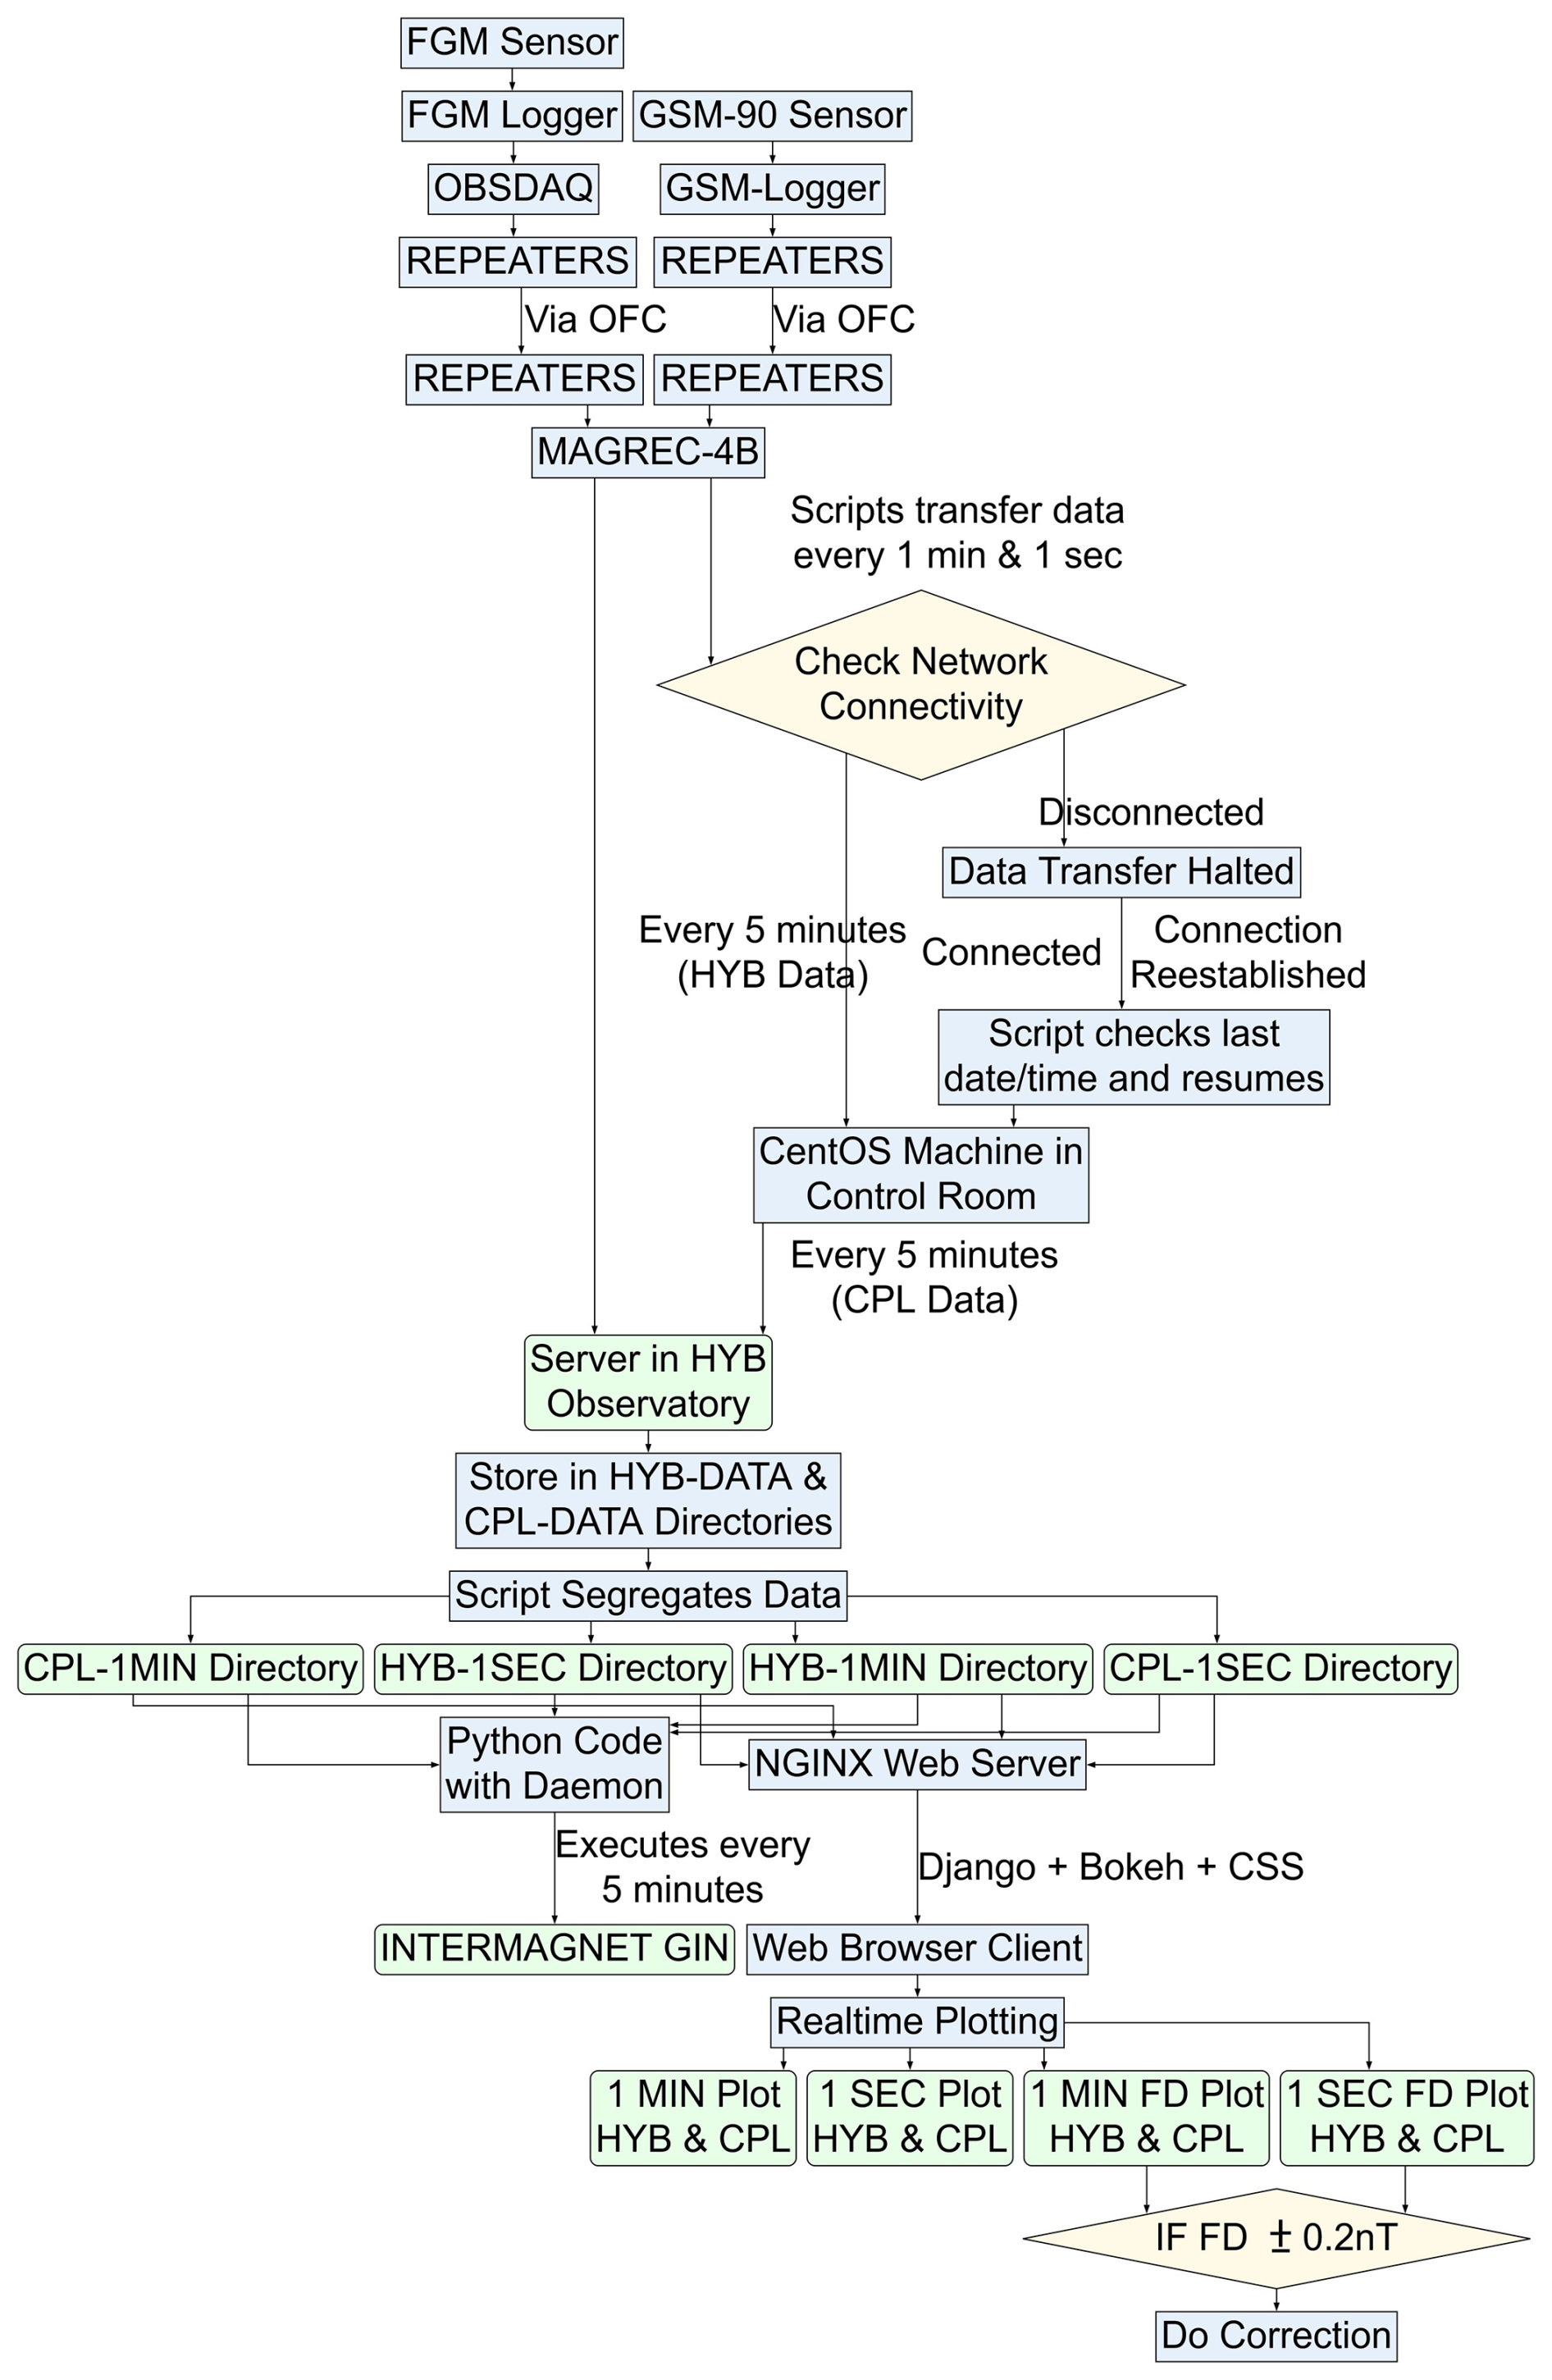
Figure 2Schematic diagram of the processes involved in the automated quality control and data transfer pipeline for the HYB and CPL observatories.
The “first difference” (FD) is a key analytical tool used in time series analysis. It refers to the difference in values between consecutive observations in a dataset. This method helps in identifying patterns, trends, and other dynamic aspects over time more easily in a signal. It is particularly useful for analysing geomagnetic time series data and understanding its evolution. If the difference between two consecutive time periods of a signal is abnormal, it may indicate the presence of noise in the data, often caused by anthropogenic/environmental factors.
We have developed a real-time FD tool in Python that can calculate data for each component of both observatories at 1 s and 1 min intervals, allowing for a quick and hassle-free assessment of data quality. This computation refreshes every 300 s and displays the differences. Here is an example that illustrates the 1 min plot (Fig. 3) and the 1 s plot (Fig. 4) for 7 February 2025, for the HYB (left panel) and CPL (right panel) observatories across each component. We have upgraded the server to include several months of data, enabling users to access the desired day instantly as needed. One example is illustrated in Figs. 3 and 4.
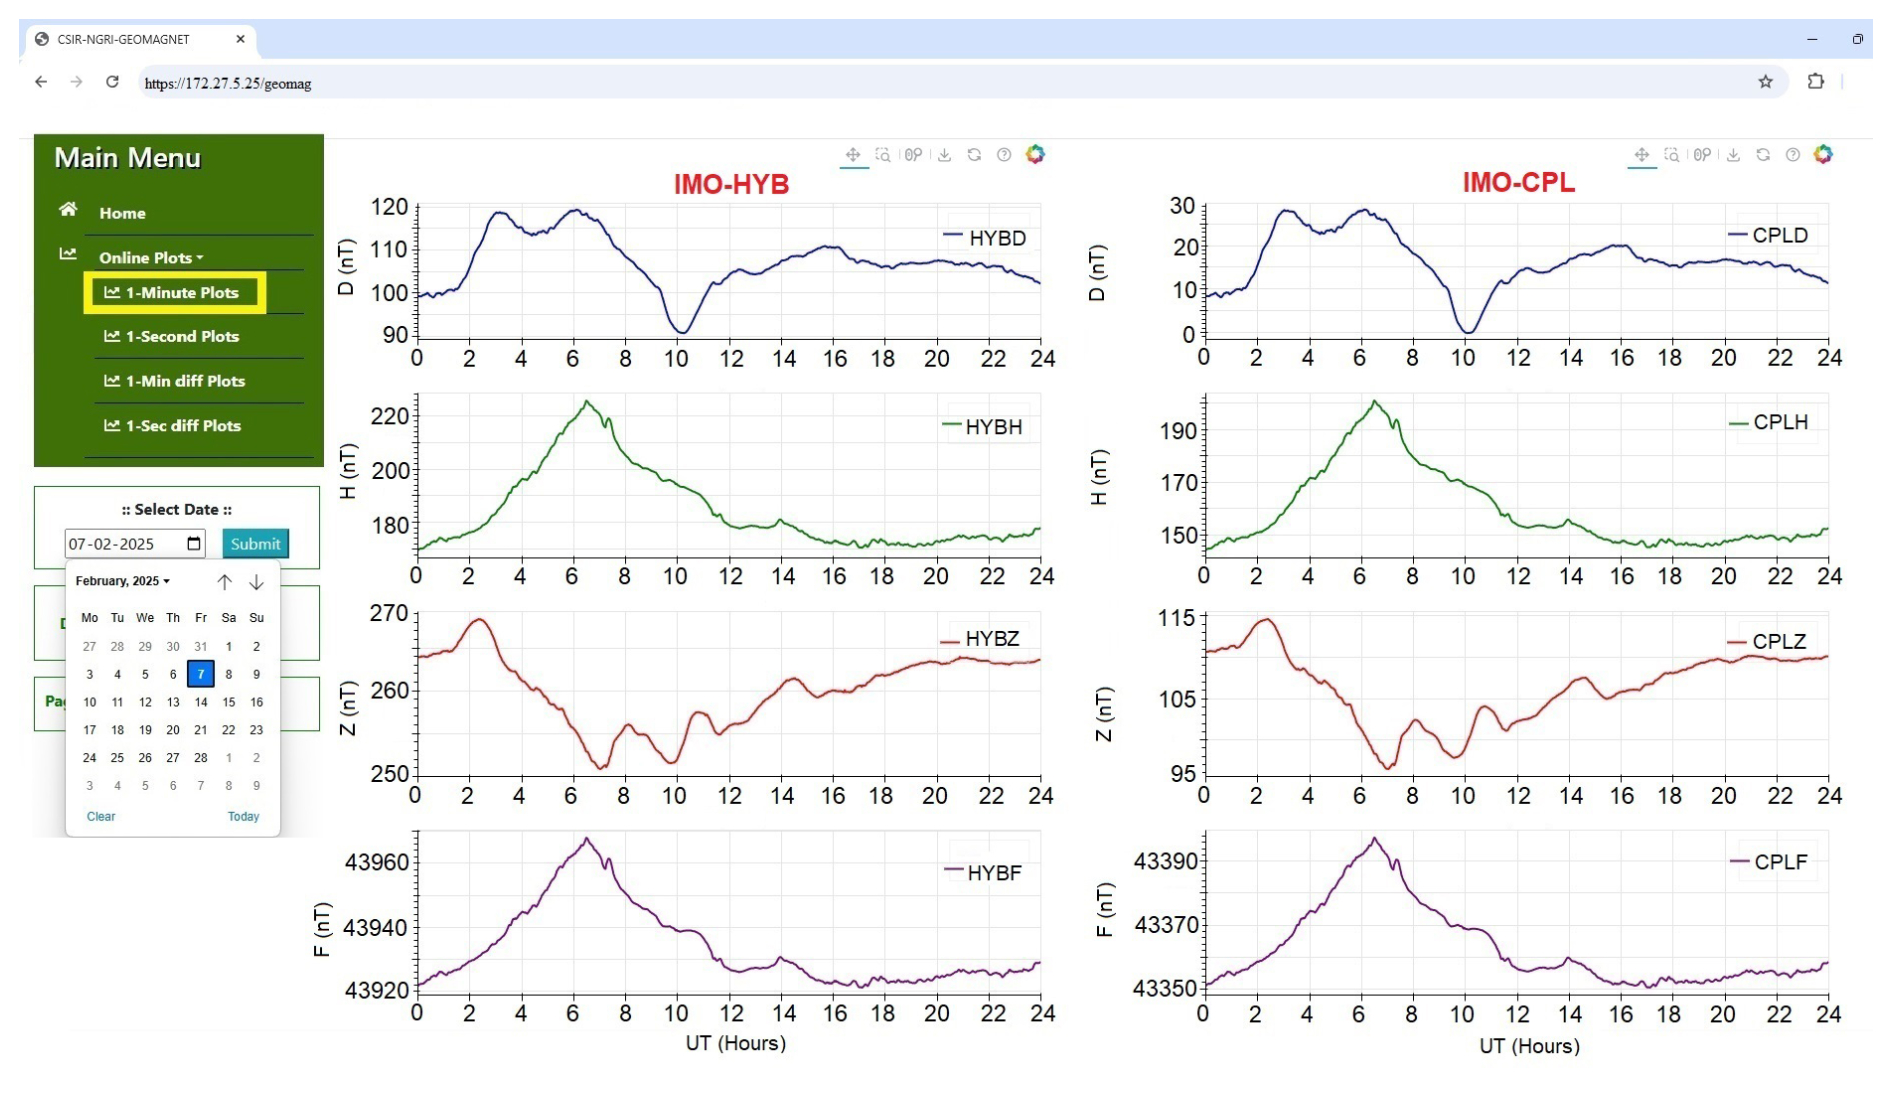
Figure 3Real-time plotting of vector and scalar data at 1 min sampling interval from the HYB (left) and CPL (right) observatories of CSIR-NGRI, with the updated services in the server.
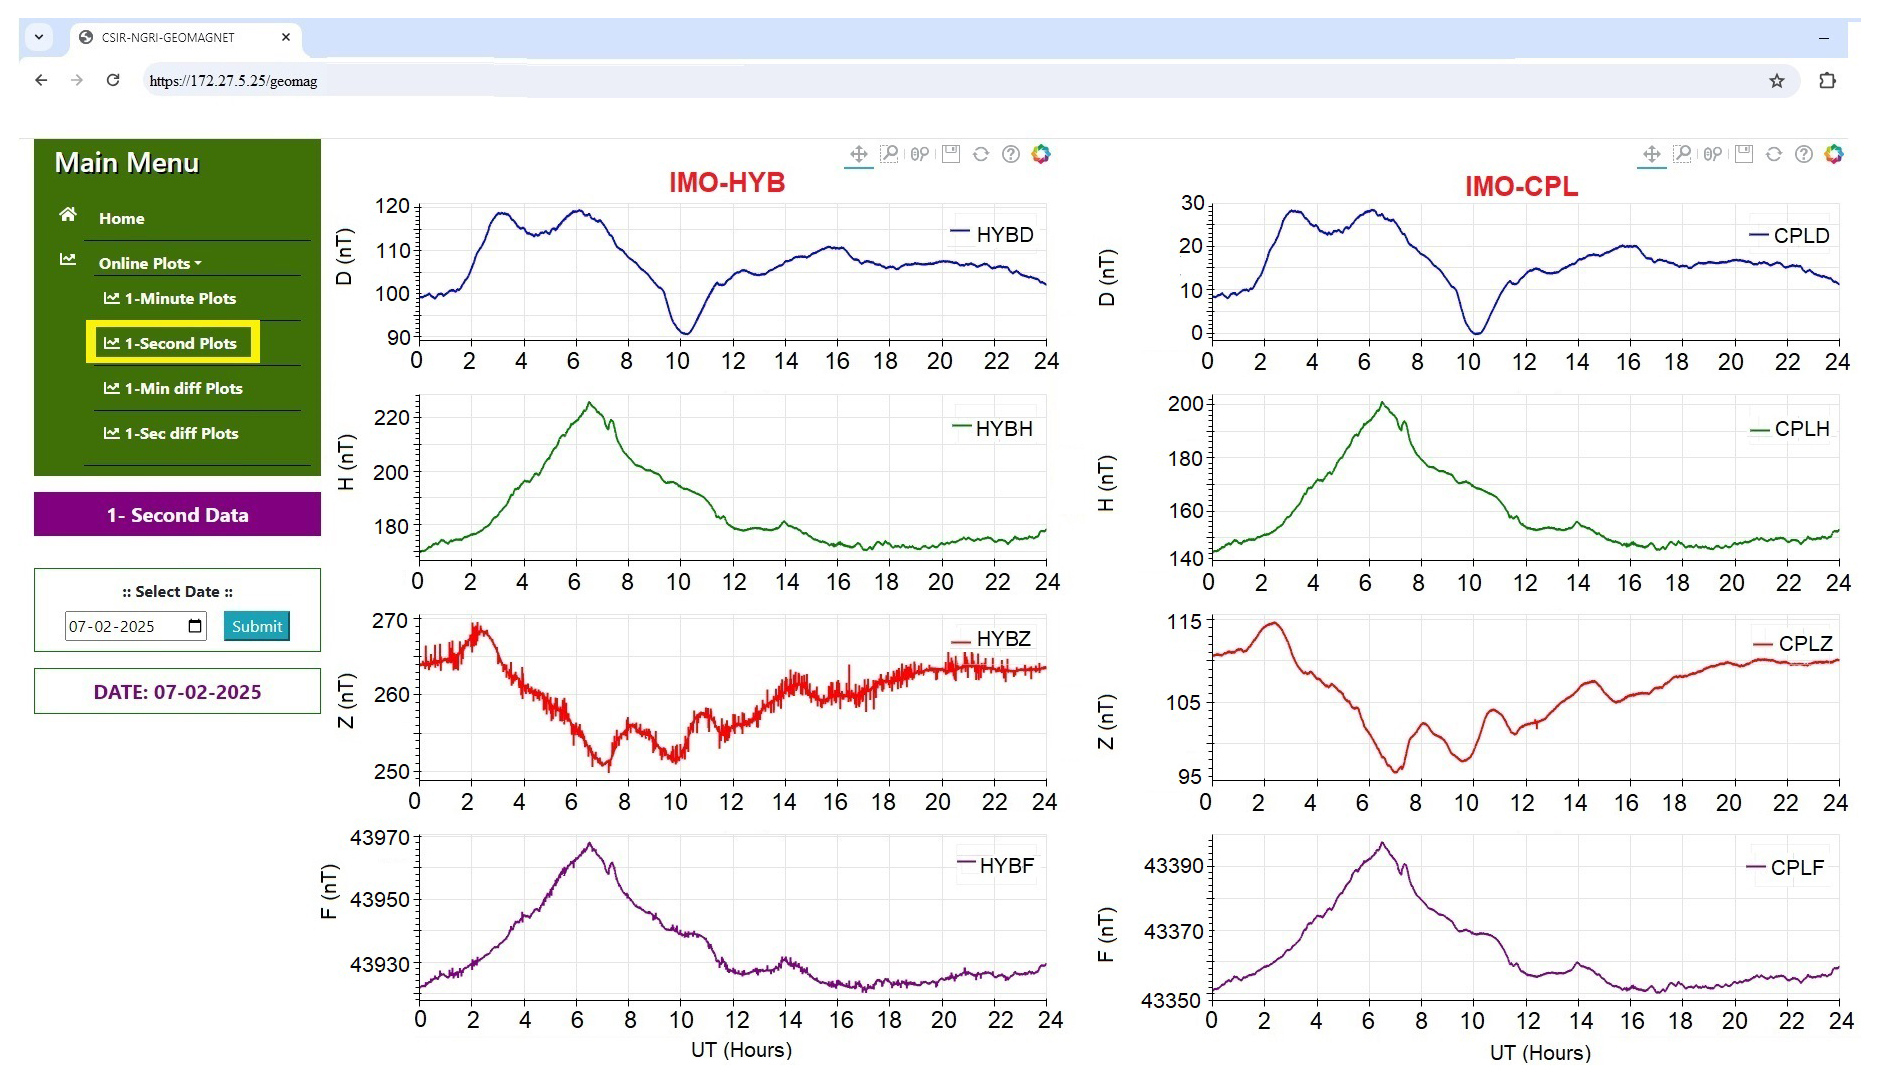
Figure 4Real-time plotting of vector and scalar data at 1 s sampling interval from the HYB (left) and CPL (right) observatories of CSIR-NGRI.
Upon reviewing Figs. 3 and 4, we observe that the noon hours of the day began with a sudden storm commencement (SSC). This term refers to an abrupt increase or decrease in the northward component of the geomagnetic field and indicates the onset of a geomagnetic storm. The SSC event is noted around 07:14 UT at both observatories. In comparison to 1 min, 1 s data exhibit more noise in the Z and F components at HYB than at CPL (Figs. 3 and 4).
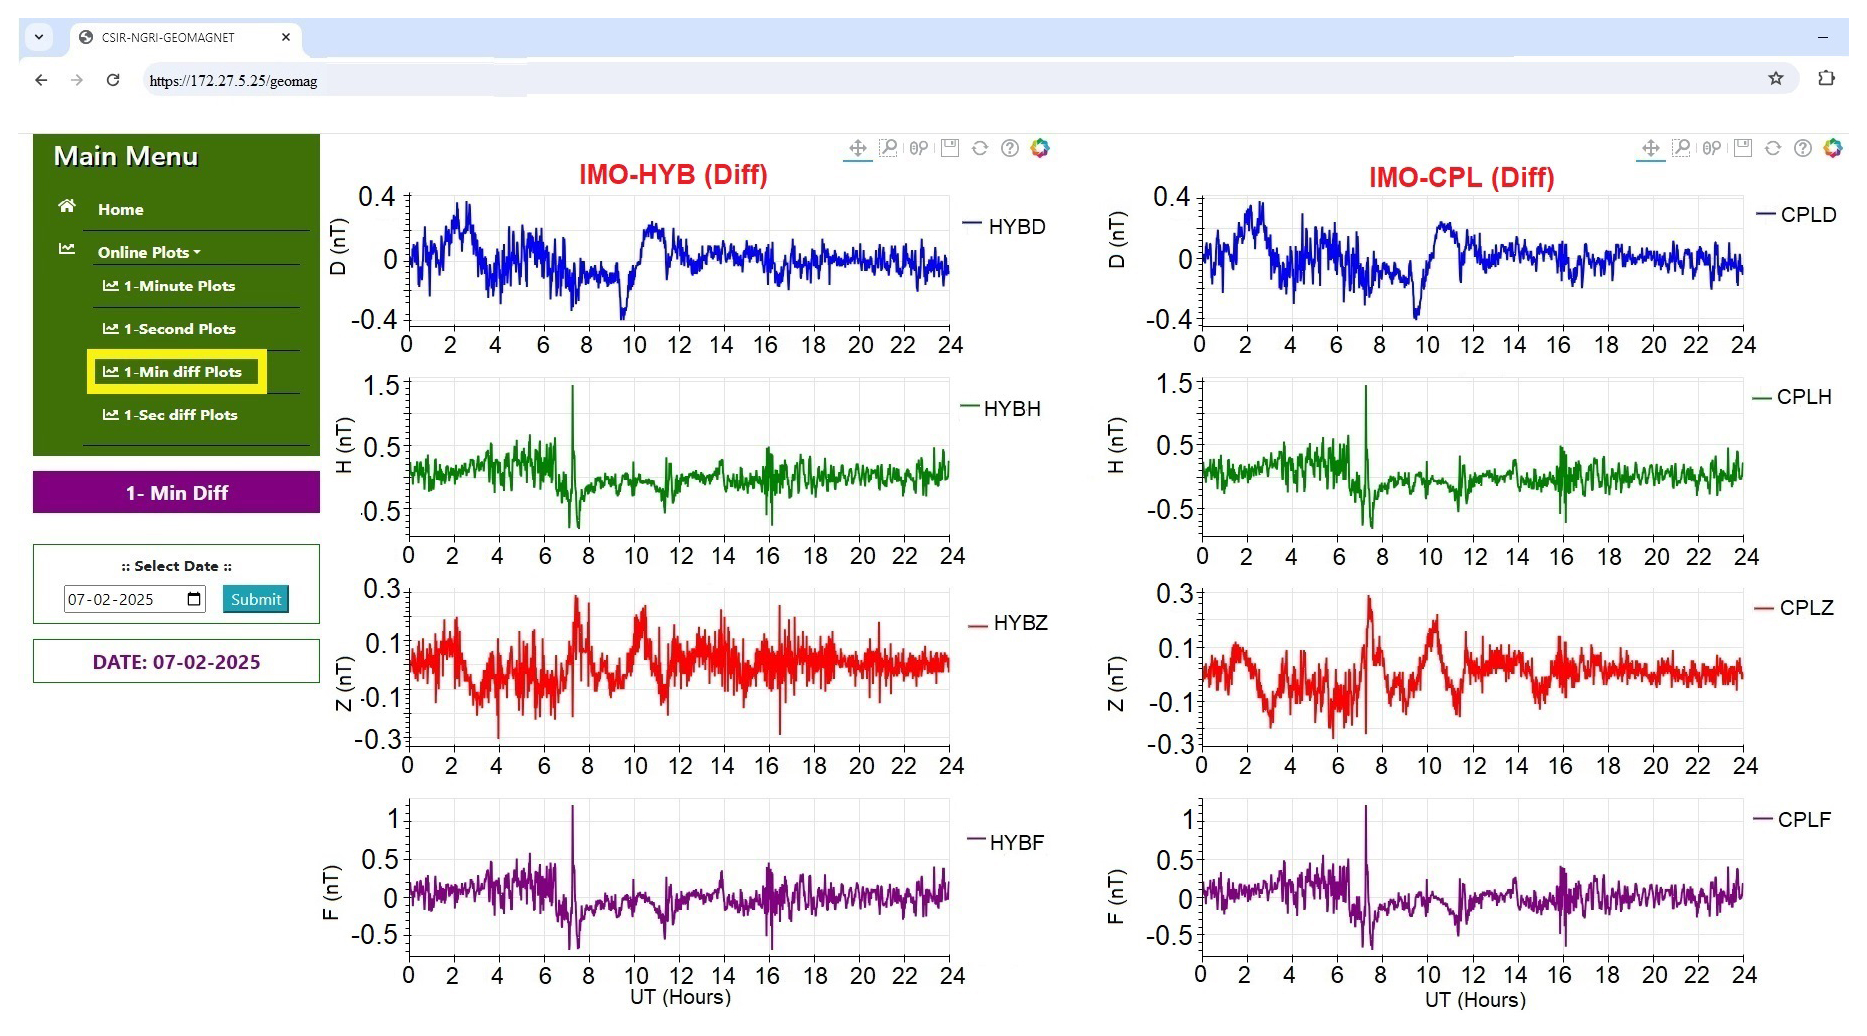
Figure 5Real-time plotting of the first differences of vector and scalar data, sampled every 1 min from the HYB (left) and CPL (right) observatories.
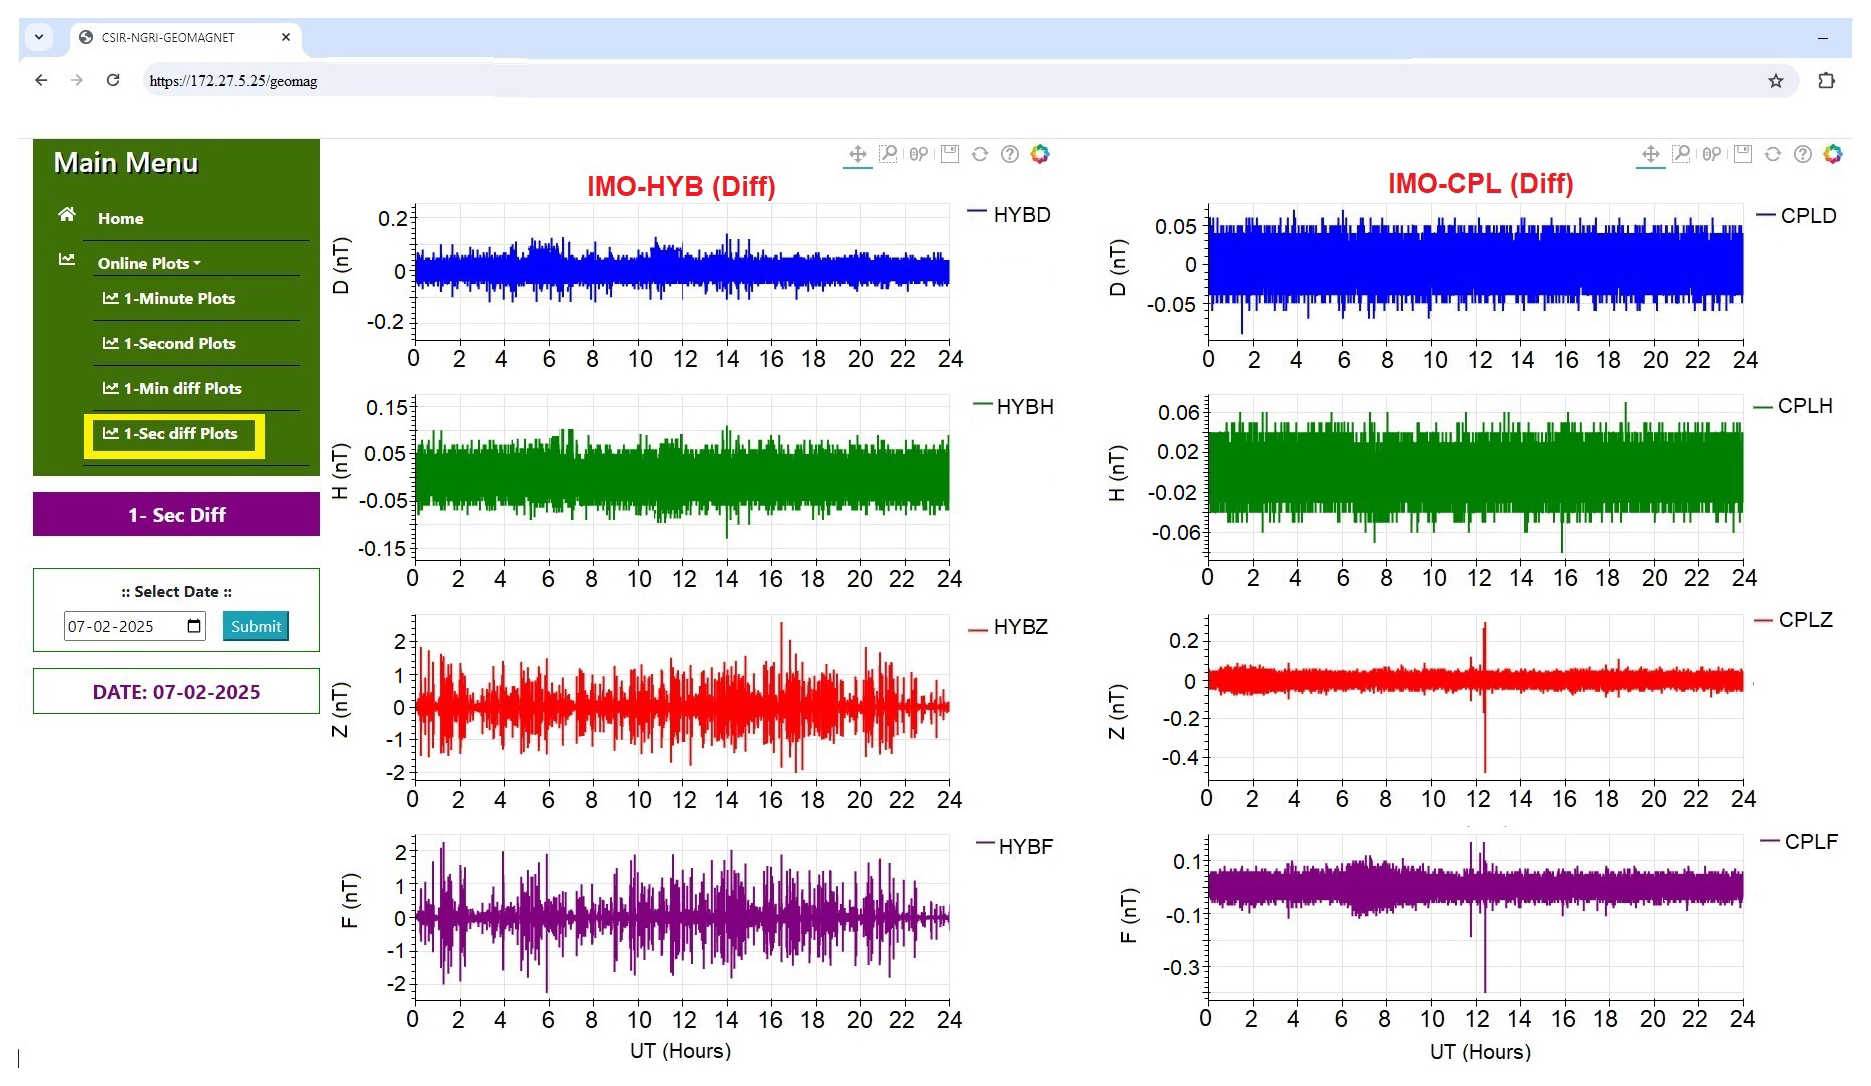
Figure 6Real-time plotting of the first differences of vector and scalar data, sampled every 1 s from the HYB (left) and CPL (right) observatories.
Figures 5 and 6 present the calculated FD of each component at both the HYB and CPL observatories, measured in 1 min and 1 s intervals. From these figures, it is apparent that small amplitude spikes were observed at the CPL observatory, particularly in the Z and F components around (12:21:07 UT, and 12:24:57 UT) during that day. The amplitude of these spikes at CPL is about 0.4 and 1.5 nT. Further, the amplitude of the FDs of all the components is in the range of ±0.5 nT in D, ±1.5 nT in H, ±0.3 in Z, and ±1.5 nT in F for 1 min data and ±0.1 nT in D, ±0.1 nT in H, ±0.5 nT in Z at CPL, ±2 nT in Z at HYB, ±0.5 nT in F at CPL, and ±2 in F at HYB for 1 s data. The next step is treating the spikes by evaluating the source behind the signal. After checking the logs, the spikes recorded at CPL are a result of human intervention related to data collection from the flash card of the spare fluxgate magnetometer deployed in the sensor hut. Hence, the observed spikes at the components (D, H, Z, and F) are removed from the dataset. In contrast, a greater number of spikes were recorded in the Z and F components at the HYB observatory on 7 February 2025. It is important to note that the spikes recorded in the Z and F components at HYB are attributed to vehicular traffic and metro rail operations, as discussed by Lingala et al. (2022). These activities occur regardless of the geomagnetic conditions. Therefore, these data require a treatment of noise removal before it can be submitted as quasi-definitive data. After treating the noise in the data at both observatories, the final data for HYB and CPL for 1 min are shown in Fig. 7.
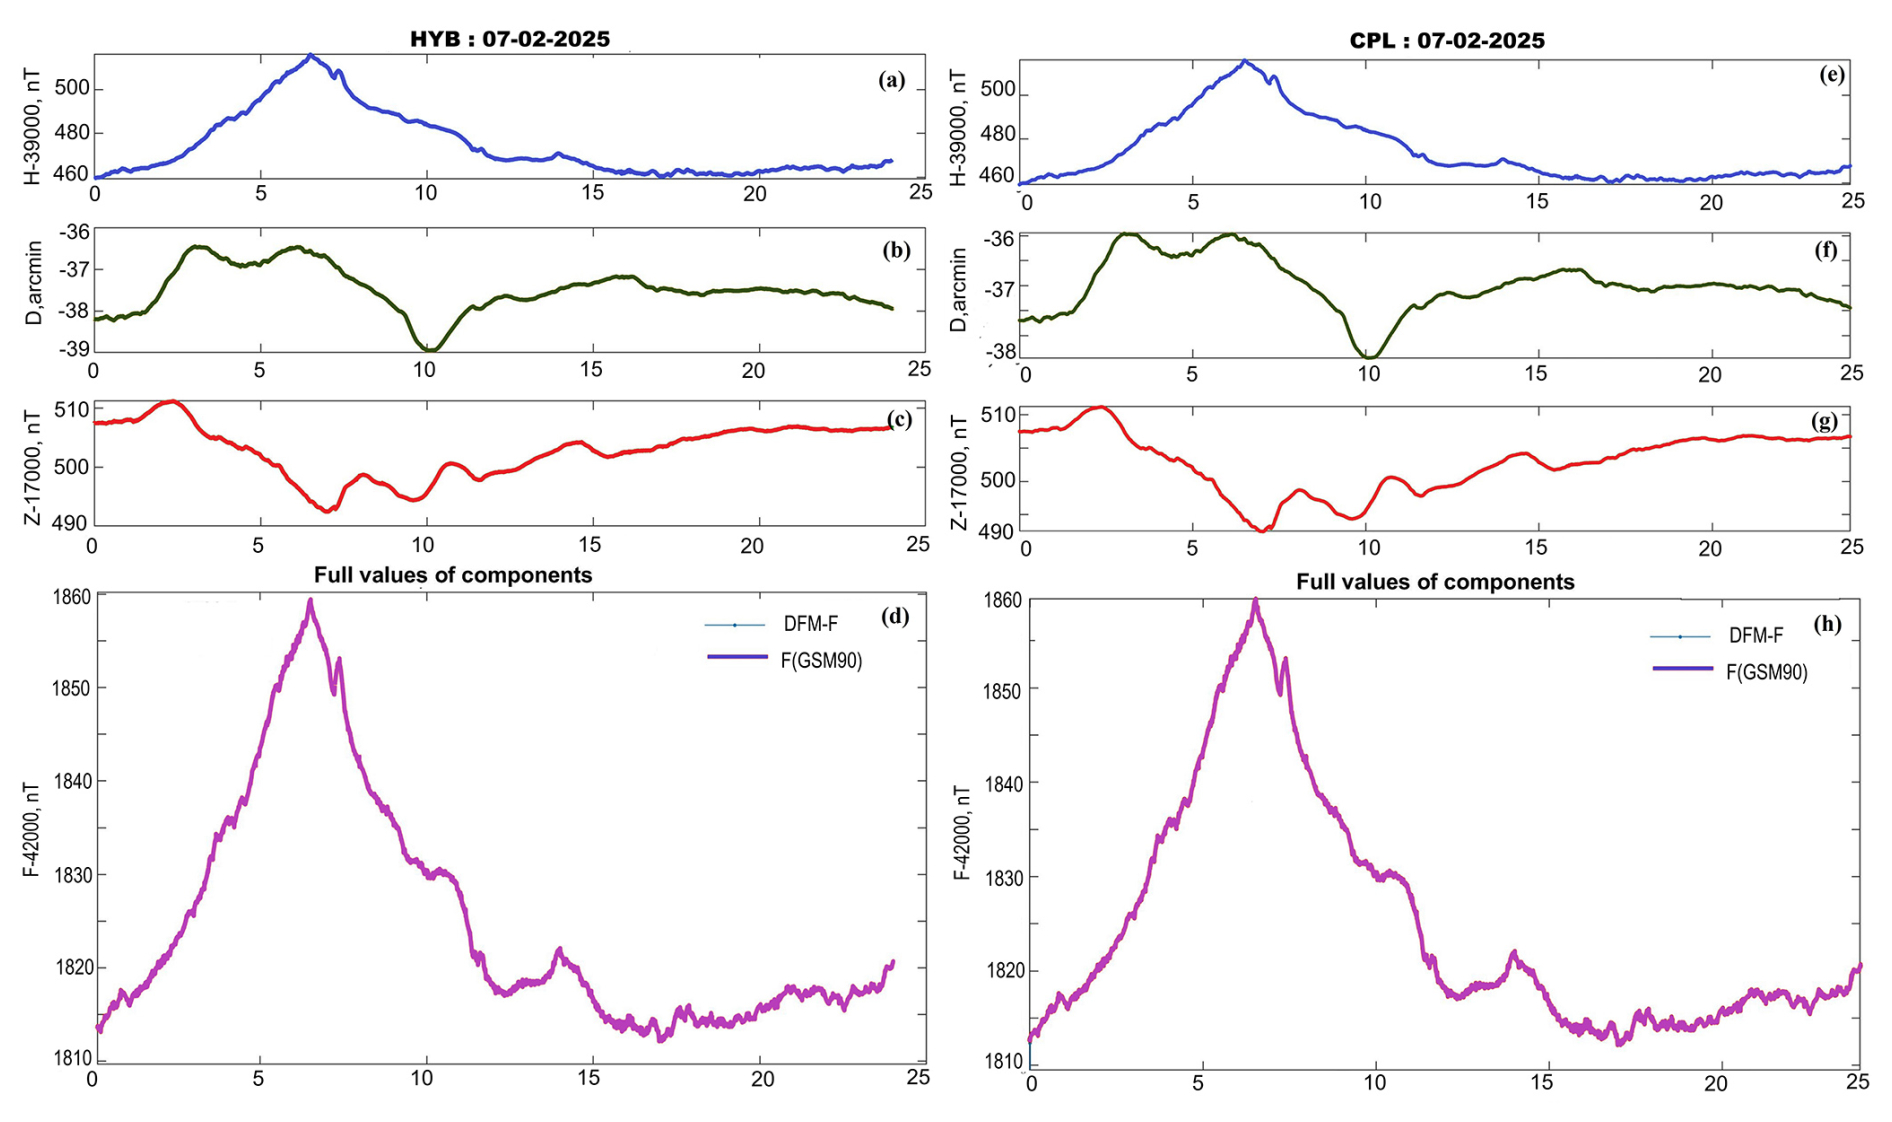
Figure 71 min vector and scalar data from the HYB (left) and CPL (right) observatories after removing spikes identified through real-time first differences.
The plotting page also offers the following tools:
- a.
PAN: This tool allows you to move the view of an image or document around on the screen while maintaining the same zoom level. Essentially, it enables you to “slide” the image to view different parts without zooming in or out.
- b.
Box zoom: This zoom method lets you click and drag to create a rectangular area on the screen, specifying which part of the content you want to zoom in on. This tool is particularly useful for identifying noise in the data.
- c.
Wheel zoom: This tool lets you zoom in and out using the mouse scroll wheel.
- d.
Reset: This tool restores the view to the normal plotting window, removing any box zoom or wheel zoom adjustments.
- e.
Save: This function allows you to download the current plot as a “.png” image format.
CSIR-NGRI currently operates remote sites at various locations: Himalayas, Andaman and Nicobar Islands, and Ladakh. Extending the existing data transfer facility to these remote locations offers several key benefits:
-
Consistency: Ensures uniform data collection and transmission across multiple sites, resulting in consistent and reliable datasets.
-
Scalability: Facilitates easy expansion of the network to include more remote locations without incurring significant additional costs.
-
Resource optimization: Maximizes the use of existing infrastructure and resources, reducing the necessity for redundant systems.
-
Enhanced data insights: Provides a broader range of data, leading to more comprehensive analyses and improved decision-making.
-
Cost efficiency: By utilizing the same setup, organizations can save on costs associated with deploying and maintaining separate systems for each site.
All remote site recording systems are equipped with maintenance-free batteries that are regularly charged by solar panels. We have identified several potential systems for installing the developed Python-based package, which is designed to implement low-cost and effective data transfer techniques and tools, along with real-time quality control checks in the next few months.
A. Techniques
-
LoRaWAN: This low-power, long-range wireless communication technology, that is ideal for remote areas with minimal infrastructure, is cost-effective and suitable for IoT applications.
-
Satellite communication: Using low-Earth-orbit (LEO) satellites can provide reliable internet connectivity in remote locations. Companies like Soracom and Sateliot offer affordable satellite IoT solutions.
-
Store-and-forward systems: Data loggers can store data locally and transfer them when a connection is available. This method is beneficial in areas with intermittent connectivity.
-
High-frequency radio communication: HF radio can be employed for long-distance communication in remote areas, requiring a clear line of sight, and can be a cost-effective solution.
B. Tools
-
Airbyte: This tool supports incremental data synchronization, making it efficient and resource-effective. It primarily runs on Linux-based operating systems, specifically Ubuntu and Debian. Although it can also be deployed using Docker on Windows and macOS, Linux is the preferred operating system.
-
Raspberry Pi with SIM card: This versatile and cost-effective option is equipped with a SIM card to collect and transmit data. It typically runs on Raspberry Pi OS (formerly known as Raspbian), which is based on Debian Linux, but it also supports Ubuntu, Alpine Linux, Arch Linux, and other Linux distributions.
-
Omega2 LTE: This single-board computer (SBC) provides high-speed cellular connectivity with LTE Cat 4 support, making it ideal for remote data transfer. It operates on OpenWRT, a lightweight Linux-based operating system optimized for networking and IoT applications.
-
Libre Computer Board Le Potato: While primarily focused on multimedia applications, this board can be adapted for data transfer using SIM card technology. It mainly runs on Ubuntu, Debian, and Armbian (a lightweight Linux distribution designed for ARM-based SBCs).
-
Orange Pi 5: This board supports multiple Linux-based operating systems, including Ubuntu, Debian, Armbian, and Android. It offers better performance than the Raspberry Pi at a similar price point and is compatible with SIM card technology for data transmission.
Selecting any of the above approaches will enhance the capabilities of CSIR-NGRI's remote operations, ensuring effective data management and communication across challenging environments
Raw magnetic observatory data often contain noise and artefacts that need to be removed or corrected. Pre-processing steps include the removal of spikes, correction for temperature effects, time synchronization, and baseline adjustments. Data quality control is essential to ensure the reliability of the information, involving visual inspections, statistical analyses, and data flagging.
Many researchers prepare quasi-definitive data on a monthly, weekly, or daily basis by incorporating these pre-processing steps and submit their findings to INTERMAGNET GIN. For instance, the IPGP quasi-definitive data method is a monthly process focusing on obtaining the most accurate results for the recent past (Peltier and Chulliat, 2010). The BGS method, while similar, also aims to produce next-day quasi-definitive data using predicted baseline values (Clarke et al., 2013). Both methods are valid for meeting the quasi-definitive data definitions set by INTERMAGNET and offer distinct strengths to benefit various data users. da Silva et al. (2023) introduced the Python package MOSFiT, designed to work with 1 min INTERMAGNET definitive and quasi-definitive data, but it can also be applied to any geomagnetic observatory or magnetometer data. The CSIR-NGRI geomagnetic observatories at HYB and CPL participate in and contribute to INTERMAGNET and submitting quasi and definitive data. Although both observatories are equipped with the same magnetometers, the CPL observatory operates in a noise-free environment, while HYB does not. CPL is India's first observatory to provide 1 s data, whereas HYB offers 1 min real-time data to GIN.
Before processing data to produce quasi-definitive results, it is vital to validate its quality. To address this need, we have developed a Python-based plotting service tool as the first step in our data quality control process. This tool not only monitors real-time trends and continuity in observational data but also includes a dedicated review process to rigorously assess data quality regularly. This ensures the accurate preparation of quasi-definitive data for the observatories. Additionally, the tool has indicators that flag data when the FD values exceed specified thresholds (±0.2 nT), ensuring accuracy and completeness.
Additionally, the specified thresholds (±0.2 nT) are further validated using the Fv-Fs method. This involves calculating the difference between the total magnetic field intensity measured by a vector magnetometer (Fv) and a scalar magnetometer (Fs) at the same location and time. This difference is a critical quality control tool, as it helps detect instrumental biases, calibration errors, or external disturbances in geomagnetic data (Bracke, 2025). At the HYB and CPL observatories, we routinely apply the Fv-Fs method as part of our data validation pipeline to complement the “first differences” method described in the paper. Specifically, our Python-based software for real-time visualization and quality control includes a dedicated module that computes Fv-Fs differences for both 1 s and 1 min geomagnetic data. This module flags discrepancies exceeding predefined thresholds (e.g. ±0.2 nT), which are then reviewed to identify and mitigate noise or artefacts before publishing quasi-definitive data. The focus on the “first differences” method in the paper was driven by its effectiveness in detecting rapid anthropogenic disturbances, which are prevalent at HYB and CPL due to their proximity to urban environments (Phani Chandrasekhar et al., 2017).
Our Python-based tool can be installed on various client-side devices, including LoRaWAN, data loggers, Airbyte, Raspberry Pi, Omega2 LTE, Libre Computer Board Le Potato, and Orange Pi 5. These devices are suitable for deployment in remote locations with limited power availability. On the server side, the system can be configured to connect to a workstation or server to receive data in real time. The establishment of this real-time quality control system significantly enhances the data quality from both permanent and remote observatory sites, providing reliable support for related scientific research.
Further, our Python-based server is designed to provide a robust ecosystem of AI/ML libraries that can be seamlessly integrated into Django-based geomagnetic applications. Django serves as the API layer and backend framework for delivering AI/ML model predictions as web services. The combination of Django, Python, and AI/ML creates a future-proof, scalable, and efficient framework for processing, visualizing, and predicting geomagnetic data. The website shown in the paper is currently inaccessible, but it is accessible within the institute. We plan to make this website available for public access in the future.
High-quality magnetic observatory data are vital for understanding the Earth's magnetic field. Observatories in exceptional locations provide valuable long-term data, but assessing data quality requires expertise and can be time-consuming. Producing reliable geomagnetic data is challenging, especially for institutions with limited staff. Rising operational costs can make it difficult to secure necessary funding. Despite these hurdles, many scientific publications rely heavily on high-quality absolute magnetic observatory data.
We have developed a Python-based tool to assist observatory staff in identifying noise in data, which will help reduce their workload. In the future, we plan to create a scalable framework for processing, visualizing, and predicting geomagnetic data using Django, Python, and AI/ML technologies. Additionally, we have established a cost-effective data transfer system that enables reliable data collection and analysis from remote locations without imposing significant financial burdens, thereby benefiting organizations with limited budgets.
The software codes can be accessed at https://github.com/pa1kumarv/geomag (last access: 4 September 2025) (https://doi.org/10.5281/zenodo.17276224; National Geophysical Research Institute, 2025).
The results presented in this paper rely on the data collected at HYB and CPL observatories. We thank CSIR-NGRI for supporting its operation and INTERMAGNET for promoting high standards of magnetic observatory practice (https://www.intermagnet.org/, last access: 6 June 2025). These observatories' data can be downloaded by selecting the respective observatory (CPL/HYB) in the search option and providing a valid e-mail ID to download the data. Any further material information will be available from the corresponding author on request and https://doi.org/10.5281/zenodo.17086424 (Techel et al., 2025).
VPK, NPCS, and PSVK wrote the manuscript and reviewed the article, and NPCS prepared the figures.
The contact author has declared that none of the authors has any competing interests.
Publisher’s note: Copernicus Publications remains neutral with regard to jurisdictional claims made in the text, published maps, institutional affiliations, or any other geographical representation in this paper. While Copernicus Publications makes every effort to include appropriate place names, the final responsibility lies with the authors.
This article is part of the special issue “Geomagnetic observatories, their data, and the application of their data”. It is a result of the XXth IAGA Workshop on Geomagnetic Observatory Instruments, Data Acquisition, and Processing , Vassouras, Brazil, 30 October–6 November 2024.
The authors thank the Director of CSIR-National Geophysical Research Institute (Hyderabad) for the support and permission to publish this work (NGRI/Lib/2025/Pub-45). The authors wish to thank Kusumita Arora for her constant encouragement and permission to carry out this research work.
This paper was edited by Anne Neska and reviewed by two anonymous referees.
Arora, K., Chandrashakhar Rao, K., Manjula, L., Suraj, K., and Nagarajan, N.: The new magnetic observatory at Choutuppal, Telangana, India, J. Ind. Geophys. Union, Special Volume 2, 67–75, https://iguonline.in/journal/Spl2_aiga_web%20files/iaga-all%20papers1.pdf (last access: 6 June 2025), 2016.
Bracke, S. (Ed.): INTERMAGNET Operations Committee and Executive Council, INTERMAGNET Technical Reference Manual, Version 5.2.0, https://tech-man.intermagnet.org/_/downloads/en/stable/pdf/ (last access: 31 May 2025), 2025.
Chulliat, A. and Chambodut, A.: Bureau Central de Magnétisme Terrestre Strategic Plan 2014–2018, 1–23, https://www.bcmt.fr/pdf/2014-2018-bcmt-strategic-plan.pdf (last access: 6 June 2025), 2014.
Clarke, E., Baillie, O., Sarah Reay, J., and Chris Turbitt, W.: A method for the near real-time production of quasi-definitive magnetic observatory data, Earth Planet. Space, 65, 1363–1374, https://doi.org/10.5047/eps.2013.10.001,2013.
Curto, J. J. and Marsal, S.: Quality control of Ebro magnetic observatory using momentary values, Earth Planet. Space, 59, 1187–1196, https://doi.org/10.1186/BF03352066, 2007.
da Silva, M. V., Pinheiro, K. J., Ohlert, A., and Matzka, J.: Analysis of geomagnetic observatory data and detection of geomagnetic jerks with the MOSFiT software package, Geosci. Instrum. Method. Data Syst., 12, 271–283, https://doi.org/10.5194/gi-12-271-2023, 2023.
Dwivedi, D. and Chandrasekhar, N. P.: Geomagnetic field variations due to solar tides at the Indian Observatories, Earth Planet. Space, 76, 61, https://doi.org/10.1186/s40623-024-01996-8, 2024.
Edara, A. and Arora, K.: Annual/Seasonal Variation in Induction Vectors at Different Geological Locations in an Indian Sector, Pure Appl. Geophys., 180, 3527–3543, https://doi.org/10.1007/s00024-023-03333-8, 2023.
Gvishiani, A., Soloviev, A., Krasnoperov, R., and Lukianova, R.: Automated hardware and software system for monitoring the Earth's magnetic environment, Data Sci. J., 15, 1–24, https://doi.org/10.5334/dsj-2016-018, 2016.
He, Z., Hu, X., Teng, Y., Zhang, X., and Shen, X.: Data agreement analysis and correction of comparative geomagnetic vector observations, Earth Planet. Space, 74, 29, https://doi.org/10.1186/s40623-022-01583-9, 2022.
Khomutov, S. Y., Mandrikova, O. V., Budilova, E. A., Arora, K., and Manjula, L.: Noise in raw data from magnetic observatories, Geosci. Instrum. Method. Data Syst., 6, 329–343, https://doi.org/10.5194/gi-6-329-2017, 2017.
Lingala, M., Phani Chandrasekhar, N., and Arora, K.: Evaluating the Effect of Noise from Traffic on HYB Magnetic Observatory Data during COVID-19 Lockdown, Appl. Sci., 12, 2730, https://doi.org/10.3390/app12052730, 2022.
Macmillan, S. and Olsen, N.: Observatory data and the Swarm mission, Earth Planet. Space, 65, 1355–1362, https://doi.org/10.5047/eps.2013.07.011, 2013.
Matzka, J., Chulliat, A., Mandea, M., Finlay, C., and Qamili, E.: Geomagnetic observations for main field studies: from ground to space, Space Sci. Rev., 155, 29–64, https://doi.org/10.1007/s11214-010-9693-4, 2010.
National Geophysical Research Institute: GEOMAG, Zenodo [code], https://doi.org/10.5281/zenodo.17276224, 2025.
Peltier, A. and Chulliat, A.: On the feasibility of promptly producing quasi-definitive magnetic observatory data, Earth Planet. Space, 62, e5–e8, https://doi.org/10.5047/eps.2010.02.002, 2010.
Phani Chandrasekhar, N., Potharaju, S. V. K., Arora, K., Kasuba, C. S. R., Rakhlin, L., Tymoshyn, S., Merenyi, L., Chilukuri, A., Bulusu, J., and Khomutov, S.: One second vector and scalar magnetic measurements at the low-latitude Choutuppal (CPL) magnetic observatory, Geosci. Instrum. Method. Data Syst., 6, 547–560, https://doi.org/10.5194/gi-6-547-2017, 2017.
Potharaju, S. V. K. and Nelapatla, P. C.: Development of a robust real-time synchronized data transmission technique from a magnetic observatory to an INTERMAGNET GIN, Sci., 12, 10277, https://doi.org/10.1038/s41598-022-13820-y, 2022.
Reda, J. and Neska, M.: The one second data collection system in Polish geomagnetic observatories. J. Ind. Geophys. Union Spec., 2, 62–66, 2016.
Techel, F., Müller, K., and Mitterer, C.: Data for Publication: The EAWS Matrix, a Decision Support Tool to Determine the Regional Avalanche Danger Level (Part A): Conceptual Development, Natural Hazards Earth System Sciences, Zenodo [data set], https://doi.org/10.5281/zenodo.17086424, 2025.
Thomson, A. W. P. (Ed.): Geomagnetism Review, 1–34, British Geological Survey, 2015, https://nora.nerc.ac.uk/id/eprint/19355/1/OR12056.pdf (last access: 6 June 2025), 2014.
Torta, J. M., Marsal, S., Riddick, J. C., Vilella, C., Altadill, D., Blanch, E., Cid, O., Curto, J. J., de Santis, A., Gaya-Piqué, L. R., Mauricio, J., Pijoan, J. L., Solé, J. G., Ugalde, A. : An example of operation for a partly manned Antarctic Geomagnetic Observatory and the development of a radio link for data transmission, Ann. Geophys., 52, 45–56, https://doi.org/10.4401/ag-4572, 2009.
Zhang, S., Fu, C., He, Y., Yang, D., Qi. L., Zhao, X., and Wang, J.: Quality Control of Observation Data by the Geomagnetic Network of China, Data Sci. J., 15, 1–12, https://doi.org/10.5334/dsj-2016-015, 2016.
Zhang, S., Fu, C., Zhao, X., Zhang, X., He, Y., Li, Q., Chen, J., Wang, J., and Zhao, Q.: Strategies in the Quality Assurance of Geomagnetic Observation Data in China, Data Sci. J., 23, 1–11, https://doi.org/10.5334/dsj-2024-009, 2024.
- Abstract
- Introduction
- Real-time data transfer to INTERMAGNET GIN
- Customization of the PHP server for real-time data visualization
- Upgrading the PHP server to a Python server
- First difference tool for real-time data quality checks
- The essence of extending the Python-based facility to remote sites
- Summary
- Conclusions
- Code availability
- Data availability
- Author contributions
- Competing interests
- Disclaimer
- Special issue statement
- Acknowledgements
- Review statement
- References