the Creative Commons Attribution 4.0 License.
the Creative Commons Attribution 4.0 License.
 | 17 Dec 2025
High-speed infrared thermography for measuring flash temperatures in sheared fault gouge analogues
André Rik Niemeijer
Flash temperatures induced by flash heating can lead to thermal softening or decomposition of fault-zone materials at microscopic grain contacts and, consequently, cause a rapid reduction in fault strength during seismic slip. To quantify the efficiency of short-term frictional heating at the contact scales and its impact on the mechanical fault strength, we conducted rotary-shear friction experiments on Ottawa quartz sand “gouges” with variable grain sizes of 250–710 µm at a range of normal stresses of 1–7.5 MPa and slip velocities of 1–50 mm s−1 under room-dry and wet conditions. We employed a high-speed infrared camera to monitor temperature fluctuations along the outer circumference of the ring-shaped gouge layer during sliding, utilizing a frame rate of up to 1200 Hz with a spatial resolution of 15 µm to capture flash temperature occurring at asperity contacts. We show that flash temperature can be captured within the gouge layer in both room-dry and wet conditions with a peak value up to ∼ 220 and ∼ 100 °C, respectively. In addition, the flash temperature increases with increasing slip velocity and grain size, while decreasing at higher normal stress, which is likely associated with enhanced grain size reduction. In our study, we showed that flash temperatures in shearing fault gouges can be constrained using a fast thermal camera. Although difficulties remain in the experimental set-up related to the need to confine the gouge layer and to the evolution of contact size due grain size reductions, the trends in maximum temperatures we observed agree with those predicted from theory.
- Article
(11286 KB) - Full-text XML
- BibTeX
- EndNote


Characterizing temperature rise from frictional sliding is crucial to understanding the thermally activated mechanisms that cause faults to weaken during coseismic slip and associated earthquake rupture propagation (Rice, 2006). Several theoretical and experimental studies have proposed various dynamic weakening mechanisms, depending on fault rock composition and experimental conditions, to account for the reduction in friction coefficient seen when sliding velocities approach seismic slip rates (V > 0.01 m s−1; see Di Toro et al., 2010; Niemeijer et al., 2012, and Tullis, 2015 for summaries). Among these weakening mechanisms, flash heating at highly stressed asperity contacts is believed to be one of the main mechanisms causing dramatic weakening at the onset of rock-on-rock slip (e.g. Goldsby and Tullis, 2011; Kohli et al., 2011; Spagnuolo et al., 2015) and shearing of gouge materials (e.g. Yao et al., 2016a, b). So far, the inferred role of flash heating and weakening is generally based on predictions using a flash-heating model (Beeler et al., 2008; Brantut and Platt, 2017; Proctor et al., 2014; Rice, 2006; Yao et al., 2018) and/or the microstructural evidence of thermal softening (e.g. local melting) at asperity contact scales (e.g. Acosta et al., 2018). Recent studies using laboratory friction experiments by Saber (2017) and Barbery et al. (2021, 2023) have shown that surface temperature increases at contact points on sliding surfaces between Westerly granite blocks, under room-dry conditions, can be successfully captured by employing a high-speed infrared camera (a frame rate of 300 Hz and a resolution of 75 µm). These authors documented that flash temperatures and stress distribution are highly heterogeneous at the rock-on-rock interface during seismic slip. In addition, no evidence of dynamic weakening was detected, as the measured surface temperatures did not approach the weakening temperature inferred for granite (∼ 800 °C). This may also reflect wear processes that reduce local normal stresses and increase the true contact area during slip, thereby suppressing conditions favorable for flash heating. Currently, experimental constraints on flash temperatures in a sheared granular gouge layer are lacking. In particular, direct detection of thermal signals, from flash heating occurring within a shearing gouge layer, remains challenging due to difficulties with gouge confinement, the small scale of grain contact asperities (≪ 1 mm), and short contact lifetimes (ms).
In an attempt to make new progress, we developed an experimental setup, with a high-speed infrared camera, that allows us to acquire in-situ thermal images across the entire thickness of the gouge layer during rapid shearing under room-dry and wet conditions. In this study, we aim to experimentally characterize the dependence of peak flash temperature on normal stress, slip velocity, and grain size to better understand how flash heating is influenced by these variables, and to assess whether the results are consistent with the predictions of previous theoretical analyses (Rice, 2006; Proctor et al., 2014; Brantut and Platt, 2017).
2.1 Starting materials
We used ASTM standard C778 Ottawa quartz sand obtained from the U.S. Silica Company (Ottawa, IL, USA) as starting materials. The materials contain a SiO2 content of 99.7 wt %, minor quantities of Al2O3 (0.06 wt %), Fe2O3 (0.02 wt %), and TiO2 (0.01 wt %). Scanning electron microscopy showed that most sand grains are well-rounded, with smooth surfaces characterized by pressure solution indentations and quartz overgrowths (Hangx and Brantut, 2019). We prepared four fractions of the sand with grain sizes of 250–300, 300–425, 425–500, and 500–710 µm by double-sieving the material as received. We adopted the grain size fraction 425–500 µm as the reference grain size for most of the experiments. For each experiment, we used 35 g of the Ottawa sand gouge, which results in an initial gouge thickness of ∼ 4.5 mm after normal loading at 2.5 MPa (effective) normal stress and before shearing.
2.2 Rotary-Shear Friction Experiments
We performed medium-velocity friction experiments using a rotary-shear apparatus (RAP; Korkolis, 2019) plus a high-speed infrared camera (Fig. 1a). The RAP consists of a torque reaction frame that is housed inside an Instron 8862 testing machine equipped with a servo-controlled electromechanical actuator that may be operated either in position control (±50 mm range, 5 µm resolution) or in load control mode (±100 kN range, 0.008 kN resolution). Within the RAP, we developed a gouge setup that allows us to confine gouge samples and pressurize the pore fluid within the simulated fault zone during rapid sliding (Fig. 1b). The gouge layer is confined between two ring-shaped, steel pistons (100 mm external, 70 mm internal diameters), allowing loading in the axial direction. The piston faces are toothed, with the teeth spaced at 1.5° (240 teeth on the full ring) and their height varies from the inside diameter of 0.62 mm to the outside diameter of 0.96 mm. In the middle, the height is 0.79 mm. All teeth are oriented perpendicular to the direction of sliding. A brass outer and inner rings were used to confine the gouge layer laterally to avoid gouge extrusion during shearing. The driving platen is equipped with two angular potentiometers (0.001°, or about 0.74 µm resolution) that measure its rotation. A pair of load cells (20 kN range, 0.008 kN resolution), mounted on opposite sides of a horizontal steel block (“crosshead”; Fig. 1a), measure the reaction force of the frame due to the rotation imposed by the motor. Axial displacment is tracked by measuring the change in the load frame position under load control. Local pore fluid pressure changes during sliding were measured using two pressure transducers (10 MPa full range, with 0.01 MPa resolution and less than 10 ms response time) installed at opposite sides, and at identical radial position (centered at d = 85 mm), in the bottom rotary piston (Fig. 1b). To detect thermal signals across the full gouge layer thickness, we installed a circular, transparent sapphire window (10 mm in diameter and 2 mm in thickness) in the outer confining ring (Fig. 1c, d). The screw-in design of the window allows its position to be adjusted to be as close as possible to (in contact with) the gouge layer.

Figure 1Experimental setup. (a) Photograph of the pressurized gouge setup installed in the rotary-shear apparatus (RAP) with the high-speed infrared camera. (b) Cross-section of the pressurized gouge setup. Pressure transducers are installed in the bottom rotary piston at ∼ 2 mm distance from the gouge layer. The pore fluid inlet and outlet are at 135 and 45° to the sapphire window, respectively. (c) Photograph of the profile of the undeformed, room-dry Ottawa sand gouge layer, sandwiched between the pistons, and laterally confined by an outer brass ring with a transparent sapphire window. (d) Photograph of a deformed room-dry gouge layer showing a zone/layer of reduced grains. (e) Thermography of the gouge layer before sliding under a full-frame field of view (FOV) (9.6 mm × 7.68 mm). The white rectangle indicates the field of view (FOV: 2.4 mm × 1.92 mm) under quarter-frame analyses (1200 Hz) applied in all our tests. (f) Particle size distribution (PSD) of the starting materials (425–500 µm Ottawa sand gouge) and the deformed samples with the same initial grain size under different conditions, plotted as volume percentage vs. grain size. Reference experiment refers to a normal stress of 2.5 MPa and slip velocity of 10 mm s−1. (g) Zoom-in PSD for grain sizes 0.1–100 µm.
Friction experiments were conducted on both room-dry and wet gouges at an applied normal stress σn of 1.0–7.5 MPa and a constant slip velocity V in the range 1–50 mm s−1, reaching a total displacement of up to 750 mm (equivalent to ∼ 2.8 of full rotations of the piston assembly). Grain comminution was lowest in our experiments at lower normal stresses and sliding velocities, as shown in the particle size distribution anaylsis (Fig. 1f, g). Thus, we chose a normal stress of 2.5 MPa and a slip velocity of 10 mm s−1 as the reference conditions at which flash heating could be resolved spatially. Before applying the normal load to the target value, wet gouges were prepared by saturating the sample with DI water using a syringe pump (ISCO pump; Fig. 1b) through the pore fluid inlet port until water came out of the outlet drainage ports, without bubbles. All wet experiments were conducted under undrained conditions at initially atmospheric pore pressure conditions (i.e. 0.1 MPa) by keeping the outlet ports closed during shearing. After the target normal stress was applied, we initiated shearing of the gouge sample, recording the thermal imaging at synchronized time. During the entire experiment, data on shear stress τ, normal stress σn, axial displacement, and velocity V, were obtained at a logging rate of 5 kHz. All the tests performed are listed in Table 1.
Table 1List of experiments and conditions with the average temperature increase ΔTavg as well as the measured and predicted (see Eq. 1) flash temperatures Tmax. The IR temperature range chosen for the room-dry and wet experiments is 60–200 and 30–150 °C, respectively. We define a flash as a maximum temperature measurement in a single frame that is larger (> 50 °C for dry, > 4 °C for wet) than the maximum temperatures in neighbouring frames. Predictions of flash temperature for wet conditions are not included.
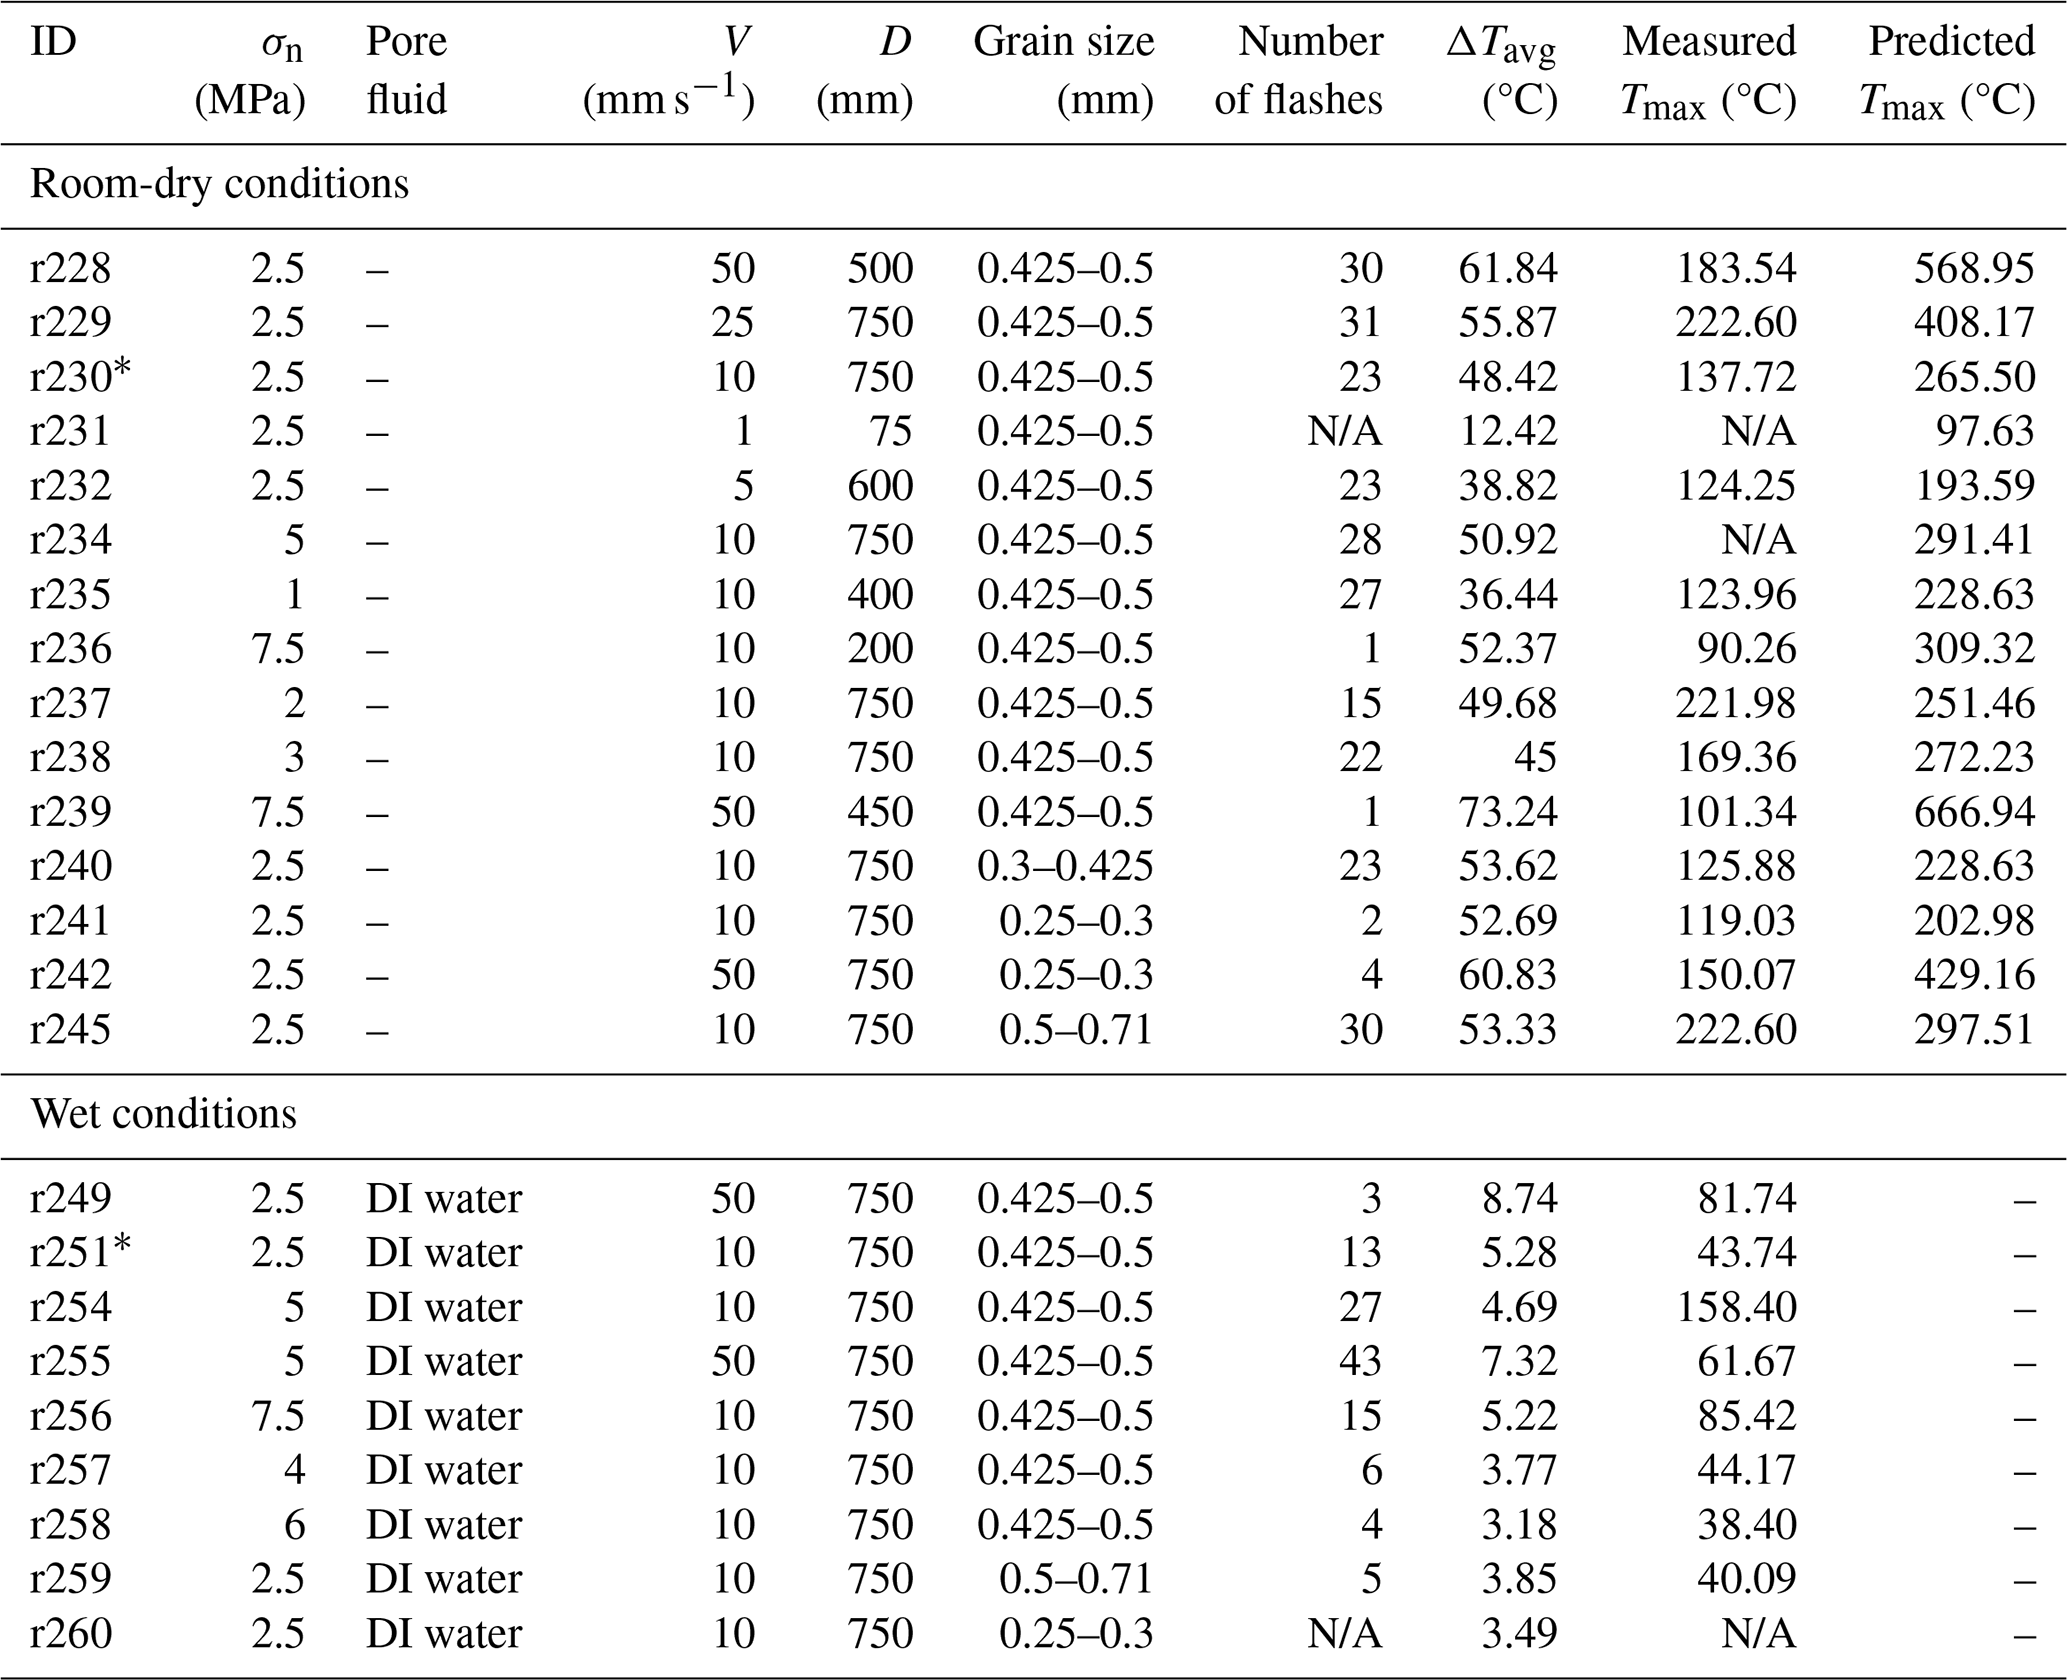
Note. N/A denotes no flashes observed. The symbol “*” indicates reference experiments for the room-dry and wet conditions. σn = the applied normal stress. V = the imposed slip velocity. D = the imposed total displacement.
2.3 High-Speed Infrared Thermal Imaging of Gouge Profiles
We used an Infratec ImageIR 8300hp infrared camera with a precision microscope lens M = 1.0× and a working distance of 20 cm (Fig. 1a) to provide the requirements for high-speed thermography. The combined setup has a detector format of 640 × 512 pixels and a wide range of IR frame capture rates from up to 355 Hz (a full frame window size) to up to 5000 Hz (a line measurement) with a spatial resolution down to 15 µm per pixel. All the infrared radiation (IR) signals acquired from the infrared camera were processed using IRBIS® 3.1 Infrared Thermographic Software (https://www.infratec.eu/thermography/thermographic-software/, last access: 17 September 2025) to convert the digital IR signal data to thermographs (i.e. temperature distributions) with the user choice calibration (e.g. emission, absorption, and transmission). In this study, we took an emissivity of 1 (full reflection of IR from the object), an absorption coefficient of 0 (no attenuation of IR), and a transmission of 1 (full penetration of incident IR) as the inputs for the calibration of the IR signal to arrive at the target object temperature in the software. We have not taken the effects of mineralogy, the sapphire window or the presence of water on the IR signal into account in the present work. The focus of the lens was adjusted until the piston teeth were visible in the gouge layer on the real-time thermograph (Fig. 1e). During shearing of each experiment, we adopted a quarter-frame analysis of up to 1200 Hz (∼ 0.83 ms) with a field of view (FOV) of 2.4 mm × 1.92 mm and a spatial resolution of 15 µm per pixel to capture thermographs that emerged from the FOV of the gouge shear zone. These mostly covered the bottom third of the gouge layer (i.e. rotating side) plus a small portion of the piston teeth (Fig. 1c, e). For experiments conducted at the chosen reference conditions (ID r230, r251), a sequence of at least 90 000 thermographs (75 s × 1200 Hz) was acquired from the FOV throughout the experiment. The IR camera is equipped with a neutral density filter and is capable of measurements over several pre-set, calibrated temperature ranges with multiple integration times. We took the factory-calibrated settings for two different IR temperature ranges of 60–200 and 30–150 °C, for room-dry and wet test conditions, respectively. After each experiment, we exported the maximum temperatures and the corresponding location (X and Y coordinates), as well as the average temperatures over the FOV of every acquired thermograph, to investigate the temporal and spatial evolution of peak temperatures with displacement.
3.1 Mechanical Behavior
Figure 2 shows the evolution of apparent friction μapp (= shear stress τ applied normal stress σn) against displacement obtained for the room-dry and wet gouges at the variable slip velocities, normal stresses, and initial grain sizes shown. For the room-dry gouges (Fig. 2a, c, e), the frictional evolution is generally similar, regardless of slip velocity, normal stress, and grain size. Specifically, μapp firstly overcomes a “static” peak friction μs of ∼ 0.9, soon after slip initiation, subsequently rapidly drops to a constant (dynamic) level of ∼ 0.65 within ∼ 0.3 m displacement. This is followed by minor displacement weakening beyond the first full rotation (∼ 267 mm displacement) reaching a near-constant value of ∼ 0.6 during the late stage of slip. The overall level of friction systematically decreases with increasing normal stress (Fig. 2c), with the exception of the experiment conducted at 5 MPa normal stress (ID r234), which shows anomalous behavior in the form of marked displacement strengthening after one rotation. This is likely due to jamming of material between the piston and the confining ring.

Figure 2Evolution of apparent friction μapp as a function of displacement for room-dry (a, c, e) and wet gouges (b, d, f) under variable slip velocities, normal stresses, and initial grain sizes. The sudden friction drop observed in panel (c), the green curve, is the result of re-shear due to a motor failure.
For the wet gouges (Figs. 2b, d, f, and 3), the initial frictional behavior is similar to the room-dry gouges, featuring a peak μapp value μs of ∼ 0.9 followed by a sharp friction drop. Different levels of slip weakening occur depending on the slip velocity, normal stress, and grain size. At a normal stress of 2.5 MPa, the wet gouge subjected to a slip velocity of 50 mm s−1 showed increased slip-weakening towards a lower dynamic friction of ∼ 0.45, compared with the behavior seen at the lower slip velocity of 10 mm s−1 (Fig. 2b) or in dry samples. At a slip velocity of 10 mm s−1, the wet gouges significantly slip-weaken only when the normal stress is equal to or greater than 4 MPa. Under these conditions, the onset of weakening starts earlier and the dynamic friction level decreases with increasing normal stress (Fig. 2d). Increased slip weakening is also observed, compared with the reference test, when the grain size is either greater or smaller than the reference value, without any systematic correlation between grain size and the level of dynamic friction (Fig. 2f).
Fluid pressure increases were always observed in the wet experiments at the displacement at which weakening starts (i.e. beyond the peak static friction; see Fig. 3). This shows that the fluid pressure increase has a positive correlation with applied normal stress, since the maximum fluid pressure increased from ∼ 3.5 MPa, at a normal stress of 4 MPa, to ∼ 7 MPa at a normal stress of 7.5 MPa. In addition, each experiment shows a sudden gouge dilatation during the attainment of peak friction, followed by ongoing gouge compaction (Fig. 3). The amount of compaction shows the same trend with normal stress as fluid pressure, i.e. more compaction occurs in experiments with higher normal stress.
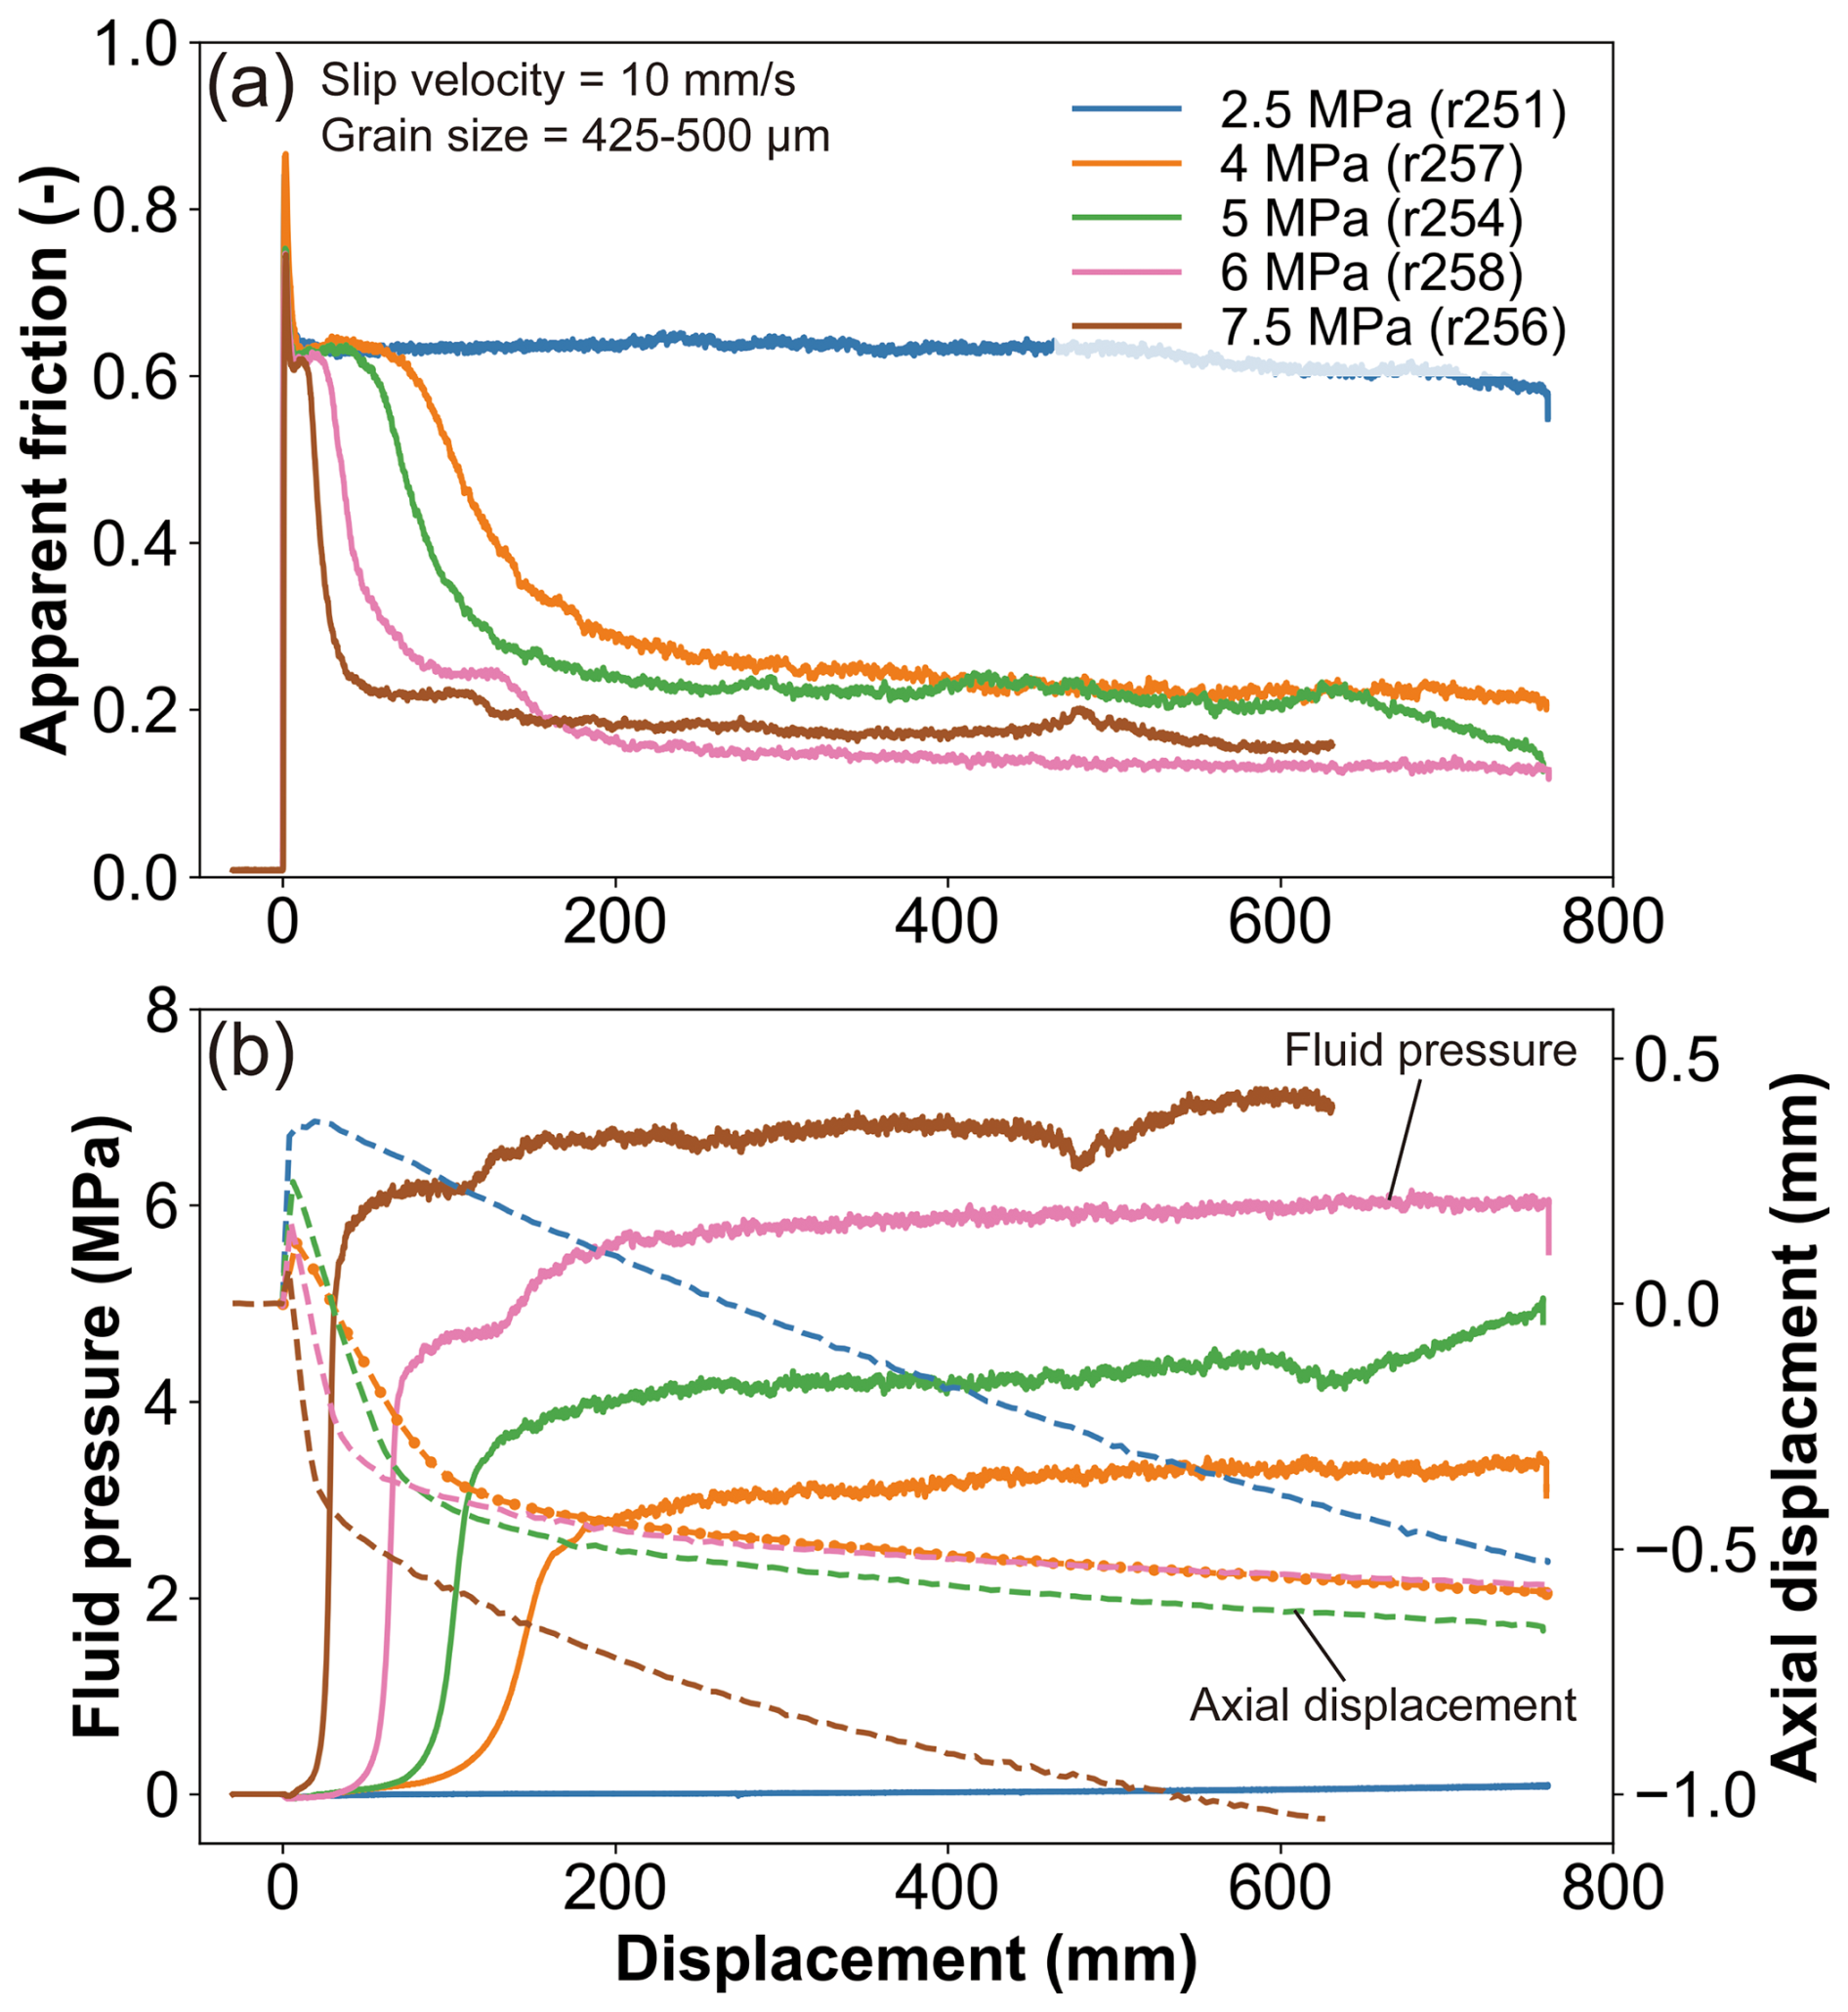
Figure 3Evolution of (a) apparent friction and (b) pore fluid pressure and axial displacement, as a function of shear displacement for the wet experiments at a slip velocity of 10 mm s−1, using an initial grain size of 425–500 µm. Dashed curves in panel (b) represent axial displacement data whereby positive values indicate dilatation and negative values indicate compaction. Solid curves in panel (b) represent pore fluid pressure in these undrained tests.
3.2 Evolution of Maximum Temperature Rise with Displacement
The maximum temperatures obtained from each thermal image are plotted as a function of displacement in Figs. 4, 5, and 6. Generally, multiple temperature peaks (i.e. spikes) with a duration of one frame (∼ 0.83 ms) can be observed, representing flashes in most experiments with the largest peak temperatures being ∼ 220 and ∼ 100 °C in the room-dry and wet gouges, respectively. For most of the experiments, the maximum temperatures in the FOV showed a rapid increase after the slip initiation, with a faster rise with increasing velocity, but then soon reached a plateau (at a base level of ∼ 25–40 °C), which becomes higher at higher velocity (Fig. 4). The presence of a temperature plateau is due to the settings of the IR temperature measurement range (60–200 and 30–150 °C for room-dry and wet experiments, respectively); below the lower bound of the range, temperature cannot be accurately determined or displayed. Another thing that should be noted is that Figs. 4, 5, and 6 include all thermal flashes that occurred within the full FOV throughout the entire slip period of each experiment. Thus, the observed flashes might not only result from the sliding between grain-grain contacts but also from sliding between the grains and the window as well as between the grains and the piston, due to gouge extrusion or grain fragments jamming between the sapphire window and the piston.
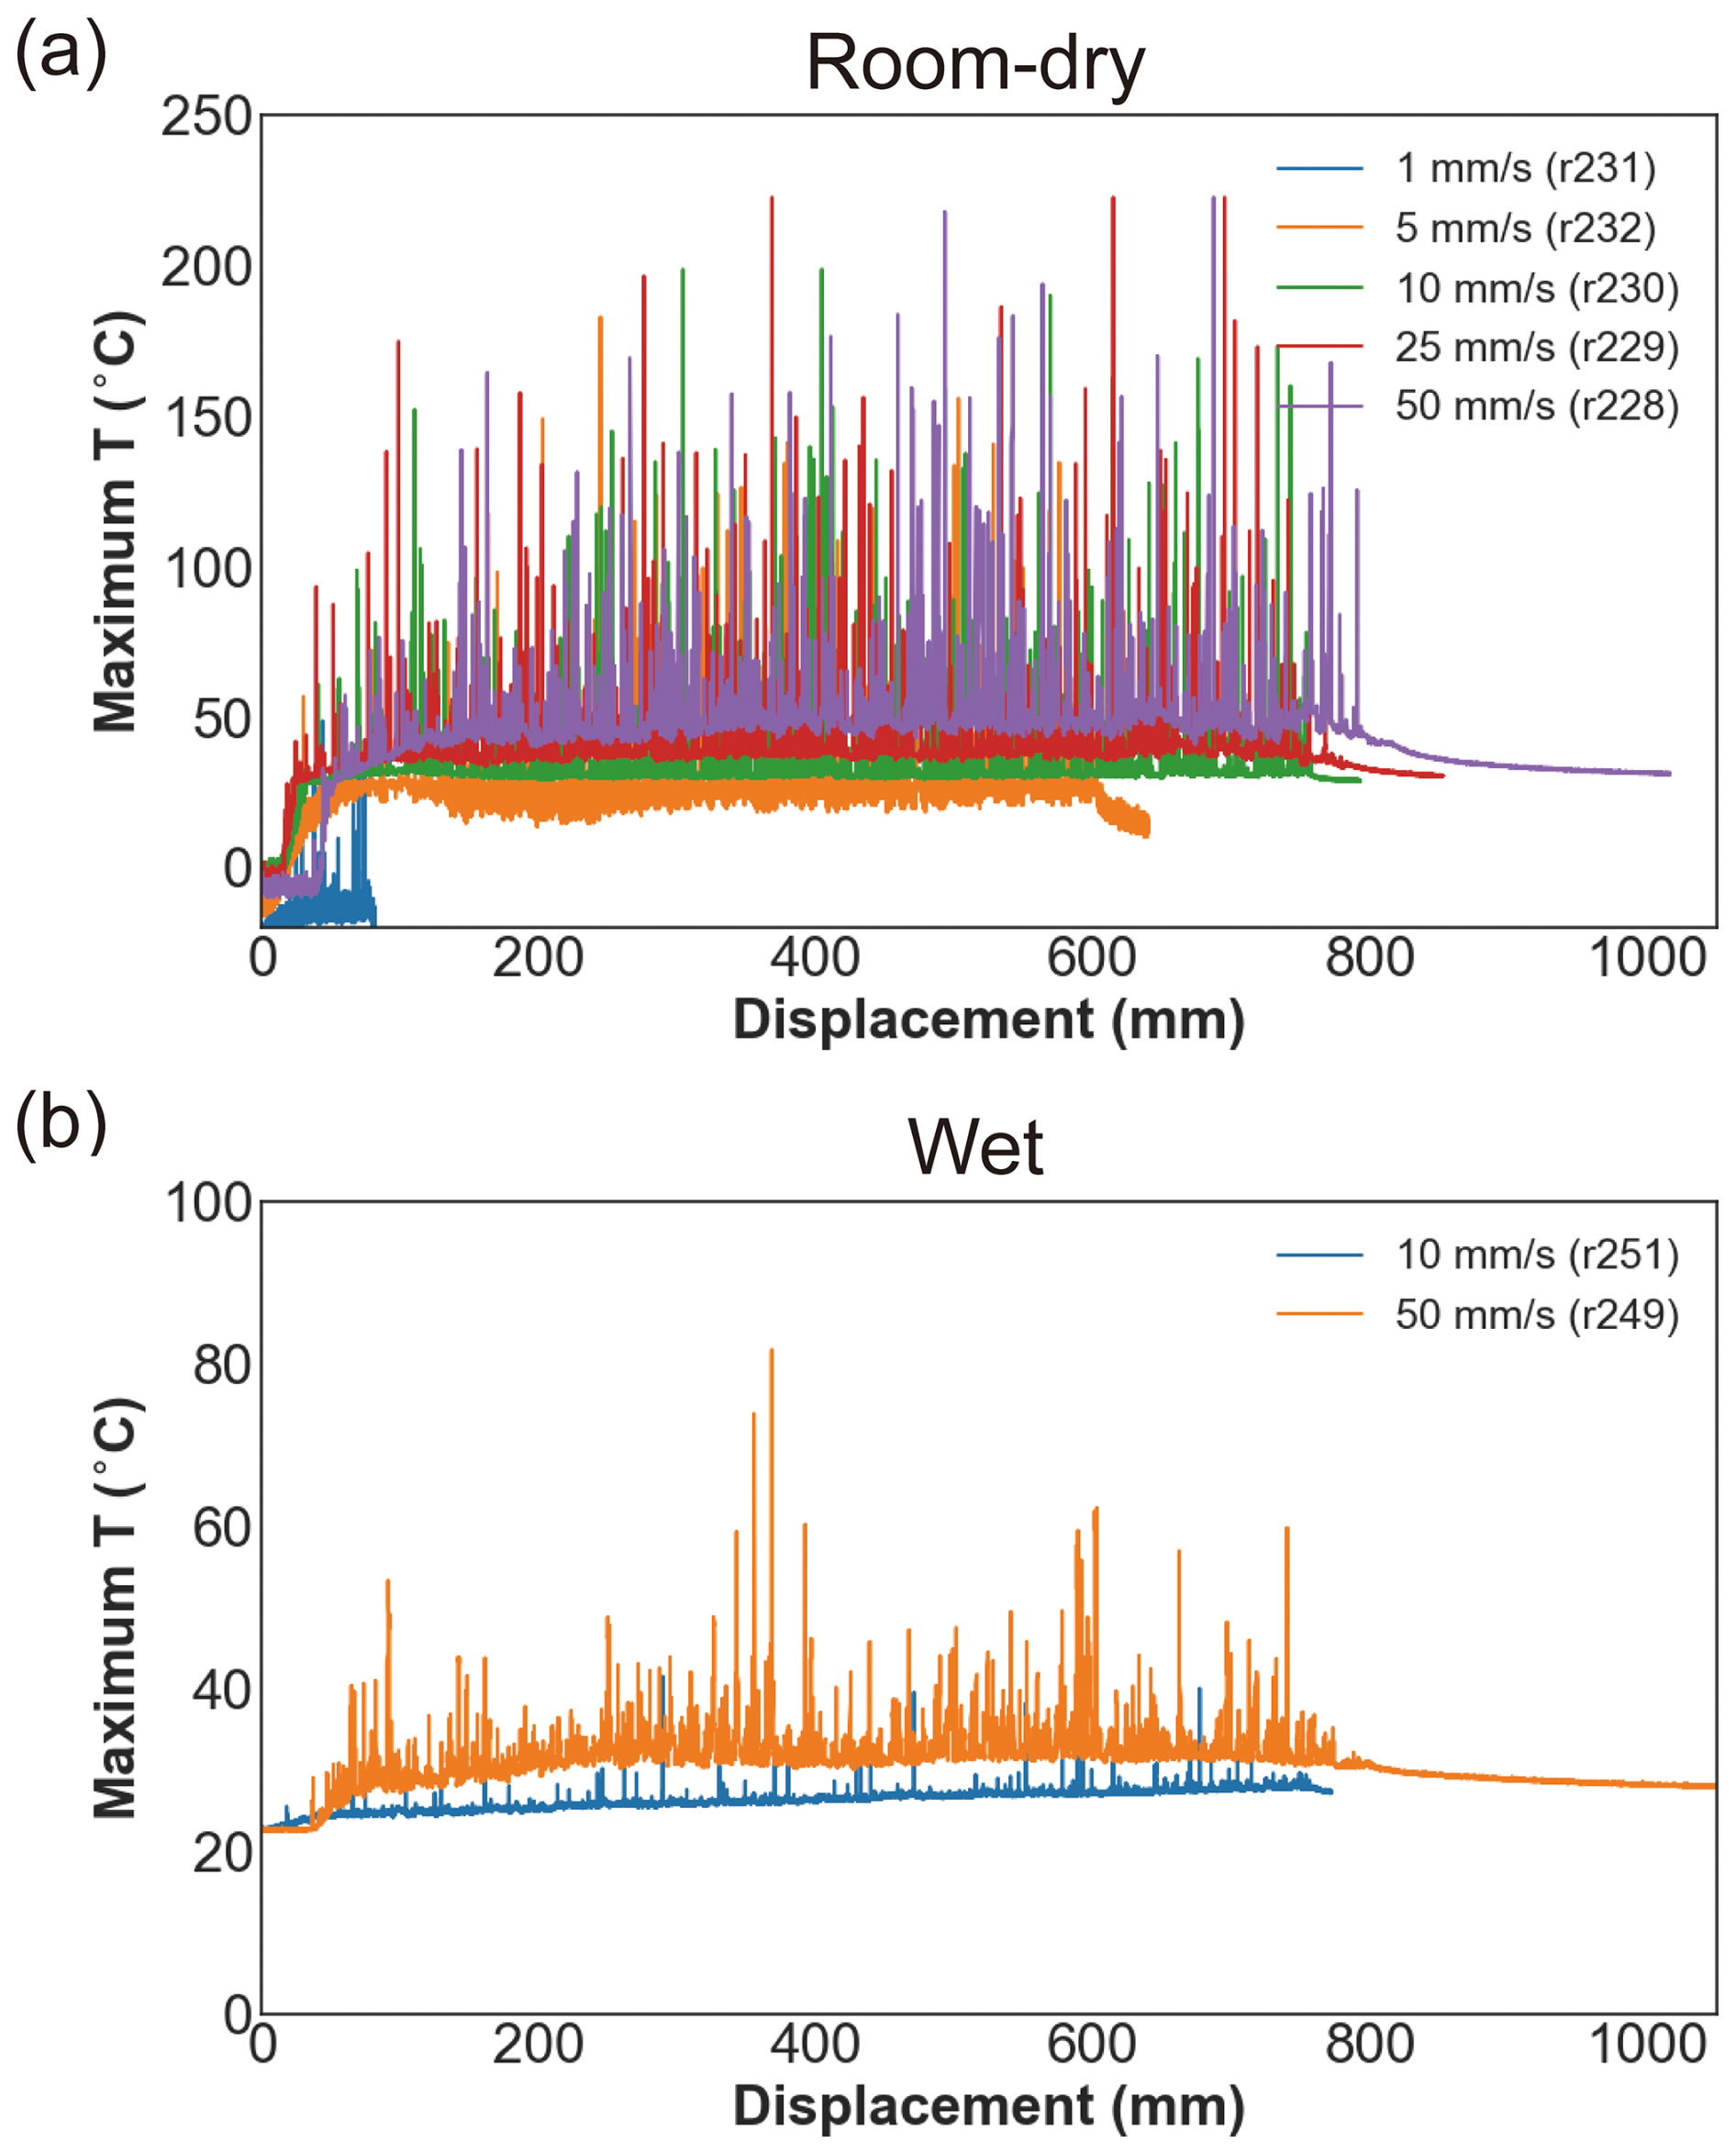
Figure 4Evolution of maximum temperature within the FOV (4 mm × 3.2 mm) as a function of displacement for the room-dry gouges (a) and the wet gouges (b) tested at a normal stress of 2.5 MPa and different slip velocities.
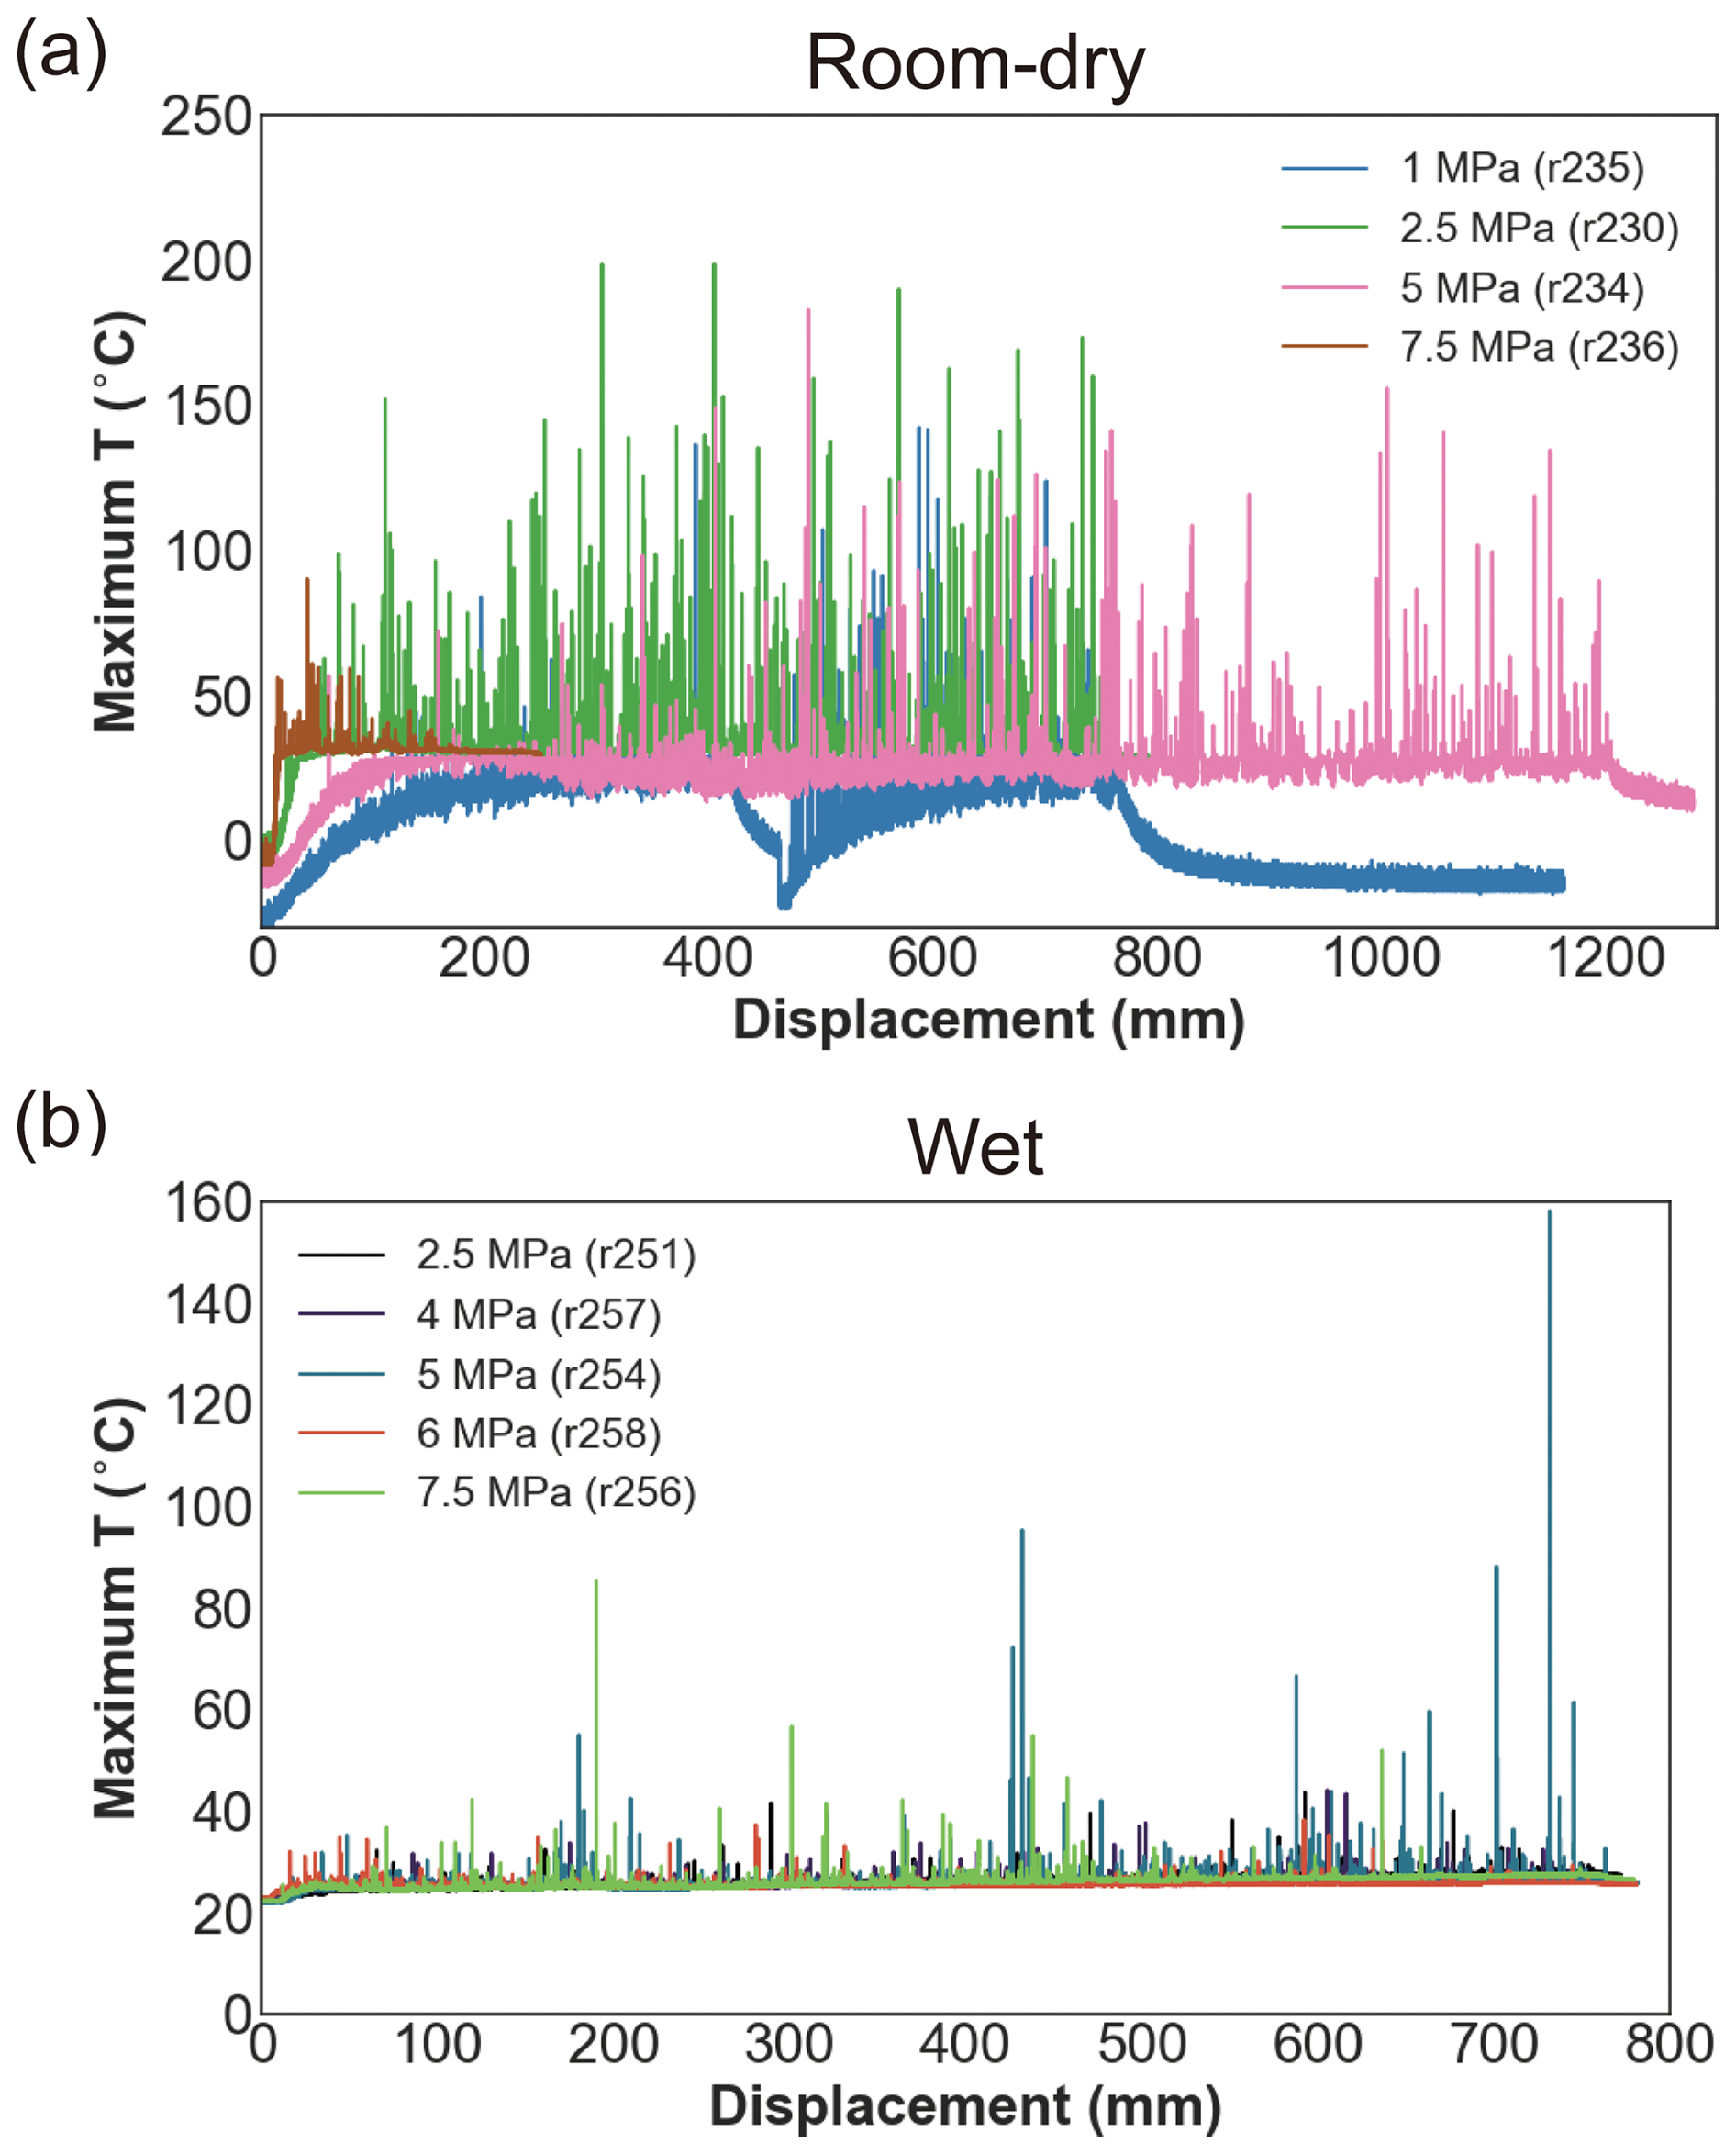
Figure 5Evolution of maximum temperature within the FOV (4 mm × 3.2 mm) as a function of displacement for the room-dry gouges (a) and the wet gouges (b) tested at a slip velocity of 10 mm s−1 and different normal stresses. The temporary decrease in the minimum measured temperature at normal stress of 1 MPa results from an unintended stop in shearing at ∼ 40 s due to a motor break.

Figure 6Evolution of maximum temperature within the FOV (4 mm × 3.2 mm) as a function of displacement for the room-dry gouges (a) and the wet gouges (b) tested at a normal stress of 2.5 MPa and a slip velocity of 10 mm s−1, with different initial grain sizes.
Nonetheless, these results still provide insight into systematic differences in the evolution of temperature and the magnitude of the peak temperatures. Overall, we observed that peak temperature rises are significantly reduced in the presence of water, and the peak temperature systematically increases with increasing slip velocity (Fig. 4). In both the room-dry and wet gouges, the number of flashes becomes much less and their magnitudes become much lower at the lowest applied slip velocity of 1 mm s−1. In the dry experiments, the magnitude of the flashes appears to be the greatest (up to 200 °C) at 2.5 MPa, while becoming less significant with both decreasing and increasing normal stress (Fig. 5a). The dependence of peak temperature on normal stress is not visible in the wet experiments (Fig. 5b). Note that the dry experiment (ID r236) at 7.5 MPa normal stress was terminated soon (∼ 3 s) after slip initiation (Fig. 5a) because of sounds indicating unwanted abrasion of the outer ring. For the range of grain sizes explored, the variations in the magnitudes of flashes are similar in both the dry and wet tests and are difficult to quantify based on these data (Fig. 6).
3.3 Spatial and Temporal Distributions of Flashes
We located the position of the thermal flashes to see if they occurred within the actual gouge zone, as opposed to the portion of the FOV below the teeth tops. Figure 7 presents the spatial and temporal distributions of the flashes, here taken as those frames (duration ∼ 0.83 ms) with temperature rise ΔT larger than 50 and 4 °C, for the reference room-dry and wet gouges, respectively. These results exclude the flashes with a position at and below the horizontal level (i.e. Y position) of the teeth tops on the bottom rotary piston (dashed lines). This is to rule out the flashes that potentially resulted from sliding between the grains and the piston/window. After filtering out data from below the chosen moving datum, we still observed many flashes, which we infer occurred within the main gouge zone. The peak temperature and the number of these flashes in each experiment are summarized in Table 1. Generally, in terms of spatial distribution, flashes tend to be concentrated within a narrow zone (∼ 500 µm thick) under room-dry conditions (Fig. 7a, b) whereas flashes are more separated under wet conditions.
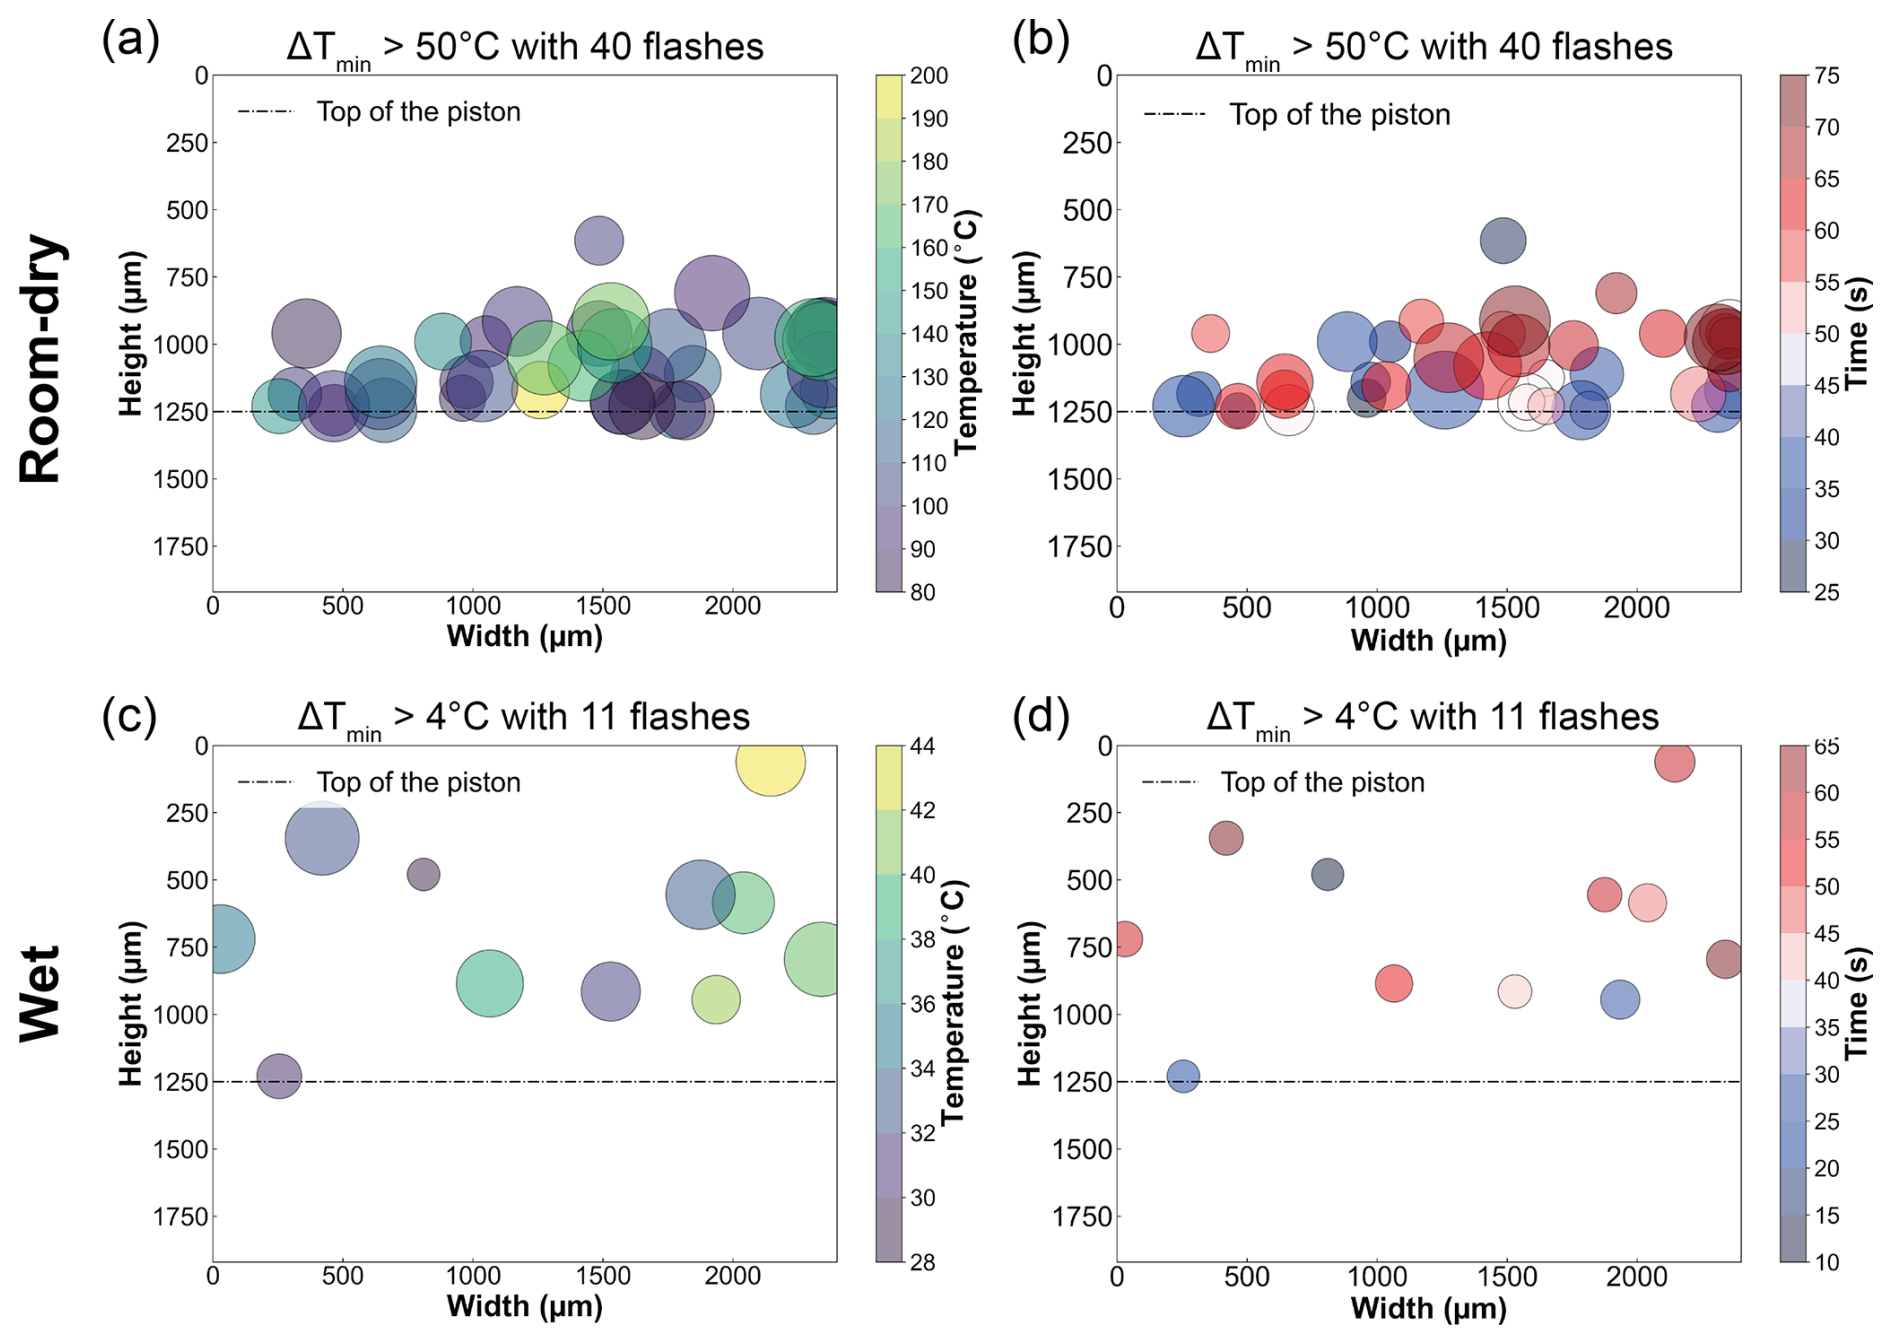
Figure 7Spatial and temporal distribution of flashes within the main gouge zone with a minimum temperature rise ΔT (relative to the bulk maximum temperature) larger than 50 and 4 °C for the reference experiments of the room-dry (a, b; ID r230 with 40 flashes) and wet gouges (c, d; ID r251 with 13 flashes), respectively. Tests performed at 2.5 MPa normal stress and 10 mm s−1 sliding velocity. Larger dots indicate later occurrence (a, c) or higher temperature rise (b, d).
3.4 Estimation of Flash Temperature
Based on the flash-weakening model (e.g. Rice, 2006; Beeler et al., 2008; Proctor et al., 2014; Yao et al., 2018), the flash temperature on an asperity (grain) contact (Ta) within a gouge layer can be expressed as:
Here, Tbulk is the initial bulk temperature of the fault zone, τc is the contact shear strength, ρ is the gouge density, and c is the specific heat capacity of the gouge, Na is the number of asperity contacts sharing the total slip velocity V, Da is the diameter of the asperity contact, and αth = is the thermal diffusivity of the gouge material, where K is the thermal conductivity. For a first-order estimate, the latent heat of possible reaction (e.g. fluid evaporation) is not considered in the equation. Here we only applied the model to the dry samples. For the dry Ottawa quartz sand with a grain size of 425–500 µm, we took τc as ∼ 9–12 GPa (Goldsby and Tullis, 2011), ρ as 2650 kg m−3, c as 730 J/kg−1K−1 and αth as ∼ 1.5 × 10⁻⁶ m2 s−1. Considering the thickness of the shear zone in dry gouges (∼ 4 mm or ∼ 16–20 grains), where ∼ 50 % of the gouge layer was involved in shearing (Fig. 1d), this results in Na values ranging from ∼ 8 to 10, which is within a reasonable range, comparable to previous studies (4–10 Yao et al., 2018; 10–20 Rice, 2006; 4–13 Proctor et al., 2014; 10 Chen et al., 2023). For Da, we assumed two different particle packings (hexagonal packing vs. centered cubic packing) to estimate the range of Da between two spherical grains, assuming Hertzian contact mechanics. Based on the elastic moduli of Ottawa sand (e.g. Erdoğan et al., 2017), for the grain size of 450–500 µm, we adopt average values of Da as 13, 18, 22, and 25 µm at normal stresses of 1, 2.5, 5, 7.5 MPa, respectively. At a normal stress of 2.5 MPa, we take Da to be 10, 13, 17, and 23 µm for grain sizes of 250–300, 300–425, 450–500, and 500–710 µm, respectively.
Figure 8 shows the comparison of the maximum flash temperature obtained from the model prediction and from the measurements for the dry experiments. Overall, the measured values are lower than the predicted ones. Predicted flash temperature increases with increasing slip velocity, normal stress, and grain size, following Eq. (1), but this increasing trend is less (or not) visible in the measurement. The discrepancy between the predicted and measured flash temperature tends to increase with slip velocity and normal stress (Fig. 8a, b) but remains relatively consistent with variable grain sizes (Fig. 8c).

Figure 8Comparison of the peak flash temperatures between the prediction based on the flash weakening model (Rice, 2006) and the infrared measurement with different slip velocities (a), normal stresses (b), and grain sizes (c). The measured peak flash temperature at a slip velocity of 1 mm s−1 is not shown in panel (a) because the overall measured temperatures are lower than the selected temperature range (60–200 °C).
4.1 Robustness of the Flash Temperature Measurement
In the literature, flash heating is suggested to occur within a short contact lifetime (ms), depending on the scale of asperity contact (typically µm) as well as the sliding velocity at the contact (Rice, 2006). The current setting of the infrared camera can accurately measure thermal information with spatial and temporal resolutions of 15 µm and ∼ 0.83 ms, respectively. This means that the measured temperature might be underestimated if the contact diameter is smaller than 15 µm or if the contact lifetime is shorter than 0.83 ms (e.g. Madding et al., 2007). Another thing to be noted is that even if the grains are perfectly aligned with the window, the contact would still be a distance away from the window, assuming spherical grains. That means that the camera is probably not in focus for the contacts themselves, which would also underestimate the measured temperature. Our measurement of the maximum temperature within the FOV show that multiple peak temperatures (i.e. flashes) with duration of one frame (i.e. 0.83 ms) were recorded from the observed region of both the room-dry and wet gouges when the imposed slip velocity is higher than 1 mm s−1 (Fig. 4).
Figure 9 shows the contact lifetime against the contact diameter Da, assuming a specific grain size and slip velocity. The Da is estimated following the method described in Sect. 3.4. The contact lifetime is then obtained from the ratio of Da to the contact sliding velocity (= imposed slip velocity V number of asperity contacts Na). Based on the calculated contact diameter of the asperity Da (10–25 µm) and the assumed number of asperity contacts Na (10), the contact lifetime of the asperity for our samples and experimental conditions should range from 10–25 to 0.2–0.5 ms at the imposed sliding velocity of 1 to 50 mm s−1, respectively. These ranges lie around the limit of the temporal resolution of the camera, though the contact lifetime for V larger than 5 mm s−1 appears to be shorter than the duration of one frame, being strongly controlled by the estimated values of the Da and Na. This implies that the measured flashes likely resulted from flash heating between grains. Here, we should note that most of the calculated asperity sizes are smaller than the spatial resolution of the camera, suggesting that the actual temperature might be higher than the measurement. Moreover, if the flashes have a shorter duration than the frame duration, their actual temperature was also likely higher than the measured values.
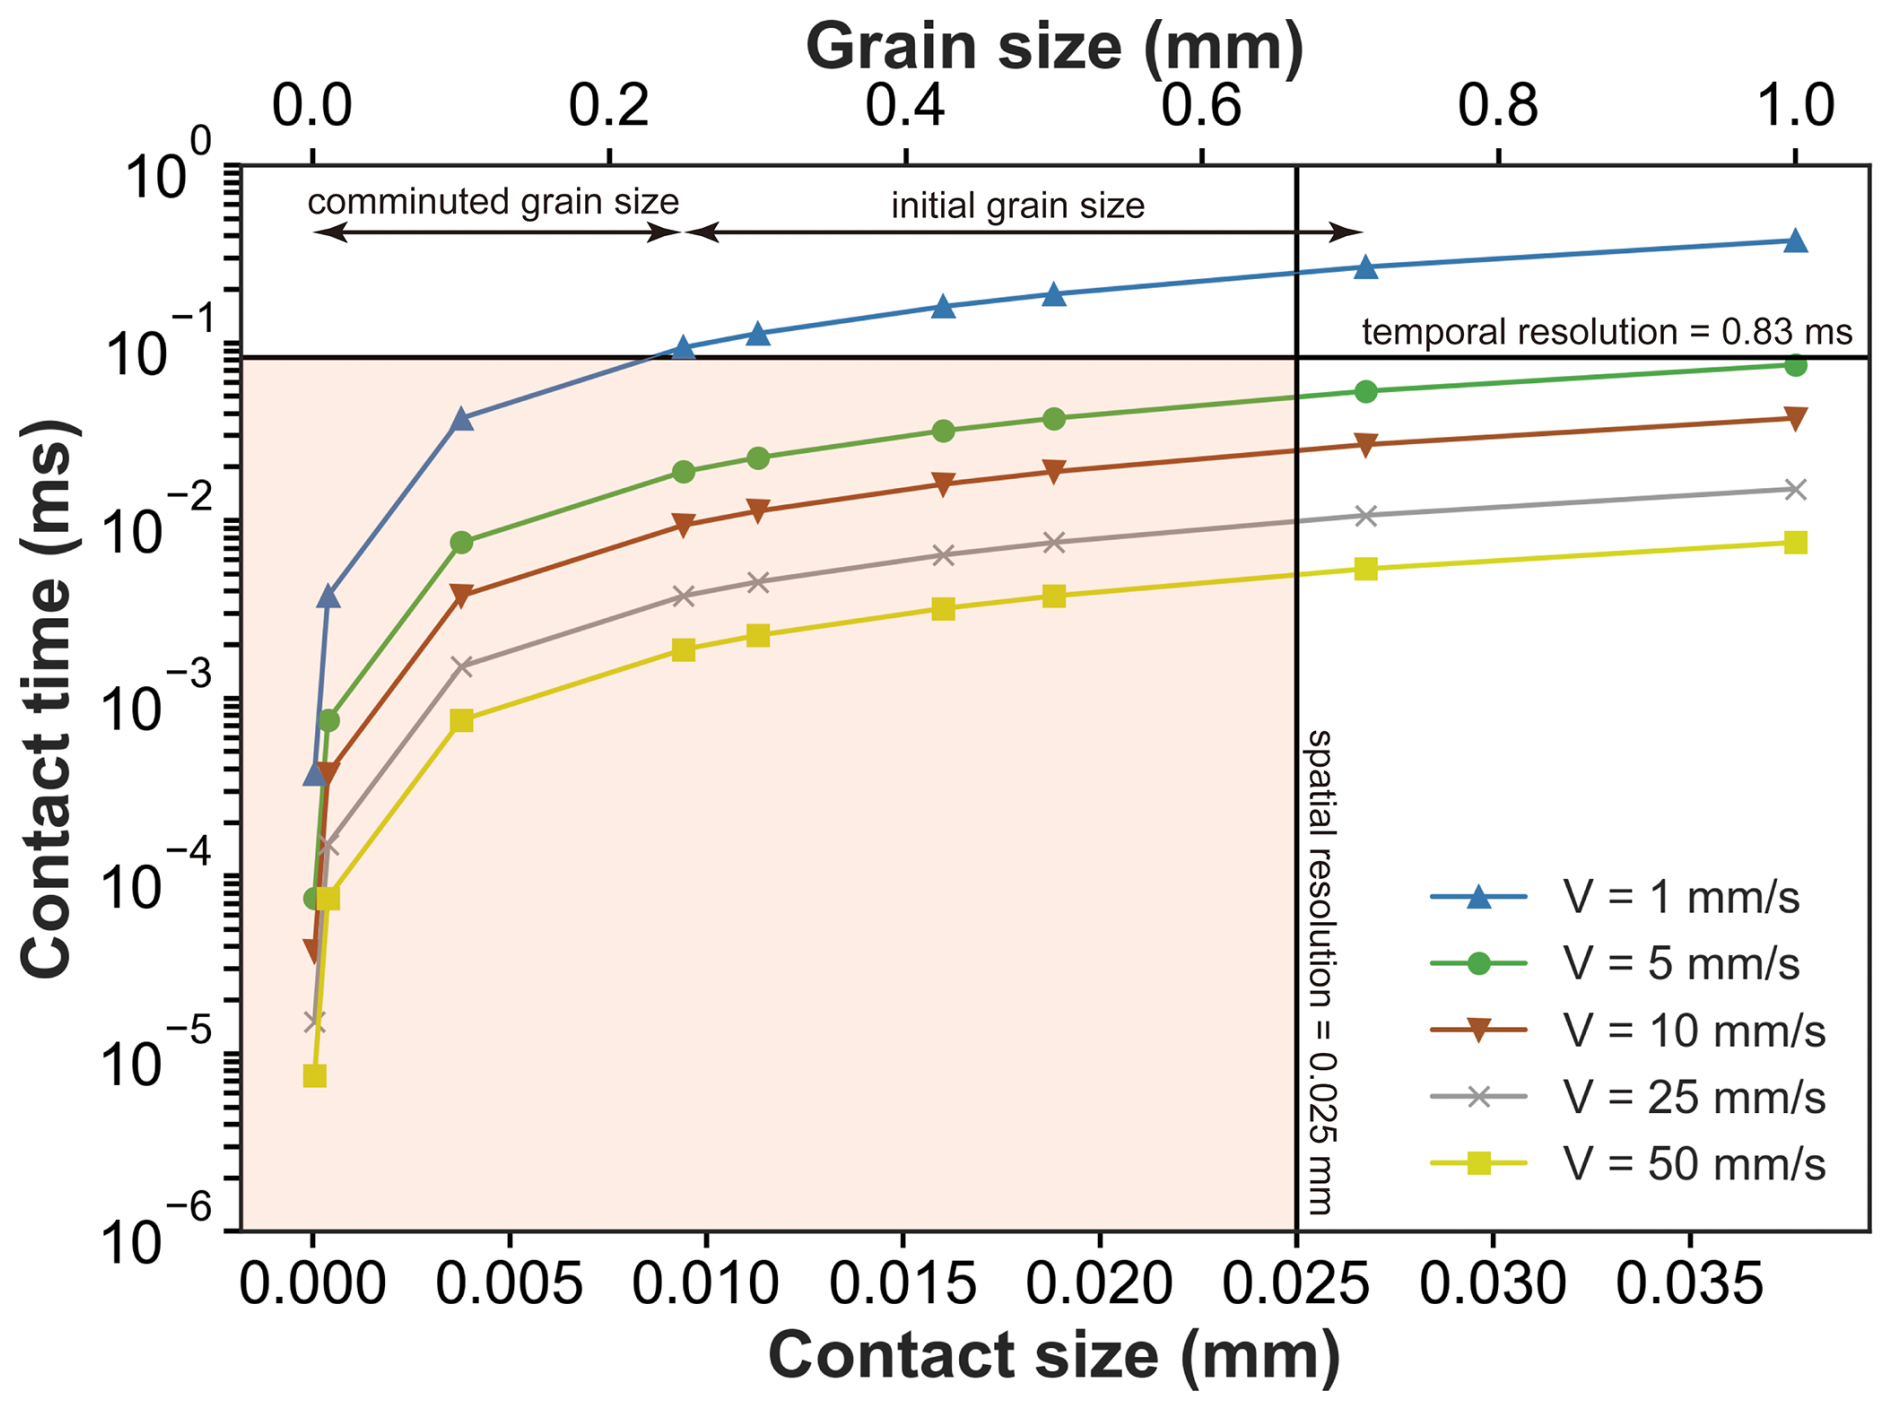
Figure 9Contact lifetime against contact diameter Da for flashes for a specific grain size and slip velocity. The Da is estimated following the method described in Sect. 3.4. Na is assumed to be 10. The black horizontal line gives a temporal resolution of 0.83 ms, and the vertical line has a spatial resolution of 0.015 mm. The light red rectangle region represents the region for which the IR camera with the current settings have neither sufficient spatial nor temporal resolution.
After filtering out the flashes occurring within the region of the rotating piston, we could still observe a few tens of flashes within the actual gouge zones under both room-dry and wet conditions (Fig. 7; Table 1). Among these flashes, we cannot exclude the possibility that some flashes result from the sliding of a grain against the window due to the lateral force and the dragging shear force acting on the grains that are attached to the window. Thus, these flashes might exhibit different characteristics in terms of shape in the thermographs due to the potential of scraping of the grain along the sapphire window. Figure 10 shows three different characteristics of flashes that can be observed from the thermographs. Generally, most of the flashes have a circular shape with the highest temperature at the center which gradually decreases towards the boundary (Fig. 10a, b). Some of these flashes are located within the interior of grains (Fig. 9a), where the individual grain outline can be identified, suggesting the flashes might result from grain-to-window sliding. For other flashes, it is difficult to identify their position relative to the solid grains (Fig. 10b). Yet another type of flash displays a tail shape (Fig. 10c) which may indicate the existence of grain-to-window flash. With the current data, it is difficult to distinguish whether the flashes were actually generated at grain-to-grain contacts or whether they were mainly related to grain-to-window sliding. To avoid the grain-to-window flashes, improvements in the experimental set-up are required, such as using a curved window to help ensure that the grains can pass along the window without creating temperature flashes. Another possibility might be to include an IR-transparent low-friction coating on the window.

Figure 10Thermographs with a flash identified in the actual gouge zone, as obtained from the reference room-dry experiment (r230) at displacements of 293 mm (a), 676 mm (b), and 526 mm (c).
Comparing our measurements with model predictions shows that measured flash temperatures are consistently lower than predicted, and that the discrepancy increases with normal stress and slip velocity (Fig. 8). As discussed above, the limited spatial and temporal resolution of the IR camera may contribute to these differences by underestimating the true peak temperatures. Another possible explanation is that the IR camera only captures temperatures at the flanks of the gouge layer or grain contacts, rather than at their centers. Because stress concentrations at contact asperities generate extremely steep temperature gradients, even a small offset from the central portion of the contact results in significantly lower measured temperatures. This geometric constraint likely contributes to the observed discrepancy between measured and predicted flash temperatures. We argue that the increasing discrepancies could be related to the process of grain size reduction during frictional sliding, and/or possibly the setting of the IR temperature ranges. As can be seen in the measured particle size distribution of the deformed sample (Fig. 1g), abundant fine grains were generated during the experiment. The initial grain size (425–500 µm) is reduced to a minimum value of ∼ 50 nm, with the largest proportion of grains smaller than the starting material having a size of 10 µm. In addition, the proportions of fine grains are systematically larger at a higher normal stress and slip velocity. This indicates that high normal stress and slip velocity increase the degree of grain size reduction, which leads to a decrease in asperity size Da and a possible increase in Na (at a constant thickness of the localized zone) as well as an increased contribution of fracture energy from grain comminution. The decrease in asperity size would affect our ability to resolve flash temperatures in space and time, because smaller contacts persist for shorter durations (Fig. 9). The increase in fracture energy suggests a potential energy sink that is not converted into heat, although we found that this contribution is negligible compared to the frictional work. If grain size reduction is one of the reasons causing the increasing variations, this implies that the measured flash temperatures should decrease with displacement due to the limitation of the spatial resolution or the peak temperatures might move away from the zone of grain size reduction. However, we do not observe these behaviors. To characterize the flash temperature distribution in the gouge layer robustly, multiple temperature ranges or a combined temperature range should be utilized in multiple repeat experiments (Barbery et al., 2021). Despite all this, our results still show some dependence of flash temperature on slip velocity and grain size.
4.2 Mechanical Behaviors under Room-Dry and Wet Conditions
We observed that the measured average temperature and flash temperatures can reach up to ∼ 73 °C and ∼ 220 °C, respectively, under room-dry conditions (Table 1). Despite high flash temperatures, suggesting the high effectiveness of flash heating, the room-dry gouges do not show any significant weakening which remains at a constant friction level of 0.6 (typical quasi-steady friction for quartz; Byerlee, 1978). This might be explained by the relatively low measured and predicted flash temperatures as compared to the softening (i.e. melting) temperature of quartz (∼ 1720 °C, Spray, 1992).
By contrast, the water-saturated gouges reveal slip weakening accompanied by fluid pressure increase at relatively high normal stresses (> 2.5 MPa) and slip velocities (> 10 mm s−1), while the average and flash temperature rises are only up to ∼ 9 and ∼ 80 °C, respectively (Figs. 4, 5, and 6; Table 1). Firstly, this suggests that temperature increase can be strongly limited by the presence of water, though the effect of water on the IR signal has not been considered in the data processing. Secondly, the above temperature increases of 9 and 80 °C are insufficient to account for the observed fluid pressure increase (3.5–7 MPa). We expect the bulk fluid pressure increase to be less than 1 MPa, taking a reasonable range for the thermal pressurization factor Λ (e.g. 0.075–0.11 MPa °C−1 for quartz-rich gouges; Hunfeld et al., 2021). On this basis, we suggest that the mechanism causing slip weakening in the wet samples is most likely associated with compaction-induced pressurization (compaction softening – Oohashi et al., 2011), which is supported by the data shown in Fig. 3.
At the same time, however, other candidate mechanisms related to the presence of water, such as thermomechanical pore fluid pressurization (Rice, 2006; Badt et al., 2020), flash pressurization resulting from local thermal pressurization at grain contacts induced by flash heating (e.g. Chen et al., 2023; Yao et al., 2018; Hung et al., 2025), and/or the water/vapor phase transition (e.g. Chen et al., 2017) cannot be completely excluded. Silica-gel lubrication due to amorphization of silica and gel formation via shearing and comminution in the presence of moisture (Di Toro et al., 2004; Goldsby and Tullis, 2002) might be another possible candidate for the dynamic weakening seen in fast shearing of wet quartz materials. To test these hypotheses, we need to ensure the gouge sample is well-compacted before the initiation of a high slip velocity to prevent significant compaction during the experiment. This is typically achieved by applying a conditioning stage (i.e. shear at low slip velocity) to the gouge layer. However, this was intentionally not included in the current study because the initial grain size reduction and associated comminution products would limit thermal radiation from grain contacts. In addition, thermal flashes would become difficult to measure due to the shorter asperity contact lifetime.
In this study, we perform rotary-shear friction experiment on sheared fault gouge analogues with a high-speed infrared camera to characterize flash temperatures induced by flash heating at grain contact scales and their dependence on normal stress, slip velocity, and grain size. The important findings in the present work are as follows:
- 1.
We can successfully monitor and quantify flash heating with instantaneous temperature rises occurring in an experimental fault gouge under room-dry and wet conditions.
- 2.
The presence of pore water likely limits flash temperature rise, though the extent of the effect is unclear due to uncertainties in the extent of IR absorption of thermal signatures by the water phase.
- 3.
Flash heating can be effective in dry gouge at a medium velocity (5 cm s−1) but is insufficient to cause dynamic slip weakening in a dry gouge-filled fault because the flash temperature is too low to reach the softening temperature of the gouge grains.
- 4.
The slip weakening effects that we observed in our wet experiments but not in dry tests are best explained by compaction softening, though a contribution from thermal pressurization at some scale cannot be eliminated.
- 5.
We have experimentally demonstrated that the flash temperature depends on slip velocity and grain size, to some extent, in broad agreement with theoretical predictions.
Final, we listed future work to further improve our understanding of flash heating in a sheared granular layer on the basis of the current results:
- 1.
Using normal high-speed camera to observe the sliding velocity at grain-to-grain contacts.
- 2.
Investigating the dependence of peak flash temperature on other particle parameters like grain shape (round vs. angular), grain roughness, as well as different background fluid pressures and pore fluids.
All raw data can be provided by the corresponding authors upon request.
Conceptualization: ARN; data curation: CCH, ARN; formal analysis: CCH, ARN; funding acquisition: ARN; investigation: CCH, ARN; methodology: CCH, ARN; project administration: CCH, ARN; resources: ARN; supervision: ARN; validation: CCH; visualization: CCH; writing (original draft preparation): CCH; writing (review and editing): ARN.
The contact author has declared that neither of the authors has any competing interests.
Publisher’s note: Copernicus Publications remains neutral with regard to jurisdictional claims made in the text, published maps, institutional affiliations, or any other geographical representation in this paper. While Copernicus Publications makes every effort to include appropriate place names, the final responsibility lies with the authors. Views expressed in the text are those of the authors and do not necessarily reflect the views of the publisher.
This work is part of the research programme DeepNL, financed by the Dutch Research Council (NWO); Grant: DEEP.NL.2018.040. Additional support for the purchase of the high-speed infrared camera was provided by the Nederlandse Aardolie Maatschappij (NAM).
This paper was edited by Alessandro Fedeli and reviewed by Lu Yao and Monica Barbery.
Acosta, M., Passelègue, F. X., Schubnel, A., and Violay, M.: Dynamic weakening during earthquakes controlled by fluid thermodynamics, Nat. Commun., 9, 3074, https://doi.org/10.1038/s41467-018-05603-9, 2018.
Badt, N. Z., Tullis, T. E., Hirth, G., and Goldsby, D. L.: Thermal pressurization weakening in laboratory experiments, J. Geophys. Res.-Sol. Ea., 125, e2019JB018872, https://doi.org/10.1029/2019JB018872, 2020.
Barbery, M. R., Chester, F. M., and Chester, J. S.: Characterizing the distribution of temperature and normal stress on flash heated granite surfaces at seismic slip rates, J. Geophys. Res.-Sol. Ea., 126, e2020JB021353, https://doi.org/10.1029/2020JB021353, 2021.
Barbery, M. R., Chester, F. M., and Chester, J. S.: Investigating dynamic weakening in laboratory faults using multi-scale flash heating coupled with mm-scale contact evolution, J. Geophys. Res.-Sol. Ea., 128, e2023JB027110, https://doi.org/10.1029/2023JB027110, 2023.
Beeler, N. M., Tullis, T. E., and Goldsby, D. L.: Constitutive relationships and physical basis of fault strength due to flash heating, J. Geophys. Res.-Sol. Ea., 113, B01401, https://doi.org/10.1029/2007JB004988, 2008.
Brantut, N. and Platt, J. D.: Dynamic weakening and the depth dependence of earthquake faulting, in: Fault Zone Dynamic Processes: Evolution of Fault Properties During Seismic Rupture, Elsevier, 171–194, https://doi.org/10.1002/9781119156895.ch9, 2017.
Byerlee, J.: Friction of rocks, Pure Appl. Geophys., 116, 615–626, https://doi.org/10.1007/BF00876528, 1978.
Chen, J., Niemeijer, A. R., and Fokker, P. A.: Vaporization of fault water during seismic slip, J. Geophys. Res.-Sol. Ea., 122, 4237–4276, https://doi.org/10.1002/2016JB013824, 2017.
Chen, J., Hunfeld, L. B., Niemeijer, A. R., and Spiers, C. J.: Fault weakening during short seismic slip pulse experiments: The role of pressurized water and implications for induced earthquakes in the Groningen gas field, J. Geophys. Res.-Sol. Ea., 128, e2022JB025729, https://doi.org/10.1029/2022JB025729, 2023.
Di Toro, G., Goldsby, D. L., and Tullis, T. E.: Friction falls towards zero in quartz rock as slip velocity approaches seismic rates, Nature, 427, 436–439, https://doi.org/10.1038/nature02249, 2004.
Di Toro, G., Niemeijer, A., Tripoli, A., Nielsen, S., Di Felice, F., Scarlato, P., Bistacchi, A., Smith, S. A., and Mariano, S.: From field geology to earthquake simulation: A new state-of-the-art tool to investigate rock friction during the seismic cycle (SHIVA), Rend. Lincei-Sci. Fis., 21, 95–114, https://doi.org/10.1007/s12210-010-0097-x, 2010.
Erdoğan, S. T., Forster, A. M., Stutzman, P. E., and Garboczi, E. J.: Particle-based characterization of Ottawa sand: Shape, size, mineralogy, and elastic moduli, Cement Concrete Comp., 83, 36–44, https://doi.org/10.1016/j.cemconcomp.2017.07.016, 2017.
Goldsby, D. L. and Tullis, T. E.: Low frictional strength of quartz rocks at subseismic slip rates, Geophys. Res. Lett., 29, 1844, https://doi.org/10.1029/2002GL015240, 2002.
Goldsby, D. L. and Tullis, T. E.: Flash heating leads to low frictional strength of crustal rocks at earthquake slip rates, Science, 334, 216–218, https://doi.org/10.1126/science.1207902, 2011.
Hangx, S. J. and Brantut, N.: Micromechanics of high-pressure compaction in granular quartz aggregates, J. Geophys. Res.-Sol. Ea., 124, 6560–6580, https://doi.org/10.1029/2018JB016494, 2019.
Hunfeld, L. B., Chen, J., Niemeijer, A. R., Ma, S., and Spiers, C. J.: Seismic slip-pulse experiments simulate induced earthquake rupture in the Groningen gas field, Geophys. Res. Lett., 48, e2021GL092417, https://doi.org/10.1029/2021GL092417, 2021.
Hung, C. C., Niemeijer, A., Aretusini, S., Spagnuolo, E., Chen, J., and Hamers, M.: Dynamic weakening in sandstone-derived fault gouges during simulated small-magnitude earthquakes under variable loading and environmental conditions, Geophys. J. Int., 241, 1009–1028, https://doi.org/10.1093/gji/ggaf077, 2025.
Kohli, A. H., Goldsby, D. L., Hirth, G., and Tullis, T.: Flash weakening of serpentinite at near-seismic slip rates, J. Geophys. Res.-Sol. Ea., 116, B03211, https://doi.org/10.1029/2010JB007833, 2011.
Korkolis, E.: Rotary shear experiments on glass bead aggregates: Stick-slip statistics and parallels with natural seismicity, Doctoral dissertation, Utrecht University, ISBN: 978-90-6266-553-2, 2019.
Madding, R. P., Orlove, G. L., and Lyon, B. R.: The importance of spatial resolution in IR thermography temperature measurement: Three brief case studies, Proceedings of SPIE, 654108, 2007.
Niemeijer, A., Di Toro, G., Griffith, W. A., Bistacchi, A., Smith, S. A., and Nielsen, S.: Inferring earthquake physics and chemistry using an integrated field and laboratory approach, J. Struct. Geol., 39, 2–36, https://doi.org/10.1016/j.jsg.2012.02.018, 2012.
Oohashi, K., Hirose, T., and Shimamoto, T.: Shear-induced graphitization of carbonaceous materials during seismic fault motion: Experiments and possible implications for fault mechanics, J. Struct. Geol., 33, 1122–1134, https://doi.org/10.1016/j.jsg.2011.01.007, 2011.
Proctor, B. P., Mitchell, T. M., Hirth, G., Goldsby, D., Zorzi, F., Platt, J. D., and Di Toro, G.: Dynamic weakening of serpentinite gouges and bare surfaces at seismic slip rates, J. Geophys. Res.-Sol. Ea., 119, 8107–8131, https://doi.org/10.1002/2014JB011057, 2014.
Rice, J. R.: Heating and weakening of faults during earthquake slip, J. Geophys. Res.-Sol. Ea., 111, B05311, https://doi.org/10.1029/2005JB004006, 2006.
Saber, O.: Development and characterization of a high-speed material-testing machine, and experimental analysis of frictional flash heating and dynamic weakening in rock, Doctoral dissertation, Texas A&M University, http://hdl.handle.net/1969.1/165820 (last access: 17 September 2025), 2017.
Spagnuolo, E., Plümper, O., Violay, M., Cavallo, A., and Di Toro, G.: Fast-moving dislocations trigger flash weakening in carbonate-bearing faults during earthquakes, Scientific Reports, 5, 16112, https://doi.org/10.1038/srep16112, 2015.
Spray, J. G.: A physical basis for the frictional melting of some rock-forming minerals, Tectonophysics, 204, 205–221, https://doi.org/10.1016/0040-1951(92)90308-S, 1992.
Tullis, T. E.: Mechanisms for friction of rock at earthquake slip rates, Treatise on Geophysics, 4, 131–152, https://doi.org/10.1016/B978-0-444-53802-4.00073-7, 2015.
Yao, L., Ma, S., Niemeijer, A. R., Shimamoto, T., and Platt, J. D.: Is frictional heating needed to cause dramatic weakening of nanoparticle gouge during seismic slip?, Geophys. Res. Lett., 43, 6852–6860, https://doi.org/10.1002/2016GL069053, 2016a.
Yao, L., Ma, S., Platt, J. D., Niemeijer, A. R., and Shimamoto, T.: The crucial role of temperature in high-velocity weakening of faults, Geology, 44, 63–66, https://doi.org/10.1130/G37310.1, 2016b.
Yao, L., Ma, S., Chen, J., Shimamoto, T., and He, H.: Flash heating and local fluid pressurization lead to rapid weakening in water-saturated fault gouges, J. Geophys. Res.-Sol. Ea., 123, 9084–9100, https://doi.org/10.1029/2018JB015620, 2018.