the Creative Commons Attribution 4.0 License.
the Creative Commons Attribution 4.0 License.
 | 09 Apr 2025
Software program development of a high-precision magnetometer system for human-occupied vehicles
Qimao Zhang
Keyu Zhou
Ming Deng
Ling Huang
Cheng Li
Qisheng Zhang
Cesium optically pumped magnetometers are widely used in geophysical exploration, environmental monitoring, and scientific research for magnetic field measurements. Traditional magnetometer systems, however, encounter limitations in complex environments due to magnetic interference, low data acquisition efficiency, and inadequate real-time control, which affect both application and accuracy. To overcome these challenges, this paper presents a software system designed for cesium optically pumped magnetometers. The system incorporates automatic probe switching, data acquisition, user interface control, and a compensation algorithm. The automatic switching function mitigates dead zones in the optically pumped probes, ensuring continuous data collection. The data acquisition module supports multiple formats and transmission protocols, enhancing efficiency and ensuring data integrity. The user interface facilitates real-time monitoring and control of magnetometer operations. The system employs the Tolles–Lawson model to effectively suppress environmental magnetic interference, ensuring high-precision measurements even in complex environments. Experimental results confirm the system's enhanced sensitivity and stability, making it a reliable tool for precise magnetic field measurements in challenging conditions.
- Article
(5807 KB) - Full-text XML
- BibTeX
- EndNote


High-precision magnetic field measurements have significant applications in various fields such as geophysical exploration (Outlook on the Worldwide Quantum Magnetometer Industry to 2029), environmental monitoring (Tang et al., 2023), archeology (Eppelbaum and Mishne, 2011; Eppelbaum, 2015; Stele et al., 2023; Schmidt et al., 2024), searching abandoned wells (AlBadi et al., 2023), studying thin biological effects (Krylov, 2017), and scientific research (Bennett et al., 2021). As a crucial measurement tool, magnetometers are capable of accurately detecting the Earth's magnetic field, underground mineral deposits, and environmental changes. However, traditional magnetometer systems face numerous challenges in practical applications, such as environmental magnetic interference, low data acquisition efficiency, and insufficient real-time control capabilities. These issues limit their application and measurement accuracy in complex environments. In particular, environmental magnetic interference and noise significantly affect measurement accuracy, making it imperative to effectively eliminate these interferences. Additionally, traditional data acquisition software often struggles with processing large volumes of data efficiently, compromising data integrity and reliability. The lack of real-time control capabilities further hinders users from making quick adjustments and optimizations during measurements.
Cesium optically pumped magnetometers, known for their high sensitivity and precision, have become essential instruments in modern magnetic field measurements (Lebedev et al., 2020). To address the aforementioned challenges, researchers have proposed various improvements in recent years (Lebedev et al., 2020; Dong et al., 2021). However, most studies have focused on hardware enhancements (Xue et al., 2021; Da et al., 2024; Liu et al., 2018, 2020; Dou et al., 2018; Peng et al., 2021; Schultze et al., 2015; Greene et al., 2024), with relatively few addressing software systems (Hu et al., 2017; Narita et al., 2021), particularly in terms of improving data acquisition efficiency and real-time control capabilities. In fact, software systems play a crucial role in enhancing the efficiency and accuracy of magnetometer measurements. Efficient data acquisition software can significantly increase data processing speed, ensuring data integrity and reliability. Powerful display and control software can provide intuitive user interfaces and flexible control functions, enhancing user experience. Advanced compensation algorithms can effectively eliminate environmental interferences, improving measurement accuracy.
To improve the measurement accuracy and application efficiency of cesium optically pumped magnetometers in complex environments, this paper designs and implements a high-precision magnetometer software system based on the HOV (human-occupied vehicle) platform. The system primarily consists of probe automatic switching software, data acquisition and processing software, and upper-computer software. The probe automatic switching system is used to automatically switch between three working probes, avoiding probe dead zones and enhancing measurement continuity and reliability. The data acquisition and processing software is responsible for efficient data collection and storage and includes real-time magnetic compensation data processing functions. By introducing the Tolles–Lawson model, it effectively eliminates environmental magnetic interference. At the same time, to address environmental disturbances, particularly during natural disasters such as thunderstorms, the system is equipped with built-in transient voltage suppression (TVS) diodes. These diodes protect electronic components from damage caused by power surges induced by thunderstorms. In terms of software error handling, raw serial port data are first verified through frame header and frame tail checks, followed by an XOR checksum to ensure that corrupted data caused by interference do not propagate to subsequent stages of data processing. Data that fail the validation are treated as packet loss. Additionally, for abnormal data collected via the serial port, spike removal is applied to eliminate outliers. Sudden abnormal values, such as interference caused by engine startups or power-on events from other equipment, are constrained within predefined limits. Any out-of-range data are replaced by the previous valid data point. For raw serial port data, packet loss is monitored and handled accordingly. If the duration of packet loss is less than 5 s, the most recent valid data point is used as a substitute to ensure no loss in sample count and to maintain temporal consistency in data processing. If packet loss exceeds 5 s, the data acquisition system is restarted. The upper-computer main control system runs the display and control software, providing an intuitive user interface and powerful control functions, allowing users to monitor and adjust the magnetometer's operational status in real time. Rigorous testing has demonstrated that the probe achieves noise levels as low as 1 pT , with the system exhibiting a sensitivity of 0.5 nT. Under the monitoring and control of the software, the system has consistently demonstrated its capability to accurately collect data while maintaining stable and reliable operational performance.
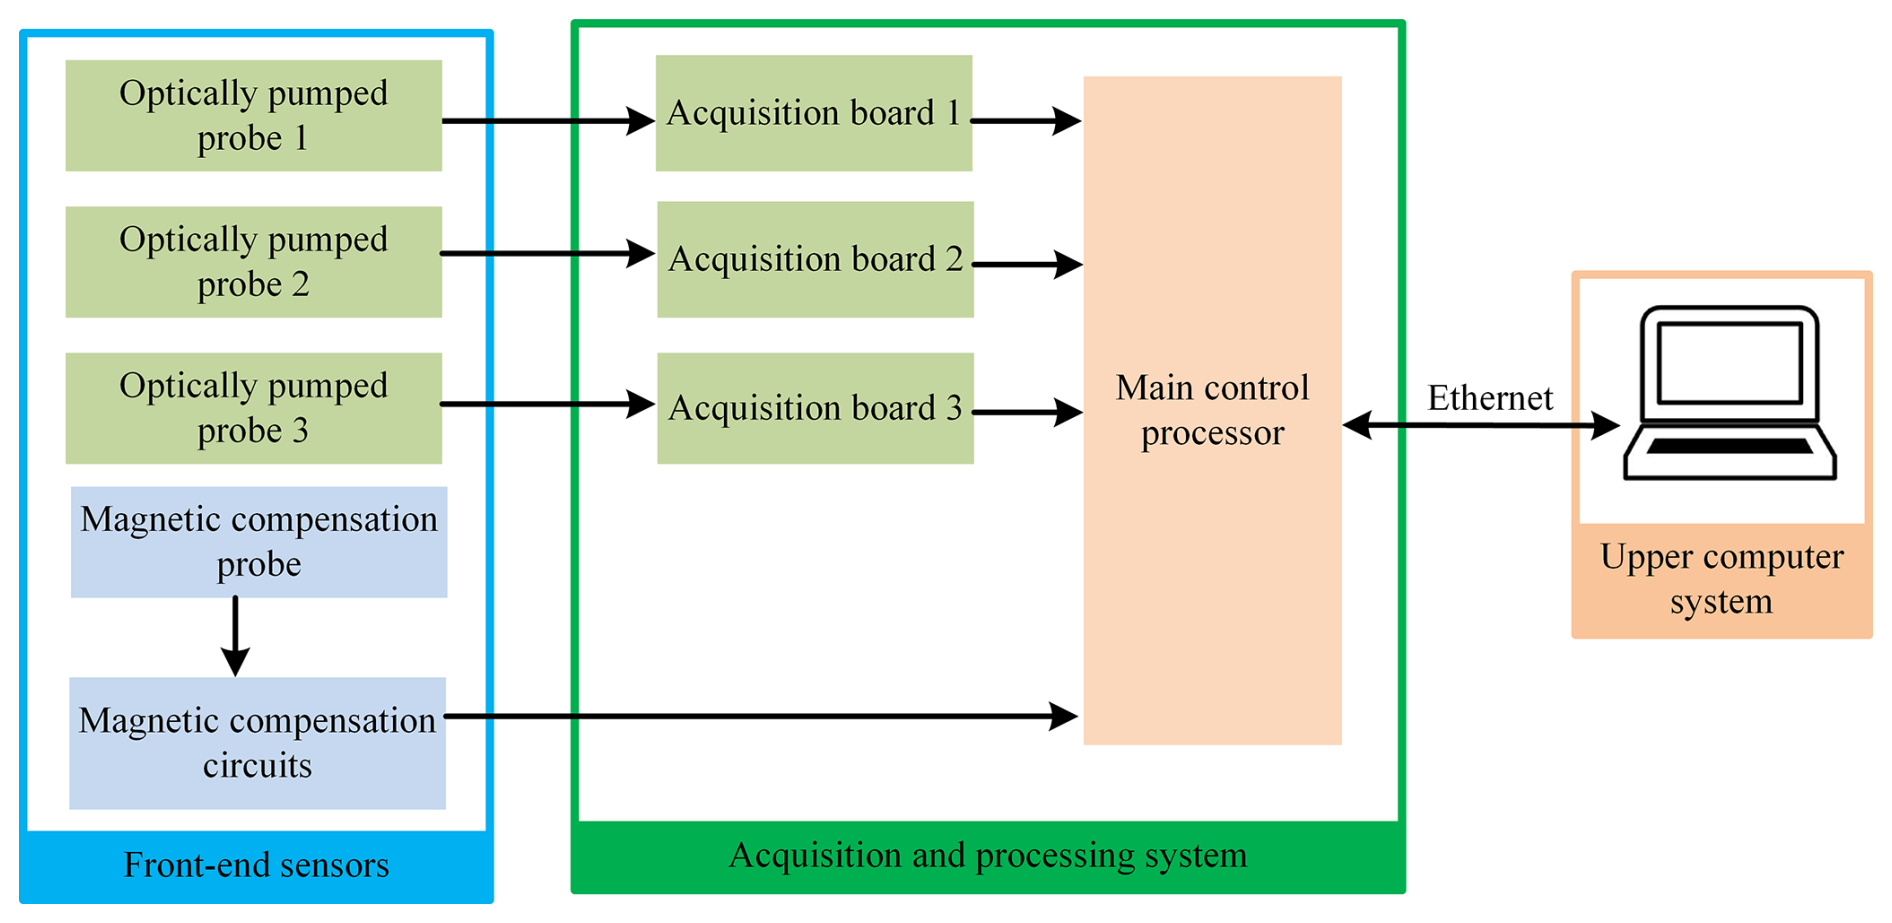
The block diagram of the high-precision cesium optically pumped magnetometer system proposed in this paper is shown in Fig. 1. It consists of three main parts: the front-end sensor section, the data acquisition and processing system, and the upper-computer main control system.
The front-end sensor section includes a set of optically pumped sensors and magnetic compensation probes, which convert magnetic field signals into electrical signals and transmit them to the subsequent acquisition board. The data acquisition and processing system is composed of filter circuit modules, amplification circuit modules, waveform shaping modules, temperature control modules, radio frequency (RF) excitation circuit modules, power supply modules, and the main control processor. The main control processor, centered around the Zynq platform, integrates an analog-to-digital conversion (ADC) chip, comparator shaping circuits, data interface circuits, clock circuits, and power modules. It is responsible for converting the incoming analog signals into digital signals and communicating with the upper computer on the HOV platform.
The upper-computer main control system communicates with the data acquisition and processing system via Gigabit Ethernet, allowing users to monitor and adjust the magnetometer's operational status in real time.
2.1 Hardware platform
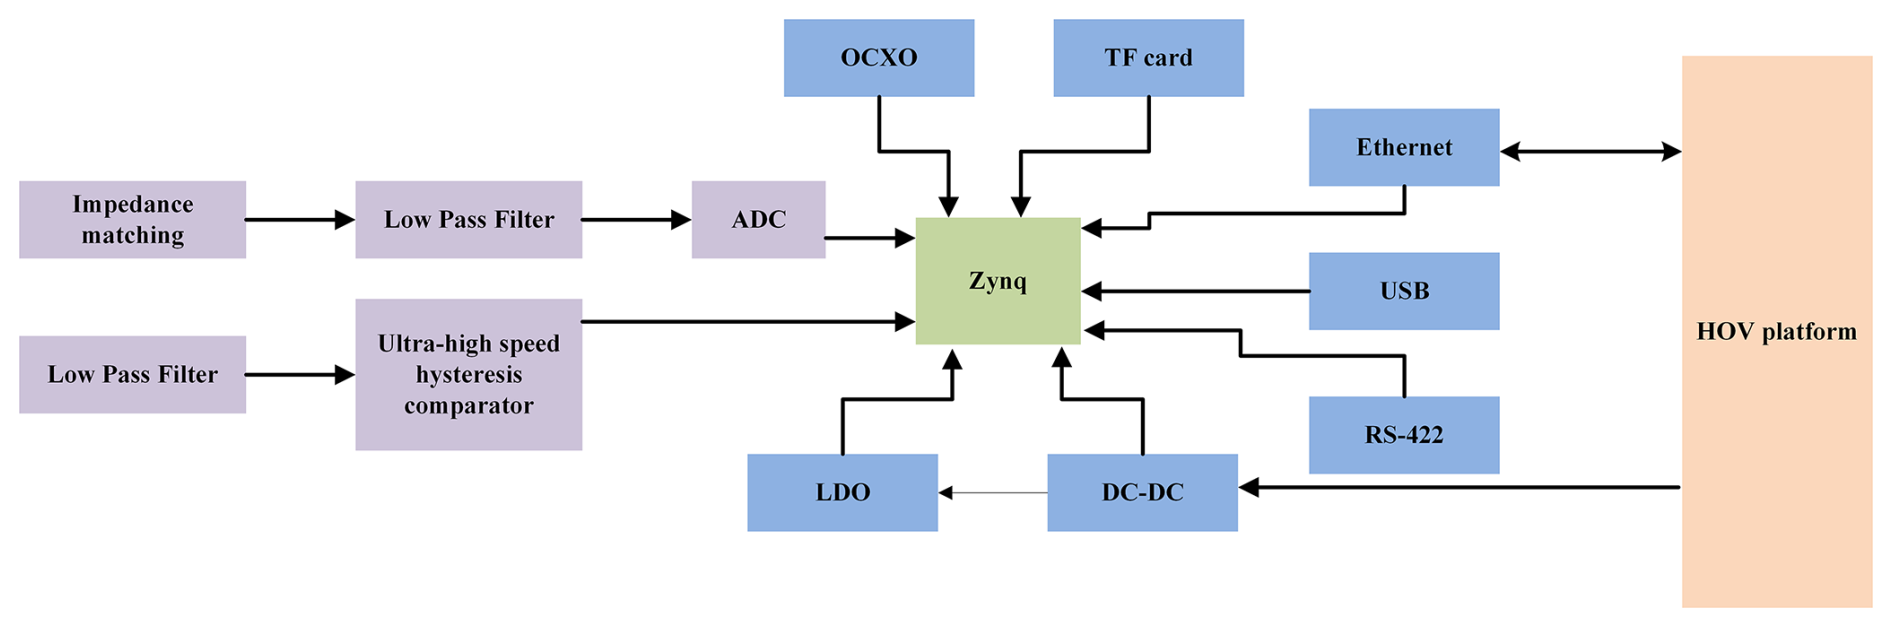
The block diagram of the main control processor is shown in Fig. 2. Two types of analog signals from the front-end acquisition section enter the processor. The signal from the magnetic compensation probe first passes through an impedance matching circuit to obtain the most accurate analog signal. Next, an anti-aliasing low-pass filter is designed according to the sampling rate. Finally, the signal is converted to a digital signal through an ADC.
The Zynq PL (programmable logic) side controls the ADC chip for data acquisition while temporarily storing the collected data in the system memory. The Larmor frequency signal from the optically pumped probe is coupled to the power line output through a transformer, with a frequency range of 50 to 350 kHz and an amplitude of approximately 300 mVpp. First, the Larmor frequency signal is separated from the power line. Then, it undergoes low-pass filtering to remove out-of-band noise. Finally, an ultra-high-speed hysteresis comparator outputs a low-jitter digital logic signal. The PL side calculates the frequency of the digital logic signal and outputs the magnetic field value. A temperature-compensated crystal oscillator provides a high-precision clock source for frequency measurement. The PS (processing system) side mainly stores the data on a local microSD card and communicates with the upper computer for real-time data transmission.
2.2 Software overall design
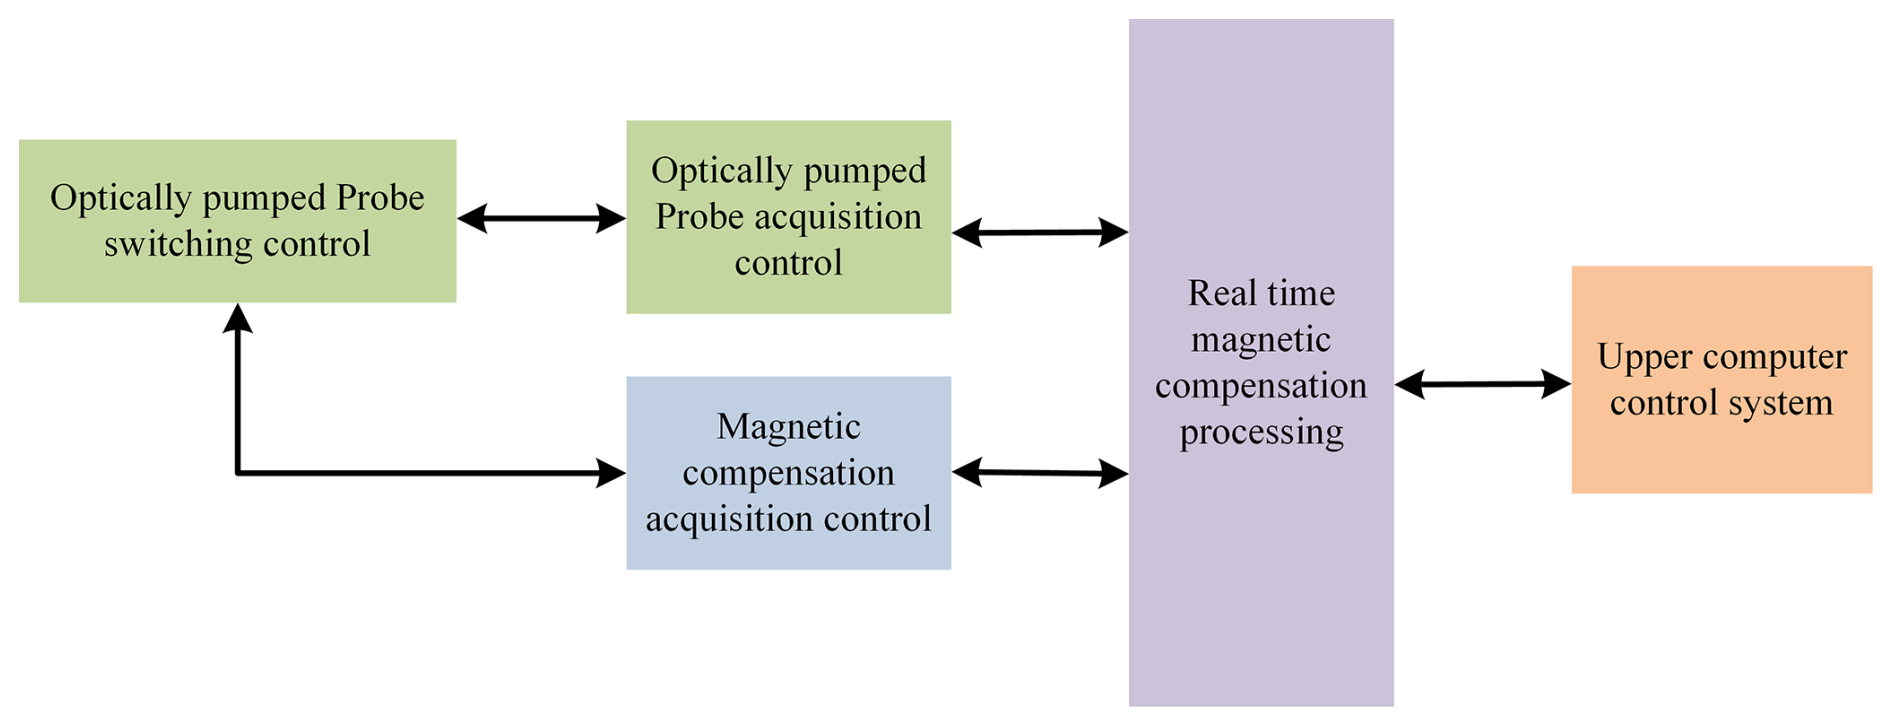
The software components are mainly integrated into the data acquisition and processing system and the upper-computer main control system. The data acquisition and processing software system includes probe automatic switching software, data acquisition software, real-time magnetic compensation data processing software, data storage software, and data communication software. Real-time magnetic compensation data processing is executed in the device, with an output frequency of one data packet every 100 ms. Each packet contains 200 bytes of data and can be transmitted simultaneously via the RS422 serial port (baud rate of 115 200 bps) and a gigabit network. For data transmission using the RS422 serial port at a baud rate of 115 200 bps, the typical delay does not exceed 100 ms. This low latency ensures the system's rapid response to dynamic magnetic field interference, meeting the real-time data processing requirements for applications in fields such as geophysical exploration. These are some of the software modules for the data acquisition and processing software, developed using a hybrid programming approach with C and C. The software runs on an embedded ARM Linux platform. C language is used to implement functions such as system resource management, thread scheduling, and data communication. Meanwhile, C is utilized to handle real-time magnetic compensation data processing and automatic probe switching. The G (GNU C compiler) is used as the compiler. One of the key features of this software is its capability to perform magnetic compensation coefficient calculations and real-time magnetic compensation data processing directly on the embedded device. The upper-computer main control software system comprises the data communication module, display module, and data storage module. The overall software architecture is shown in Fig. 3.
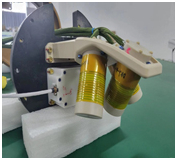
Optically pumped probes possess high sensitivity and precision in magnetic field measurements. However, when the magnetic field direction is at 90 or 0° to the probe's optical axis, the probe's sensitivity is at its lowest, creating dead zones. These dead zones can lead to decreased measurement accuracy, data discontinuity, and limited application range (Zhou et al., 2024). To address this issue, we employ a multi-probe system and automatic switching software. By using multiple optically pumped probes installed at different angles to cover various magnetic field directions and designing an automatic switching software, the system can automatically select the optimal working probe based on the current magnetic field direction. This approach avoids the dead zones of the probes, ensuring continuous and reliable measurements. The hardware setup of the three-probe system is shown in Fig. 4.
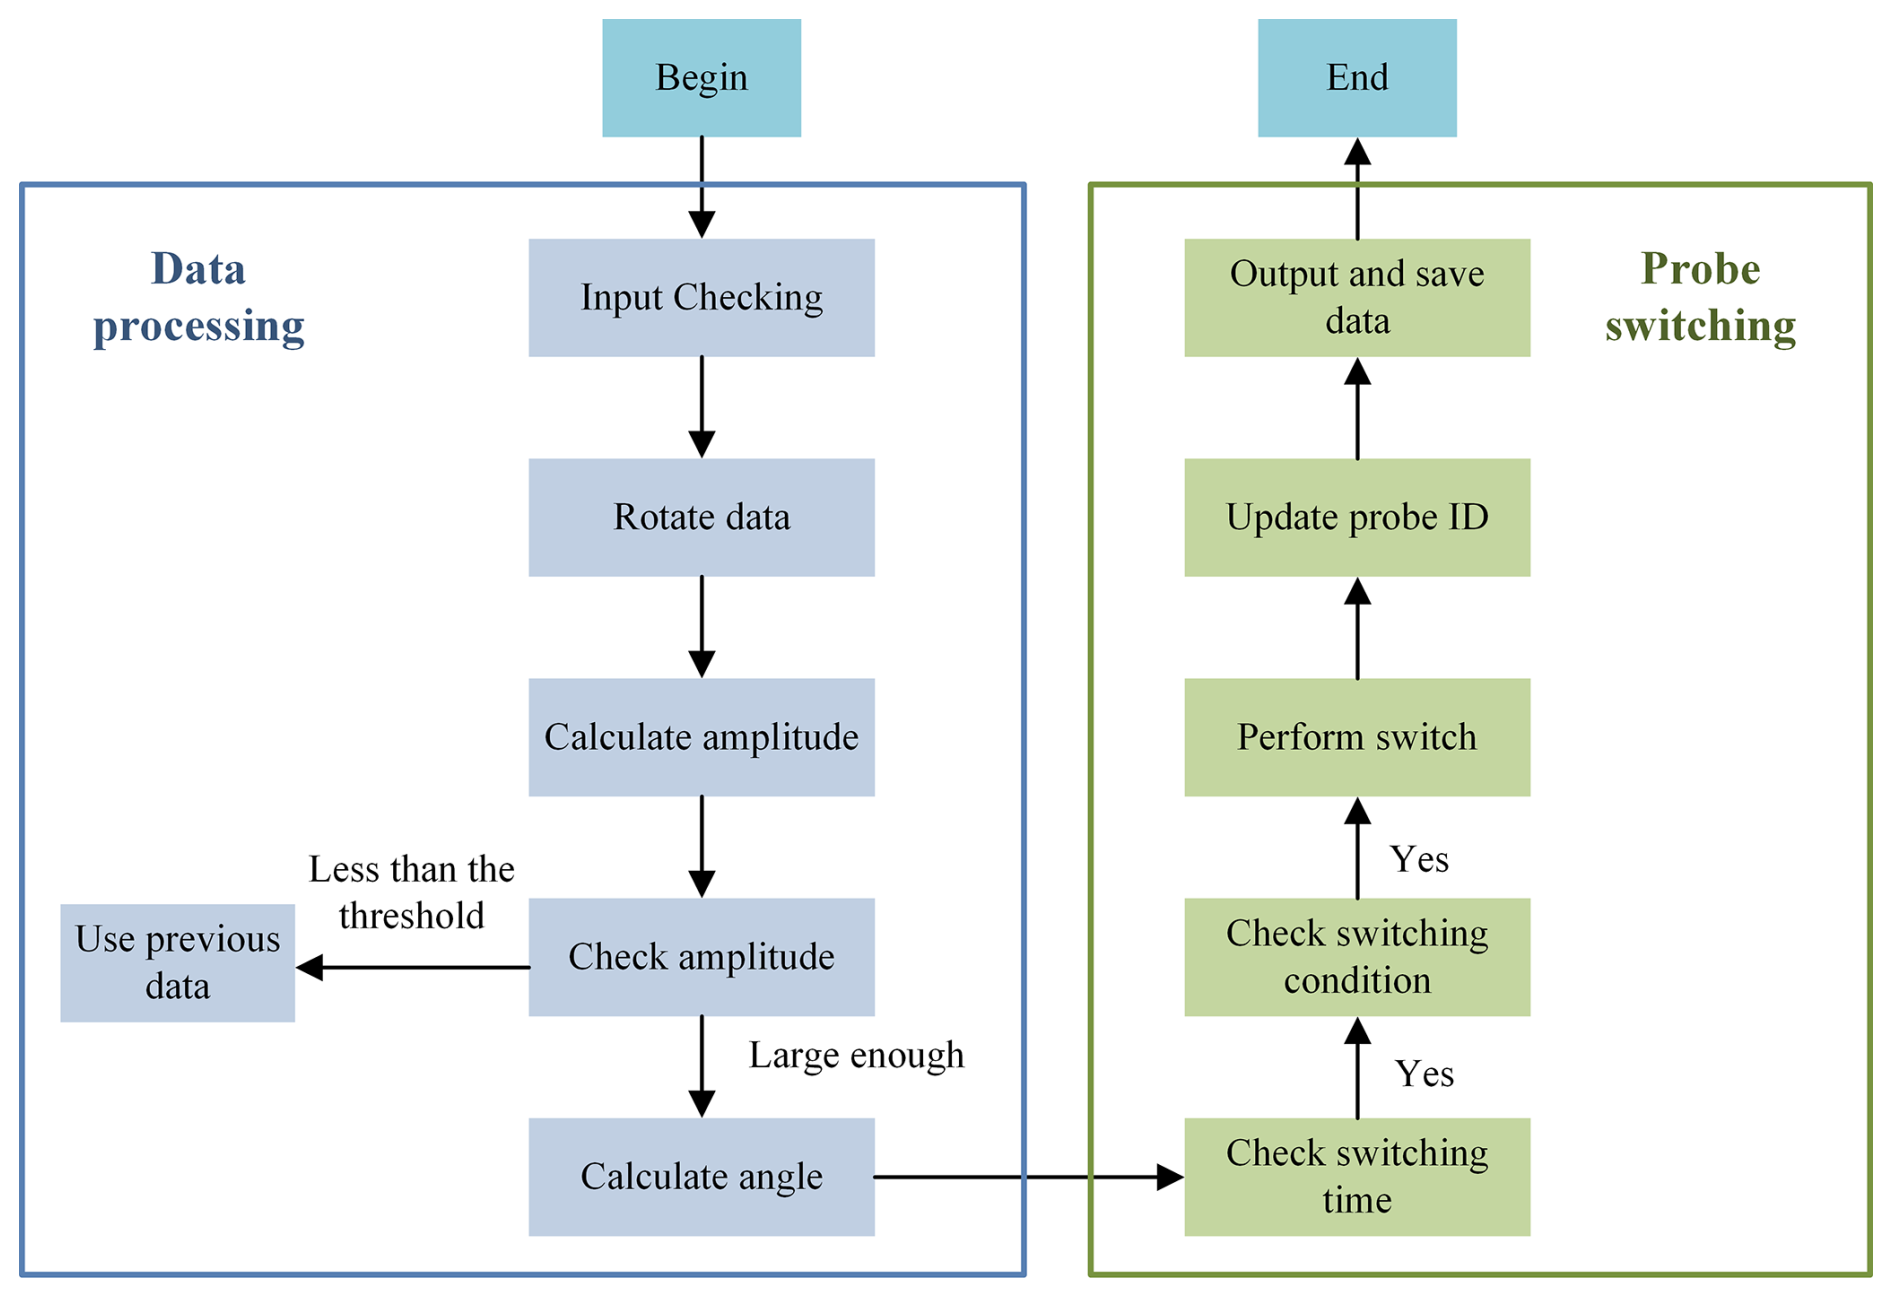
The process of the probe automatic switching software is shown in Fig. 5. First, the magnetic compensation probe is used to calculate the current magnetic inclination (±90°) and magnetic declination (±180°). Then, combined with the known installation angles of the three optically pumped probes relative to the magnetic compensation probe, the angle between each optically pumped probe and the geomagnetic field is calculated. The specific steps include obtaining the measurement results from the magnetic compensation probe, determining the installation angles of the optically pumped probes, and calculating the actual angle between each probe and the geomagnetic field through geometric relationships. Ideally, the working angle is optimal when the angle between the optically pumped probe and the geomagnetic field is 45°. Therefore, the next step is to calculate the actual angle between each probe and the geomagnetic field and compare it with 45° to obtain the working deviation value for each probe. By comparing the deviation values of the three probes, the probe with the smallest deviation is selected as the current working probe. In this way, the probe automatic switching software can intelligently select the optimal working probe, avoiding the dead zones of the probes and ensuring continuous and accurate measurements.
To further enhance the reliability and practicality of the system, the probe automatic switching software records the time, reason, and selected probe for each switching event, facilitating subsequent analysis and optimization. Additionally, the upper-computer software provides an intuitive user interface that displays the current magnetic field measurements, probe status, and switching records, allowing users to monitor and operate the system in real time. Finally, the system includes an alarm mechanism that can issue alerts in the event of probe switching failures or abnormal magnetic field conditions, prompting users to check and address the issues.
Based on the application requirements of the carrier magnetic interference compensation system, the software system includes the following functions:
-
a data communication function, which establishes network communication with the display and control computer, enabling command parsing and data uploading;
-
a data collection and control function, which collects data from the optically pumped magnetometer, three-axis fluxgate magnetometer, and auxiliary information, while also controlling hardware operational states and parameter settings;
-
real-time processing of magnetic compensation data, which utilizes magnetic compensation coefficients to perform real-time calculations to compensate for magnetic interference effects on the HOV platform; and
-
a data storage function, which stores navigation state parameters, compensation coefficients, raw magnetic data, and processed results during the survey.
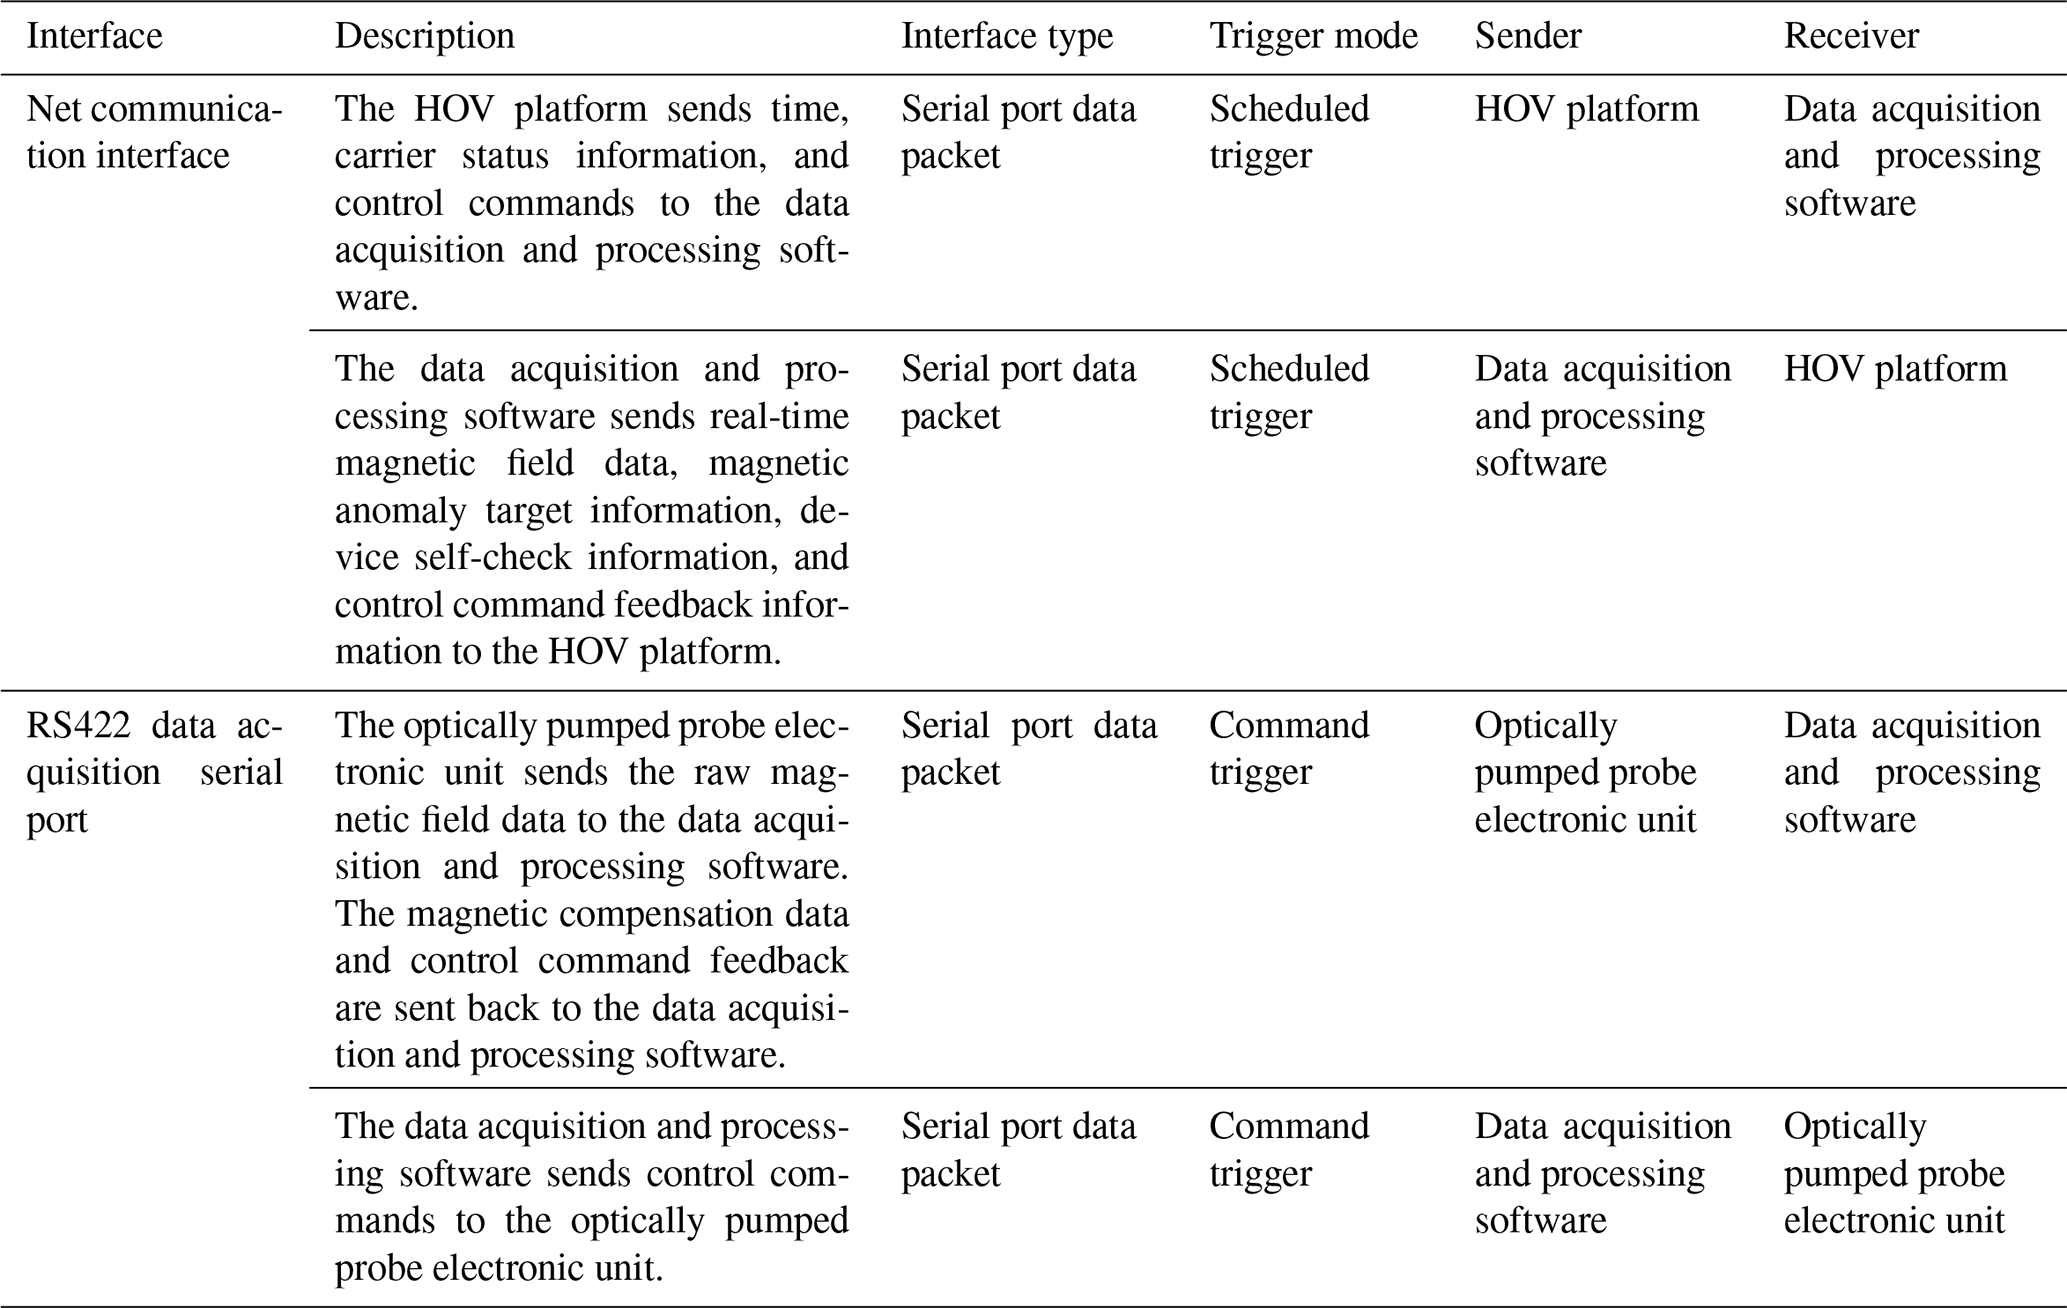
The system reports real-time data every 100 ms. The raw magnetic field data are collected at 120 Hz and downsampled to a 100 ms interval through filtering. All magnetic compensation data processing and magnetic anomaly detections are performed using the 100 ms interval data. The real-time data reported include raw geomagnetic data, raw magnetic compensation data, and compensated geomagnetic data, all downsampled to a 100 ms interval through filtering. The external communication interface uses a network interface to communicate with the upper-computer main control system, and data acquisition utilizes RS422-based serial communication. Table 1 lists the external interfaces of the data acquisition and processing software.
Table 1External interfaces of the data acquisition and processing software.
Each functional module of the data acquisition and processing software operates independently and uses multithreading for simultaneous processing. Data transfer between functional modules is achieved through multi-level shared buffers. Shared buffers are created for five internal interfaces, and each functional module retrieves data from the circular buffer according to the interface-defined structure, processes it, and then writes the processed data back into the input circular buffer. The data storage module operates as a separate thread, reading data from the multi-level buffers at fixed intervals and writing it to files. The internal interface objects of the data acquisition and processing software include the data acquisition and control module, the magnetic compensation coefficient invocation module, the magnetic compensation data processing module, the device self-check and status reporting module, and the data storage module. The internal interface diagram of the software is shown in Fig. 6, and the internal interface list is presented in Table 2.
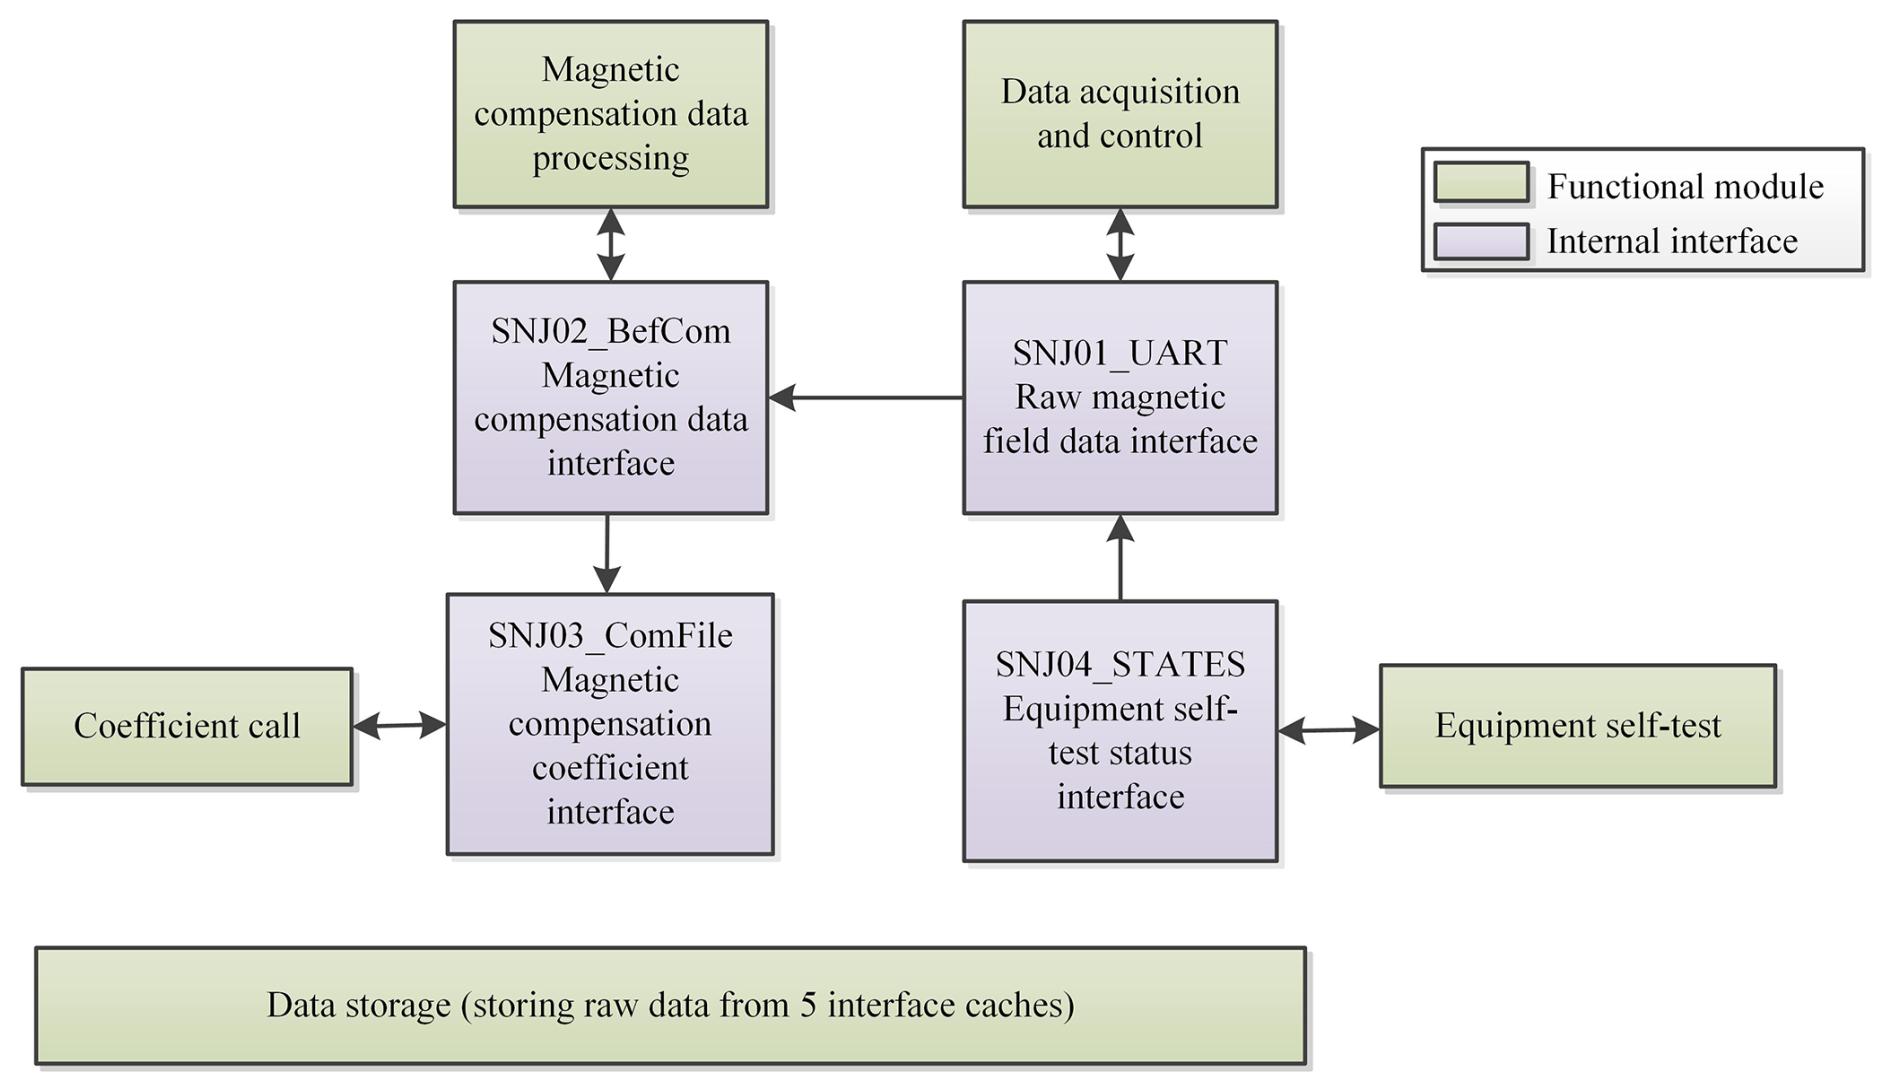
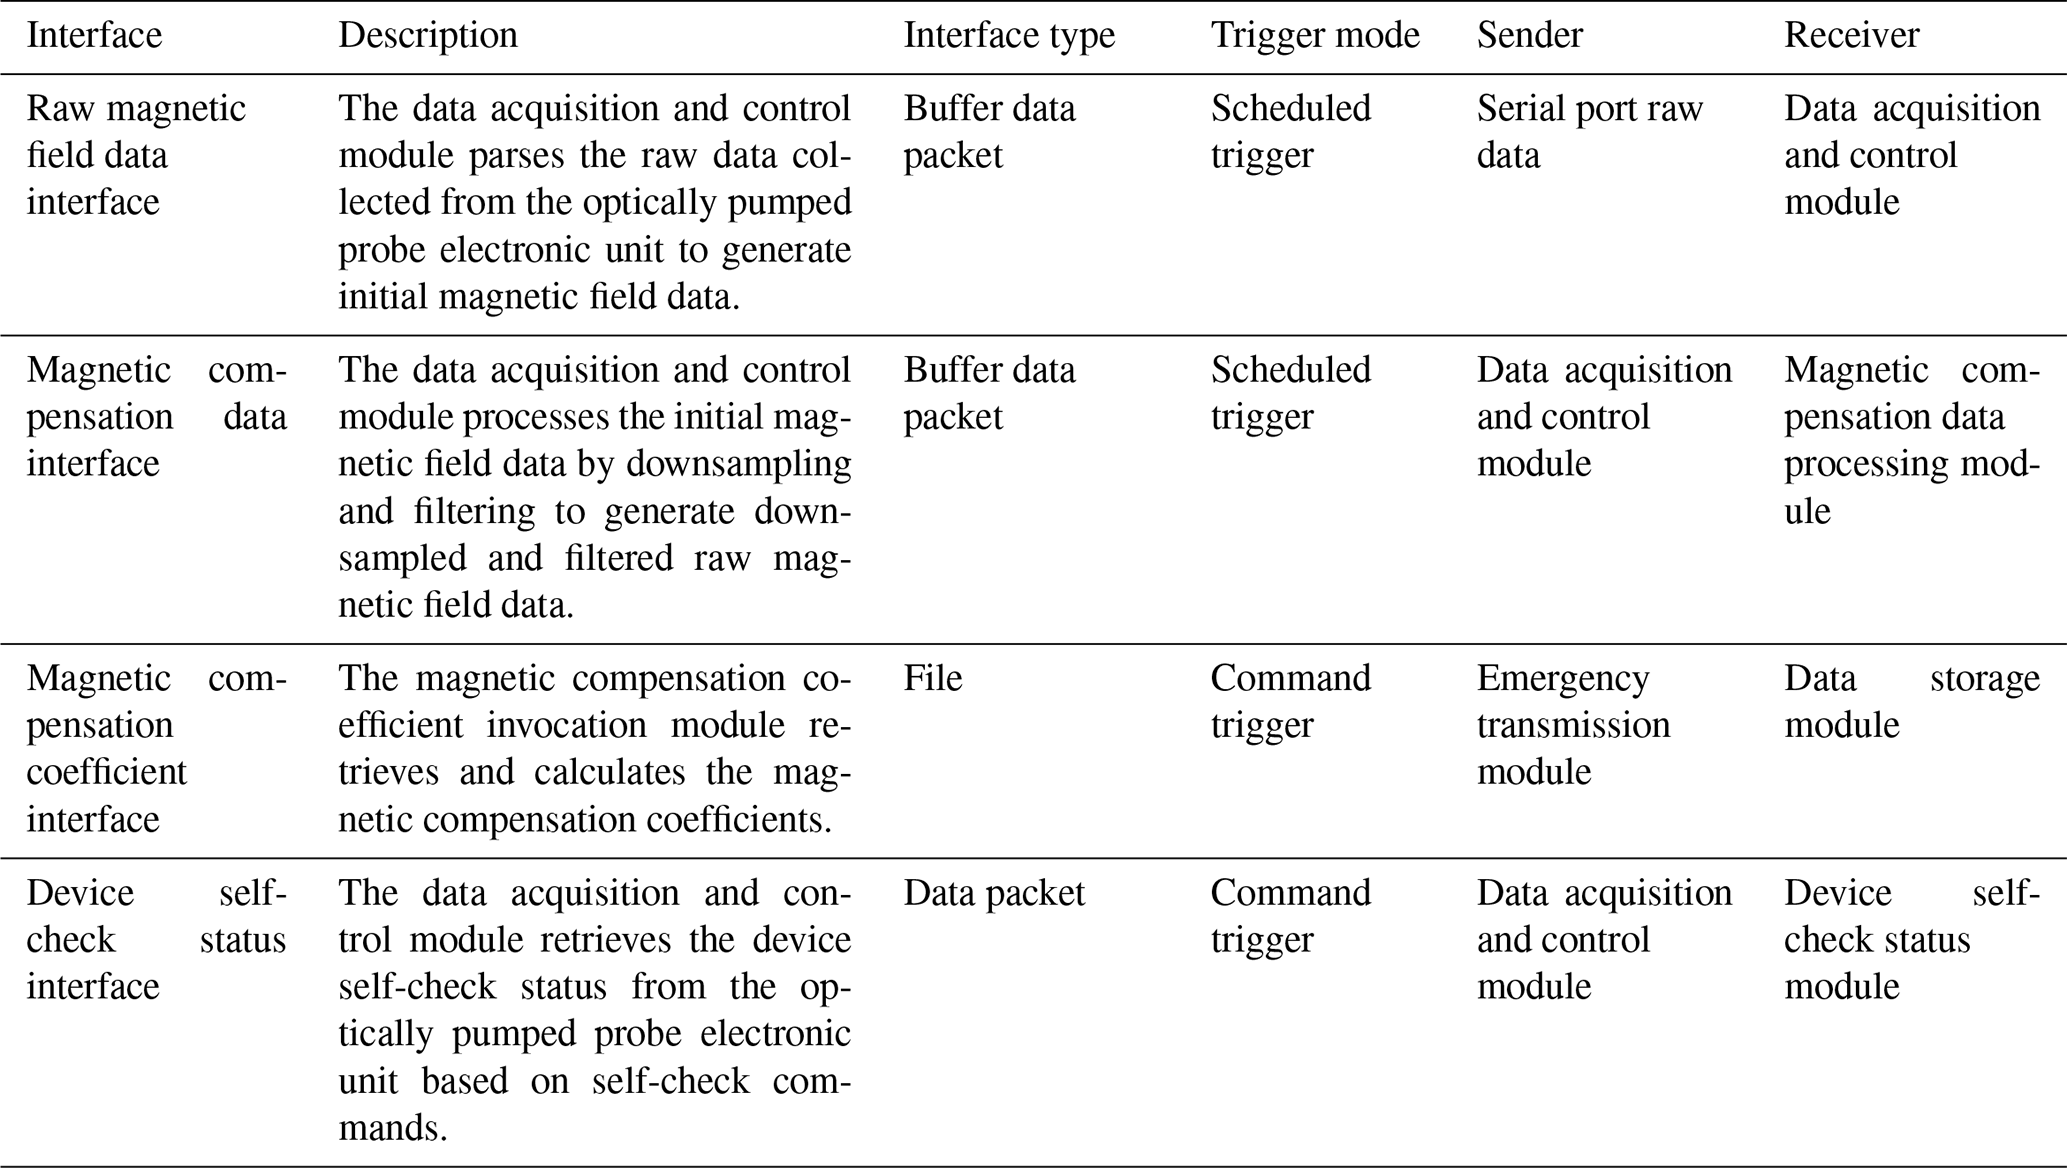
Table 2Internal interface list of the data acquisition and processing software.
4.1 Data acquisition and control software
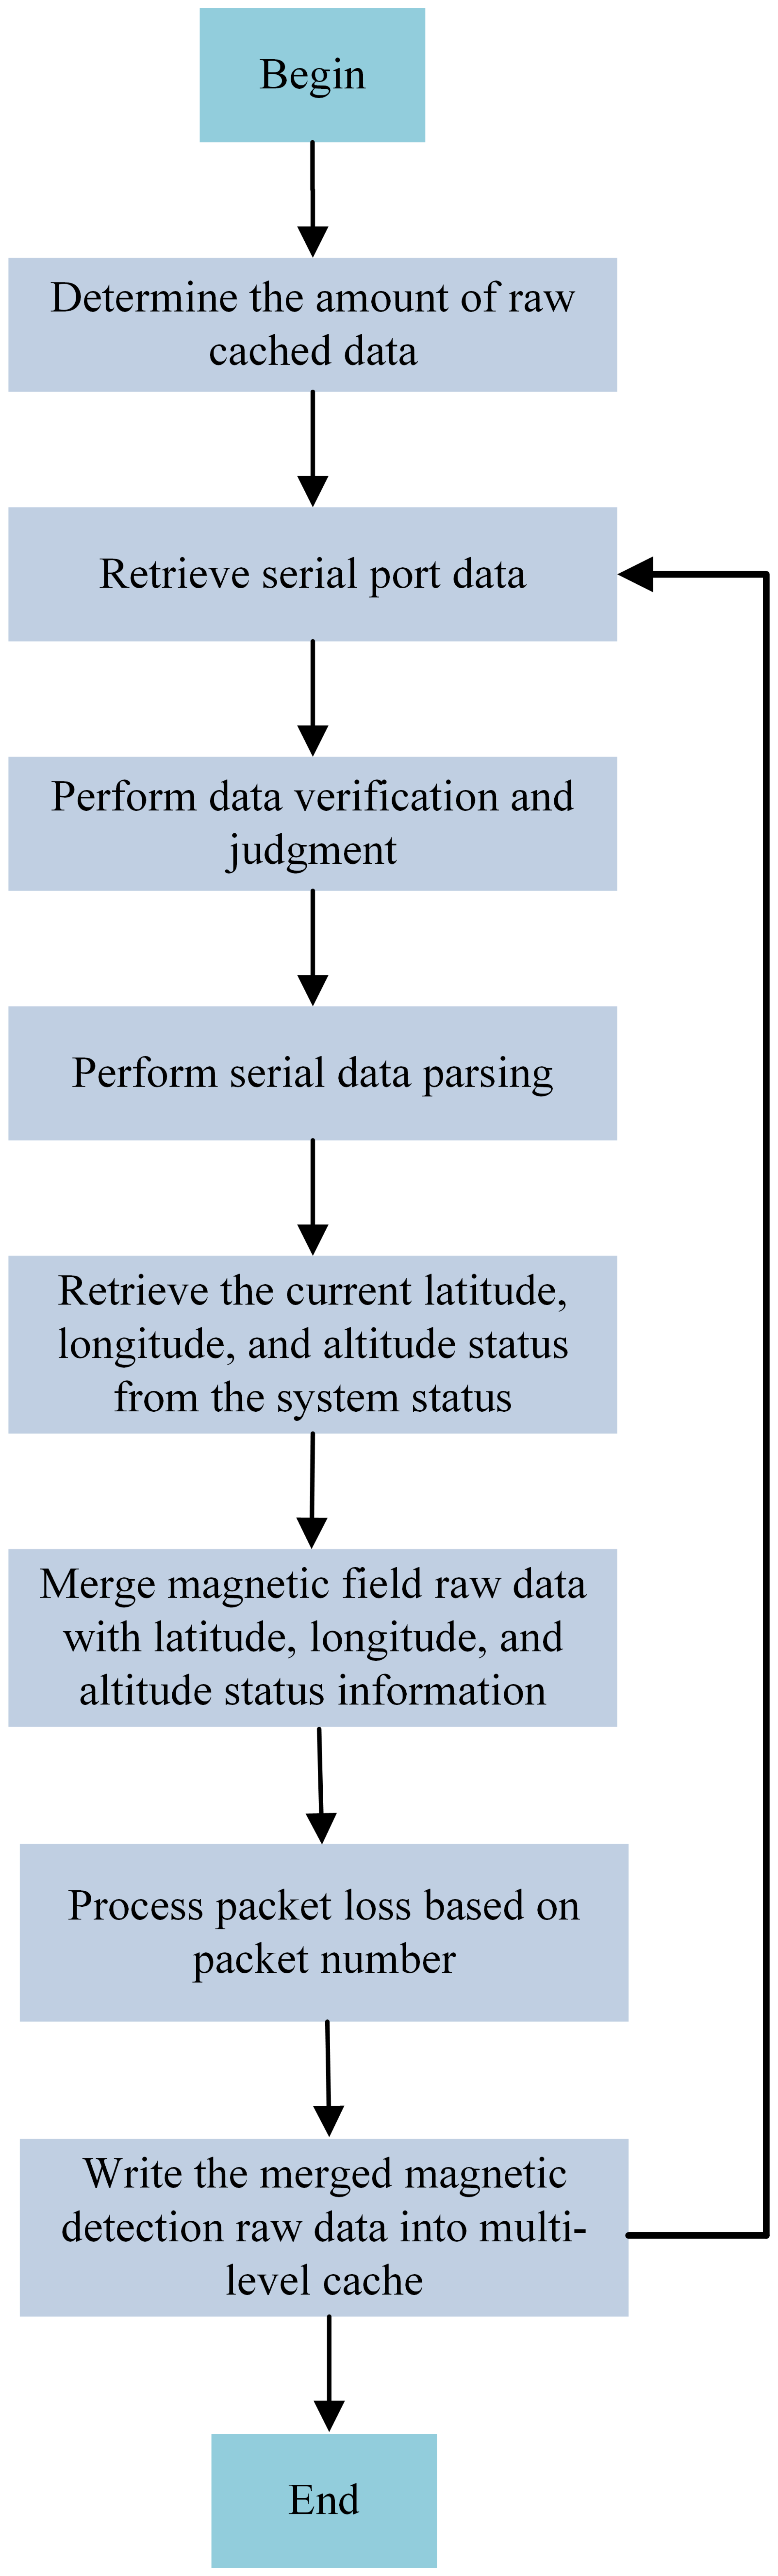
The data acquisition and control module primarily implements the functions of magnetic compensation probe data acquisition control, optically pumped probe data acquisition control, hardware status monitoring, self-check, and fault detection. The data acquisition and control module collects raw magnetic field data from the magnetic compensation probe and the optically pumped probe through RS422 serial port. Additionally, it merges the current system status, including latitude, longitude, altitude, and control status words, into the data to generate raw magnetic detection data, which are then written into the data buffer. The logical flowchart is shown in Fig. 7. The process begins by determining the amount of raw cached data, followed by the retrieval of serial port data. Next, the system performs data verification and judgment to ensure the integrity of the data before proceeding to parse the serial data. It then retrieves the current latitude, longitude, and altitude status from the system's status records. The magnetic field raw data are merged with this location and altitude information. Any packet loss is handled based on packet numbers to ensure data consistency. Finally, the merged magnetic detection raw data are stored into a multi-level cache before the process ends.
Exception handling. Initially, the raw serial port data undergo frame header and frame trailer verification to ensure data integrity. Subsequently, an XOR checksum is performed on the raw serial port data to prevent the propagation of erroneous data to subsequent processing stages in the presence of interference. Data that fail the checksum are treated as packet loss.
Moreover, for abnormal data collected from the serial port, spike removal processing is employed. This involves defining threshold limits for sudden anomalous values, such as those induced by engine startup interference or other equipment power-on interference. Data exceeding these limits are replaced with the preceding data point.
For raw serial port data, packet loss detection is implemented. If the packet loss duration is less than 5 s, the most recent data point is utilized as a replacement to maintain the number of sample points and ensure the temporal consistency of data processing. In instances where the packet loss duration exceeds 5 s, the data acquisition process is restarted. This methodology ensures the robustness and reliability of the data acquisition system, mitigating the impact of transient errors and preserving data integrity.
4.2 Magnetic compensation data processing software
The Tolles–Lawson model (Feng et al., 2022) is a mathematical model used for magnetic compensation and is widely applied in fields such as aeromagnetic surveys, marine magnetic surveys, and terrestrial magnetic surveys. This model was proposed by R. H. Tolles and C. A. Lawson in the 1960s with the aim of compensating for various interference factors in magnetic field measurements, particularly errors caused by the inherent magnetism and electromagnetic interference of the carrier (e.g., aircraft or ships) (Hezel, 2020).
According to the Tolles–Lawson model, the interference magnetic field generated by the carrier platform can be divided into three types: constant magnetic field, induced magnetic field, and eddy current magnetic field. If Ht(t) is defined as the total intensity of the interfering magnetic field, then
The constant magnetic field HPERM(t) caused by the inherent magnetism of the carrier ferromagnetic component can be expressed as
Among them, ci is the constant magnetic field compensation coefficient, and Ai(t) is a variable composed of the direction cosine. The induced magnetic field HIND(t) can be expressed as
Among them, cj is the compensation coefficient of the induced magnetic field, and Aj(t) is the variable composed of the environmental magnetic field and the direction cosine.
The eddy current magnetic field HEDDY(t) can be expressed as
Among them, , , and are the derivatives of u1, u2, and u3, respectively; ck is the compensation coefficient of the eddy current magnetic field; and Ak(t) is a variable composed of the environmental magnetic field He(t) and the direction cosine.
Corresponding matrix is as follows:
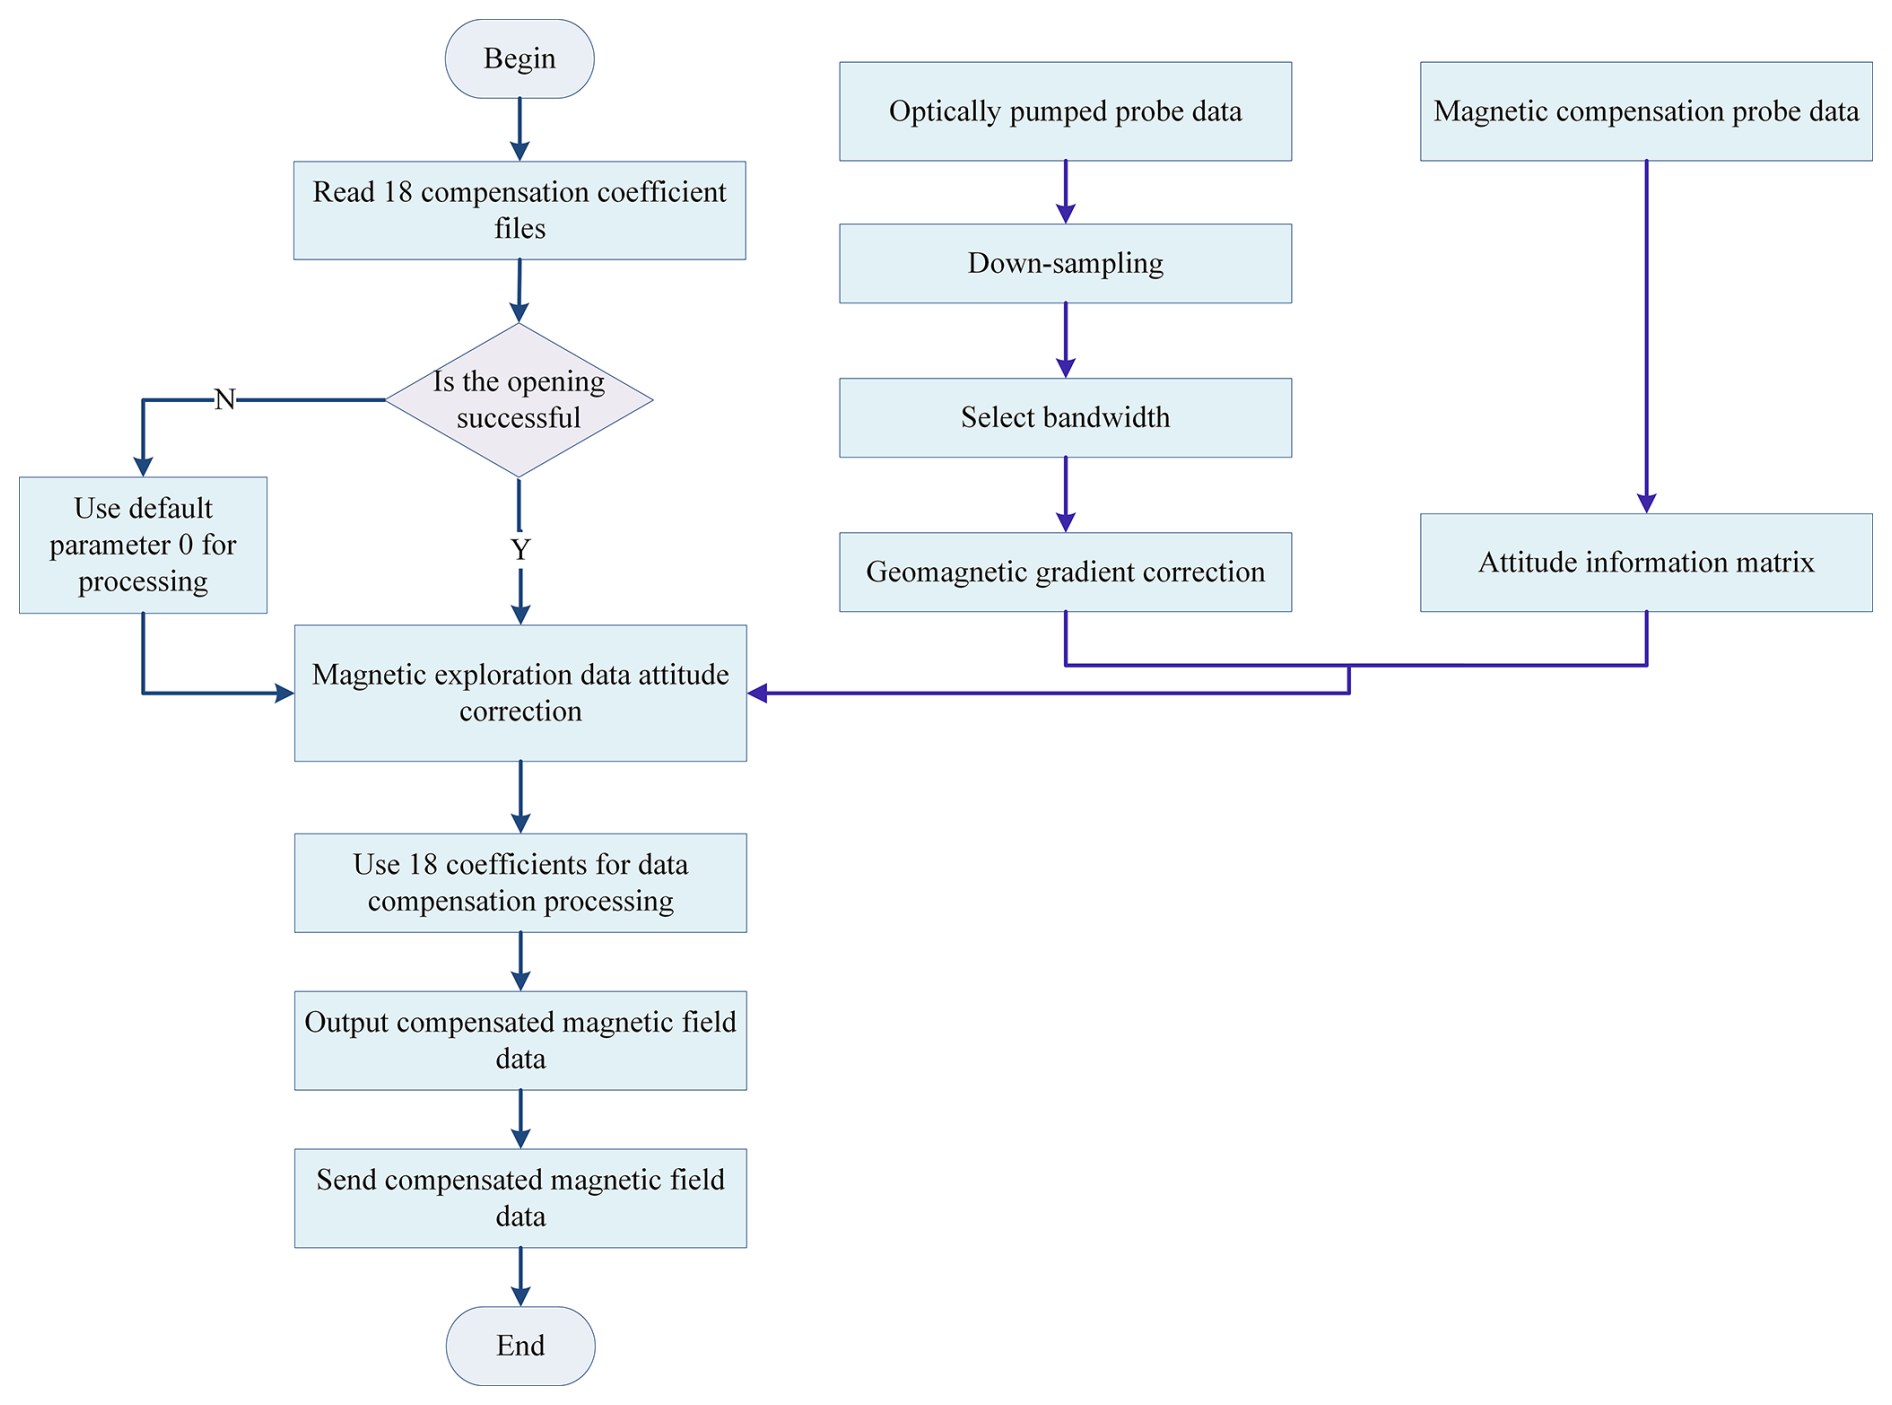
The compensation coefficient for interference magnetic field, which is used in Fig. 8, can be obtained by solving the following formula:
The magnetic field data processing module integrates data from both the optically pumped probe and the magnetic compensation probe to generate magnetic compensation data. The flowchart of the magnetic field data processing is shown in Fig. 8. The process starts by attempting to read 18 compensation coefficient files. If the files fail to open, the system defaults to parameter 0 for processing. If successful, the system performs attitude correction for magnetic exploration data. Simultaneously, optically pumped probe data undergo downsampling, bandwidth selection, and geomagnetic gradient correction. Magnetic compensation probe data are used to compute an attitude information matrix, which feeds into the attitude correction process. Afterward, the system applies the 18 coefficients for data compensation processing. It outputs the compensated magnetic field data, which are then sent onward, marking the end of the process.
4.3 Magnetic detection status reporting and data storage function
The status reporting function module of the magnetic detection instrument is implemented through network-based data communication. During operation, the magnetometer automatically performs data acquisition upon power-up and simultaneously reports the device status to the upper computer's magnetic measurement display and control software. The data storage module creates a data file based on the system time during software initialization. Under normal operating conditions (magnetic compensation mode, magnetic compensation with automatic identification mode, or magnetic compensation with manual identification mode), the module determines the size of unsaved data in the buffer by calculating the difference between the read and write pointers of the multi-level circular buffer at 1 s intervals. It then writes the unsaved data from the buffer to the data file. When creating a file, the system checks the remaining disk space. If the available storage space is less than 100 MB, data acquisition is halted, and data storage is discontinued to prevent data loss. The data acquisition and processing software checks the remaining disk space every second. When the available space approaches a critical threshold (configurable via a settings file), it automatically deletes the oldest files based on their modification timestamps until the available space exceeds 70 %. This automated cleanup process is logged in the system's log file for record-keeping and traceability.
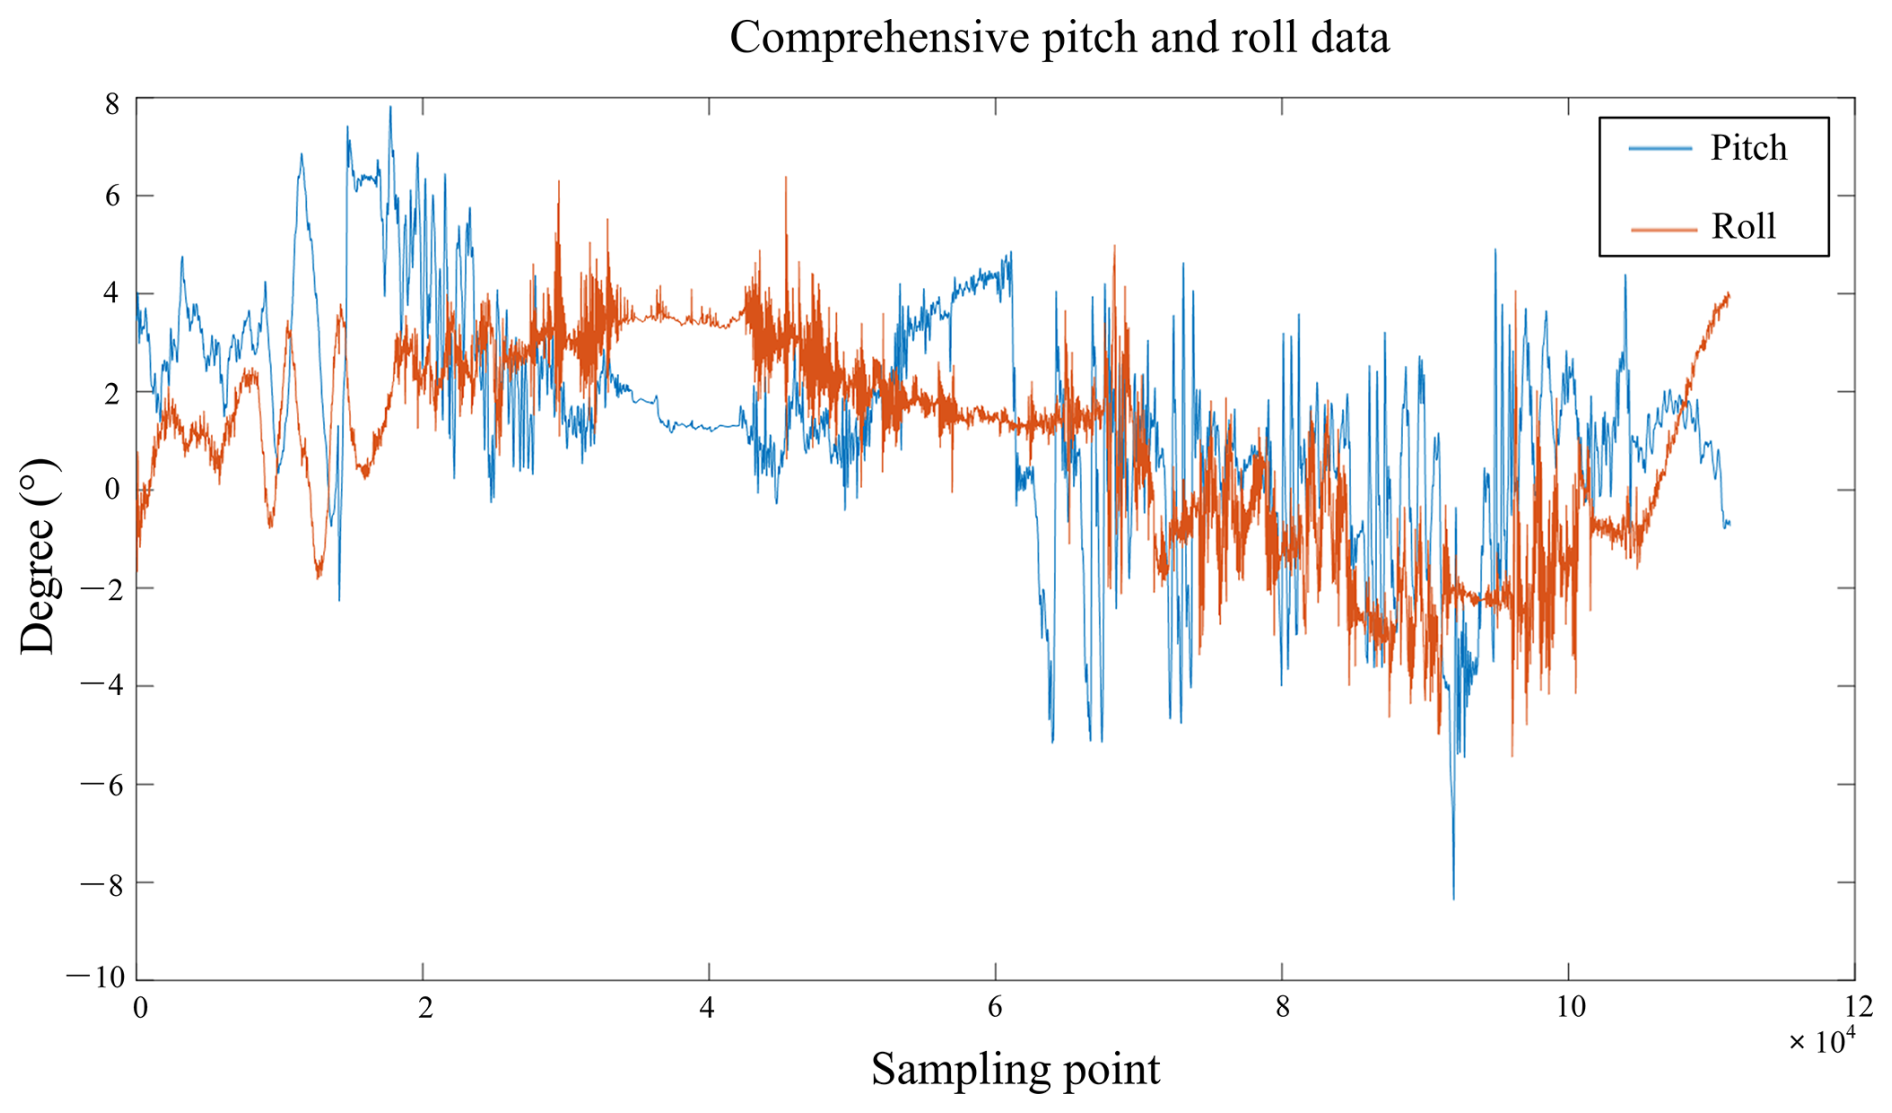
Table 3Comparison between the developed system and other main models.
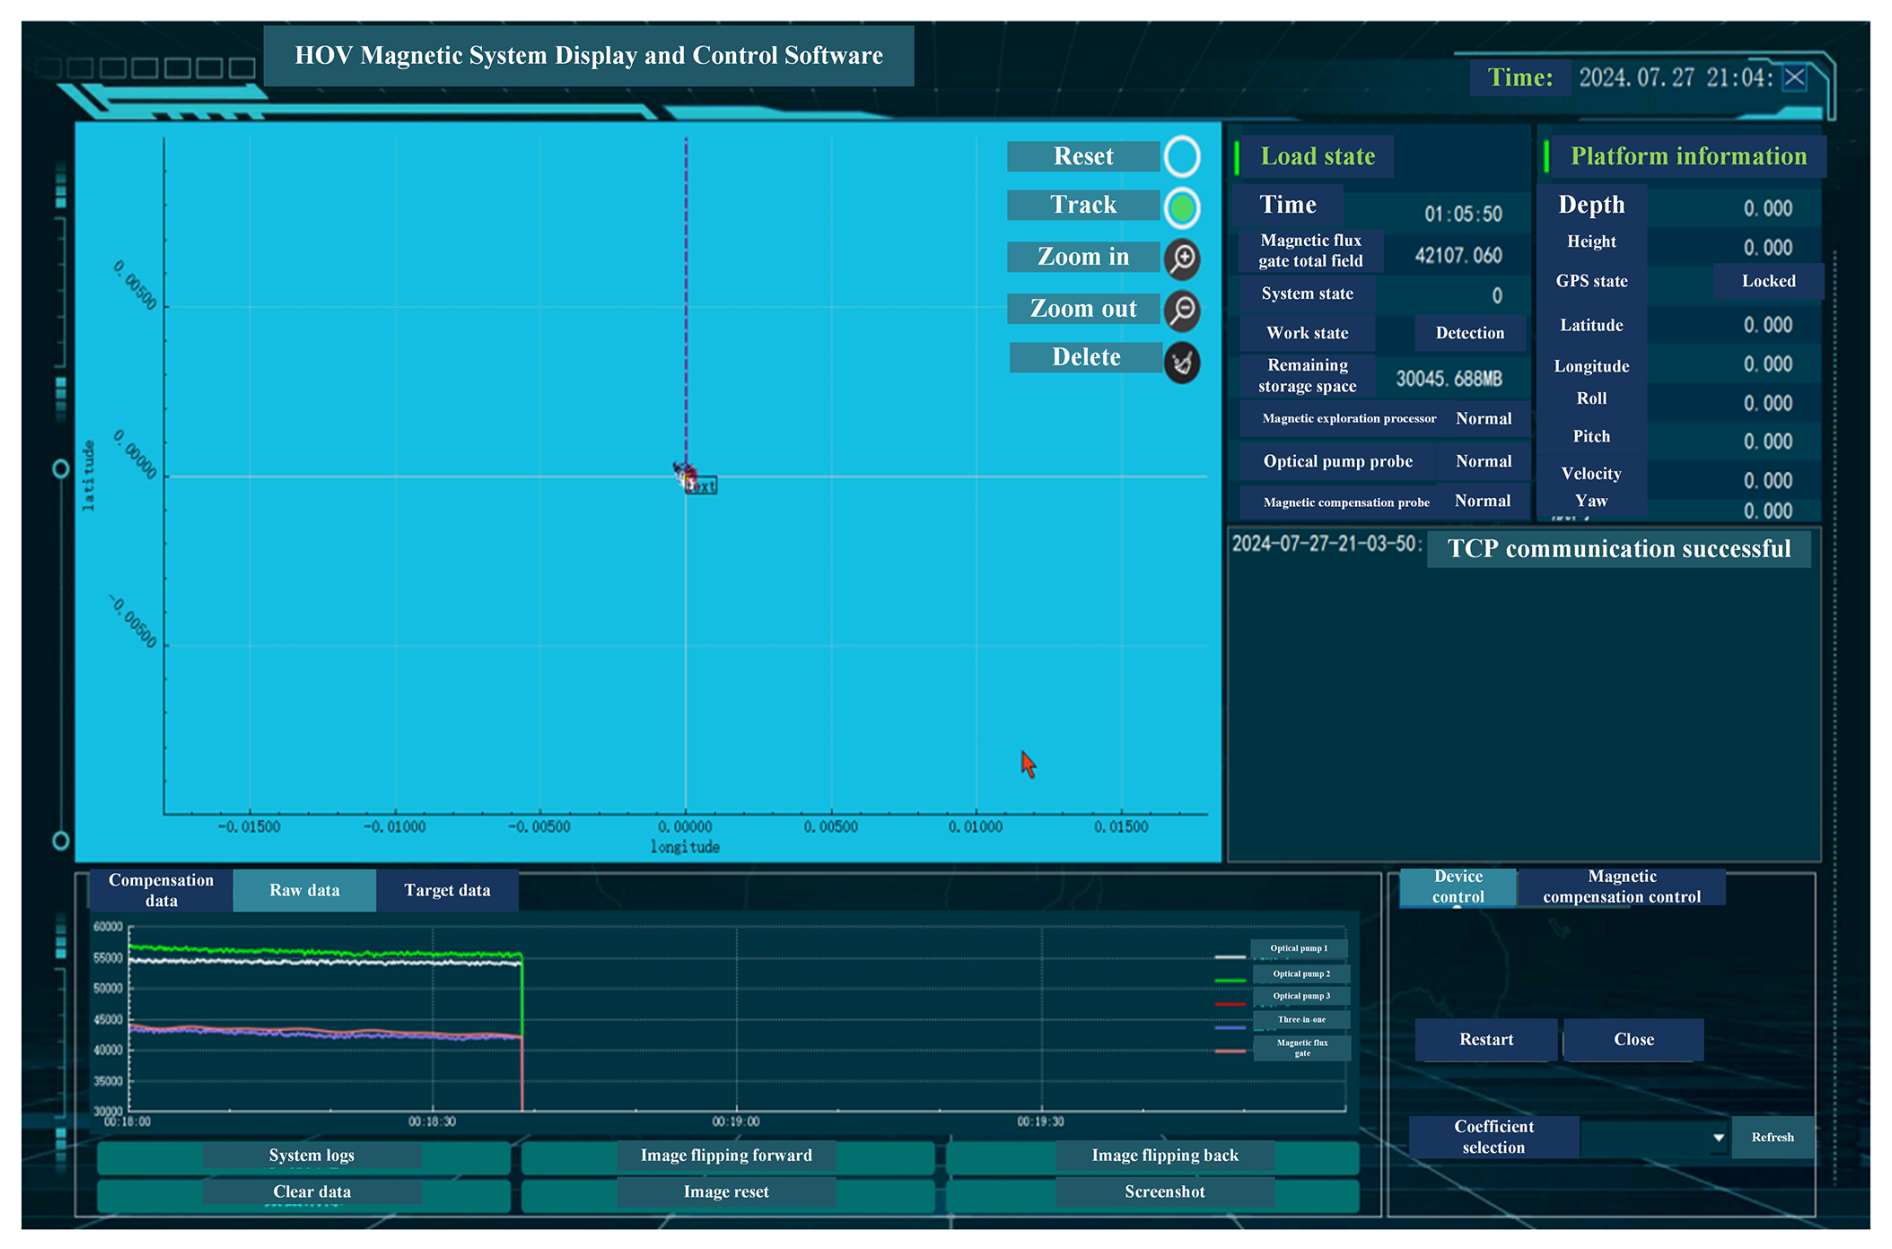
The upper computer utilizes Gigabit Ethernet to receive data from the magnetic detection processing software and relevant status information from the HOV platform. The software includes a communication module, a data display module, and a data storage module. It is primarily responsible for controlling the magnetometer; configuring parameters; and real-time reception, visualization, and storage of various types of data within the system. The design interface of the upper-computer software is shown in Fig. 9.
5.1 Data reception and storage
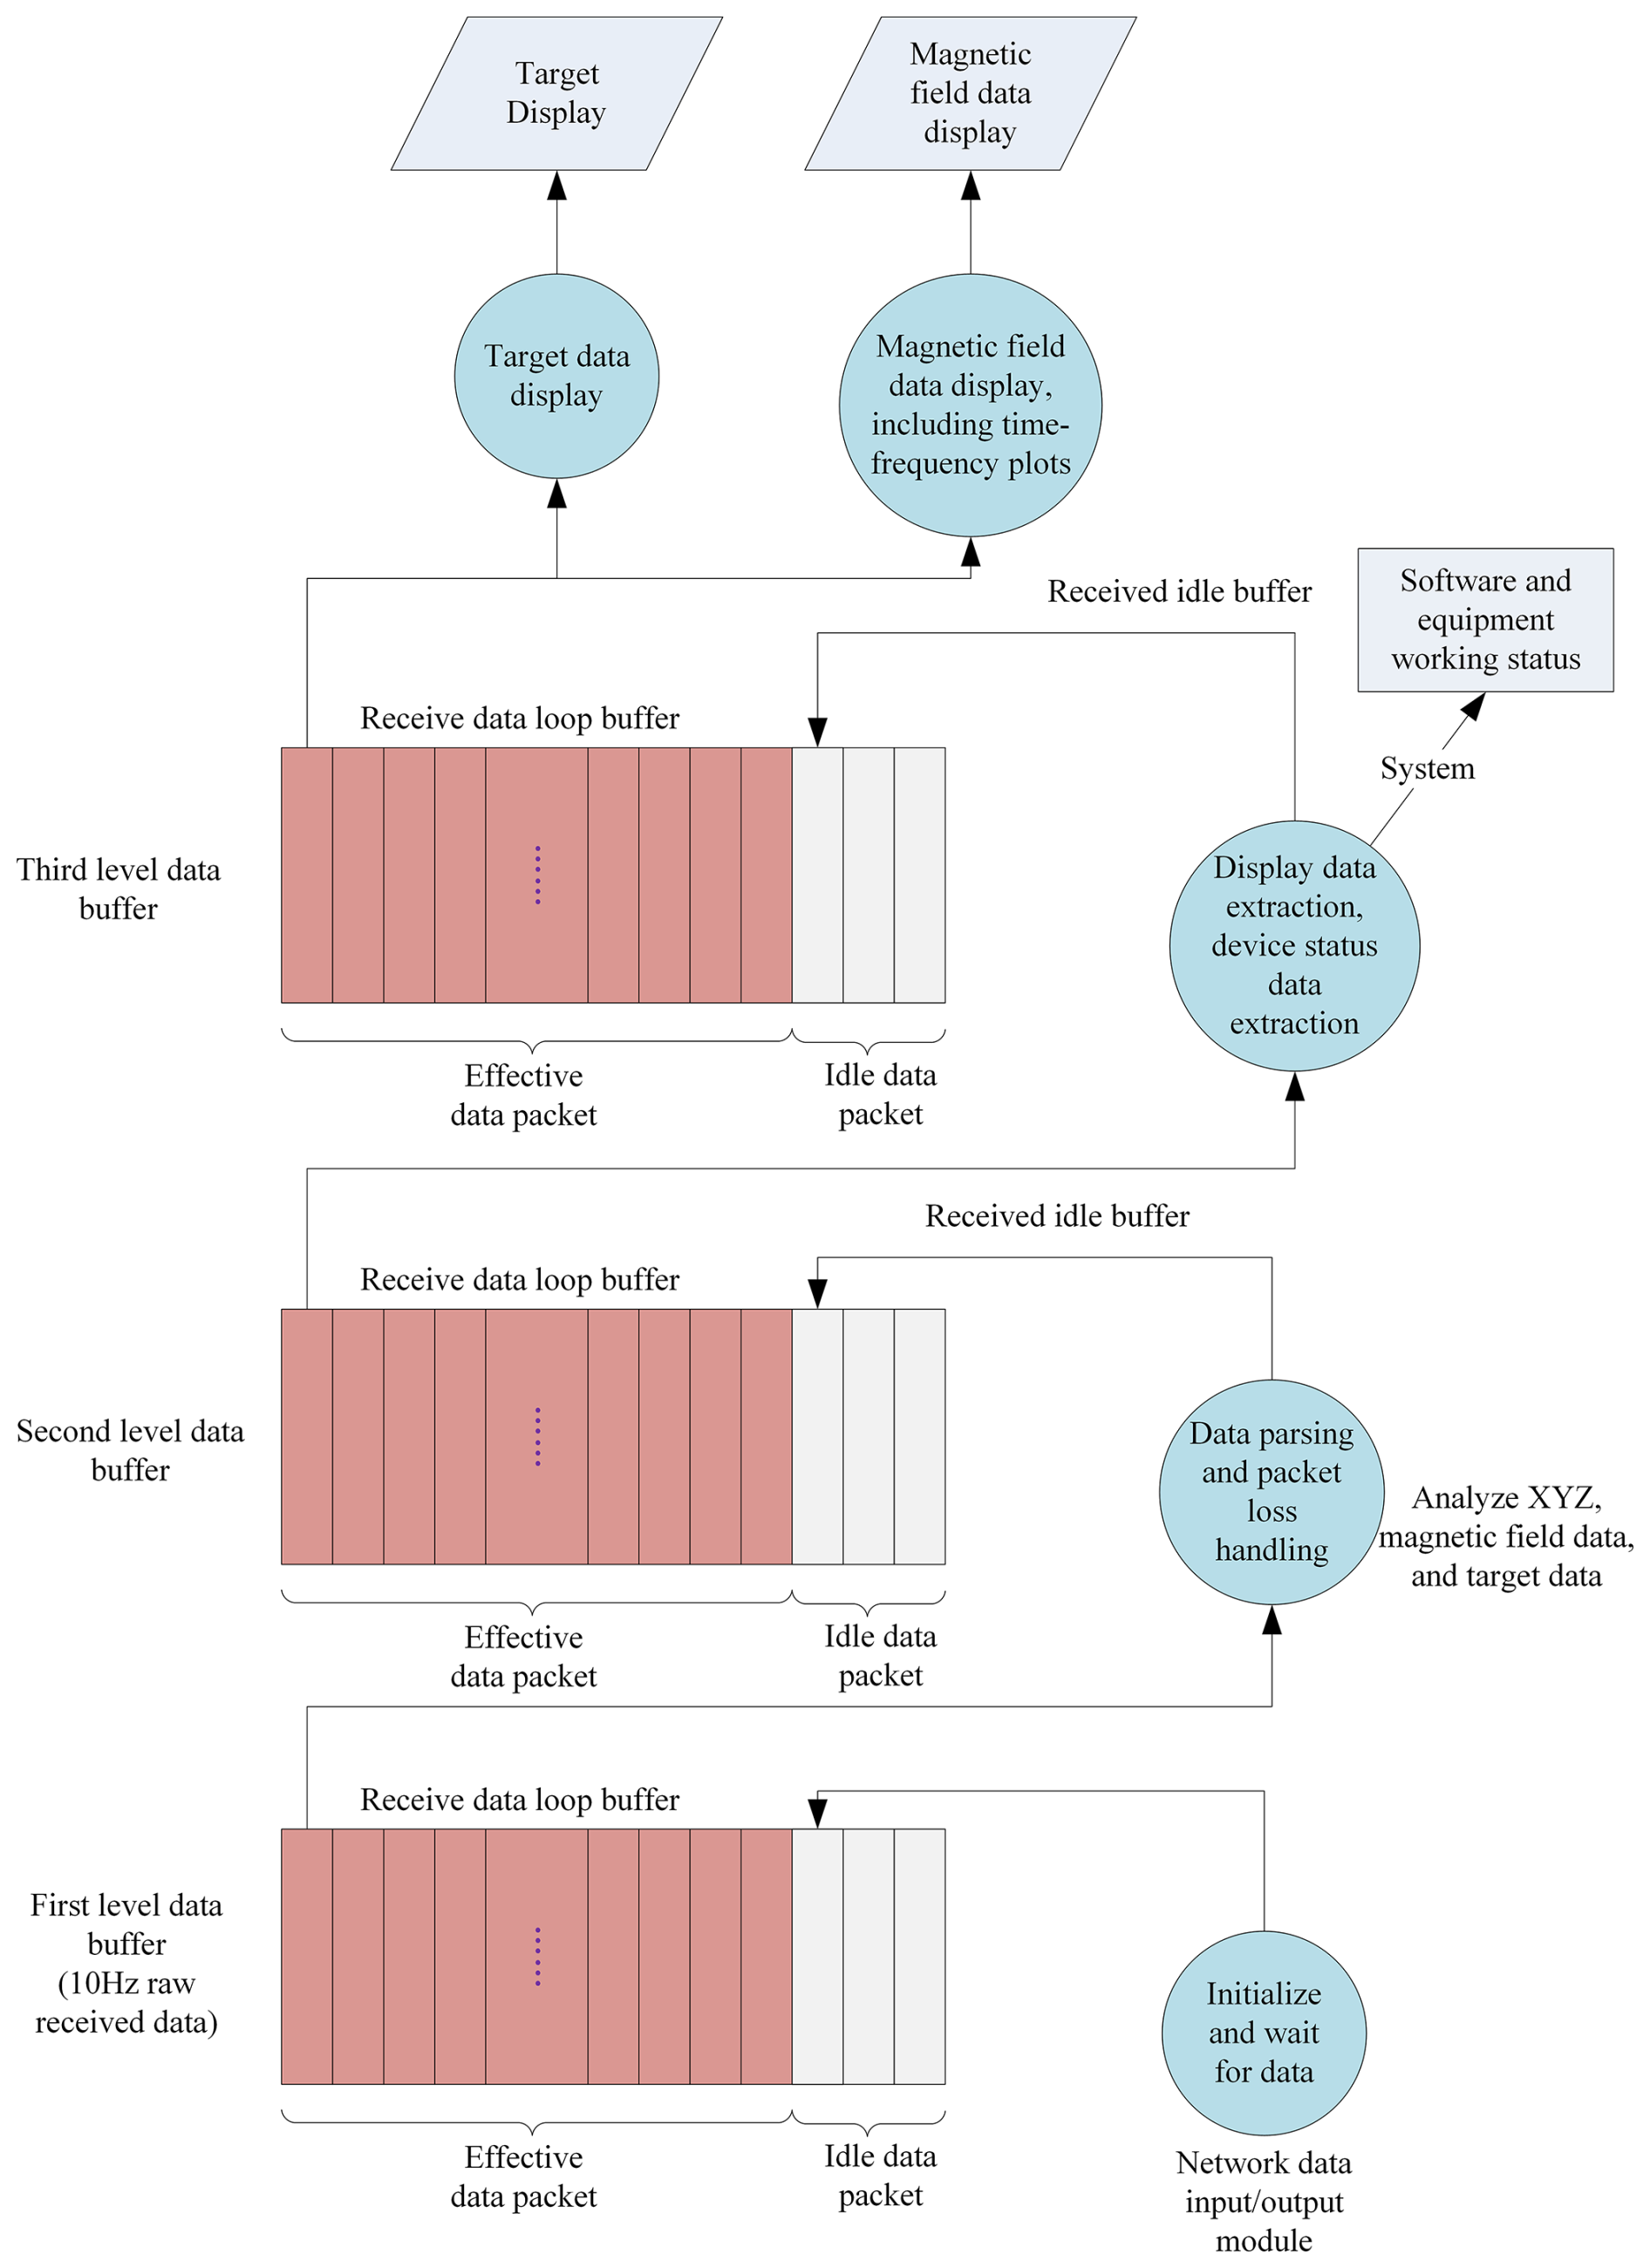
The data reception module is responsible for receiving data and status information, performing data validation and parsing in accordance with the specified data protocol, and subsequently storing the parsed data in a shared buffer. The process commences with the initialization of the network connection and the binding of the reception slot function. Following this, the system receives the network protocol information pertaining to the HOV platform's system status. The received data are then parsed according to the predefined network protocol structure and stored in the data buffer. The flowchart illustrating the data reception process is depicted in Fig. 10. This process starts with the initialization of the network data input/output module, where the system waits for raw data at 10 Hz. The first-level data buffer receives the data in a loop, distinguishing effective data packets from idle packets. Data parsing and packet loss handling are then performed to analyze XYZ positional data, magnetic field data, and target data, which are passed to the second-level data buffer. The second-level buffer stores processed effective packets in a loop for further extraction. The third-level buffer then receives the cleaned data, extracting and displaying status information such as device conditions and system functionality. The final stage displays the processed data, including magnetic field visualizations (e.g., time–frequency plots) and target information, ensuring a comprehensive understanding of the system's performance and functionality.
5.2 Image display processing
The image display processing module extracts platform position information from the data buffer and performs real-time trajectory visualization. Simultaneously, it receives status information from the magnetometer equipment and magnetic measurement data. The device status bar displays the connection status of the optically pumped probe, the magnetic compensation probe, and the interface unit. The real-time graph displays both the raw magnetic measurement data and the compensated magnetic measurement data.
In the software design and development phase, the logical processing and display components are implemented separately, with communication facilitated through shared memory. The shared memory objects include raw data and magnetic compensation data. Due to filtering delays, there is a time lag between the raw data and the magnetic compensation data, necessitating synchronization based on corresponding timestamps. The synchronization method involves the processing module sending the current timestamps of the raw data and magnetic compensation data to the display module, which uses this information to achieve synchronization. The image processing functions include vertical and horizontal axis scaling, target information scale identification, image panning, and image resetting.
In this section, we present the testing procedures and results for the high-precision magnetometer system based on the HOV platform, as designed in this study. The objective is to validate the system's feasibility and analyze the effectiveness of the magnetic compensation.
6.1 Laboratory testing
In a controlled laboratory environment, we conducted comprehensive debugging and performance evaluation of the system. The test results demonstrate that the probe noise is as low as 1 pT , indicating exceptional sensitivity. The magnetic measurement system consistently collected accurate data and maintained stable operation. Under the supervision of the monitoring software, the system demonstrated high efficiency in executing detection tasks.
6.2 Marine testing procedure
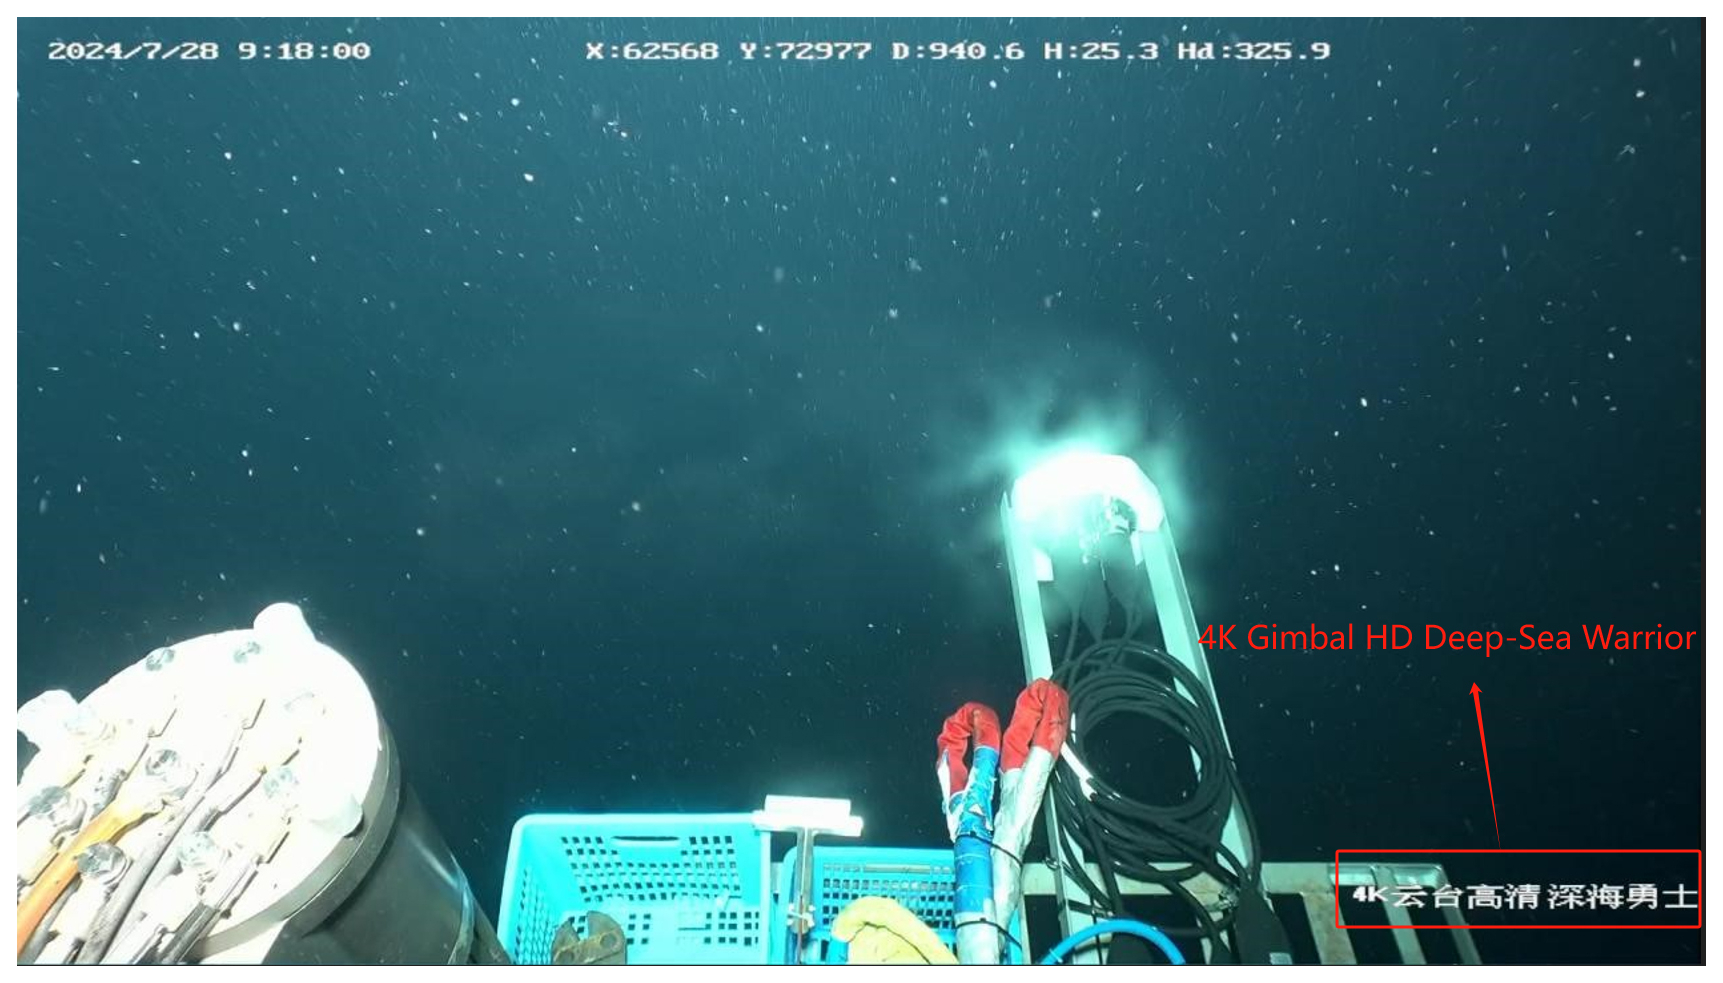
To further evaluate the performance of the system, a marine experiment was conducted on 28 July 2024. During the TS2-38-7 expedition of the Explorer II (from 20 to 29 July 2024), the HOV magnetometer was utilized in the SY717 dive for comprehensive system functionality verification and magnetic compensation testing. The submersible was deployed at 08:30 LT, and the equipment was powered on and checked at 08:51 LT. The submersible reached the seabed at approximately 09:18 LT at a depth of around 940 m. At 10:09 LT, the retrieval target was located, and the cable-cutting operation was completed by 10:20 LT. Subsequently, a magnetic compensation test was conducted at an altitude of 50 m above the seabed. The submersible jettisoned its ballast at 11:47 LT and surfaced at approximately 12:14 LT.
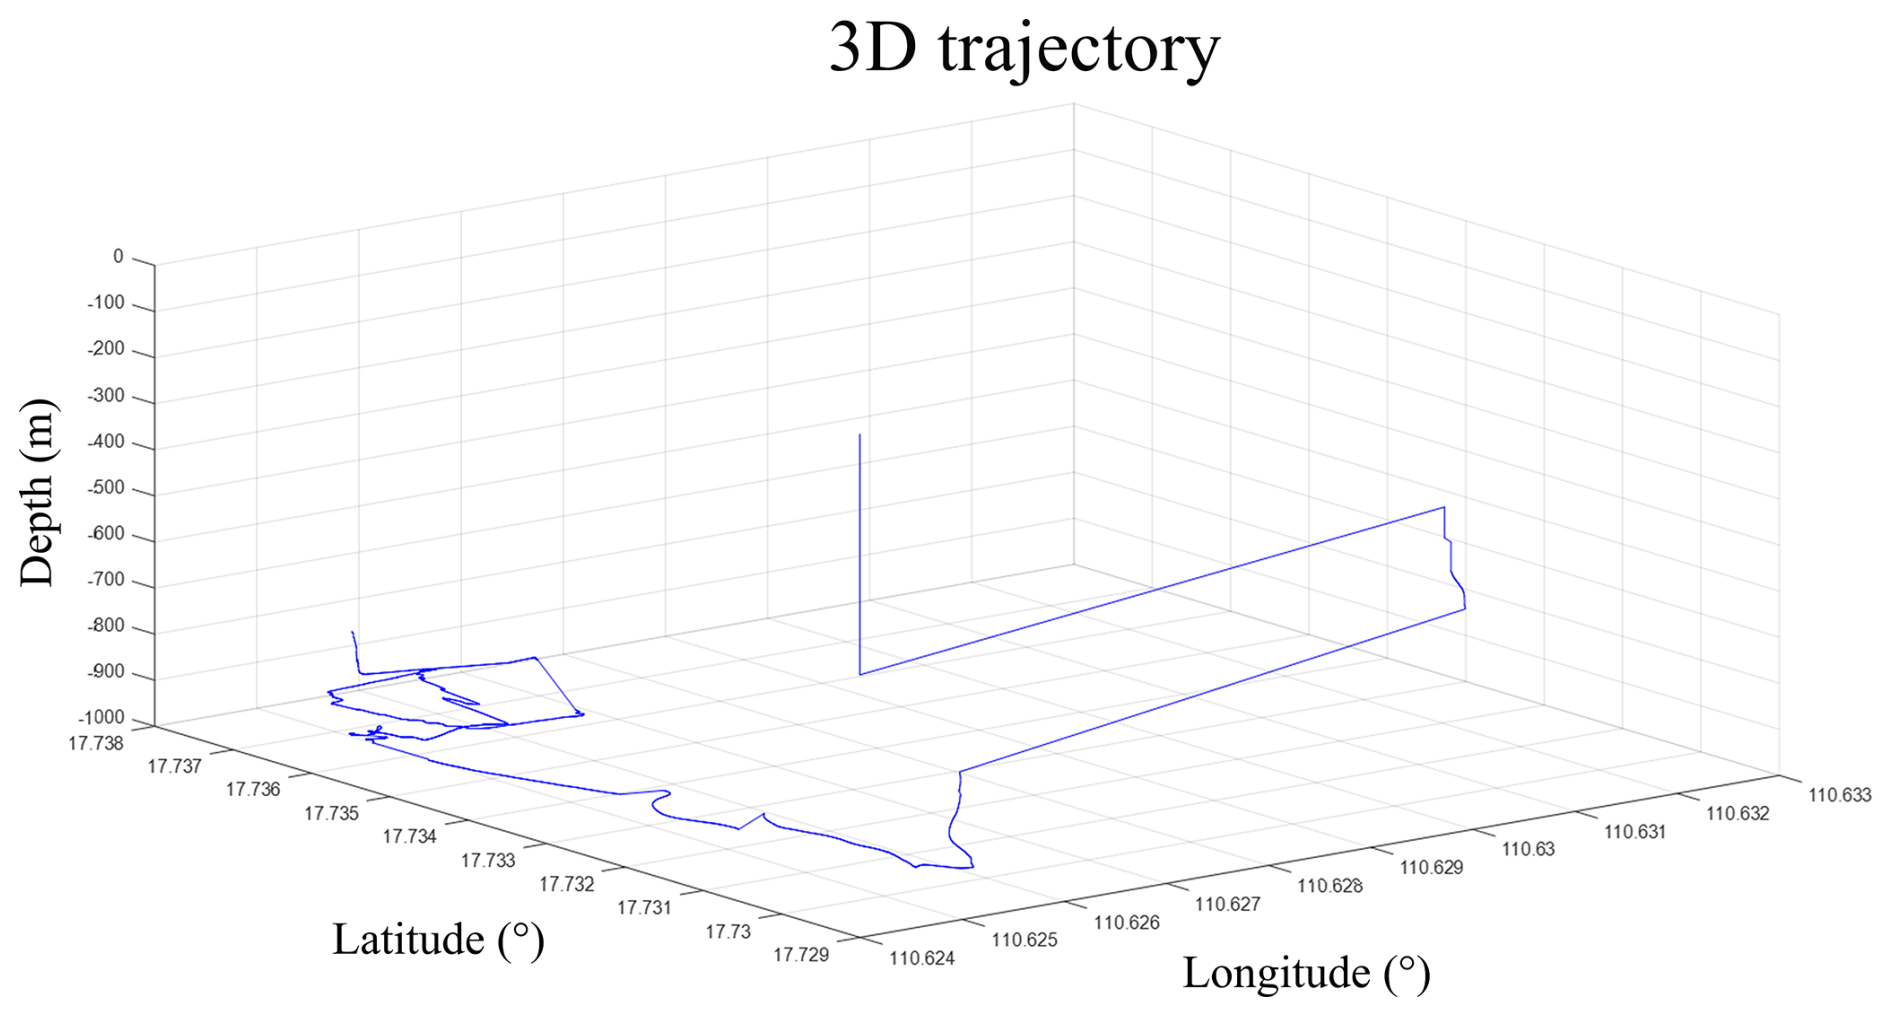
The overall functionality of the equipment was verified to be normal. The magnetic data acquisition and the parsing of auxiliary information (including latitude, longitude, attitude, and depth) were confirmed to be accurate. Figure 11 presents a photograph of the equipment at a depth of 940 m. Figure 12 illustrates the 3D trajectory of the HOV as recorded by the magnetometer. The anomalies in the latitude and longitude data were attributed to the real-time positioning information of the HOV not being updated, as confirmed by on-site verification.
6.3 Analysis of marine experiment results
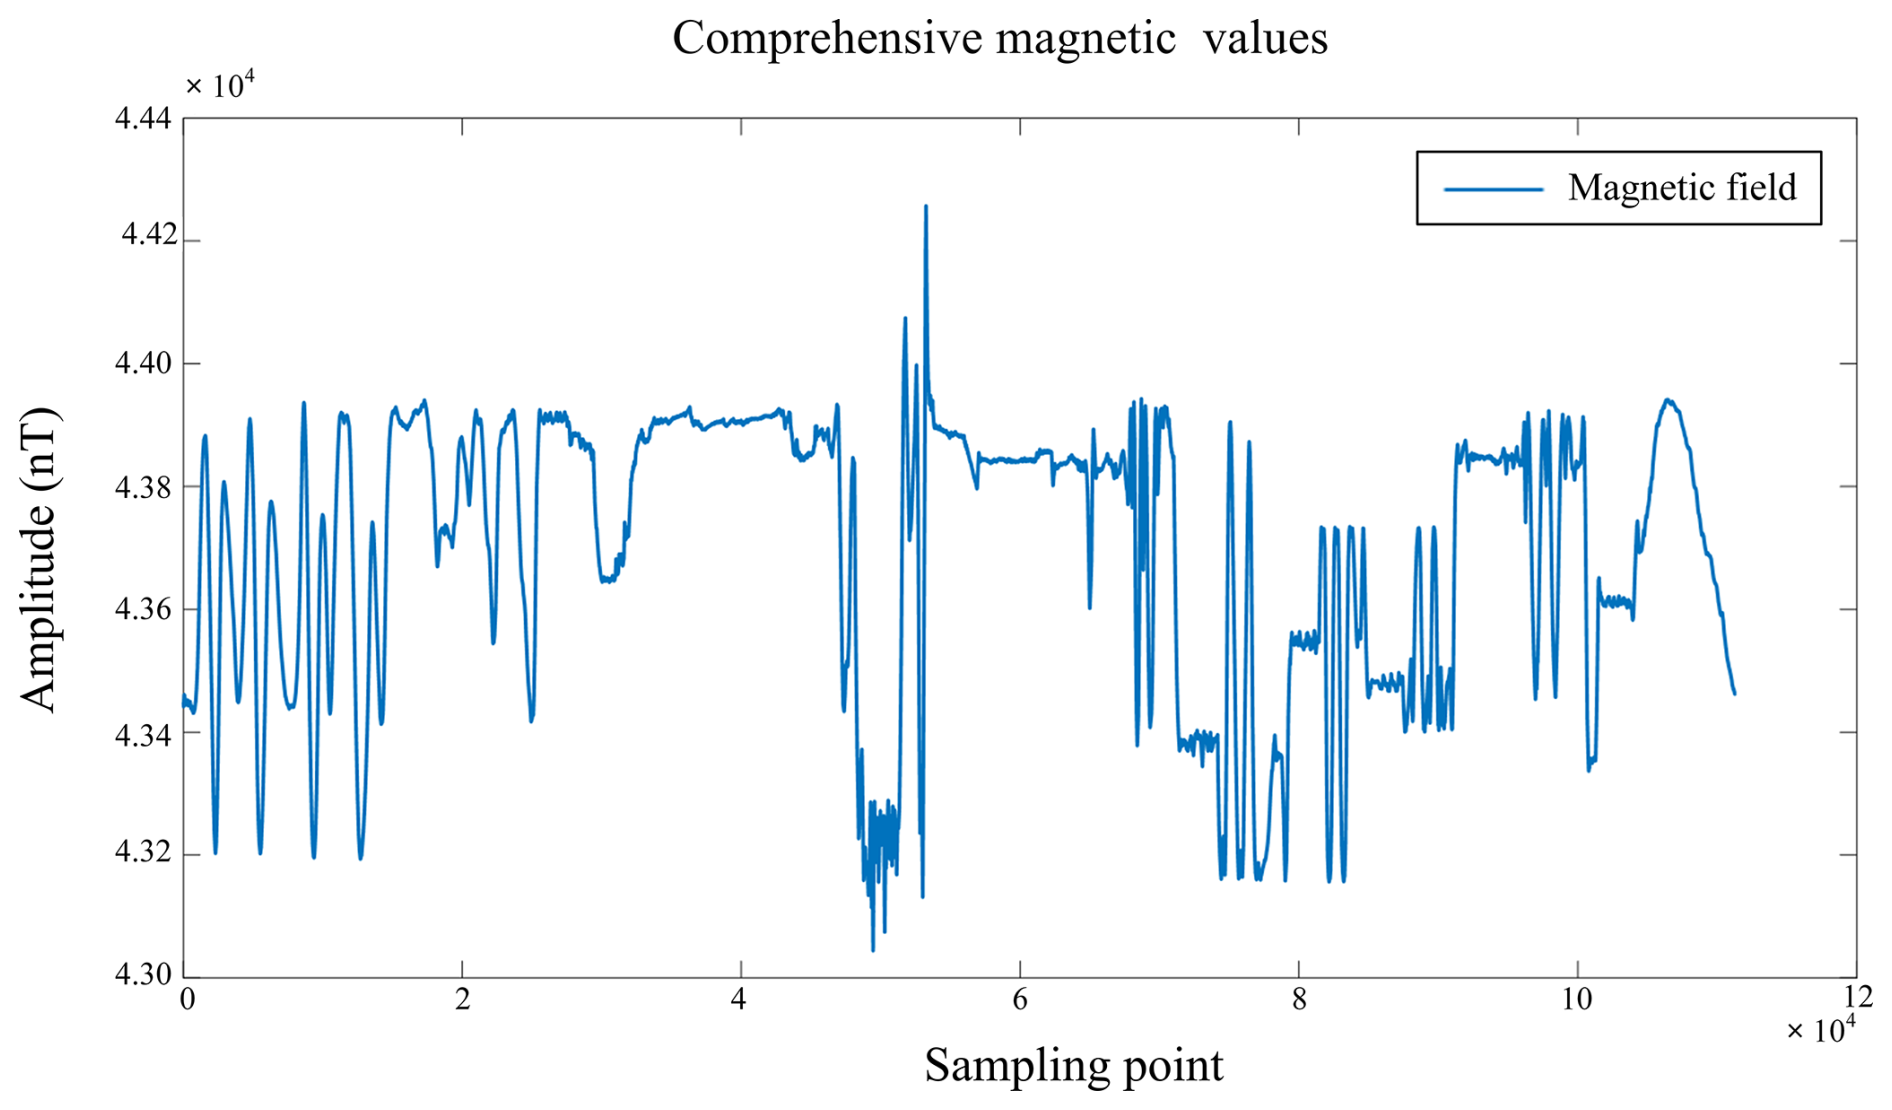
The comprehensive magnetic measurement values and the pitch and roll data recorded by the HOV magnetometer are depicted in Figs. 13 and 14, respectively. The results demonstrate that the latitude, longitude, depth, and magnetic measurement values recorded by the HOV magnetometer are consistent and accurate. The integrity of the recorded magnetic measurement data is maintained throughout the operation. Notably, significant magnetic field variations are observable when approaching the retrieval target and during specific operational phases, indicating the system's sensitivity to magnetic anomalies.
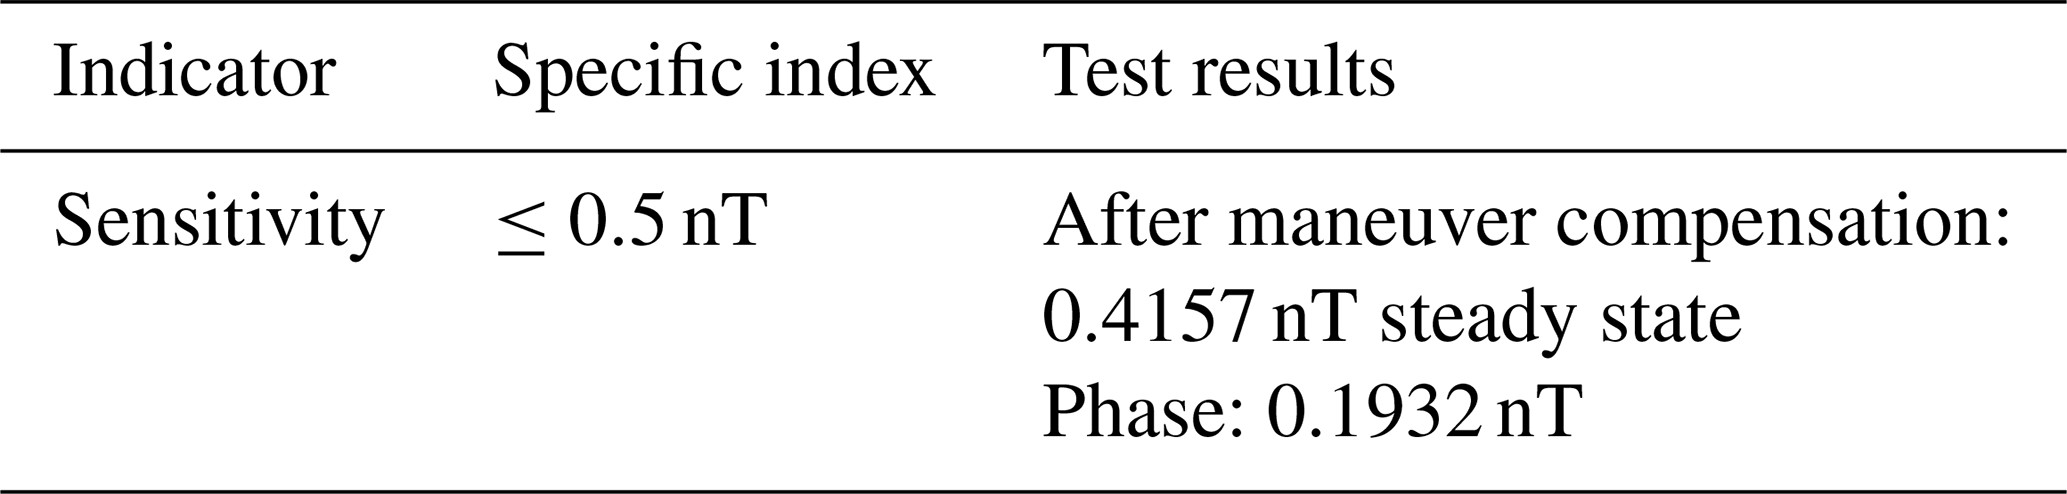
From the data, we can determine that the sensitivity of the system is less than 0.5 nT as shown in Table 3.
6.3.1 Steady-state data processing
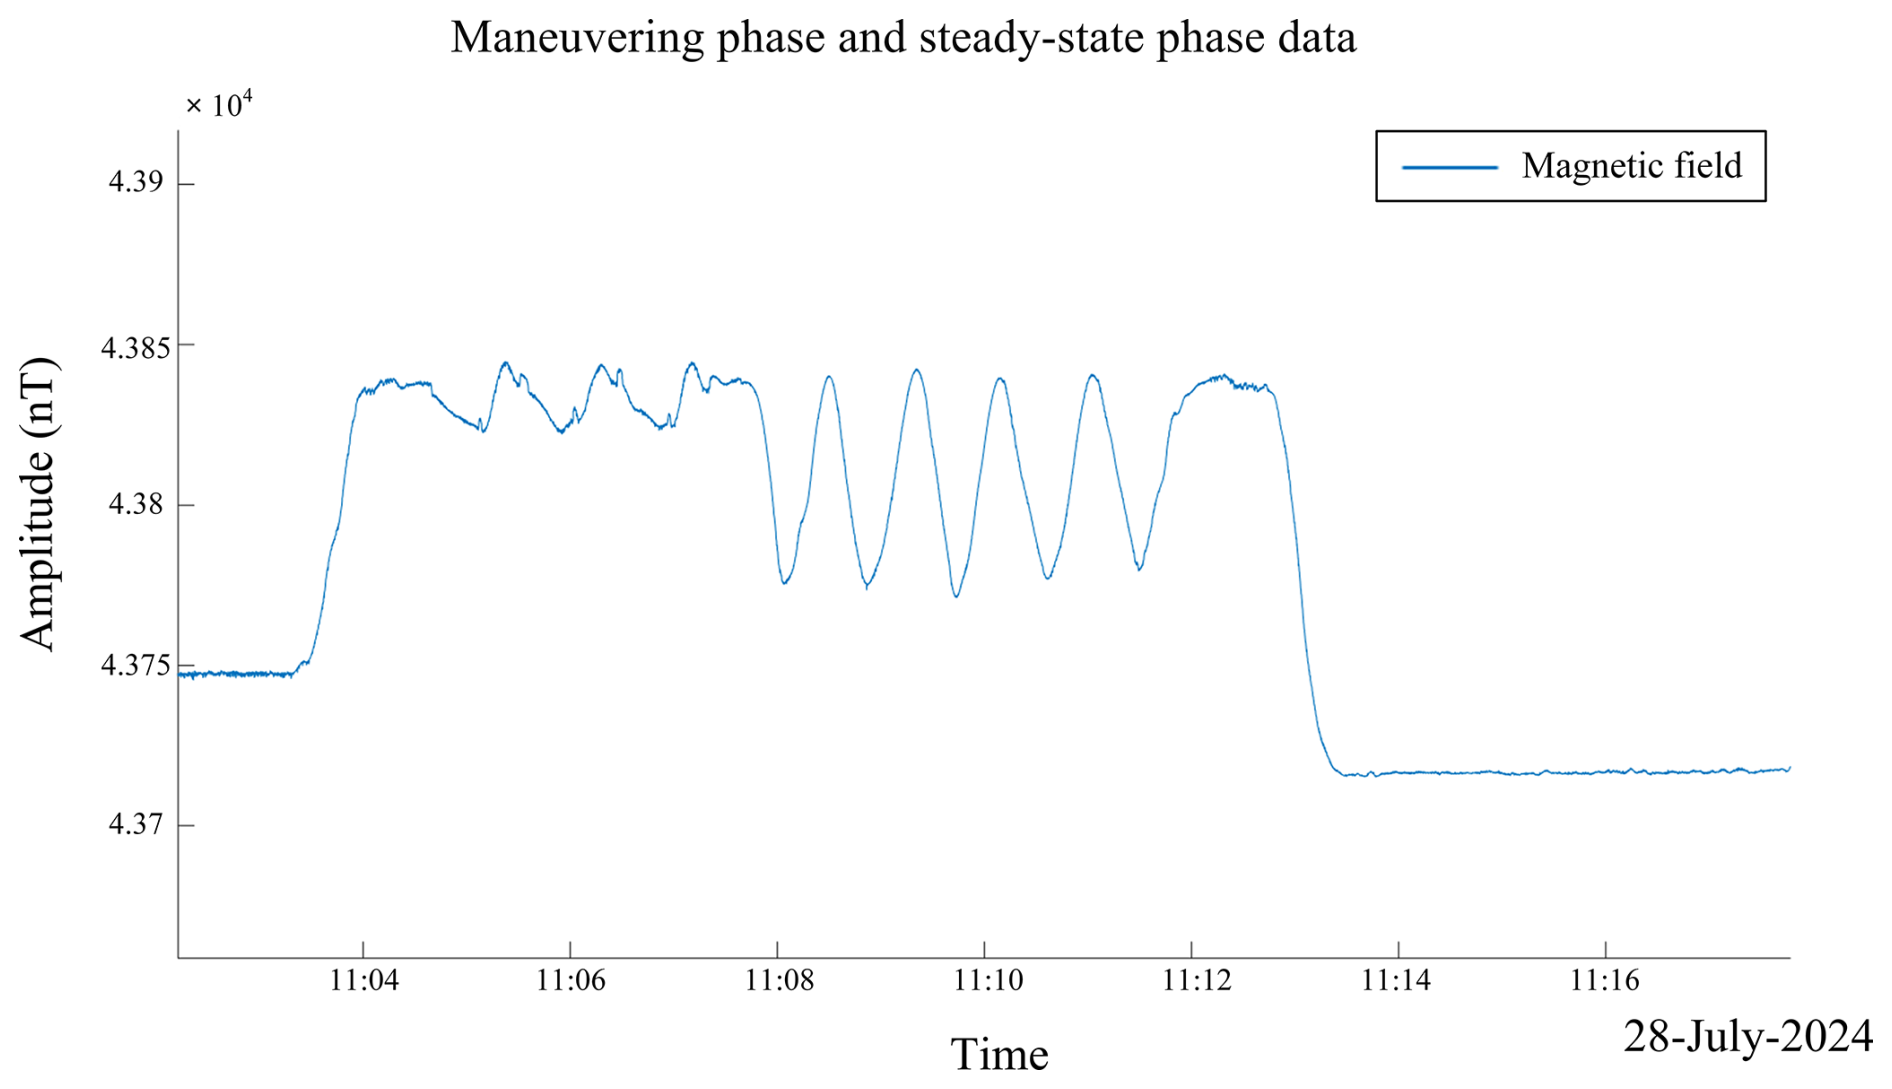
Figure 15 presents a comparative analysis between data acquired during the maneuvering phase and the steady-state phase. The figure clearly illustrates that the steady-state phase data exhibit minimal fluctuations and smoother curves, whereas the maneuvering phase data show significant fluctuations and pronounced undulations. For the steady-state analysis, data from 11:14 to 11:17, during which the HOV maintained relatively stable attitudes, were selected. The calculated standard deviation of 0.1932 nT indicates minimal magnetic field fluctuations, thereby confirming the system's stability during this period. In contrast, during the maneuvering phase, substantial variations in the system's attitude resulted in greater fluctuations in the magnetic field data.
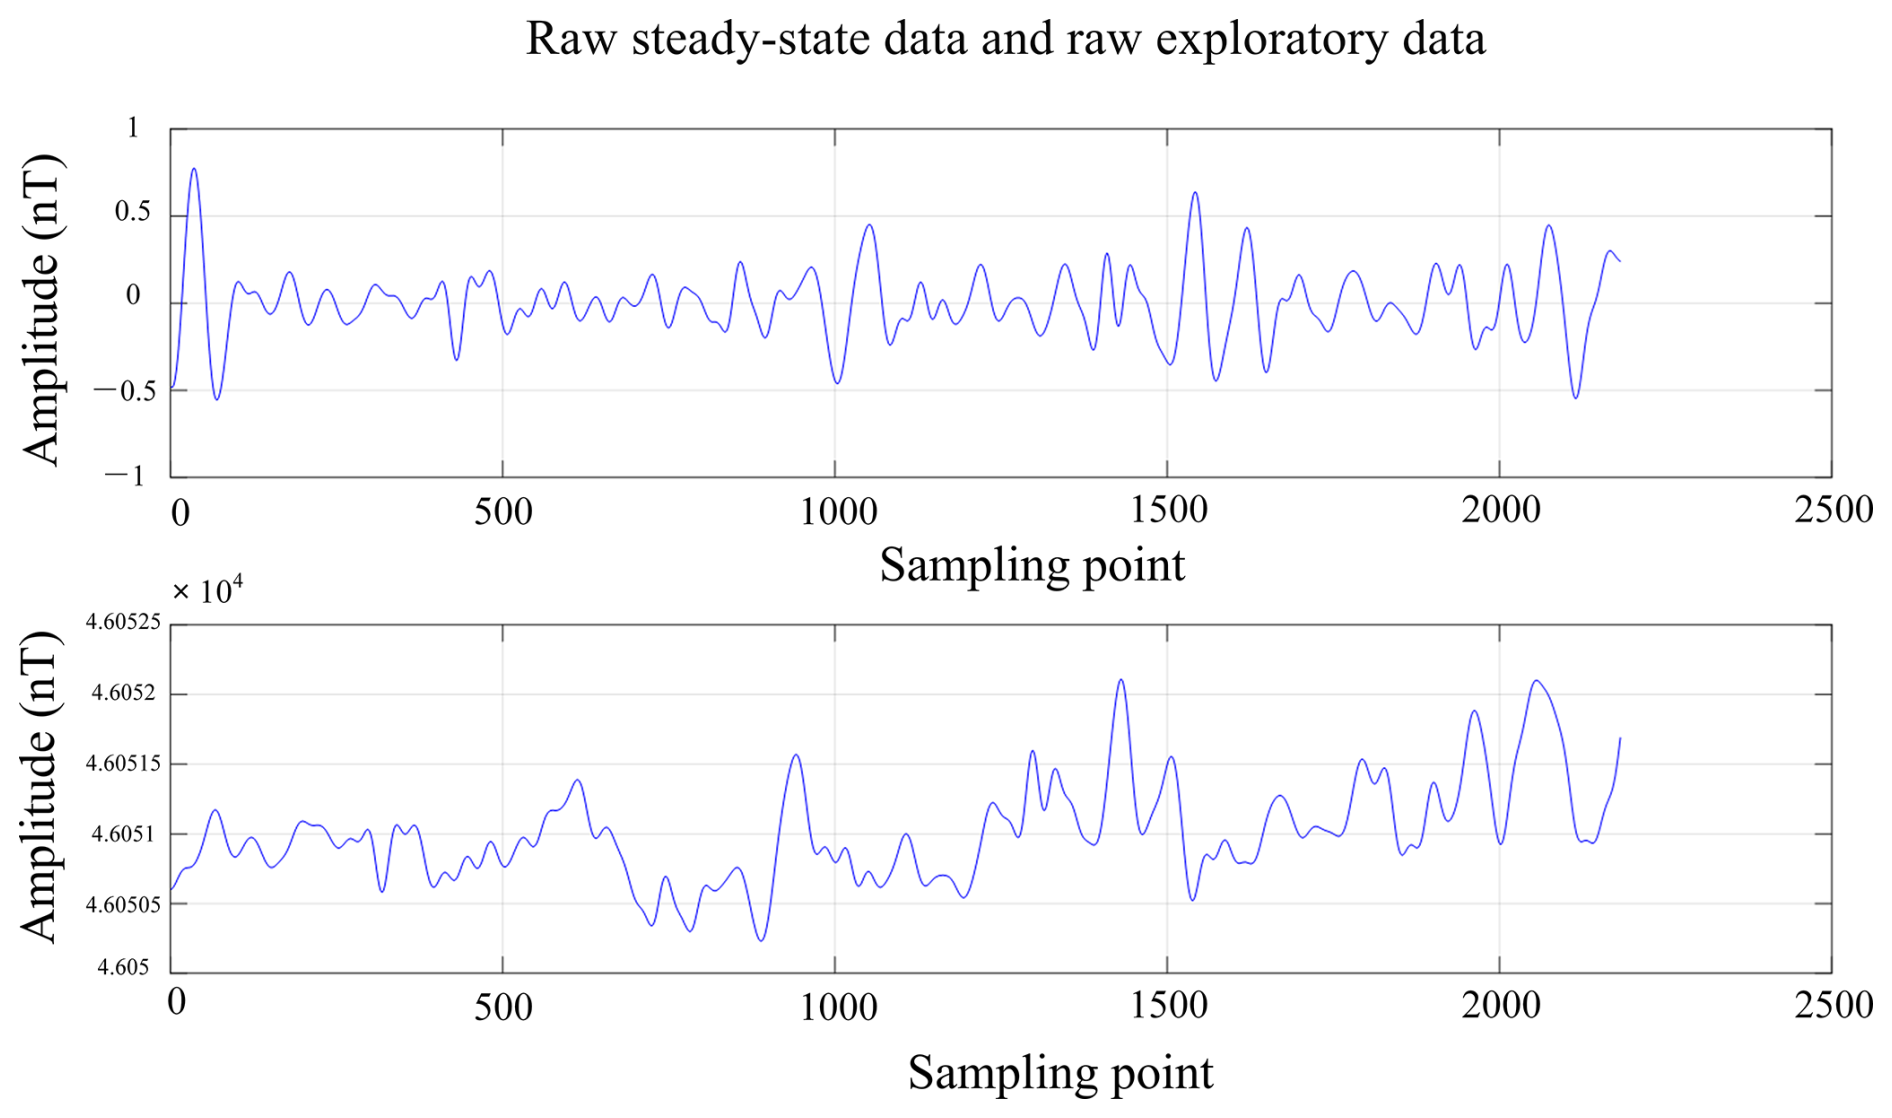
Figure 16 provides a detailed comparison between the raw steady-state data and the raw exploratory data. The upper plot in Fig. 16 illustrates the raw steady-state data, which exhibit relatively low amplitude with fluctuations within approximately ±0.5 nT. This indicates that the system's attitude was stable during the steady-state phase, resulting in minimal magnetic field data fluctuations. Conversely, the lower plot in Fig. 16 depicts the raw exploratory data, which show significantly higher amplitude values with fluctuations ranging approximately between 46050.2 and 46052.1 nT. This suggests that during the exploratory phase, the system was likely subjected to increased external interferences or significant attitude changes, leading to greater magnetic field data fluctuations.
The pronounced amplitude differences between the raw datasets underscore the substantial impact of different operational phases on magnetic field measurement data. These findings highlight the necessity of accounting for system stability and external interferences when analyzing magnetic field measurements to ensure data accuracy and reliability.
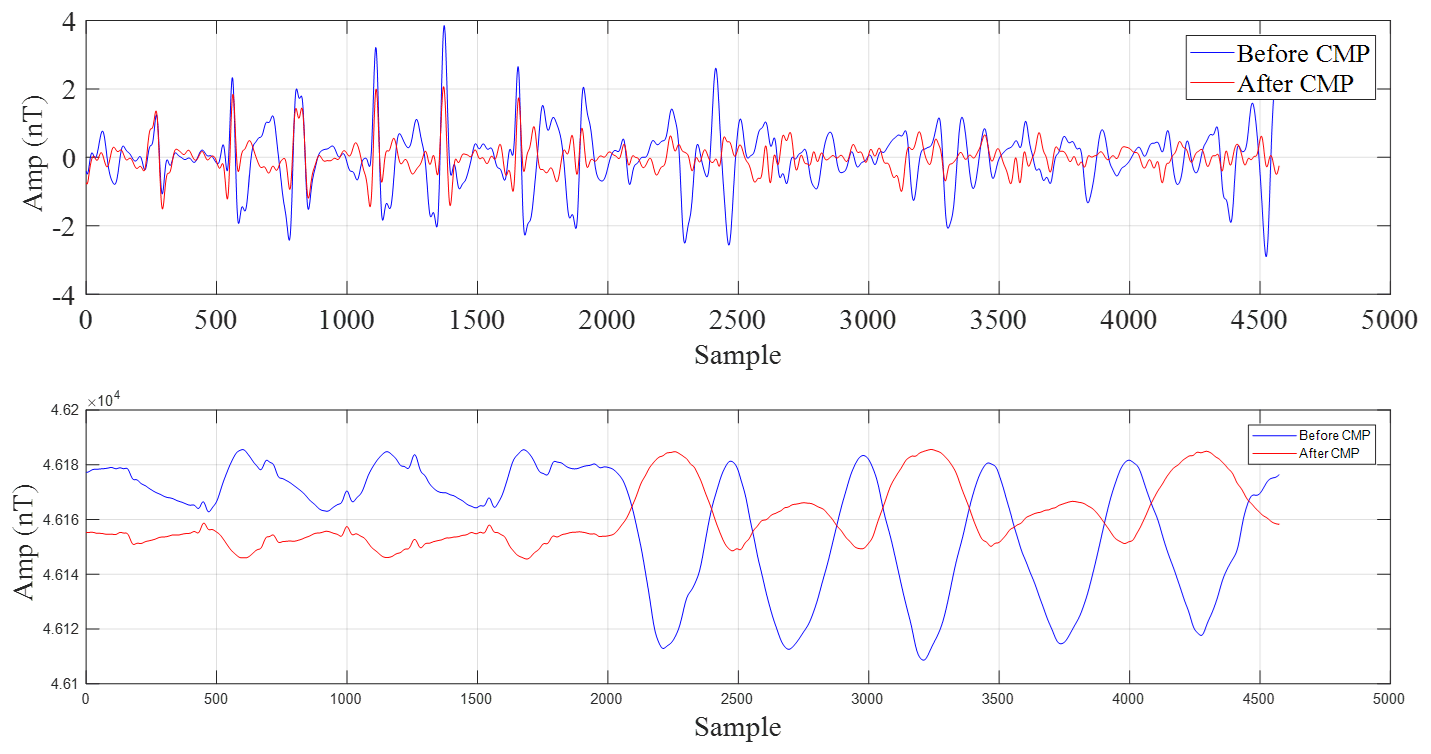
6.3.2 Magnetic compensation data processing during maneuvering
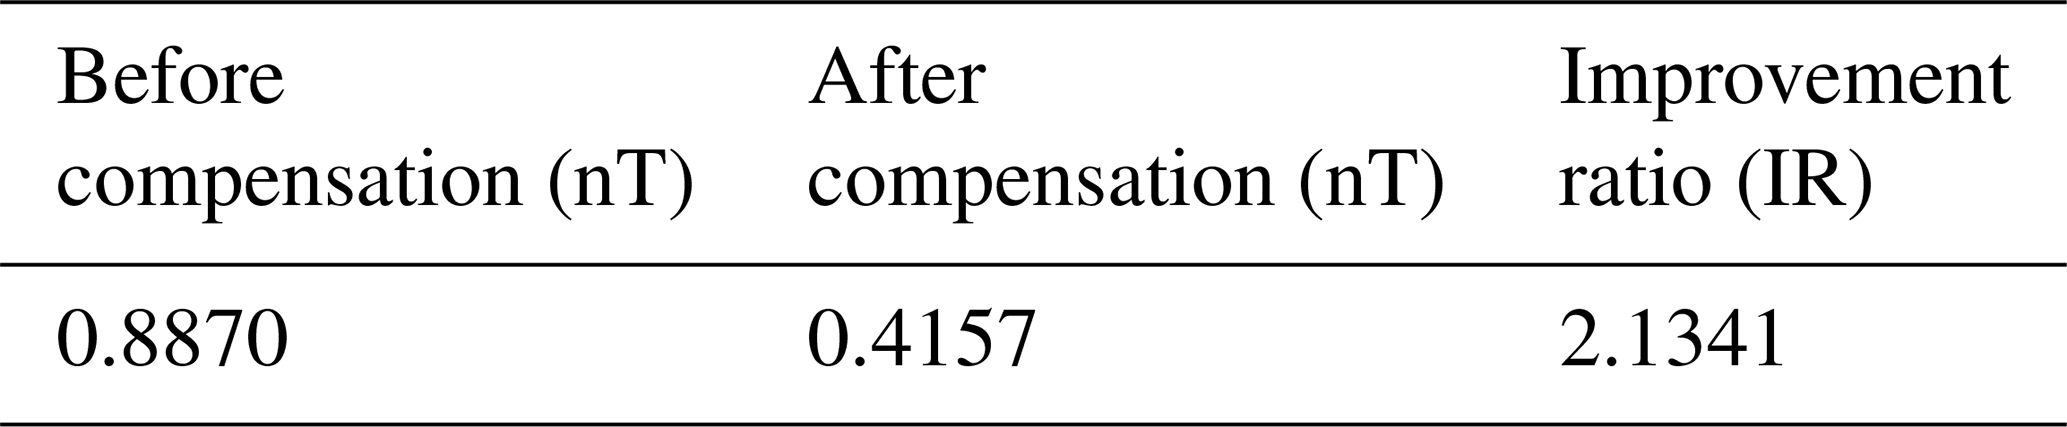
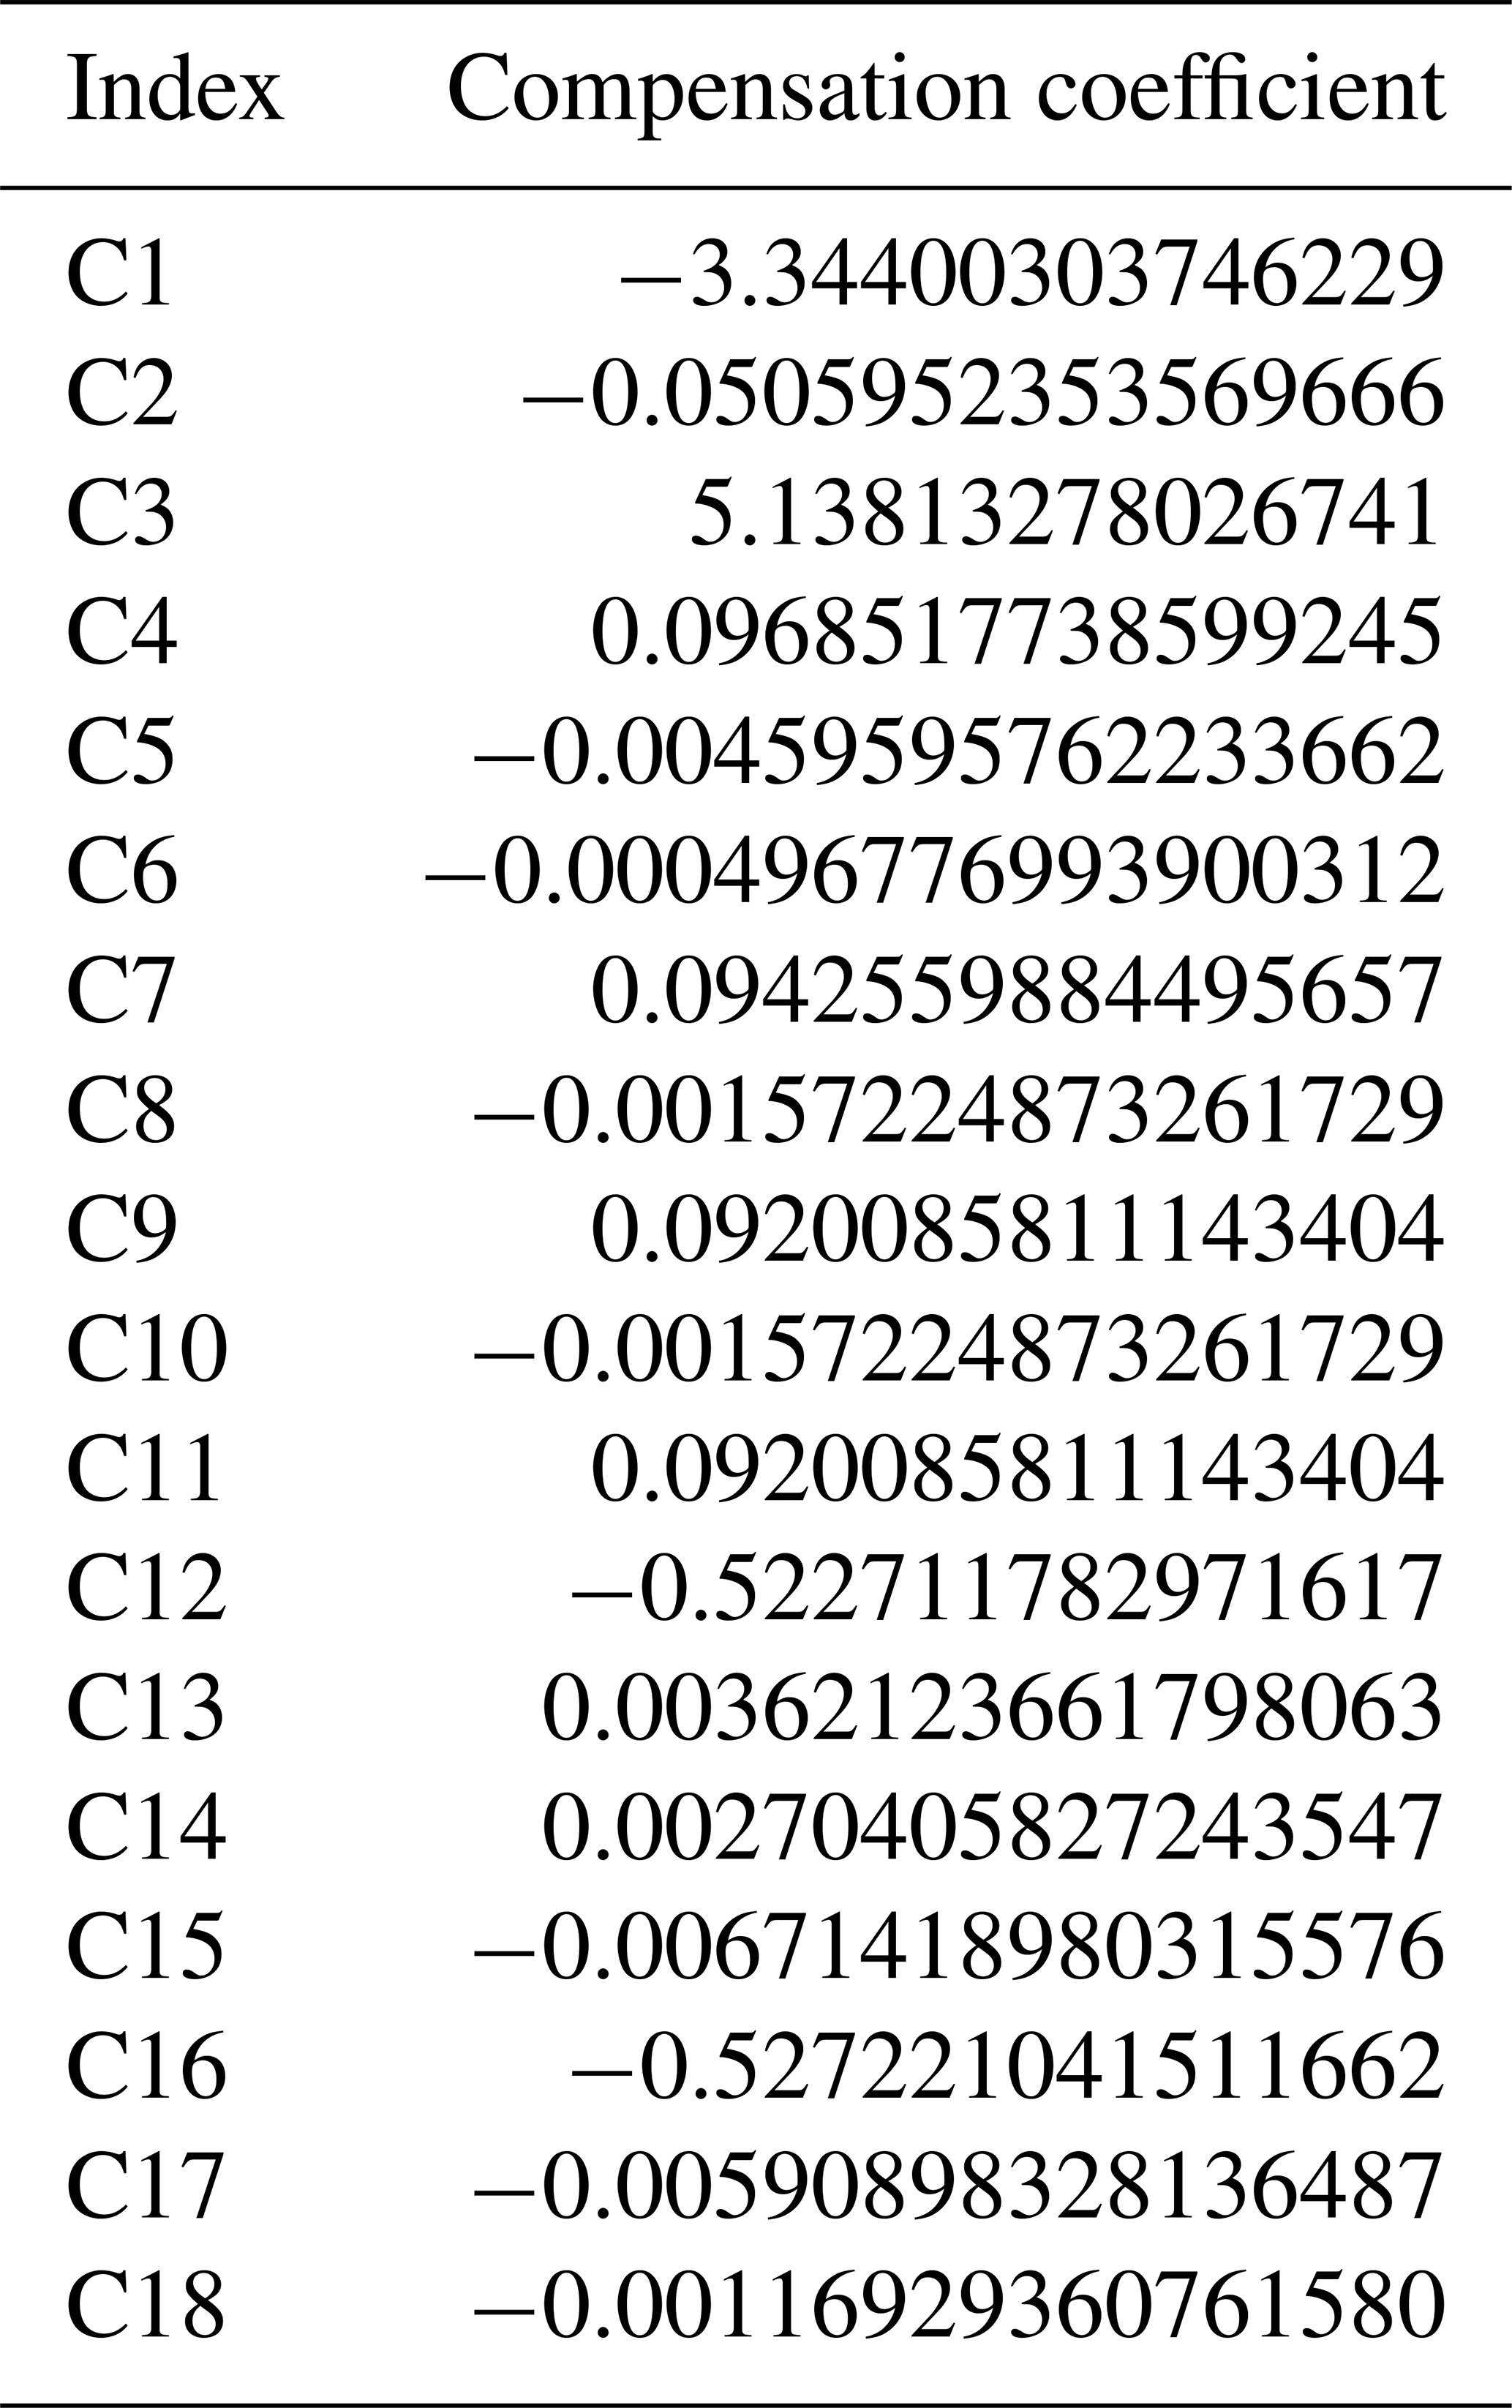
Figure 17 illustrates a comparative analysis of the magnetic measurement data before (blue curve) and after (red curve) the application of the compensation algorithm. The figure clearly demonstrates that the fluctuations in the compensated data are significantly attenuated, indicating the efficacy of the compensation algorithm in mitigating interference and enhancing data stability. Tables 4 and 5, respectively, present the compensation results and the derived compensation coefficients. The improvement ratio for the magnetic compensation is calculated to be 2.13, and the derived compensation coefficients serve as reliable parameters for subsequent data processing. These findings indicate that the compensation algorithm significantly reduces the standard deviation of the measurement data, thereby enhancing the precision and accuracy of the measurements.
This paper introduces a high-precision magnetometer system based on the HOV platform, utilizing cesium optically pumped magnetometers and fluxgate probes for high-accuracy magnetic field detection. The system's software architecture is comprehensively detailed, including key functionalities such as automatic probe switching and magnetic compensation, both of which significantly improve the precision and reliability of the measurements. Furthermore, the upper-computer display and control software provides a user-friendly interface for real-time monitoring and system management. Comprehensive laboratory tests and marine experiments conducted on the Shenhai Yongshi platform have demonstrated the system's accuracy and reliability. The probe noise was measured to be as low as 1 pT , and the system demonstrated a sensitivity of 0.5 nT. Additionally, the system supports multi-channel data acquisition and incorporates real-time magnetic compensation capabilities. The software has proven to be both user-friendly and stable in performance. Moreover, the integrated software system features real-time monitoring, data recording, data processing, a user interface, and alarm mechanisms, thereby enhancing the system's practicality and reliability. This research provides a robust foundation for the implementation of data acquisition software systems in marine magnetic surveys and exploration.
The original contributions presented in the study are included in the article; further inquiries can be directed to the corresponding author.
QimZ, QisZ, KZ, and MD designed the whole system and also designed the experiments and carried them out. LH and CL developed the probe switching algorithm and software interface. KZ prepared the manuscript with contributions from all co-authors.
The contact author has declared that none of the authors has any competing interests.
Publisher’s note: Copernicus Publications remains neutral with regard to jurisdictional claims made in the text, published maps, institutional affiliations, or any other geographical representation in this paper. While Copernicus Publications makes every effort to include appropriate place names, the final responsibility lies with the authors.
This study is supported by the Key Research Program of the Chinese Academy of Sciences (grant no. KGFZD-145-22-06-02), the National Key R&D Program of China (grant no. 2022YFF0706202 and no. 2021YFC2801404), and the National Natural Science Foundation of China (grant no. 42074155).
This study was supported by the Key Research Program of the Chinese Academy of Sciences (grant no. KGFZD-145-22-06-02), the National Key R&D Program of China (grant nos. 2022YFF0706202 and 2021YFC2801404), and the National Natural Science Foundation of China (grant no. 42074155).
This paper was edited by Lev Eppelbaum and reviewed by two anonymous referees.
AlBadi, S., Jacobson, E., and Filina, I.: Locating an old well in eastern Nebraska with a low-cost drone-based magnetic surveying system, The Leading Edge, 12, 824–827, 2023.
Bennett, J. S., Vyhnalek, B. E., Greenall, H., Bridge, E. M., Fernando, G., Forstner, S., Harris, G. I., Miranda, F. A., and Bowen, W. P.: Precision Magnetometers for Aerospace Applications: A Review, Sensors, 21, 5568, https://doi.org/10.3390/s21165568, 2021.
Da, T., Hei, G., Wu, Y., Chen, M., and Zhao, Y.: FPGA-based cesium optical pump magnetometer data recording system design, in: Journal of Physics: Conference Series. 2815, 012038, IOP Publishing, https://doi.org/10.1088/1742-6596/2815/1/012038, 2024.
Dong, H., Xue, L., Luo, W., Ge, J., Liu, H., Yuan, Z., Zhang, H., and Zhu, J.: A high-accuracy and non-intermittent frequency measurement method for Larmor signal of optically pumped cesium magnetometer, J. Instrum., 16, P06001, https://doi.org/10.1088/1748-0221/16/06/P06001, 2021.
Dou, Z., Cheng, D., and Zhou, Z.: The frequency measurement method for cesium optically pumped magnetic gradiometer based on FPGA, Chin. J. Sensors Actuators, 31, 170–174, 2018.
Eppelbaum, L. V.: Quantitative interpretation of magnetic anomalies from thick bed, horizontal plate, and intermediate models under complex physical-geological environments in archaeological prospection, Archaeol.l Prospect., 23, 255–268, 2015.
Eppelbaum, L. V. and Mishne, A. R.: Unmanned Airborne Magnetic and VLF investigations: Effective Geophysical Methodology of the Near Future, Positioning, 2, No. 3, 112–133, 2011.
Feng, Y., Zhang, Q., Zheng, Y., Qu, X., Wu, F., and Fang, G.: An improved aeromagnetic compensation method robust to geomagnetic gradient, Appl. Sci., 12, 1490, https://doi.org/10.3390/app12031490, 2022.
Greene, K., Bounds, S. R., Broadfoot, R. M., Feltman, C., Hisel, S. J., Kraus, R. M., Lasko, A., Washington, A., and Miles, D. M.: First in situ measurements of the prototype Tesseract fluxgate magnetometer on the ACES-II-Low sounding rocket, Geosci. Instrum. Method. Data Syst., 13, 249–262, https://doi.org/10.5194/gi-13-249-2024, 2024.
Hezel, M. C.: Improving aeromagnetic calibration using artificial neural networks, Air Force Institute of Technology, https://doi.org/10.1007/BF01414949, 2020.
Hu, S., Dong, H., Ge, J., and Luo, W.: A high-speed, continuous and no-intermittent frequency measurement algorithm for cesium optically pumped magnetometer, in: 2017 First International Conference on Electronics Instrumentation & Information Systems (EIIS), 1–5, IEEE, https://doi.org/10.1109/EIIS.2017.8298585, 2017.
Krylov, V. V.: Biological Effects Related to Geomagnetic Activity and Possible Mechanisms, Bioelectromagnetics, 38, 497–510, 2017.
Lebedev, V., Hartwig, S., and Middelmann, T.: Fast and robust optically pumped cesium magnetometer, Adv. Opt. Technol., 9, 275–286, 2020.
Liu, L., Lu, Y., Zhuang, X., Zhang, Q., and Fang, G.: Noise analysis in pre-amplifier circuits associated to highly sensitive optically-pumped magnetometers for geomagnetic applications, Appl. Sci., 10, 7172, https://doi.org/10.3390/app10207172, 2020.
Liu, L. S., Zhang, L., Lu, Y.T., Zhang, Q. Y., and Fang, G. Y.: Research on noise characteristics of the photoelectric detection circuit of optically pumped cesium magnetometer, Chin. J. Sci. Instrum., 39, 203–210, 2018.
Narita, Y., Plaschke, F., Magnes, W., Fischer, D., and Schmid, D.: Error estimate for fluxgate magnetometer in-flight calibration on a spinning spacecraft, Geosci. Instrum. Method. Data Syst., 10, 13–24, https://doi.org/10.5194/gi-10-13-2021, 2021.
Peng, X., Zhou, Y., Li, L., Xu, Z., Zhou, M., and Xu, X.: High precision measurement of light polarization using a Cs atomic magnetometer configuration, J. Phys. B: At. Mol. Opt. Phys., 54, 105401, https://doi.org/10.1088/1361-6455/abfd03, 2021.
Schmidt, V., Coolen, J., Fritsch, T., and Klingen, S.: Towards drone-based magnetometer measurements for archaeological prospection in challenging terrain, Drone Syst. Appl., 12, 1–15, 2024.
Schultze, V., Scholtes, T., IJsselsteijn, R., and Meyer, H. G.: Improving the sensitivity of optically pumped magnetometers by hyperfine repumping, J. Opt. Soc. Am. B, 32, 730–736, 2015.
Stele, A., Kaub, L., Linck, R., Schikorra, M., and Fassbinder, J. W.: Drone-based magnetometer prospection for archaeology, J. Archaeolog. Sci., 158, 105818, https://doi.org/10.1016/j.jas.2023.105818, 2023.
Tang, D., and Sun, Z., and Sui, G.: Preface Geological environment in the South China Sea, J. Oceanol. Limnol., 41, 403–408, 2023.
Xue, L., Dong, H., Luo, W., Ge, J., and Liu, H.: Design of the self-oscillating loop of the optically pumped cesium magnetometer, in: Journal of Physics: Conference Series, 1754, 012156, IOP Publishing, 5696–5705, https://doi.org/10.1007/978-981-19-6613-2_549, 2021.
Zhou, K., Zhang, Q., and Zhang, Q.: Hardware Design and Implementation of a High-Precision Optically Pumped Cesium Magnetometer System Based on the Human-Occupied Vehicle Platform, Appl. Sci., 14, 2076–3417, 2024.
- Abstract
- Introduction
- Overall design of the high-precision cesium optically pumped magnetometer based on the HOV platform
- Design of probe automatic switching software
- Design of the data acquisition and processing software system
- Upper-computer software design
- System testing
- Conclusions
- Code and data availability
- Author contributions
- Competing interests
- Disclaimer
- Acknowledgements
- Financial support
- Review statement
- References