the Creative Commons Attribution 4.0 License.
the Creative Commons Attribution 4.0 License.
 | 20 Mar 2018
A comparative study of auroral morphology distribution between the Northern and Southern Hemisphere based on automatic classification
Qiuju Yang
Aurora is a very important geophysical phenomenon in the high latitudes of Arctic and Antarctic regions, and it is important to make a comparative study of the auroral morphology between the two hemispheres. Based on the morphological characteristics of the four labeled dayside discrete auroral types (auroral arc, drapery corona, radial corona and hot-spot aurora) on the 8001 dayside auroral images at the Chinese Arctic Yellow River Station in 2003, and by extracting the local binary pattern (LBP) features and using a k-nearest classifier, this paper performs an automatic classification of the 65 361 auroral images of the Chinese Arctic Yellow River Station during 2004–2009 and the 39 335 auroral images of the South Pole Station between 2003 and 2005. Finally, it obtains the occurrence distribution of the dayside auroral morphology in the Northern and Southern Hemisphere. The statistical results indicate that the four dayside discrete auroral types present a similar occurrence distribution between the two stations. To the best of our knowledge, we are the first to report statistical comparative results of dayside auroral morphology distribution between the Northern and Southern Hemisphere.
- Article
(2288 KB) - Full-text XML
- BibTeX
- EndNote


Aurora is caused by the collision of charged solar wind particles with the neutral particles in the polar atmosphere. Study of the morphology and evolution of aurora is not only helpful for revealing the solar wind–magnetosphere–ionosphere coupling processes and their internal mechanisms but also provides important physical principles for space weather forecasting (Nishimura et al., 2010; Hu et al., 2009, 2010, 2012, 2013, 2017a, b; Han et al., 2015, 2016, 2017).
As auroral research continues, comprehensive auroral observation has become an important field of polar scientific research for various countries in the world. All-sky cameras (ASCs), which have high spatial resolution and can make broad views and long-term continuous observations, are one of the most effective tools for auroral observation and the investigation of magnetospheric structure and dynamic processes. Therefore, there are many ground-based auroral observatories in the Arctic and Antarctic (Yang et al., 2000; Ebihara et al., 2007; Hu et al., 2009, 2017c). With the establishment of many ground-based stations, those optical instruments produce hundreds of millions of images annually (Syrjäsuo and Partamies, 2012), leading to an urgent need for automatic auroral image analysis techniques (Syrjäsuo et al., 2001, 2004, 2007). Up to now, many studies have been conducted using data from only one station. Syrjäsuo and Donovan (2004) first explored computer vision techniques to auroral image classification. They analyzed 350 000 Gillam ASC images from the CANOPUS (Canadian Auroral Network for the OPEN Program Unified Study) program during 1993–1998 and categorized them into no aurora, arcs, patchy aurora, omega-band, and other auroral structures. Based on the ASC data observed in Kilpisjärvi, Syrjäsuo and Partamies (2012) created an automatic detection scheme for aurora (i.e., whether aurora existed or not). Ebihara et al. (2007) analyzed the quasi-stationary auroral patches based on the ASC images observed between ∼ 09:00 and ∼ 14:00 MLT at the South Pole Station. In recent years, ASC images captured at the Chinese Arctic Yellow River Station have been widely studied. Based on the characteristics of the auroral spectra and morphology, Hu et al. (2009) partitioned the dayside oval into four auroral active regions and further classified the dayside discrete aurora into arc, drapery corona, radial corona and “hot spots”. Wang et al. (2010) and Yang et al. (2012) have proved that the local binary pattern (LBP) can well represent the complex morphology of dayside discrete aurora.
However, each of the aforementioned studies was performed on one station; although the MIRACLE network (Syrjäsuo et al., 1998) includes several stations, the data were studied as a whole (Rao et al., 2014; Savolainen et al., 2016). Recently, Pulkkinen et al. (2011) reported auroral occurrence by using auroral observations from five stations in Fennoscandia and Svalbard in 2000–2009, and Partamies et al. (2014) used 1 million auroral images captured at five camera stations in Finnish and Swedish Lapland in 1996–2007 to study the solar cycle and diurnal dependence of auroral structures; the data in different stations were still analyzed together. Based on the synoptic distribution of the average auroral intensity in the Arctic and Antarctica, Hu et al. (2014) discussed the hemispheric asymmetry of the dayside auroral oval structures, yet they did not consider auroral morphology because they were limited to manual analysis. At present, there are very few comparative studies based on multiple stations, especially with regard to contrastive study of auroral morphology between the Northern and Southern Hemisphere. The different dynamic processes in the magnetosphere can result in different morphological characteristics of the aurora. By comparing the morphological characteristics of the auroras between the Northern and Southern Hemisphere, an investigator can study the difference or similarity in ionospheric responses between the Northern and Southern Hemisphere which result from the dynamic processes in the magnetosphere. In this paper, the LBP descriptor is exploited to characterize the ASC images, and the k-nearest neighbor (k-NN) classifier (Theodoridis and Koutroumbas, 2006) is used to make a statistical comparative analysis of the dayside auroral morphology distribution, with the data captured by the ASCs located at the Antarctic South Pole Station (SPS) and the Arctic Yellow River Station (YRS).
The remainder of this paper is organized as follows. In Sect. 2, the data and LBP-based representation method are introduced. The automatic recognition experimental results of dayside aurora in SPS and YRS are presented in Sect. 3. Section 4 is the discussion. Finally, the conclusion is drawn in Sect. 5.
2.1 Data introduction and pre-processing
The auroral data explored in this paper were captured by the all-sky cameras at two stations. (1) The South Pole Station (SPS) in Antarctica is located at 90.0∘ S geographic latitude and −74.3∘ corrected geomagnetic latitude in Antarctica (Ebihara et al., 2007), where there is a 3.6 h difference between magnetic local time (MLT) and universal time (UT), i.e., MLT ≈ UT−3.6 h. (2) The Chinese Yellow River Station (YRS) at Ny-Ålesund, Svalbard (Hu et al., 2009), is located at geographic coordinates 78.92∘ N, 11.93∘ E and corrected geomagnetic latitude 76.24∘, where MLT is ≈ UT+3 h.
2.1.1 South Pole Station data
The optical instruments at SPS can make 24 h surveys of auroral emissions with a temporal resolution from a few seconds to dozens of seconds during the winter season from April to August. In this paper, we focus on the dayside aurora (09:00–22:00 UT/05:24–18:24 MLT) from May to August to avoid the influence of daylight. Optical instruments cannot capture clear auroral images in cloudy or foggy weather, and after eliminating those invalid data captured under poor weather conditions or without the information of aurora, altogether 211 days of auroral observations are selected from May 2003 to August 2005 to constitute the SPS data set, referred to as auroral test dataset 1 (ATD1), which consists of 39 335 images.
Prior to analyzing these ASC images, some preprocessing steps are performed:
-
Rescaling. Few pixels have an intensity greater than 8000; therefore all images are stretched with a cutoff value of 8000. Image stretching can preserve pixels' relative intensity and enhance image contrast, making auroral images easier to classify.
-
Cropping and rotation. We first crop the images to make the central field of view the center of the ASC images; secondly, the images are rotated counterclockwise by 125.57∘ in order to have the magnetic south direction point upward, considering that the majority of auroral structures are in the east–west direction (Kauristie et al., 2001). Then, given that the edges of ASC images have reached the maximum deformation rate of panoramic cameras, a circle mask with a radius of 199 pixels is applied to cut off the circumferential edge regions where wide-angle distortion is serious and may contain SPS lights. After that, the ASC images are cropped from 512 × 512 to 398 × 398 pixels.
-
Orientation adjustment is done in the direction of east and west in order to keep images consistent with those of YRS (left: east; right: west).
2.1.2 Yellow River Station data
The ASCs at YRS continue to produce auroral images on three wavelengths (427.8, 557.7 and 630.0 nm) for 24 h per day with a temporal resolution of 10 s during the whole winter season (October to March). In this paper, we concentrate on the dayside aurora (03:00–15:00 UT/06:00–18:00 MLT) at 557.7 nm from November to February. After removing those uninformative images captured under poor weather conditions, altogether 249 days of auroral data are selected from December 2003 to January 2009 to constitute the YRS data set. It is divided into two parts: (1) the auroral train dataset (ARD) consists of 8001 images captured from December 2003 to January 2004, and (2) the auroral test dataset 2 (ATD2) includes 65 361 images generated from October 2004 to February 2009.
Some preprocessing steps are also conducted to YRS images.
-
Removing system noise. System noise in ASC instruments is caused by dark current; therefore all images are subtracted from the image of dark current.
-
Masking and cropping. In order to have the same size with the ASC images at SPS, a circle mask with a radius of 199 pixels is used to cut off the outer regions and the image size is cropped to 398 × 398 pixels.
-
Rotation. The images are rotated counterclockwise by 61.1∘ to make north direction upward, which helps the division of images using vertical and horizontal lines at the step of image representation.
-
Rescaling. All images are stretched with a cutoff value of 4000. Note that although the Rayleigh intensity is different between YRS images and SPS images, it does not influence the following results since we extract the texture feature of ASC images as follows.
2.2 ASC image representation
The original LBP operator was introduced by Ojala et al. (1996) primarily for texture classification, and we have proved that it has excellent ability to characterize the spatial texture of auroral images (Wang et al., 2010; Yang et al., 2012). In this paper, the improved LBP operators (Ojala et al., 2002) with a partition scheme are applied to represent ASC images.
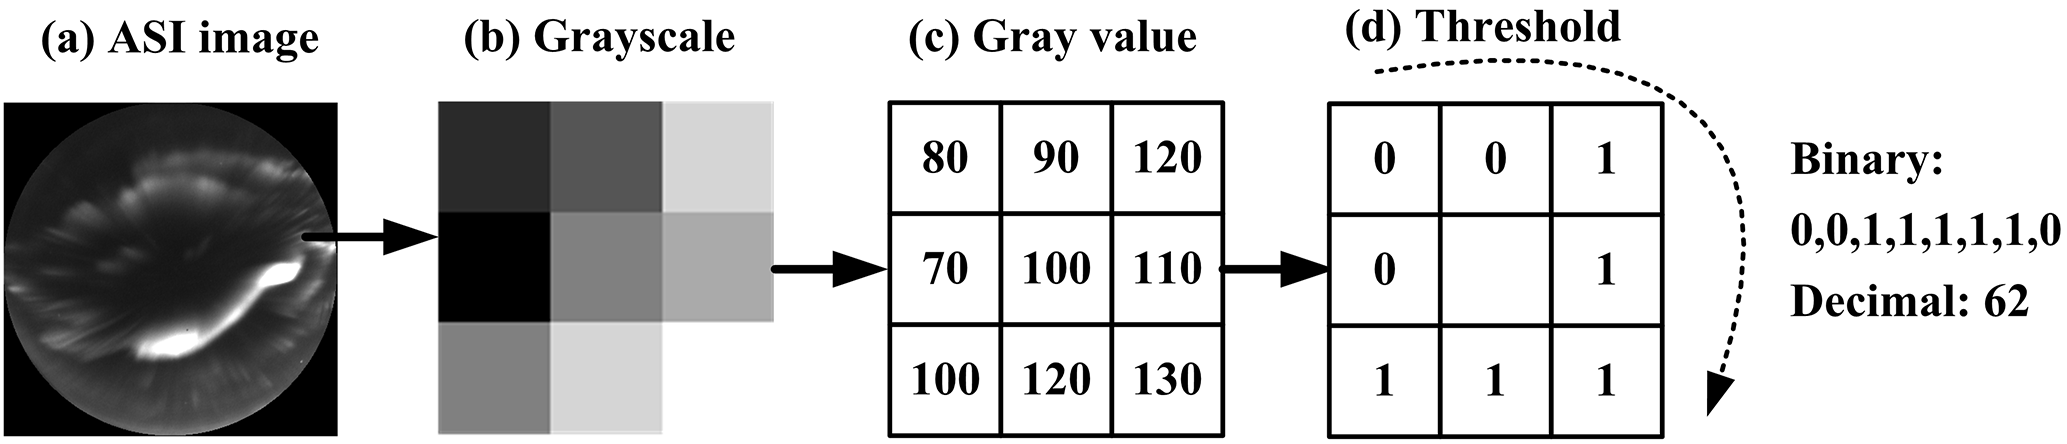
LBP is a simple and efficient texture descriptor; it characterizes a local region by comparing the relative gray values between the central pixel and its neighboring pixels. Figure 1 shows the calculation process of the basic LBP operator. The central pixel value is 100, and its 3 × 3 neighborhood pixels are 80, 90, 120, 110, 130, 120, 100, 70; if the neighbor's pixel value is greater than the center pixel's value, “1” is written, otherwise “0” is written. Therefore, the results are 0, 0, 1, 1, 1, 1, 1, and 0, respectively. The sequence is treated as a binary number, and by assigning the weight 2i for the ith pixel in the neighborhood, the binary sequence is converted to a decimal number (62). Similar processing is performed to all the pixels in the image, and the decimal results are further made histogram statistics.
In order to capture the dominant features with large-scale auroral structures, we use the improved LBP (Ojala et al., 2002; Wang et al., 2010), which is based on circular symmetric neighborhoods of different sizes, to represent the auroral images. Specifically, the parameters of sampling points P are set to 8 and and the radius R of the circle is set to 2, which respectively control the quantization and resolution of the LBP operator.
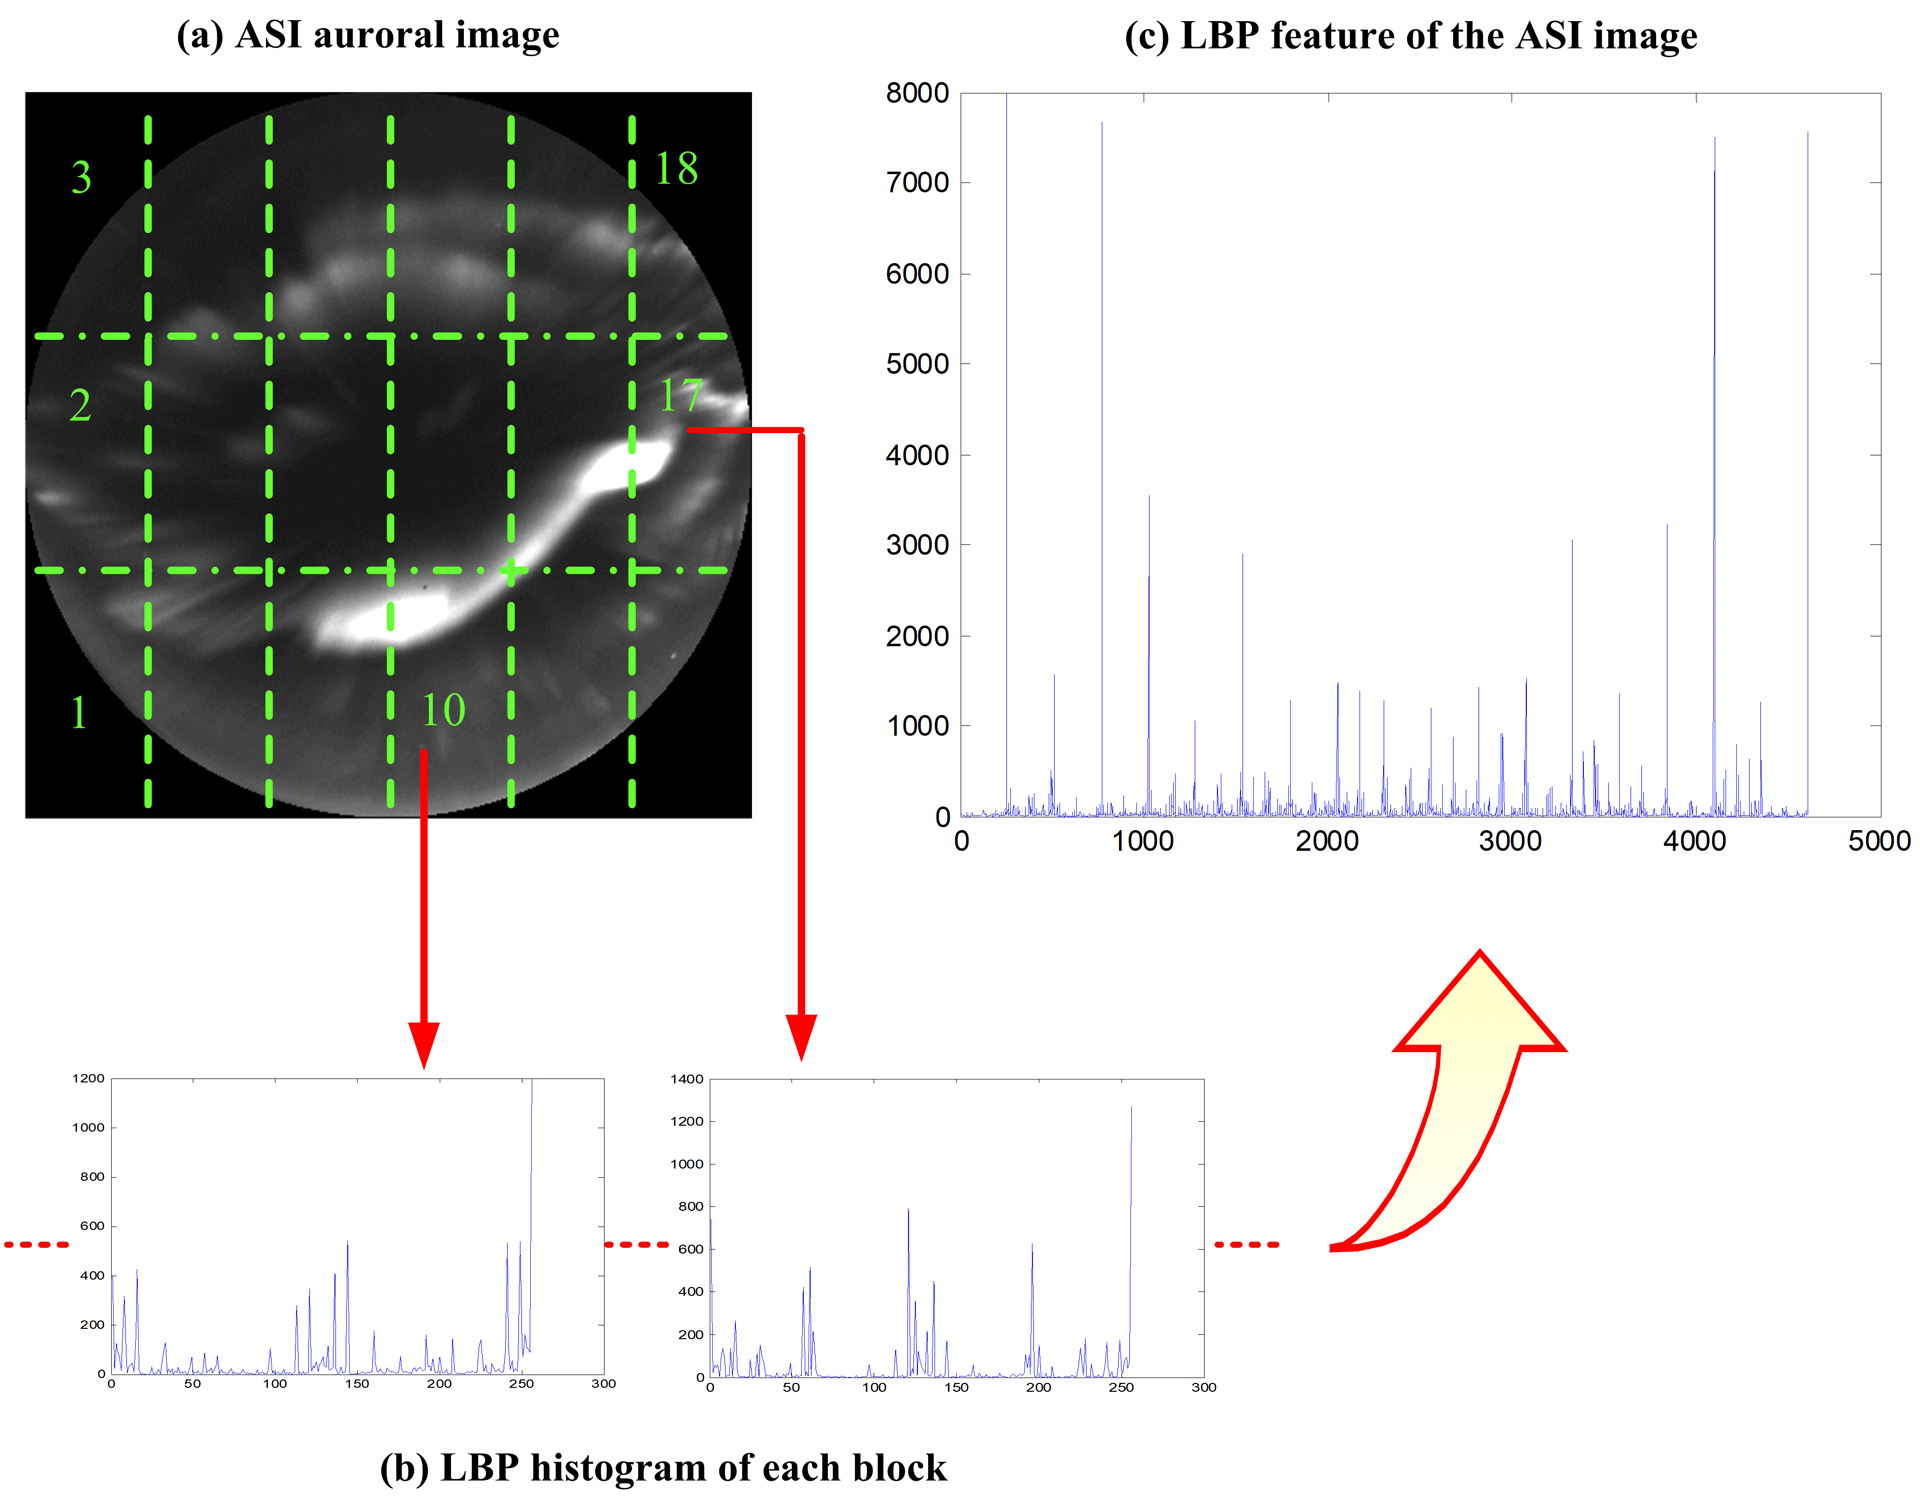
Figure 2The LBP extraction process of the auroral image. The image illustrated was captured at 05:31:51 on 21 December 2003.
According to the characteristics of auroral images, each image is divided into 3 rows and 6 columns, obtaining 18 rectangular blocks (Fig. 2a), and the histogram of the LBP patterns is calculated in each block (Fig. 2b). Finally, these individual histograms are concatenated into a global descriptor for ASC images (Fig. 2c).
3.1 Classification mechanism and data labeling
In this paper, the auroral images are classified into arc, drapery corona, radial corona, and hot spot based on the spectral and morphological signatures (Hu et al., 2009). (1) Arc aurora is a striped auroral form with east–west-extending and narrow north–south-spanning characteristics, and often multiple auroral arcs appear simultaneously in the sky. (2) Drapery corona is a weak display with the features of east–west elongated bands, and often multiple parallel rays appear at the same time. (3) Radial corona has clear radial-like structures which spread from the zenith in all directions. (4) Hot-spot aurora has complex structures, showing ray-like coronal auroras, irregular patches of auroral intensity enhancement (vortex, spots) and arc-like auroral mixed morphologies. Previous investigations (Hu et al., 2009; Wang et al., 2010) reveal that these auroras mainly appear in the hot-spot auroral active region, so they are referred to as hot-spot auroras. More detailed descriptions of the four auroral types can be in Hu et al. (2009) and Wang et al. (2010). In addition, there are some images that the aurora morphology has difficulty classifying into the four auroral types. We also refer to these as the “unknown” type.
Based on the above descriptions, and referring to the synchronous ASC images at wavelengths of 427.8 and 630.0 nm (Wang et al., 2010), ASC images in the ARD are manually labeled according to the abovementioned four categories. In order to avoid very similar morphology between adjacent ASC images (because of the short sampling interval of 10 s at YRS), the ARD is constructed by extending the interval between adjacent images to ∼ 1 min.
3.2 Auroral morphology recognition at SPS and YRS
3.2.1 Image retrieval
Content-based image retrieval experiments are performed on ARD and ATD1 to examine the morphology difference between auroral images at YRS and SPS. The retrieval results are visually estimated to see whether each retrieved image has similar auroral morphology to its query image. Chi-square (χ2) histogram distance is used as a matching criterion. The smaller the distance, the more similar the two images are. The distance is defined as
where p is the LBP histogram of the query image, q is that of the retrieved image, and i indicates the index of the feature vector (i=1–4608). For a given query image in ARD, the matching image in ATD2 is the one with the smallest χ2 distance to the query image. Figure 3 shows the query set, whose images are sampled from ARD of YRS, and by searching the whole of ATD1, the most similar retrieved result is exported. For each of the four auroral types, Fig. 3 shows three image pairs. From Fig. 3, we can conclude that each query and retrieved image pair is of the same auroral type with similar but not identical auroral morphology. The fact that each image pair belongs to the same category indicates the effectiveness of our approach, and the morphology differences result from the observation difference itself between YRS and SPS and the error caused by the insufficient algorithm accuracy.
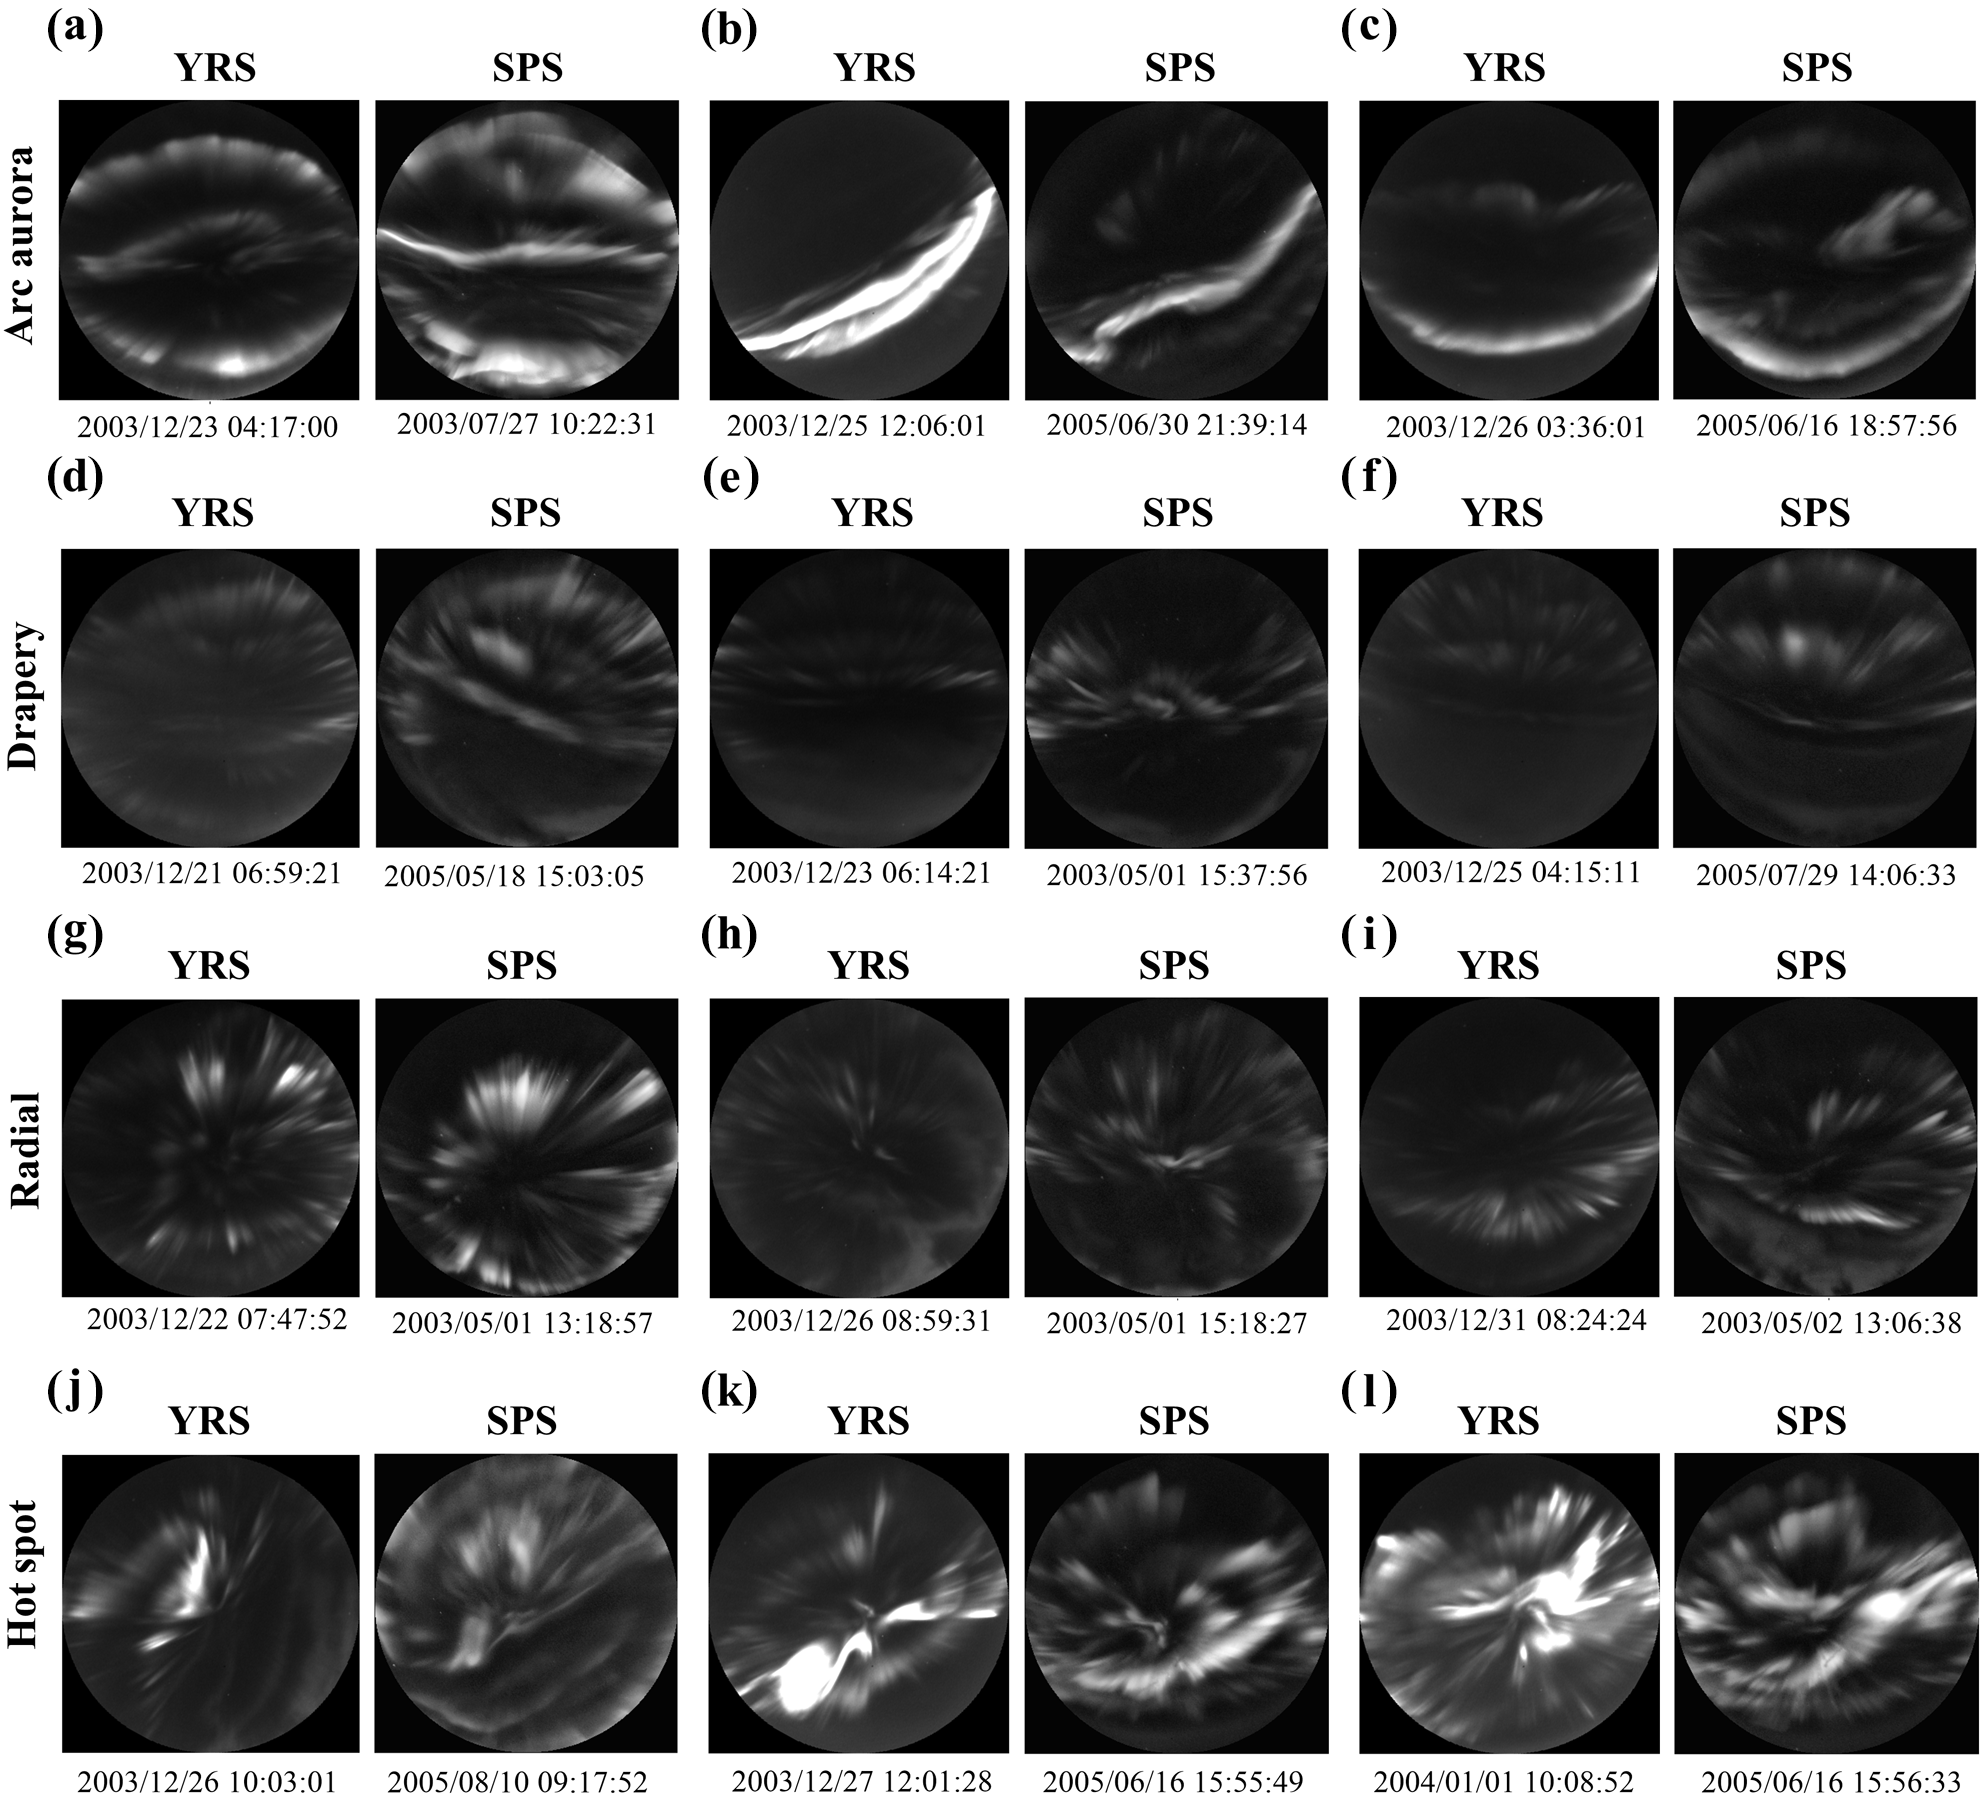
Figure 3Comparison of the four auroral types at SPS and YRS by retrieval experiments. The images from labeled ARD of YRS are used as query images, and the images of SPS are the retrieval results from ATD1 which are the most similar to each query image.
3.2.2 Supervised classification
Based on the spectral signatures of dayside auroras, Hu et al. (2009) partitioned the dayside oval into four auroral active regions, i.e., a pre-noon warm spot (“W”, 07:30–09:30 MLT), a midday gap (“M”, 09:30–13:00 MLT), a post-noon hot spot (“H”, 13:00–15:30 MLT), and the dusk aurora sector (“D”, 15:30–17:00 MLT). In this section, supervised classification experiments are conducted on ARD to estimate the classification accuracy in different auroral active regions.
Specifically, the widely used k-nearest neighbor (k-NN) classifier is selected. A dataset is divided into two subsets: the training set (assuming image type is known) and the testing set (assuming image type is unknown). An image in the testing set is classified by a majority vote of its neighbors in the training set and assigned the most common class among its k-nearest neighbors (k is a positive integer). The choice of value for k is very critical for the k-NN classifier: the smaller the k, the more result is sensitive to the noise and the overlap between classes, causing unstable results; the greater the k, the more the majority class of the dataset will dominate the neighbors, resulting in classification error. Considering that the size of the ARD is 8001, we conduct experiments using k=1, 3, and 5.
Ten-fold cross-validation experiments are performed on the ARD. Images of the four auroral types are separately divided into 10 parts randomly, of which 9 parts are used to train the classifier, and the remaining part is used as the testing set to evaluate the classification effectiveness. The training–testing ratios in each auroral active region are not strictly guaranteed to be 9:1. Table 1 shows their specific number. In order to obtain robust results, the experiments are repeated 100 times with different methods of data partitioning. The mean accuracy and standard deviation are given in Table 2.
Table 1The number of images belonging to four auroral types in different auroral active regions, including the number of the testing set in 10-fold cross-validation experiment and all of the images in the ARD (in parentheses).
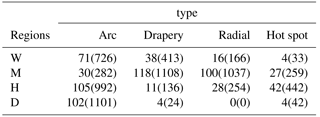
Table 2Experiment performance from 100 iterations (mean accuracy ± standard deviation %) of the k-NN classifier in different auroral active regions.
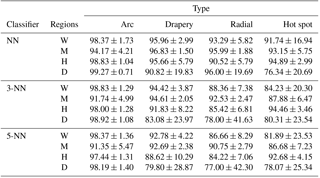
From Table 2, we can conclude the following. (1) The NN classifier works best. Two adjacent images in the ARD are picked out in a short time interval; specifically, there are 1690 out of 8001 images captured with intervals less than 2 min (Yang et al., 2012). ASC images with such short intervals always have similar morphology; therefore the NN classifier works best in the experiments. (2) In the W region, the classification accuracy changes considerably and has a large standard deviation value. This is because there are very few hot-spot auroras (fewer than 4 % of the total number), as shown in Table 1; the accuracy will change considerably even if only one image is categorized into different types. (3) In the D region, the classification accuracy also changes substantially and has a large standard deviation value too. The reason for this is also presented in Table 1; most images in the D region are arc auroras, and very few images belong to other auroral types (fewer than 8 % of arc auroras). Very few images classified into different categories may lead to a large difference in the accuracy of drapery corona, radial corona and hot-spot auroras and with large deviation values. (4) On the whole, the more the image data, the smaller the deviation value. (5) Except for invalid results (standard deviation is greater than 10 %, which is shown by gray shading in Table 2), the accuracies of arc and hot-spot auroras show a significant decrease at the M region, while drapery and radial coronas have a lower accuracy at the H region. (6) The proposed method achieves very good performance: almost all the classification accuracies are higher than 90 %.
3.2.3 Occurrence distributions
In this part, the labeled ARD is used as the training set, and by exploiting the class information contained in it, we recognize all the images in ATD1 and ATD2 with a k-NN classifier. The occurrence distributions of the four auroral types classified by k-NN are plotted and compared at both stations.
Unlike ARD, when constructing ATD1 and ATD2, all auroral images are picked except for the images captured under poor weather conditions or which have no aurora information; therefore, a rejection classification is needed. The k-NN method classifies an object by a majority vote from its neighbors. If there is no majority agreement, the testing image is not assigned a label. In the occurrence distribution experiments, if an image in ATD1 or ATD2 is discarded by the k-NN classifier, it is labeled as unknown. In consideration of the size of ATD1 and ATD2 and the image interval in the two datasets, we use 3-NN and 25-NN classifiers, respectively. Detailed results are given in Table 3.
Table 3Classification results for ATD1 of SPS and ATD2 of YRS using 3-NN and 25-NN classifiers.
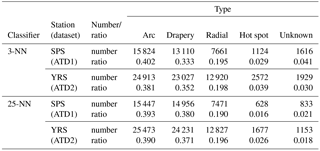
From Table 3 we can see that (1) there is little difference between 3-NN and 25-NN classifiers, especially for radial corona, arc, and hot-spot auroras, whose differences are less than 1.5 %; (2) the most different auroral type between the two stations is drapery corona, because the texture of the drapery aurora is complex and error-prone; (3) the occurrence percentages of the four auroral types at both stations in the Northern and Southern Hemisphere are very close, of which the arc aurora is about 39 %, while drapery corona is around 33–38 %, radial corona is about 20 %, and hot spot is around 3 %; and (4) the number of “unknown” type obtained by the 25-NN classifier is less than for the 3-NN, because it is more difficult for 3-NN classifiers to get a majority vote.
The temporal distributions of the four auroral categories are presented in Fig. 4. For ATD1 and ATD2, the temporal axis is divided into 39 and 36 bins, respectively, with 20 min durations for better display. The number of images within each bin for each category is first counted, and by normalizing the total number of images in the same bin, the occurrence distributions are obtained. There are no significant differences between the distributions obtained by 3-NN and 25-NN, so we only show that of the 25-NN in Fig. 4. Panels (a) and (b) of Fig. 4 shows the distribution of all images in ATD1 and ATD2.
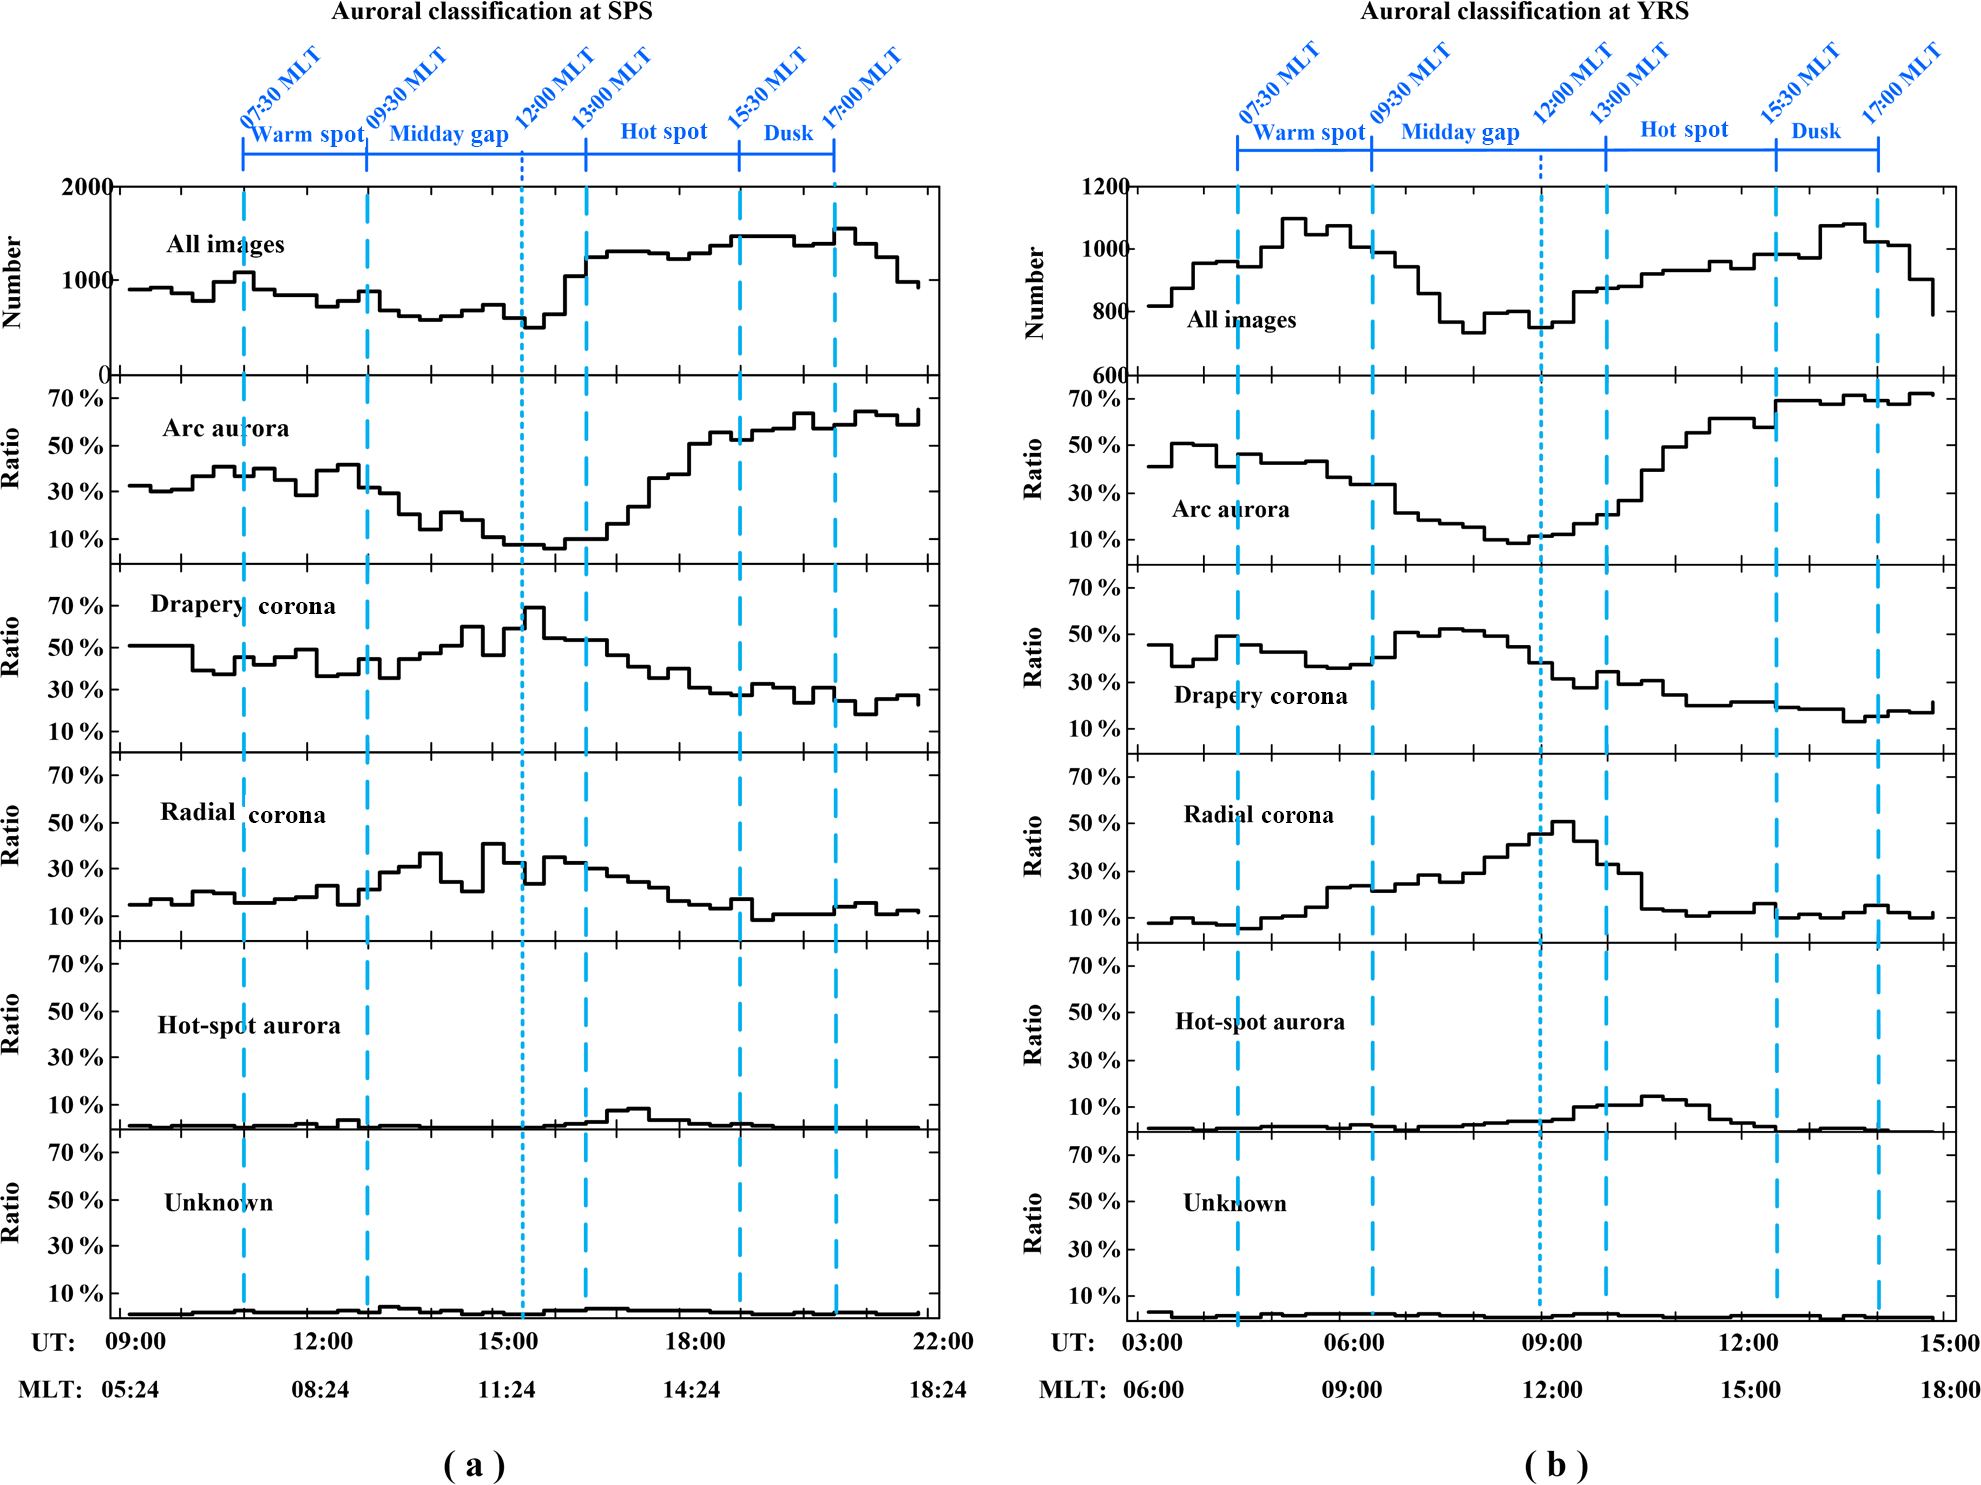
Figure 4Temporal occurrence distributions of auroral types at SPS (a) and YRS (b): from top to bottom, panels show the distributions of numbers of images (top panel), four categories of dayside auroras (second to fifth panels) in ATD1 and ATD2, and the unknown images in both datasets.
From the second panel to the bottom panel, Fig. 4 shows the occurrence distribution of the four auroral categories and the unknown type. At the very top of Fig. 4, four active regions proposed by Hu et al. (2009) are distinguished by bold dashed lines, while the two states of the midday gap are partitioned by a thin dashed line. The four auroral types dominate different dayside oval regions The peaks of four auroral types each fall into different active regions.
From Fig. 4, we can see that the occurrence distributions at both stations are similar. (1) The occurrence distributions of arc auroras show a distinct asymmetric double peak between pre-noon and post-noon (Akasofu and Kan, 1980; Liou et al., 1997; Meng and Lundin, 1986; Newell et al., 1996; Hu et al., 2009). (2) Two corona auroras, drapery and radial, have similar auroral morphologies, and both predominantly occur before 13:00 MLT. (3) The hot-spot auroras mostly occur in region H and have a distinct small peak around 13:30 MLT. (4) There are a few atypical images in ATD1 and ATD2 that are classified as unknown. (5) In addition to the similar distribution trends of the four auroral categories at both stations, the occurrence ratios of each category in each MLT at both stations are also very close.
Although there are so many similarities, differences also exist in the auroral occurrence distributions of the two stations. (1) Drapery and radial coronas show different peak positions at the two stations. (2) Although the hot-spot aurora has an occurrence peak around 13:30 MLT at both SPS and YRS, the duration of YRS is much longer than SPS.
The discrete aurora includes acceleration mainly caused by two physical mechanisms: one is quasi-static electric fields, producing monoenergetic auroral precipitation that always appears in the “inverted V” electron spectrum, while the other is dispersive Alfvén waves, producing broadband auroral electron precipitation (Newell et al., 2009). Ionospheric satellite observations show that monoenergetic precipitation mostly exists in the 14:00–19:00 MLT region of the post-noon auroral oval, followed by the 06:00–09:00 MLT region of the pre-noon auroral oval (the incidence and electron precipitation energy flux of the latter are lower than the former), and the noon (09:00–14:00 MLT) region is the least likely region for observing monoenergetic electron acceleration (Newell et al., 1996, 2009). Such a distribution is consistent with that of the arc aurora. As shown in Fig. 4, at both stations, the occurrence percentages of arc aurora at the 14:00–18:00 MLT region of the post-noon oval are greater than 50 %, and the percentages at the 06:00–09:00 MLT region of the pre-noon oval are 30–50 %, while they are less than 30 % at 09:00–14:00 MLT of the noon region, especially around 12:00 MLT of the noon the percentages are even less than 10 %. The similar occurrence distributions between the two stations demonstrate that the arc auroras with electron spectrum characteristics of “inverted V” structures are closely associated with the quasi-static electric field acceleration.
Dayside coronas (drapery, radial and hot spot) have distinct filament structures, which indicates that (1) the corona aurora is excited in a broad altitude range and (2) the energy distribution of these precipitating electrons that excite coronas is very broad. (The excitation altitude of aurora is closely related to the energy of precipitating electrons: the higher the energy, the lower the altitude of precipitating electrons entering into the ionosphere.) Satellite spectrum probes have proved that the precipitating electron spectrum of dayside coronas has the signatures of the broadband auroral electron precipitation (Hu et al., 2009). Ionospheric satellite observations show that the broadband electron precipitation in the dayside auroral oval mostly occurs at the 06:00–15:00 MLT region, and it occurs more often at pre-noon than post-noon (Newell et al., 2009). The occurrence rate of dayside corona auroras at both stations in the Northern and Southern Hemisphere also dominates the 06:00–15:00 MLT regions, which is similar to that of the satellite detection. In addition, satellite observations obtained at higher altitudes (> 6000 km) show that dispersive Alfvén waves primarily occur at the 06:00–15:00 MLT region of the dayside auroral oval (Chaston et al., 2007). Therefore, dayside corona auroras are closely related to dispersive Alfvén waves. However, the ground-based optical observations demonstrate that the dayside corona auroras can be classified into three types: drapery corona auroras, radial corona auroras, and hot-spot auroras. These corona auroral types are possibly related to the propagation process of dispersive Alfvén waves at different magnetosphere boundary layers, which results in the difference of the three corona auroral types between the two stations. Such an inference needs further confirmation by combined analysis of satellite and ground-based optical observations.
Based on previous studies of the morphological classification of dayside auroras (Hu et al., 2009), and by applying image processing and pattern recognition techniques on the ASC observations at SPS (during years 2004–2006) and YRS (during years 2003–2009), this paper created an automatic recognition scheme for dayside auroral morphology in the Southern and Northern Hemisphere and a statistical analysis of the distribution of dayside auroral types. Experimental results show that in both the Southern and Northern Hemisphere, the dayside arc auroras primarily occur at post-noon (14:00–18:00 MLT) and pre-noon (06:00–09:00 MLT) regions but mostly occur at post-noon, while between the two peaks, the noon region (09:00–14:00 MLT) forms a “midday gap”. Dayside corona auroras mostly occur at 06:00–15:00 MLT regions. The distribution of arc and corona respectively corresponds to the occurrence rate of quasi-static electric field acceleration and dispersive Alfvén wave acceleration on the dayside auroral oval.
All data in the paper are public, and please connect the first and corresponding authors for the data. Data were issued by the Data-sharing Platform of Polar Science (http://www.chinare.org.cn), maintained by the Polar Research Institute of China (PRIC) and the Chinese National Arctic & Antarctic Data Center (CN-NADC).
The authors declare that they have no conflict of interest.
We acknowledge Yusuke Ebihara at Kyoto University for providing the ASC
auroral observation data of the South Pole Station
(http://www.southpole-aurora.org/). This work was supported by the
National Natural Science Foundation of China (41504122, 41274164, 41431072,
41374159), the Top-Notch Young Talents Program of China, Shaanxi Province
youth talent fund (2016JQ4001), Young Talent Fund of University Association
for Science and Technology in Shaanxi, China (20160211), the Polar
Environment Comprehensive Investigation and Assessment Programs
(CHINARE2017-02-03, CHINARE2017-04-01), the Strategic Priority Research
Program on Space Science, and the Chinese Academy of Sciences (XDA15350202,
XDA15052400).
Edited by: Andrea Benedetto
Reviewed by: two anonymous referees
Akasofu, S. I. and Kan, J. R.: Dayside and nightside auroral arc systems, Geophys. Res. Lett., 7, 753–756, 1980.
Chaston, C. C., Carlson, C. W., McFadden, J. P., Ergun, R. E., and Strangeway, R. J.: How important are dispersive Alfvén waves for auroral particle acceleration?, Geophys. Res. Lett., 34, L07101, https://doi.org/10.1029/2006GL029144, 2007.
Ebihara, Y., Tanaka, Y.-M., Takasaki, S., Weatherwax, A. T., and Taguchi, M.: Quasi-stationary auroral patches observed at the South Pole Station, J. Geophys. Res., 112, A01201, https://doi.org/10.1029/2006JA012087, 2007.
Han, D. S., Chen, X., Liu, J., Qiu, Q., Keika, K., Hu, Z. J., Liu, J. M., Hu, H. Q., and Yang, H. G.: An extensive survey of dayside diffuse aurora based on optical observations at Yellow River Station, J. Geophys. Res.-Space Phys., 120, 7447–7465, 2015.
Han, D. S., Nishimura, Y., Lyons, L. R., Hu, H. Q., and Yang, H. G.: Throat aurora: The ionospheric signature of magnetosheath particles penetrating into the magnetosphere, Geophys. Res. Lett., 43, 1819–1827, https://doi.org/10.1002/2016GL068181, 2016.
Han, D. S., Hietala, H., Chen, X. C., Nishimura, Y., Lyons, L. R., Liu, J. J., Hu, H. Q., and Yang, H. G.: Observational properties of dayside throat aurora and implications on the possible generation mechanisms, J. Geophys. Res.-Space Phys., 122, 1853–1870, https://doi.org/10.1002/2016JA023394, 2017.
Hu, Z.-J., Yang, H., Huang, D., Araki, T., Sato, N., Taguchi, M., Seran, E., Hu, H., Liu, R., Zhang, B., Han, D., Chen, Z., Zhang, Q., Liang, J., and Liu, S.: Synoptic distribution of dayside aurora: multiple-wavelength all-sky observation at Yellow River Station in Ny-Ålesund, Svalbard, J. Atmos. Sol.-Terr. Phys., 71, 794–804, https://doi.org/10.1016/j.jastp.2009.02.010, 2009.
Hu, Z.-J., Yang, H., Liang, J., Han, D., Huang, D., Hu, H., Zhang, B., Liu, R., and Chen, Z.: The 4-emission-core structure of dayside aurora oval observed by all-sky imager at 557.7 m in Ny-Ålesund, Svalbard, J. Atmos. Sol.-Terr. Phys., 72, 638–642, https://doi.org/10.1016/j.jastp.2010.03.005, 2010.
Hu, Z.-J., Yang, H.-G., Han, D.-S., Huang, D.-H., Zhang, B.-C., Hu, H.-Q., and Liu, R.-Y.: Dayside auroral emissions controlled by IMF: A survey for dayside auroral excitation at 557.7 and 630.0 nm in Ny-Ålesund, Svalbard, J. Geophys. Res., 117, A02201, https://doi.org/10.1029/2011JA017188, 2012.
Hu, Z.-J., Yang, H.-G., Hu, H.-Q., Zhang, B.-C., Huang, D.-H., Chen, Z.-T., and Wang, Q.: The hemispheric conjugate observation of postnoon “bright spots”/auroral spirals, J. Geophys. Res.-Space Phys., 118, 1428–1434, https://doi.org/10.1002/jgra.50243, 2013.
Hu, Z.-J., Ebihara, Y., Yang, H.-G., Hu, H.-Q., Zhang, B.-C., Ni, B., Shi, R., and Trondsen, T. S.: Hemispheric asymmetry of the structure of dayside auroral oval, Geophys. Res. Lett., 41, 8696–8703, https://doi.org/10.1002/2014GL062345, 2014.
Hu, Z.-J., Yang, Q.-J., Liang, J.-M., Hu, H.-Q., Zhang, B.-C., and Yang, H.-G.: Variation and modeling of ultraviolet auroral oval boundaries associated with interplanetary and geomagnetic parameters, Space Weather, 15, 606–622, https://doi.org/10.1002/2016SW001530, 2007a.
Hu, Z.-J., Yang, H.-G., Ebihara, Y., Hu, H.-Q., and Zhang, B.-C.: Surveys of 557.7/630.0 nm Dayside Auroral Emissions in Ny-Ålesund, Svalbard, and South Pole Station, in: Dawn-Dusk Asymmetries in Planetary Plasma Environments, edited by: Haaland, S., Runov, A., and Forsytn, C., John Wiley & Sons, Inc.: 143–154, https://doi.org/10.1002/9781119216346, 2017b.
Hu, Z.-J., He, F., Liu, J.-J., Huang, D.-H., Han, D.-S., Hu, H.-Q., Zhang, B.-C., Yang, H.-G., Chen, Z.-T., Li, B., and Chen, X.-C.: Multi-wavelength and multi-scale aurora observations at the Chinese Zhongshan Station in Antarctica, Polar Sci., 14, 1–8, https://doi.org/10.1016/j.polar.2017.09.001, 2017c.
Kauristie, K., Syrjäsuo, M. T., Amm, O., Viljanena, A., Pulkkinen, T. I., and Opgenoorth, H. J.: A Statistical study of evening sector arcs and electrojets, Adv. Space Res., 28, 1605–1610, 2001.
Liou, K., Newell, P. T., Meng, C. I., Brittnacher, M., and Parks, G.: Synoptic auroral distribution: a survey using polar ultraviolet imagery, J. Geophys. Res., 102, 27197–27205, 1997.
Meng, C. I. and Lundin, R.: Auroral morphology of the midday oval, J. Geophys. Res., 91, 1572–1584, 1986.
Newell, P. T., Lyons, K. M., and Meng, C.-I.: A large survey of electron acceleration events, J. Geophys. Res., 101, 2599–2614, 1996.
Newell, P. T., Sotirelis, T., and Wing, S.: Diffuse, monoenergetic, and broadband aurora: The global precipitation budget, J. Geophys. Res.-Space Phys, 114, A09207, https://doi.org/10.1029/2009JA014326, 2009.
Nishimura, Y., Bortnik, J., Li, W., Thorne, R. M., Lyons, L. R., Angelopoulos, V., Mende, S. B., Bonnell, J. W., Le Contel, O., Cully, C., Ergun, R., and Auster, U.: Identifying the Driver of Pulsating Aurora, Science, 330, 81–84, 2010.
Ojala, T., Pietikainen, M., and Harwood, D.: A comparative study of texture measures with classification based on feature distributions, Pattern Recognition, 29, 51–59, 1996.
Ojala, T., Pietikäinen, M., and Mäenpää, T.: Multiresolution grayscale and rotation invariant texture classification with local binary patterns, IEEE T. Pattern. Anal., 24, 971–987, 2002.
Partamies, N., Whiter, D., Syrjäsuo, M., and Kauristie, K.: Solar cycle and diurnal dependence of auroral structures, J. Geophys. Res.-Space Phys., 119, 8448–8461, 2014.
Pulkkinen, T. I., Tanskanen, E. I., Viljanen, A., Partamies, N., and Kauristie, K.: Auroral electrojets during deep solar minimum at the end of solar cycle 23, J. Geophys. Res.-Space Phys., 116, A04207, https://doi.org/10.1029/2010JA016098, 2011.
Rao, J., Partamies, N., Amariutei, O., Syrjäsuo, M., and Sande, K.: Automatic Auroral Detection in Color All-Sky Camera Images, IEEE J. Sel. Topics Appl. Earth Observ. Remote Sens., 7, 4717–4725, 2014.
Savolainen, T., Whiter, D. K., and Partamies, N.: Automatic segmentation and classification of seven-segment display digits on auroral images, Geosci. Instrum. Method. Data Syst., 5, 305–314, https://doi.org/10.5194/gi-5-305-2016, 2016.
Syrjäsuo, M. T. and Donovan, E. F.: Diurnal auroral occurrence statistics obtained via machine vision, Ann. Geophys., 22, 1103–1113, https://doi.org/10.5194/angeo-22-1103-2004, 2004.
Syrjäsuo, M. T. and Partamies, N.: Numeric Image Features for Detection of Aurora, IEEE Geosci. Remote Sens. Lett., 9, 176–179, 2012.
Syrjäsuo, M. T., Pulkkinen, T. I., Janhunen, P., Viljanen, A., Pellinen, R. J., Kauristie, K., Opgenoorth, H. J., Wallman, S., Eglitis, P., Karlsson, P., Amm, O., Nielsen, E., and Thomas, C.: Observations of substorm electrodynamics by using the MIRACLE network, Proc. 4th Int. Conf. Substorms, 111–114, 1998.
Syrjäsuo, M. T., Kauristie, K., and Pulkkinen, T. I.: A search engine for auroral forms, Adv. Space Res., 28, 1611–1616, 2001.
Syrjäsuo, M. T., Donovan, E. F., and Cogger, L. L.: Content-based retrieval of auroral images-thousands of irregular shapes, Proceedings of the Fourth IASTED Visualization, Imaging, and Image Processing, 224–228, 2004.
Syrjäsuo, M. T., Donovan, E. F., Qin, X., and Yang, Y.: Automatic classification of auroral images in substorm studies, Int. Conf. Substorms, 8, 309–313, 2007.
Theodoridis, S. and Koutroumbas, K.: Pattern Recognition, 3rd Edn., Academic Press, Inc, 2006.
Wang, Q., Liang, J. M., Hu, Z. J., Hu, H. H., Zhao, H., Hu, H. Q., Gao, X. B., and Yang, H. G.: Spatial Texture Based Automatic Classification of Dayside Aurora in All-Sky Images, J. Atmos. Sol.-Terr. Phys., 72, 498–508, 2010.
Yang, H., Sato, N., Makita, K., Kikuchi, M., Kadokura, A., Ayukawa, M., Hu, H. Q., Liu, R. Y., and Häggström, I.: Synoptic observations of auroras along the post-noon oval: a survey with all-sky TV observations at Zhongshan, Antarctica, J. Atmos. Sol.-Terr. Phys., 62, 787–797, 2000.
Yang, Q. J., Liang, J. M., Hu, Z. J., and Zhang, H.: Auroral Sequence Representation and Classification Using Hidden Markov Models, IEEE Trans. Geosci. Remote Sens., 50, 5049–5060, 2012.