the Creative Commons Attribution 4.0 License.
the Creative Commons Attribution 4.0 License.
 | 05 Nov 2018
Consideration of NDVI thematic changes in density analysis and floristic composition of Wadi Yalamlam, Saudi Arabia
Amal Y. Aldhebiani
Ahmad K. Hegazy
Hanaa K. Galal
Norah S. Mufareh
Wadi Yalamlam is known as one of the significant wadis in the west of Saudi Arabia. It is a very important water source for the western region of the country. Thus, it supplies the holy places in Mecca and the surrounding areas with drinking water. The floristic composition of Wadi Yalamlam has not been comprehensively studied. For that reason, this work aimed to assess the wadi vegetation cover, life-form presence, chorotype, diversity, and community structure using temporal remote sensing data. Temporal datasets spanning 4 years were acquired from the Landsat 8 sensor in 2013 as an early acquisition and in 2017 as a late acquisition to estimate normalized difference vegetation index (NDVI) changes. The wadi was divided into seven stands. Stands 7, 1, and 3 were the richest with the highest Shannon index values of 2.98, 2.69, and 2.64, respectively. On the other hand, stand 6 has the least plant biodiversity with a Shannon index of 1.8. The study also revealed the presence of 48 different plant species belonging to 24 families. Fabaceae (17 %) and Poaceae (13 %) were the main families that form most of the vegetation in the study area, while many families were represented by only 2 % of the vegetation of the wadi. NDVI analysis showed that the wadi suffers from various types of degradation of the vegetation cover along with the wadi main stream.
- Article
(4350 KB) - Full-text XML
- BibTeX
- EndNote


The Kingdom of Saudi Arabia is a big desert with a land area of approximately 2 250 000 km2 comprising the basic area of the Arabian Peninsula. Based on that, xerophytic vegetation forms the distinguished topographies of the plant life in the country (Khalik et al., 2013). According to Abuzinada et al. (2005), the natural areas and biological diversity are very large in the kingdom, and these factors are very important for dealing with ecosystems. The vegetation structure in Saudi Arabia presents differences in a distributional manner that arise from changes in different factors and resources such as weather and soil variables, anthropogenic pressures, and water (Hegazy et al., 2007).
The geographical location of Saudi Arabia between the surrounding continents indicates the importance of the vegetation structure in the kingdom. Hence, the flora contains different global elements such as the Palaearctic (located in Asia and Europe), Afrotropical (located in Africa), and the Malayan–Indo world (Ghazanfar, 2006). Saudi Arabia has three categories of plant diversity: Sudano–Deccanian, Saharo–Sindian, and tropical Indian–African (Alfarhan, 1999; Thomas et al., 2008). According to Collenette (1998), some areas in Saudi Arabia like the Asir, Alhejaz, and the western mountains have high floristic diversity. These mountain chains are near the Red Sea and they have the greatest level of rainfall (Şen et al., 2017). The height of these mountains reaches up to 2850 m. Some researchers have demonstrated that the topography and climate of the area are affecting the level of speciation (Abulfatih, 1992; El-Kady et al., 1995; Shaltout and Mady, 1996; Shaltout et al., 1997). The flora of Saudi Arabia is reasonably well identified at the taxonomic level. The species richness of the 15 protected areas controlled by the National Commission for Wildlife Conservation and Development, as well as many of the zones protected by the administration of the Ministry of Agriculture, is somehow well documented in the work of Forbis et al. (2006), but this was more than 10 years ago. The number of verified species in Saudi Arabia is growing day by day based on recent field trips and biodiversity studies. An example is that over 1500 species were recorded by Migahid (1978) between the years 1974 and 1988. This number was raised to 2300 within a period of about 3 decades according to the accounts given in the Flora of Saudi Arabia (Chaudhary, 1999, 2000; Alfarhan et al., 2005; Masrahi et al., 2012). Several scholarly works were conducted on the flora of Saudi Arabia. Two of the most comprehensive works on the flora of Saudi Arabia were conducted by Migahid (1978) and Chaudhary (1999, 2000). There are some studies on different areas of Saudi Arabia such as Schulz and Whitney (1986), who studied the vegetation and floras of the sabkhas, hillocks, and other prominent mountains of the Najd regions Twaik, Aja, and Salma. Considerable efforts have also been made toward the elucidation of vegetation–environmental relationships in the ecosystems of “raudhas” or depressions (Shaltout and Mady, 1996; Sharaf El Din et al., 1999; Alfarhan, 2001). The plant communities of wadis have been recorded in some studies like Wadi Al-Ammaria by Al-Yemeni (2001) and Wadi Hanifa by Taia and El-Ghanem (2001) and El-Ghanem (2006). But no previous study has been done on the flora of Wadi Yalamlam.
The realization of the normalized difference vegetation index (NDVI) is a robust spectral index using the near-infrared (NIR) and red bands of both satellite and aerial multispectral imagery computed across scene pixels in time and space. The NDVI has been successful in monitoring and assessing vegetative cover as well as vegetation conditions (Van Leeuwen, 2008; Elhag, 2016a). The main purpose of NDVI applications is to distinguish between healthy and stressed vegetation in addition to forest type discrimination (Lambin, 1994; Rindfuss and Stern, 1998).
Therefore, the aim of the current research is to study the vegetation cover in Wadi Yalamlam from different aspects, such as species richness, life-form presence, and biodiversity in relation to habitat change in the study area. The normalized difference vegetation index has been conducted from temporal remote sensing data to assess the status of the vegetation cover within the designated study area over the last 4 years. Moreover, species diversity indices have been used to discriminate vegetation sets and to evaluate the relation between the vegetation aspects in the study area.
2.1 Study area
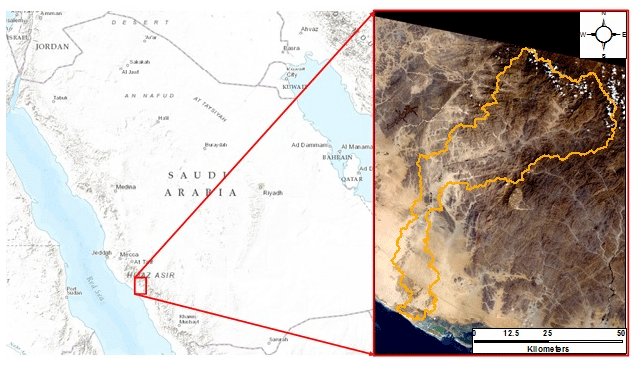
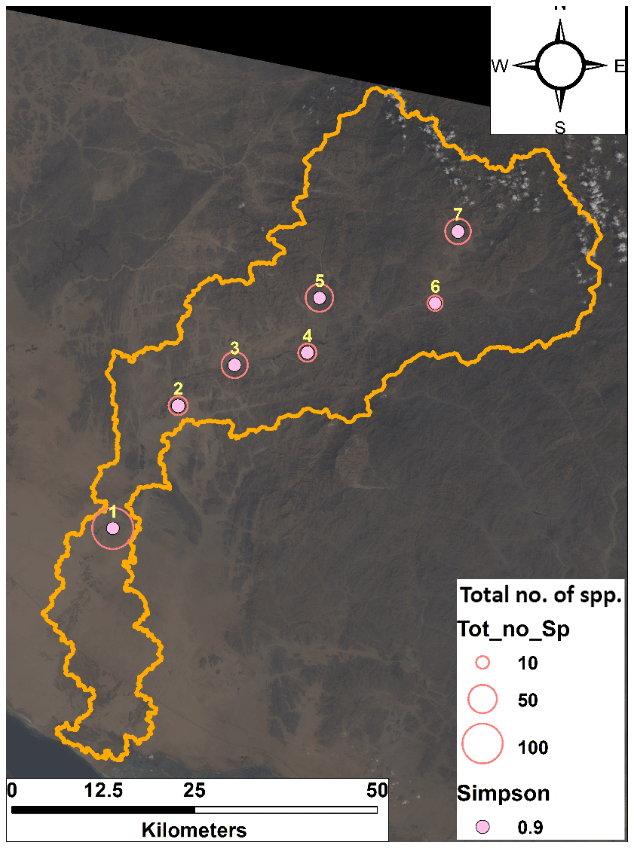
The location of Wadi Yalamlam is about 100 km south of Mecca city between 20∘26′, 21∘8′ N and 39∘45′, 40∘29′ E (Fig. 1). The wadi basin covers a large area of about 180 000 ha. The border of the basin located in the downstream area is expanded to comprise almost all the flat area in the lower part. Wadi Yalamlam initiates from the high altitudes of the Hijaz Mountains near Taif from the Al Shafa area. Its average annual rainfall is ca. 140 mm. The wadi has different altitudes greatly varying from 2850 to 25 m (a.s.l.) in the upstream and downstream areas, respectively. The main route of Wadi Yalamlam is traversed by greatly cracked granitoid, gabbroic, and metamorphic rocks until it reaches the Red Sea coastal plain and it is about 120 km in length. Incisive natural vegetation covers the higher and the central parts of the basin. On the other hand, Quaternary deposits and sand dunes accompanied by tiny scattered particles vastly alter the granitoid and metamorphosed basaltic hills, which are the constitutes of the lower part of the wadi. Several basic ditches are observed in the lower part of the basin. Moreover, the depth of the Quaternary deposits of the wadi is larger in the lower part.
2.2 Climate of the study area
The climate of the Red Sea coast is usually stable as the weather is cold in the winter season and warm in the summer. Based on the weather recorded, the average maximum temperature is between 37 and 39 ∘C, and the minimum temperature is around 19 ∘C. The highest temperature was 49 ∘C and the lowest was 12 ∘C. The maximum average evaporation value is between 450 and 550 mm in summer, while in winter it is around 200 mm (Subyani and Bayumi, 2003).
2.3 Sample sites
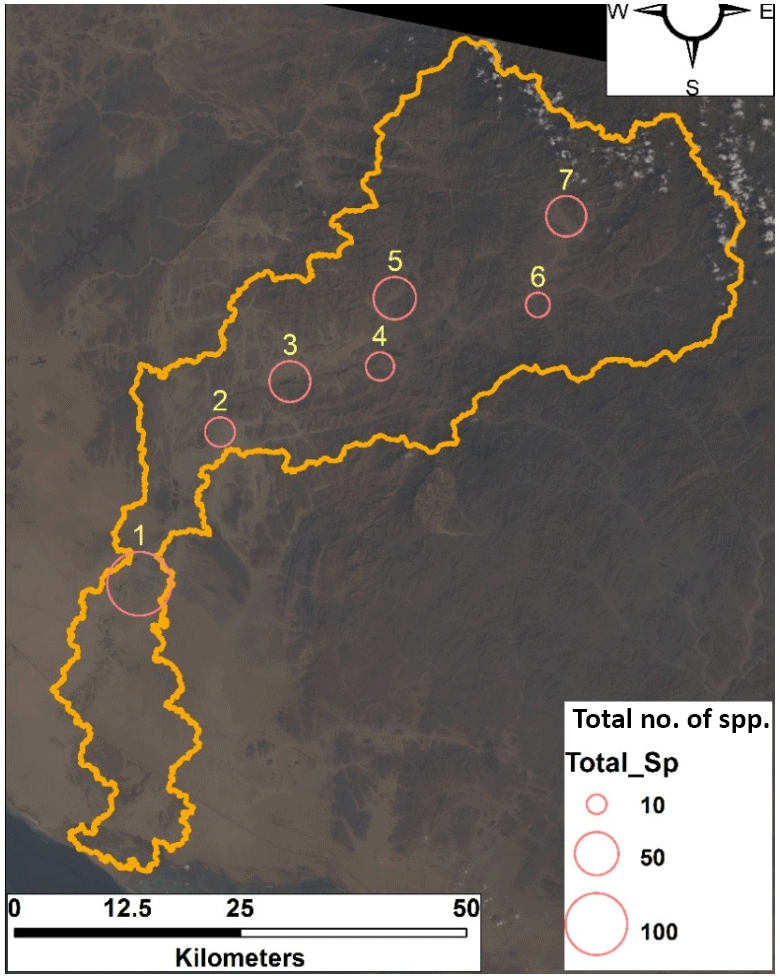
Samples were chosen along Wadi Yalamlam areas such as (Fig. 2)
-
upstream and midstream,
-
downstream parts,
-
and different wadi streams.
The study area was visited from the beginning of March 2015 to the end of February 2016. Seven stands were randomly chosen in every area for the current investigation during different growing seasons. The random selection of stands was carried out according to de Vries (1986) with the stratified random sampling technique.
Locations and samples were selected as an example of a large range of physiographic and environmental variability in every branch.
Sample plots were randomly selected using the relevé process in every site described by Mueller-Dombois and Ellenberg (1974).
The plots were 10×10 m and samples were taken through the spring season when taxa were expected to be growing and flowering. The vegetation sampling included recording all plant taxa in the plots.
The plant cover of each taxon was estimated using the Zurich–Montpellier technique (Braun-Blanquet et al., 1965). The collected sample specimens were recognized according to Collenette (1999), Cope (1985), Rahman et al. (2004), and Chaudhary (1999, 2000).
2.4 Realization of species richness equations
Various indices have been developed for examining species richness in a region based on estimations of the relative abundance of the species derived from samples (Heip et al., 1998). Among these indices are the Shannon–Wiener information function (Lloyd et al., 1968), the Simpson's dominance index (Hunter and Gaston, 1988), the Margalef species richness index (Meurant, 2012), and the Pielou evenness index (Pielou, 1966). The first two were used in the current study due to the linkage between a common family of diversity indices and nonadditive statistical mechanics (Keylock, 2005).
2.4.1 The Shannon index
The main principle of this index is that the diversity of a community is the amount of data in a code. It is calculated as follows.
In this formula, S is the total number of species, N is the total number of individuals, and ni is the number of individuals of the ith species. is equivalent to pi, the probability of finding the ith species.
2.4.2 Simpson's index
Simpson's approach for assessing species diversity evaluates the dominance of a species relative to the number of species in a sample or population (Hunter and Gaston, 1988). It is calculated as follows.
D is the Simpson diversity index, ni is the number of individuals belonging to i species, and N is the total number of individuals.
2.5 Density analysis
Predictive vegetation modeling is one of the commonly used methods. It is described as “predicting the distribution of vegetation across a landscape based on the relationship between the spatial distribution of vegetation and certain environmental variables” (Franklin, 1995; Guisan and Zimmermann, 2000). Concepts of spatial variations are obtained according to the following equations.
where n(k) is the number of pairs of observation, and Z(xi) is the feature property measured in point x and in point x+k.
where Z⋅(x0) is the interpolated value of variable Z at location, x0, Z(xi) represents the values measured at location xi, and λi is the weighed coefficient calculated based on the semivariogram when
Consequently, it is possible to obtain non-biased interpolated values; that is, the expected value and the estimated variance minimum (Elhag and Bahrawi, 2016).
The relationship between environment and vegetation could be associated with the observed connection or the hypothetical or investigational physiological limitations of diverse plant taxa. This relationship has been calculated using statistical methods. These statistical methods have gradually become more flexible to show what is known as a non-Gaussian species response curve (Heath and Smith, 1989).
2.6 NDVI change detection
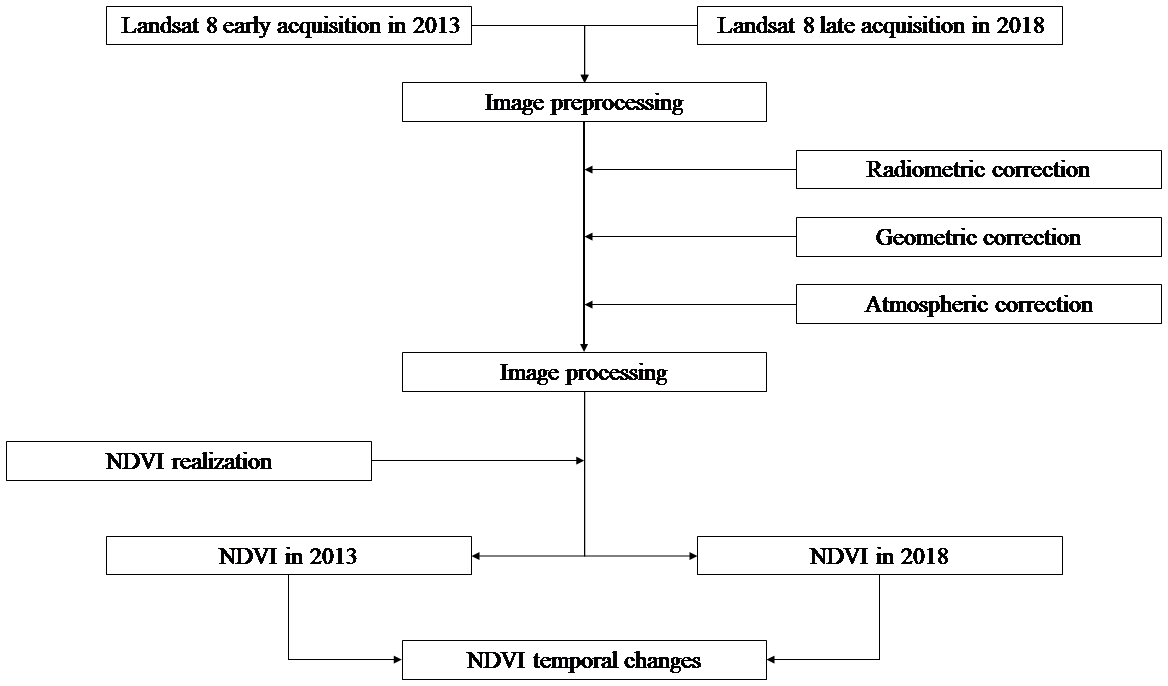
The multispectral remote sensing data image was obtained from the United States Geological Survey (USGS). Landsat 8 images consist of nine spectral bands ranging from visible to thermal infrared with a spatial resolution of 30 m for bands from 1 to 7 and then 9. The resolution for the panchromatic band 8 is 15 m. Spectral bands are selectable across the range 435 to 1251 nm. The temporal datasets were acquired in April 2013 as an early date of acquisition and in April 2017 as a late date of acquisition (Path, 169; Row, 46).
Temporal datasets were preprocessed to maximize all possible reasons for data correction. Radiometric, geometric, and atmospheric corrections were made according to Vogelmann et al. (2001) and Elhag and Bahrawi (2017).
There are quite a few indices for defining vegetation behavior zones on a remote sensing imagery, one of which is the NDVI (Bhandari et al., 2012). It is a crucial and commonly used vegetation index. In addition, it is widely applied to research works related to climatic and global environmental changes (Bhandari et al., 2012). NDVI can be estimated as a ratio variance between measured canopy reflectance in the red and near-infrared bands, respectively (Elhag and Bahrawi, 2017). A schematic flowchart of the adopted methodology is illustrated in Fig. 3.
According to Jensen and Binford (2004), NDVI can be calculated as follows:
where the NIR band is 750–1300 nm and the red band is 600–700 nm.
3.1 Floristic analysis and plant diversity of the study area
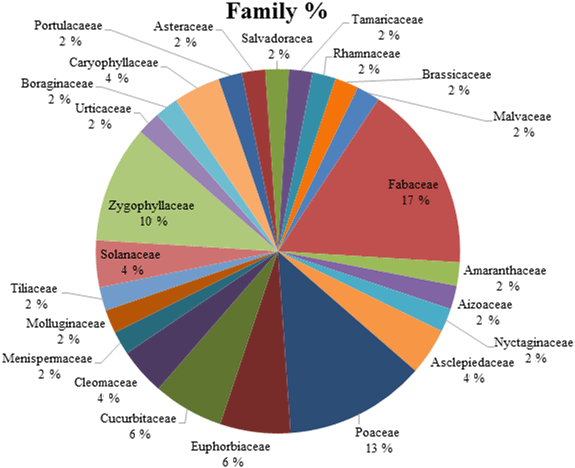
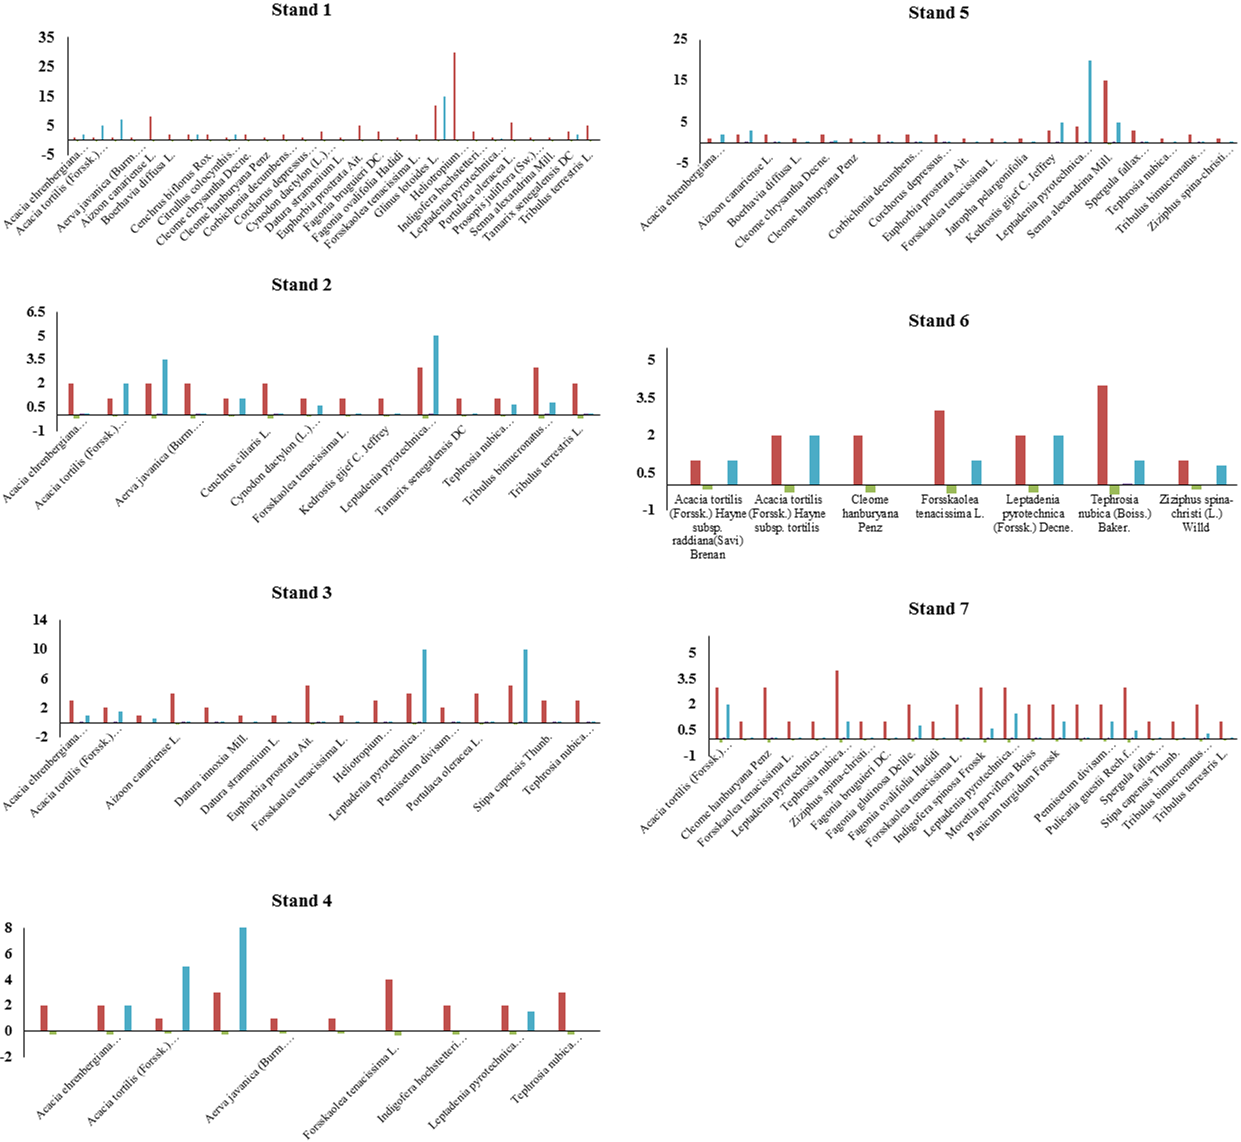
Vegetation in the seven stands was represented by 48 species belonging to 24 families. The families Fabaceae and Poaceae were the richest (17 %), (13 %) followed by Zygophyllaceae (10 %), Cucurbitaceae (10 %) and Euphorbiaceae (6 %), Asclepiadaceae, Molluginaceae, Cleomaceae, Solanaceae, and Caryophyllaceae (4 %), and 14 families were represented by only (2 %) of the vegetation of the wadi (Figs. 4 and 5).
Many studies and comparisons of families involving a large number of species have been conducted for various regions of Saudi Arabia such as the Asir Mountains in Hosni and Hegazy (1996), Mosallam (2007) in the Taif area, Alatar et al. (2012) in the Al-Jufair Wadi, and Al-Turki and Al-Olayan (2003) in the Hail region. Similar studies have also been recorded outside the kingdom like in Egypt (El-Ghani and Abdel-Khalik, 2006; El-Ghani and El-Sawaf, 2004) and Jebel Marra in Sudan (Al-Sherif et al., 2013). The most famous plant species in Saudi Arabia belong to the families Fabaceae and Asteraceae (Migahid, 1978; Chaudhary, 1999; Rahman et al., 2004). Poaceae is the largest family listed by some researchers, but there are also other large families in the flora of Saudi Arabia (Collenette, 1999; AlNafie, 2008).
Stand 1 was the most diverse with about 28 different taxa, followed by stand 7 with about 22 different taxa because it is surrounded by and near the water dam. Stand 6 was the least diverse with seven taxa only.
3.2 Plant growth forms of the study area
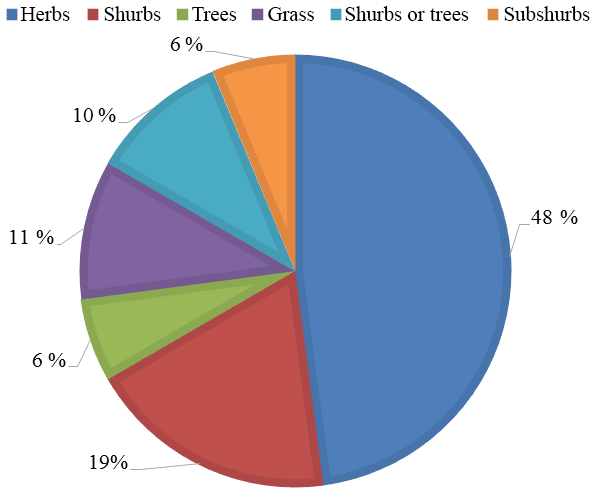
It was observed that herbs dominated the vegetation of the study area (48 %), followed by shrubs (19%), grass (11 %) shrubs to trees (10 %), and subshrubs (6 %) (Fig. 6). The higher number of species belonged to herbs, followed by grasses, shrubs, and trees. These observations of many differences in vegetation cover composition and structure can be attributed to inundation, competition, and the environmental factors that might affect vegetation communities on the wadi (Lenssen et al., 1999; Zhang et al., 2005). The difference in density, frequency, and abundance between taxa might be attributed to variation in the habitat (Nardi et al., 2016).
3.3 Plant life-forms in the study area
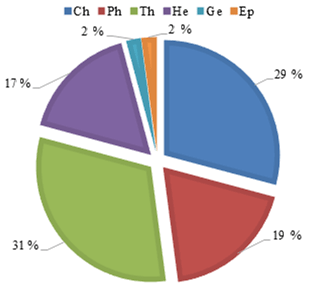
The life-form range of the study area showed a predominance of therophytes and chamaephytes, which constituted 31 % and 29 % of the total flora, respectively, followed by phanerophytes 19 %, while hemicryptophytes are 17 %. Then both geophytes and epiphytes represent 2 % of the total flora as shown in Fig. 7. The life-form spectrum in the study area is distinguished by an arid desert region with a dominance of therophytes. This result supports the theory of Cain (1950) and Deschenes (1969), which states that “dry climate, overgrazing, and trampling which is so prevalent on grasslands, tend to increase the percentage of therophytes through the introduction and spread of weedy grasses and forbs of this life-form”. Furthermore, the high percentage of therophytes could be also reflecting human activities as claimed by Barbero et al. (1990). Therophytes (annuals and biennials) are not unexpectedly recorded for 60 % of the overall taxa of the region. They generally bloom and form well-developed growth in the wadis and at the base of steady dunes, where water gathers after rain. Moreover, it is essential to specify that the dominance of both Fabaceae and therophytes in local flora can be an indicator of the relative index of disturbance for Mediterranean ecosystems (El-Ghani and Abdel-Khalik, 2006). These results are in agreement with the life-form scales among desert habitats in further parts of Saudi Arabia (El-Demerdash et al., 1994; Collenette, 1999; Chaudhary, 2000; Al-Turki and Al-Olayan, 2003; El-Ghanim et al., 2010; Alatar et al., 2012; Daur, 2012).

3.4 Species richness in the study area
The values of the Shannon index in the study area are as follows: 1.8 (stand 6), 2.20 (stand 4), up to 2.69 (stand 1), 2.64 (stand 3), and 2.98 (stand 7) (Fig. 8). Shannon index examination demonstrates a high species diversity. Typically, the Shannon index in real ecosystems ranges between 1.5 and 3.5 (MacDonald and MacDonald, 2003). The value rarely surpasses 4 (Margalef, 1972).
The value of the Simpson's index ranges from 0 to 1. With this index, 0 represents infinite diversity and 1 represents no diversity. That is, the bigger the value the lower the diversity (Hunter and Gaston, 1988). Simpson's results in the study area showed that the values of the index are 0.88 (stands 1, 5, and 6), 0.92 (stand 4), 0.94 (stand 3), 0.95 (stand 2), and 0.96 (stand 7) (Fig. 9). This means that stands 1, 5, and 6 have the highest biodiversity, while the lowest is stand 7.
3.5 Plant density mapping of the study area
The main life-forms are chamaephytes, phanerophytes, therophytes, hemicryptophytes, geophytes, and epiphytes.
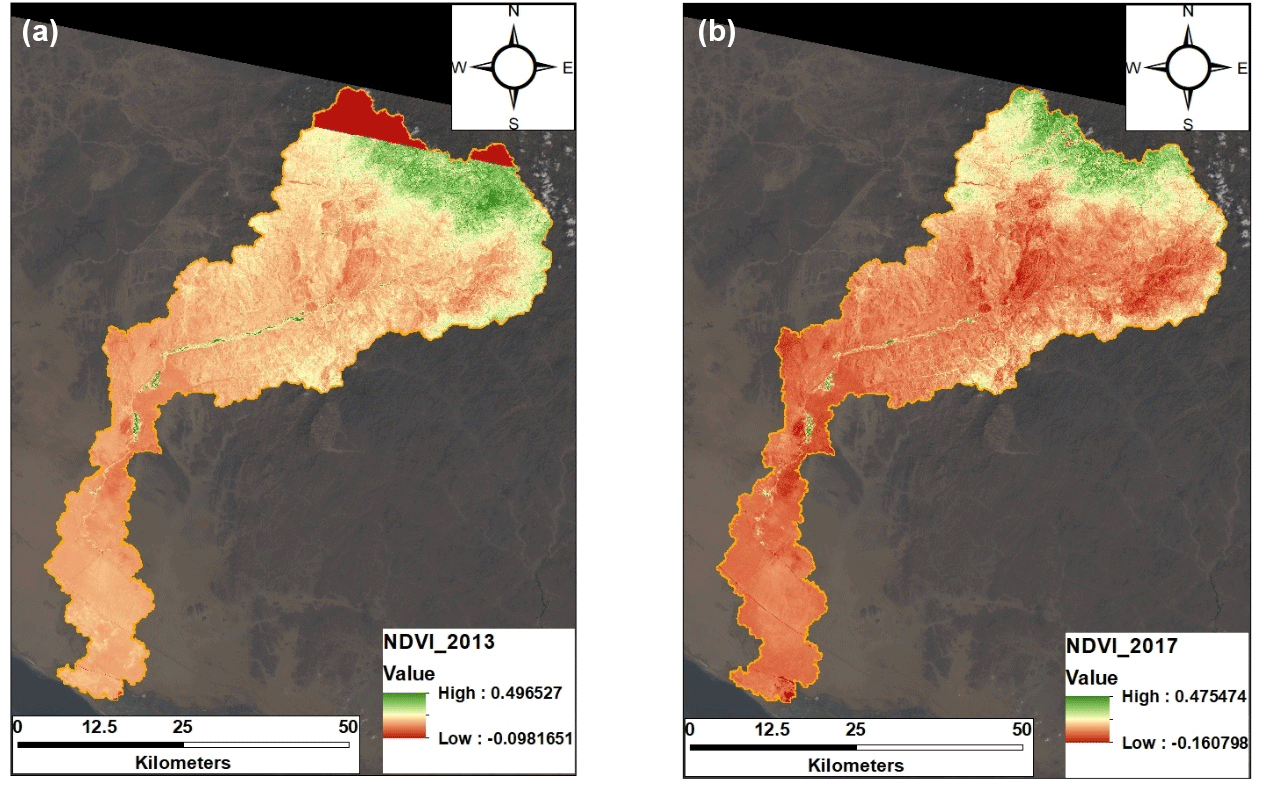
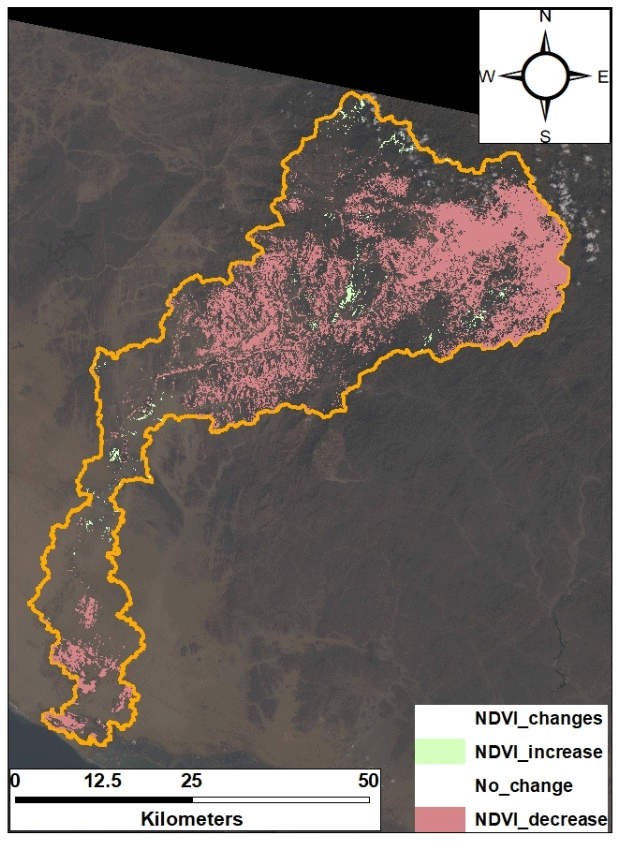
The normalized difference vegetation index was used to evaluate the status of Wadi Yalamlam vegetation cover compared to data obtained 4 years ago (Fig. 10a, b). NDVI thematic change detection showed a decrease in vegetation cover (Fig. 11). Upper-stream areas of Wadi Yalamlam were the most fragile parts of the wadi basin due to anthropogenic activities (Bahrawi et al., 2016). The midstream section of Wadi Yalamlam showed no significant difference in vegetation cover. Such stability in vegetation cover is explained by the water availability in the midstream section due to its morphometric features (Elhag et al., 2017). The vegetation cover of the lower section of the Wadi Yalamlam basin was not abundant in either temporal dataset. The lower section has mainly alluvial deposits occurring frequently due to soil erosion (Elhag, 2016b; Bahrawi et al., 2016).
The current research focuses on species richness and species diversity in the designated study area due to its local importance as a major torrent of the holy Makkah region. The conducted field surveys in addition to the Shannon index examination demonstrate a high species diversity in different plant growth forms across the designated wadi system. Moreover, the spatial configuration of the vegetation cover in Wadi Yalamlam shows significant variation in terms of the normalized difference vegetation and species richness indices. The temporal analysis of the normalized difference vegetation index shows low values at the upper-stream section of the wadi, which requires immediate regulation to stop losing the species diversity. Consequently, restoration and rehabilitation schemes should be adopted in the upper-stream section of the wadi. Meanwhile, sediment transport should be regulated in the lower-stream section to allow the natural vegetation to succeed at the lower-stream section. As a recommendation, more investigations should be carried out to identify threatened plant species and to implement effective monitoring plans.
Data are freely access from the United States Geological Survey (USGS) website at https://earthexplorer.usgs.gov/ (last access: 23 October 2018).
ME (King Abdulaziz University) and AA (King Abdulaziz University) were responsible for the data analysis and wrote most of the paper. AH (Cairo University) proposed the project idea and participated in all the fieldwork, data analysis, and writing of the paper. HG (Assiut University) participated in the data analysis. NM (King Abdulaziz University) performed the data interpretation.
The authors declare that they have no conflict of interest.
This project was funded by the Deanship of Scientific Research (DSR), King
Abdulaziz University, Jeddah, under grant no. G-235-247-38. The authors
therefore acknowledge and thank DSR for technical and financial
support.
Edited by: Nicola Masini
Reviewed by: Silvena Boteva and three anonymous referees
Abulfatih, H.: Vegetation zonation along an altitudinal gradient between sea level and 3000 meters in southwestern Saudi Arabia, Journal of King Saud University – Science, 4, 57–97, 1992.
Abuzinada, A. H., Al-Wetaid, Y., and Al-Basyouni, S. Z. M.: The National Strategy for Conservation of Biodiversity in the Kingdom of Saudi Arabia, The National Commission for Wildlife Conservation and Development, Conservation of Biological Diversity, Riyadh, Saudi Arabia, 2005.
Alatar, A., El-Sheikh, M. A., and Thomas, J.: Vegetation analysis of Wadi Al-Jufair, a hyper-arid region in Najd, Saudi Arabia, Saudi J. Biol. Sci., 19, 357–368, 2012.
Alfarhan, A.: A phytogeographical analysis of the floristic elements in Saudi Arabia, Pakistan Journal of Biological Sciences (Pakistan), 2, 702–711, 1999.
Alfarhan, A.: A floristic account on Raudhat Khuraim Central Province Saudi Arabia, Saudi J. Biol. Sci., 8, 80–103, 2001.
Alfarhan, A. H., Al-Turki, T. A., and Basahy, A. Y.: Flora of Jizan Region, King Abdulaziz City for Science and Technology, Final Report 1, 545 pp., 2005.
AlNafie, A. H.: Phytogeography of Saudi Arabia, Saudi J. Biol. Sci., 15, 159–176, 2008.
Al-Sherif, E. A., Ayesh, A. M., and Rawi, S. M.: Floristic composition, life form and chorology of plant life at Khulais region, Western Saudi Arabia, Pak. J. Bot, 45, 29–38, 2013.
Al-Turki, T. and Al-Olayan, H.: Contribution to the flora of Saudi Arabia: Hail region, Saudi J. Biol. Sci., 10, 190–222, 2003.
Al-Yemeni, M.: Ecology of some plant communities in Wadi Al-Ammaria, Riyadh, Saudi Arabia, Saudi J. Biol. Sci., 8, 145–165, 2001.
Bahrawi, J. A., Elhag, M., Aldhebiani, A. Y., Galal, H. K., Hegazy, A. K., and Alghailani, E.: Soil erosion estimation using remote sensing techniques in wadi yalamlam basin, Saudi Arabia, Adv. Mater. Sci. Eng., 2016, 9585962, https://doi.org/10.1155/2016/9585962, 2016.
Barbero, M., Bonin, G., Loisel, R., and Quézel, P.: Changes and disturbances of forest ecosystems caused by human activities in the western part of the Mediterranean basin, Vegetatio, 87, 151–173, 1990.
Bhandari, A., Kumar, A., and Singh, G.: Feature extraction using Normalized Difference Vegetation Index (NDVI): a case study of Jabalpur city, Proc. Tech., 6, 612–621, 2012.
Braun-Blanquet, J., Fuller, G. D., Conard, H. S., and Blanquet, J. B.: Plant Sociology: The Study of Plant Communities, Authorized English Translation of Pflanzensoziologie by: Braun-Blanquet, J., Translated, Revised and Edited by: Fuller, G. D. and Conard, H. S., McGraw-Hill Book Co., Inc., New York, USA, 1965.
Cain, S. A.: Life-forms and phytoclimate, Bot. Rev., 16, 1–32, 1950.
Chaudhary, S.: Flora of the Kingdom of Saudi Arabia Illustrated, National herbarium ministry of agriculture and water Kingdom of Saudi Arabia, Riyadh, Saudi Arabia, 1, 1–691, 1999.
Chaudhary, S.: Flora of the Kingdom of Saudi Arabia Illustrated, National herbarium ministry of agriculture and water Kingdom of Saudi Arabia, Riyadh, Saudi Arabia, 2, 1–432, 2000.
Collenette, I. S.: Wildflowers of Saudi Arabia, National Commission for Wildlife Conservation and Development, Riyadh, xxxii, 799 pp.-col. illus., 1999.
Cope, T. A.: A Key to the Grasses of the Arabian Peninsula (Studies in the Flora of Arabia XV), Arab Gulf J. Sci. Res., 15, 82 pp., 1985.
Daur, I.: Plant flora in the rangeland of western Saudi Arabia, Pak. J. Bot., 44, 23–26, 2012.
de Vries, P. G.: Stratified random sampling, in: Sampling Theory for Forest Inventory, Springer, Verlag Berlin Heidelberg, Germany, 31–55, 1986.
Deschenes, J.: Life form spectra of contrasting slopes of the grazed pastures of Northern New Jersey, Nat. Can., 96, 965–978, 1969.
El-Demerdash, M., Hegazy, A., and Zilay, A.: Distribution of the plant communities in Tihamah coastal plains of Jazan region, Saudi Arabia, Plant Ecol., 112, 141–151, 1994.
El-Ghanem, W. M.: Ecological study at Wadi Al-Ammaria in El-Riyadh City–Saudi Arabia, Bulletin of Pure & Applied Sciences-Botany, 25, 11–11, 2006.
El-Ghani, M. M. A. and Abdel-Khalik, K. N.: Floristic Diversity and Phytogeography of the Gebel Elba National Park, South-East Egypt, Turk. J. Bot., 30, 121–136, 2006.
El-Ghani, M. M. A. and El-Sawaf, N.: Diversity and distribution of plant species in agro-ecosystems of Egypt, Systematics and Geography of Plants, 319–336, 2004.
El-Ghanim, W. M., Hassan, L. M., Galal, T. M., and Badr, A.: Floristic composition and vegetation analysis in Hail region north of central Saudi Arabia, Saudi J. Biol. Sci., 17, 119–128, 2010.
Elhag, M.: Evaluation of Different Soil Salinity Mapping Using Remote Sensing Techniques in Arid Ecosystems, Saudi Arabia, J. Sensors, 2016, 7596175, https://doi.org/10.1155/2016/7596175, 2016a.
Elhag, M.: Detection of Temporal Changes of Eastern Coast of Saudi Arabia for Better Natural Resources Management, Indian J. Geo-Mar. Sci., 45, 29–37, 2016b.
Elhag, M. and Bahrawi, J. A.: Consideration of geo-statistical analysis in soil pollution assessment caused by leachate breakout in the municipality of Thermi, Greece, Desalin Water Treat., 57, 27879–27889, https://doi.org/10.1080/19443994.2016.1168583, 2016.
Elhag, M. and Bahrawi, J. A.: Soil salinity mapping and hydrological drought indices assessment in arid environments based on remote sensing techniques, Geosci. Instrum. Method. Data Syst., 6, 149–158, https://doi.org/10.5194/gi-6-149-2017, 2017.
Elhag, M., Galal, H. K., and Alsubaie, H.: Understanding of morphometric features for adequate water resource management in arid environments, Geosci. Instrum. Method. Data Syst., 6, 293–300, https://doi.org/10.5194/gi-6-293-2017, 2017.
El-Kady, H., Ayyad, M., and Bornkamm, R.: Vegetation and recent land-use history in the desert of Maktala, Egypt, edited by: Blume, H.-P. and Berkowicz, S., Catena Verlag Cremlingen-Destedt, 109–123, 1995.
Forbis, T. A., Provencher, L., Frid, L., and Medlyn, G.: Great Basin land management planning using ecological modeling, Environ. Manage., 38, 62–83, 2006.
Franklin, J.: Predictive vegetation mapping: geographic modelling of biospatial patterns in relation to environmental gradients, Prog. Phys. Geog., 19, 474–499, 1995.
Ghazanfar, S. A.: Saline and alkaline vegetation of NE Africa and the Arabian peninsula: An overview, in: Biosaline Agriculture and Salinity Tolerance in Plants, Springer, Berlin GmbH, Germany, 101–108, 2006.
Guisan, A. and Zimmermann, N. E.: Predictive habitat distribution models in ecology, Ecol. Model., 135, 147–186, 2000.
Heath, J. K. and Smith, A. G.: Growth factors in embryogenesis, Brit. Med. Bull., 45, 319–336, 1989.
Hegazy, A., Lovett-Doust, J., Hammouda, O., and Gomaa, N.: Vegetation distribution along the altitudinal gradient in the northwestern Red Sea region, Community Ecol., 8, 151–162, 2007.
Heip, C. H., Herman, P. M., and Soetaert, K.: Indices of diversity and evenness, Oceanis, 24, 61–88, 1998.
Hosni, H. A. and Hegazy, A. K.: Contribution to the flora of Asir, Saudi Arabia, Candollea, 51, 169–202, 1996.
Hunter, P. R. and Gaston, M. A.: Numerical index of the discriminatory ability of typing systems: an application of Simpson's index of diversity, J. Clin. Microbiol., 26, 2465–2466, 1988.
Jensen, R. and Binford, M.: Measurement and comparison of Leaf Area Index estimators derived from satellite remote sensing techniques, Int. J. Remote Sens., 25, 4251–4265, 2004.
Keylock, C.: Simpson diversity and the Shannon–Wiener index as special cases of a generalized entropy, Oikos, 109, 203–207, 2005.
Khalik, K. A., El-Sheikh, M., and El-Aidarous, A.: Floristic diversity and vegetation analysis of wadi Al-Noman, Mecca, Saudi Arabia, Turk. J. Bot., 37, 894–907, 2013.
Lambin, E. F.: Modelling deforestation processes: a review tropical ecosystem environment observations by satellites, TREES Series B: Research report, European Commission Luxembourg, 1994.
Lenssen, J., Menting, F., van der Putten, W., and Blom, K.: Control of plant species richness and zonation of functional groups along a freshwater flooding gradient, Oikos, 86, 523–534, 1999.
Lloyd, M., Zar, J. H., and Karr, J. R.: On the calculation of information-theoretical measures of diversity, Am. Midl. Nat., 79, 257–272, 1968.
MacDonald, G. M. and MacDonald, G. M.: Biogeography: space, time and life, Sirsi, New York, USA, 2003.
Margalef, R.: Homage to Evelyn Hutchinson, or why there is an upper limit to diversity, Transactions of the Connecticut Academy of Arts and Sciences, 44, 211–235, 1972.
Masrahi, Y., Al-Huqail, A., Al-Turki, T., and Thomas, J.: Odyssea mucronata, Sesbania sericea, and Sesamum alatum–new discoveries for the flora of Saudi Arabia, Turk. J. Bot., 36, 39–48, 2012.
Meurant, G.: An Introduction to Numerical Classification, Elsevier, New York, USA, 2012.
Migahid, A. M.: Flora of Saudi Arabia, Riyadh University, Riyadh, Saudi Arabia, 1978.
Mosallam, H.: Comparative study on the vegetation of protected and non-protected areas, Sudera, Taif, Saudi Arabia, Int. J. Agric. Biol., 9, 202–214, 2007.
Mueller-Dombois, D. and Ellenberg, H.: Aims and methods of vegetation ecology, John Wiley & Sons, Ney York, USA, 1974.
Nardi, P., Di Matteo, G., Palahi, M., and Scarascia Mugnozza, G.: Structure and Evolution of Mediterranean Forest Research: A Science Mapping Approach, PLoS One, 11, e0155016, https://doi.org/10.1371/journal.pone.0155016, 2016.
Pielou, E. C.: The measurement of diversity in different types of biological collections, J. Theor. Biol., 13, 131–144, 1966.
Rahman, M. A., Mossa, J. S., Al-Said, M. S., and Al-Yahya, M. A.: Medicinal plant diversity in the flora of Saudi Arabia 1: a report on seven plant families, Fitoterapia, 75, 149–161, 2004.
Rindfuss, R. R. and Stern, P. C.: Linking remote sensing and social science: The need and the challenges, chapter 1, in: People and pixels: Linking remote sensing and social science, The National Academies Press, Washington, DC, 1–27, 1998.
Schulz, E. and Whitney, J.: Vegetation in north-central Saudi Arabia, J. Arid Environ., 10, 175–186, 1986.
Şen, Z., Al-Harithy, S., As-Sefry, S., and Almazroui, M.: Aridity and risk calculations in saudi arabian wadis: Wadi Fatimah case, Earth Systems and Environment, 1, 26, https://doi.org/10.1007/s41748-017-0030-x, 2017.
Shaltout, K. and Mady, M.: Analysis of raudhas vegetation in central Saudi Arabia, J. Arid Environ., 34, 441–454, 1996.
Shaltout, K., El-Halawany, E., and El-Garawany, M.: Coastal lowland vegetation of eastern Saudi Arabia, Biodivers. Conserv., 6, 1027–1040, 1997.
Sharaf El Din, A., El Kady, H., Shaltout, K., and Madi, M.: Nutritive value of the raudhas plants in central Saudi Arabia, Arab Gulf J. Sci. Res., 16, 537–553, 1999.
Subyani, N. and Bayumi, N.: Evaluation of groundwater resources in Wadi Yalamlam basin, Makkah area, The second annual meeting for scientific research, Jeddah, Saudi Arabia, 30–31 March 2003, 307–314, 2003.
Taia, W. and El-Ghanem, W.: City vegetation analysis of three habitats at El-Riyadh, Bulletin of Pure and Applied Sciences B, 20, 53–65, 2001.
Thomas, J., Alfarhan, A., Ali, A., Miller, A., and Othman, L.: An account on the eastern limits of Afro-Arabian plants in South Asia, Basic and Applied Dryland Research, 2, 12–22, 2008.
Van Leeuwen, W. J.: Monitoring the Effects of Forest Restoration Treatments on Post-Fire Vegetation Recovery with MODIS Multitemporal Data, Sensors, 8, 2017–2042, https://doi.org/10.3390/s8032017, 2008.
Vogelmann, J. E., Helder, D., Morfitt, R., Choate, M. J., Merchant, J. W., and Bulley, H.: Effects of Landsat 5 Thematic Mapper and Landsat 7 Enhanced Thematic Mapper Plus radiometric and geometric calibrations and corrections on landscape characterization, Remote Sens. Environ., 78, 55–70, 2001.
Zhang, Y., Chen, Y., and Pan, B.: Distribution and floristics of desert plant communities in the lower reaches of Tarim River, southern Xinjiang, People's Republic of China, J. Arid Environ., 63, 772–784, 2005.