the Creative Commons Attribution 4.0 License.
the Creative Commons Attribution 4.0 License.
On the validation of K-index values at Italian geomagnetic observatories
Paolo Bagiacchi
Domenico Di Mauro
Stefania Lepidi
Lili Cafarella
The local K index and the consequent global Kp index are well-established 3 h range indices used to characterize geomagnetic activity. The K index is one of the parameters that INTERMAGNET observatories can provide, and it has been widely used for several decades, although many other activity indices have been proposed in the meanwhile. The method for determining the K values has to be the same for all observatories. The INTERMAGNET consortium recommends the use of one of the four methods endorsed by the International Service of Geomagnetic Indices (ISGI) in close cooperation and agreement with the ad hoc working group of the International Association of Geomagnetism and Aeronomy (IAGA). INTERMAGNET provides the software code KASM, designed for an automatic calculation of the K index according to the adaptive smoothed method. K values should be independent of the local dynamic response, and therefore for their determination each observatory has its own specific scale regulated by the L9 lower limit, which represents the main input parameter for KASM. The determination of an appropriate L9 value for any geomagnetic observatory is then fundamental. In this work we statistically analyze the K values estimated by means of KASM code for the Italian geomagnetic observatories of Duronia (corrected geomagnetic latitude λ∼36∘ N) and Lampedusa (λ∼28∘ N) by comparing them with the German observatories of Wingst and Niemegk. Our comparative analysis is finalized to establish the best estimation of the L9 lower limit for these two stations. A comparison of L9 lower limits found for the Italian observatories with results from a previous empirical method was also applied and used to verify the consistency and reliability of our outcomes.
- Article
(2453 KB) - Full-text XML
- BibTeX
- EndNote
In their pioneering work, Bartels et al. (1939) introduced the 3 h range K index with the purpose of quantifying the solar wind (or particle) effects on the geomagnetic field. The K index is represented with an integer in the range 0–9 (“K” is from the German word Kennziffer, meaning “characteristic digit”), with 0 and 1 being an indication of quiet conditions and 5 or more referring to an increased level of magnetic activity, generally related to a geomagnetic storm. It is derived for a specific observatory from the maximum fluctuations of horizontal components observed on a magnetogram during a 3 h interval, evaluated as the difference between the maximum positive and negative deviations with respect to a reference curve, which essentially reflects the local diurnal variation at the observatory. These maximum deviations may occur at any time during the 3 h period. The proposed K index was originally calculated for the Niemegk observatory.
As a natural consequence of the K index, the planetary geomagnetic activity index Kp was proposed by Bartels (1949). It is derived from the standardized K index (Ks) of 13 magnetic observatories at midlatitude, and it is representative of the large spatial scale of the solar wind–magnetosphere coupling energy. Therefore, the K index is the fundamental parameter for Kp estimation; Kp, as any other index, has limitations and drawbacks. However, it is precious since it is a historical parameter and long data series are available. It is widely used, for example, in space weather applications to identify the quietest days (Johnston, 1943), which are used in International Geomagnetic Reference Field (IGRF) modeling and to verify solar-wind-driven modulation in the atmospheric parameters during disturbed conditions (Regi et al., 2017).
The main difficulty in K-index evaluation is to assign a proper quasi-logarithmic scale to the geomagnetic fluctuations amplitude (A) that satisfy the principle of the assimilation of frequency distributions (AFDs): the frequency distributions (or occurrences) of K-index values at different sites are, in principle, the same (Bartels et al., 1939). In other words, A values vary from observatory to observatory in such a way that the historical rate of occurrence of certain levels of K is about the same at all observatories (Bartels–Mayaud rules). This implies that, for a given K value, AK increases with increasing latitude, and the fundamental quantity for the K-index calculation is represented by the minimum amplitude L9 corresponding to K =9, from which the other AK values are also derived.
For Kp determination (Bartels et al., 1939), from higher to lower latitude, at Sitka (AACGM latitude λ∼60∘ N, Alaska) L9 = 1000 nT, while at Canberra (AACGM latitude λ∼45∘ S, Australia) L9 = 500 nT. The GFZ website (https://www.gfz-potsdam.de/en/kp-index/, last access: 30 September 2019) provides the 13 L9 values used for the Kp evaluation, showing values between 450 and 1500 nT; in particular, at Niemegk (AACGM latitude λ∼48∘ N, Germany) L9 = 500 nT. In the present paper all the altitude-adjusted corrected geomagnetic (AACGM) coordinates are computed by using the Shepherd (2014) algorithm, applied to the year 2017.
The original determination of K indices (Bartels et al., 1939) required hand-scaling analogic magnetograms. For many years, the K index was in fact manually scaled by visual determination and removal of the regular daily variation; the remaining largest amplitude of geomagnetic disturbances in the two horizontal components during each 3 h UT interval was used to determine the K-index values from a conversion table between classes of ranges (in units of nanotesla – nT) and K indices.
The question of the derivation of geomagnetic indices from digital data arose at the end of the 1970s. Different algorithms enabling the computer derivation of K indices were then developed and carefully assessed in the framework of an international comparison organized by the International Association of Geomagnetism and Aeronomy (IAGA) Working Group “Geomagnetic indices” (Coles and Menvielle, 1991; Menvielle, 1991; Menvielle et al., 1995).
This implies the production of computer plots of digital data with scale values similar to those of photographic magnetograms (Menvielle et al., 1995). The International Association of Geomagnetism and Aeronomy (IAGA; http://www.iaga-aiga.org/, last access: 30 September 2019) promotes tools or methods able to make it easier to keep track of files and analyses done on computers.
Different methods were proposed and carefully compared and assessed in international meetings organized by the IAGA Working Group “Geomagnetic indices” during the Vienna IUGG General Assembly in 1991, and four methods were acknowledged: FMI (provided by the Finnish Meteorological Institute, Finland), LRNS (Hermanus Magnetic Observatory, CISR, South Africa), KASM (Institute of Geophysics, Polish Academy of Science), and USGS (USGS, USA), whose Fortran 77 codes are available at the International Service of Geomagnetic Indices (ISGI; http://isgi.unistra.fr/softwares.php, last access: 3 February 2020).
We used one of the four methods endorsed by the IAGA, through the ISGI, for the calculation of local geomagnetic activity indices K and, in particular, the KASM method that is based on the adaptive smoothed method (Nowozyński et al., 1991). For the calculation of the K index, IAGA-formatted files are used by KASM code. It requires three daily files, the one under analysis and the files of the previous and following days on which the code estimates the regular daily variation. The code also needs as input parameters the L9 value and the yearly average of the H component relative to the year of interest.
We want to point out that there is no unique L9 at a given geomagnetic latitude since each site might be affected by different local features such as crustal anomalies (Chiappini et al., 2000) and/or coast effects (Parkinson, 1962; Regi et al., 2018). Moreover, there is the inevitable magnetic local time (MLT) dependence of magnetic disturbances, which can be smoothed out through a statistical approach, considering long-time observations. For the inclusion of a new geomagnetic observatory into the INTERMAGNET network, an L9 value can be initially assigned according to the ISGI indication, but it can be refined by comparing long-term geomagnetic field variations at the new observatory and at historical ones for which K indices are estimated by using well-defined L9 levels.
We used the geomagnetic data from two Italian geomagnetic observatories at Duronia (DUR) and Lampedusa (LMP) and evaluated the K index with the purpose of estimating the best L9 value for each observatory.
DUR observatory is operating in central Italy in the area of the village of Duronia (41∘39′ N, 14∘28′ E; 910 m a.s.l.). It was installed at the end of 2007 in the framework of the MEM (Magnetic and Electric fields Monitoring) project that aims to investigate the environmental electromagnetic signals in the ULF–VLF (ultralow frequency and extremely low frequency; 0.001 Hz–100 kHz) band. It was granted status as a geomagnetic observatory in 2012, when it was included in the INTERMAGNET network (http://www.intermagnet.org, last access: 3 February 2020), replacing the historical geomagnetic observatory at L'Aquila that was partially damaged after the local Mw 6.2 earthquake in 2009.
LMP is the southernmost observatory in European territory (35∘31′ N, 12∘32′ E); it was installed in 2005 and has been regularly working since 2007.
Up to now, the K index was evaluated only for DUR observatory, using L9 = 350 nT for both hand-scaling (since 2012) and for the KASM program (since 2017).
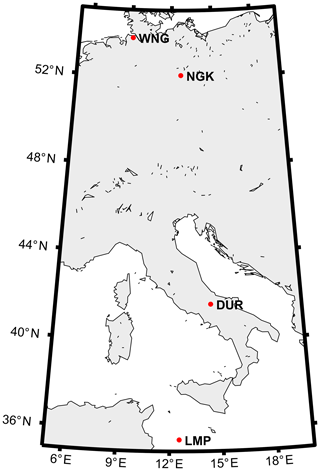
In this work we evaluated L9 through a correlation analysis performed between the K index at DUR and that provided by historical observatories. In order to take into account the magnetic local time dependency of the reference K index, European observatories were selected. As possible reference observatories we chose Wingst (WNG) and Niemegk (NGK), since they are among the 13 observatories that contribute to the Kp estimation and their local magnetic time is quite close to that of our Italian observatories.
Our investigations suggest that NGK is the best reference observatory for the Italian geomagnetic observatory of DUR, probably due to the closest magnetic local times: indeed, the amplitude of magnetic disturbances has a dependence on (magnetic) local time, which affects the K-index values (Chambodut et al., 2013). By comparing DUR with NGK we estimated a reliable DUR L9 level of 320 nT. Finally, by also comparing LMP with NGK, a reliable LMP L9 level of 310 nT is estimated.
Geomagnetic field variations at the Italian geomagnetic observatories of DUR and LMP are measured by using three-axis fluxgate magnetometers along the northward (H), eastward (D), and vertically downward (Z) directions in the geomagnetic reference frame at a 1 s sampling rate. Following the INTERMAGNET directives, geomagnetic time series are also stored as daily archives at 1 min sampling rate, according to the IAGA 2002 format.
In this work we used minute data computed from second data using an INTERMAGNET 1 s to 1 min filter, available in the time interval 1 January 2017–31 December 2018, a temporal window that falls in the lower part of the sunspot number curve for the cycle 24 (Upton and Hathaway, 2018).
These data are used for estimating K indices with the KASM algorithm that is recommended by INTERMAGNET. In this work, the definitive L9 level at DUR is empirically estimated through the following procedure:
- a.
we selected a reference observatory;
- b.
K-index time series at DUR are computed by using KASM for different L9 values (KL9) in the range 200–400 nT with a step size of 10 nT;
- c.
each KL9 index time series at DUR is compared with K-index time series at a reference observatory through correlation analysis; and
- d.
the definitive L9 level at DUR is estimated in correspondence to the maximum correlation coefficient.
As a possible reference we selected the historical observatories of NGK and WNG since they are among the 13 observatories used for Kp evaluation, and they are both in Europe at an MLT close to that of DUR and LMP (see Table 1 and Fig. 1). DUR is at the moment the principal Italian observatory and a member of the INTERMAGNET network. We then used it in this work as a reference observatory for any Italian site. By following our procedure at point (c), independently using NGK and WNG, we found that a higher correlation is reached with NGK. The same procedure from (a) to (d) is applied to the lower-latitude Italian observatory of LMP.
Table 1Geomagnetic observatories used in this study, geographic coordinates, altitude-adjusted corrected geomagnetic (AACGM) coordinates estimated by using the Shepherd (2014) algorithm at 100 km above the observatory, and magnetic local time at 00:00 UT.

We note that the K indices at NGK and WNG are both generated by using the FMI algorithm. Then, we find it useful to verify that FMI and KASM are consistent methods by comparing the K values estimated with both methods at NGK.
Finally, we compared L9 values estimated at Italian geomagnetic observatories by means of our method with those estimated using a historical method proposed by Mayaud (1980).
3.1 L9 empirical estimation
We maintain that it is important to know how K indices are distributed at the consolidated reference observatories of NGK and WNG and how they are in relation to each other.
Figure 2 shows the K index at NGK (panel a) and WNG (panel b) and the difference ΔK = KNGK − KWNG (panel c) during 2017–2018; it also shows (panel d) the K-index frequency distributions ν (or occurrences) at the two observatories. We can see that the two frequency distributions are very close, as confirmed by the distribution of ΔK (panel f), with the largest number of cases in correspondence to ΔK = 0 (4680 cases, ∼80 %), and by the absence of cases with |ΔK|>1. However, the ΔK distribution also shows a nonsymmetric distribution around zero, with a very different number of cases in correspondence to ΔK = ±1: 1103 cases (∼19 %) for ΔK = −1 and 48 cases (∼1 %) for ΔK = +1. This feature is also evidenced by the linear regression law: KNGK=αKWNG+β (panel e), where by imposing β=0 we obtain , i.e., α<1.
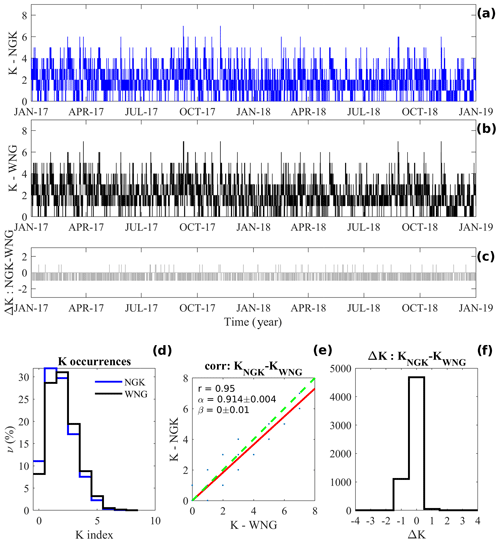
Figure 2(a, b, c) K indices at NGK (a) and WNG (b); ΔK = KNGK − KWNG (c). Occurrences of K indices at both observatories (d). Linear regression analysis of KNGK=αKWNG+β law (red line), by assuming β=0, and correlation coefficient r, together with the KNGK= KWNG condition (green line) (e). The ΔK distribution (f).
We investigated the frequency distribution ν of K at NGK in correspondence to ΔK = ±1 cases and compared these distributions with the general distribution of K at NGK (the one shown in Fig. 2d). Figure 3 shows these distributions separately for ΔK = −1 and ΔK = +1 conditions during 2017–2018 (panels a and b) and separately for the 2 years (panels c–f). In each panel, the K occurrences at NGK, regardless of ΔK, are superimposed (red lines). It can be seen that the general distributions of K and ΔK = −1 are very similar; those of K and ΔK are also quite similar, although the total number of cases is really lower. Therefore, the occurrences for ΔK ≠0 seem not to be led by particular magnetospheric activity conditions.
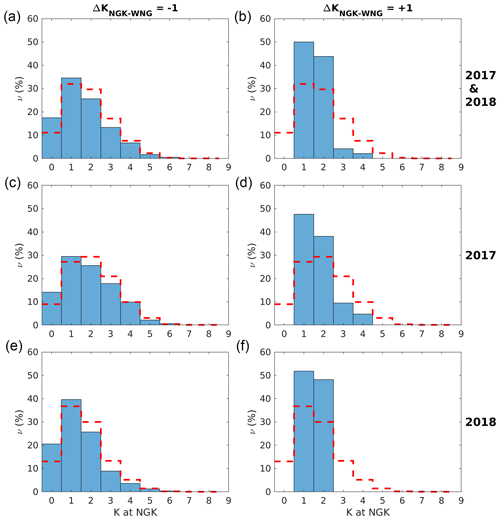
Figure 3Frequency distributions of the K index at NGK (red dashed line) superimposed on distributions of both KNGK − K (a, c, e) and KNGK − KWNG=1 (b, d, f) for the analyzed years, together (a, b) and separately for each year (c–f).
Figure 4 shows the result of the correlation analysis between K indices at the Italian observatories of DUR (panel a) and LMP (panel b) and those at NGK (red thin line) and WNG (black thin line) as functions of the L9 level used by KASM for the time interval 2017–2018. In this figure L9 levels are in the range 200–450 nT, with a step size of 10 nT. The tick lines, which show the smoothed curves computed by using a five-point triangular window, will be used hereafter as actual experimental results for our investigations. It can be seen that the correlation r is higher for the DUR–NGK observatories (r∼0.915 for L9 = 320 nT) with respect to DUR–WNG observatories (r∼0.908 for L9 = 290 nT). Regarding LMP, the correlation attains lower values with respect to DUR, with maximum values of r∼0.875 for L9 = 310 nT with NGK and r∼0.870 for L9 = 300 nT with WNG. The lower correlations between the Italian observatories and WNG could be due to the higher latitudinal separation and possibly to the geomagnetic coast effect at WNG.
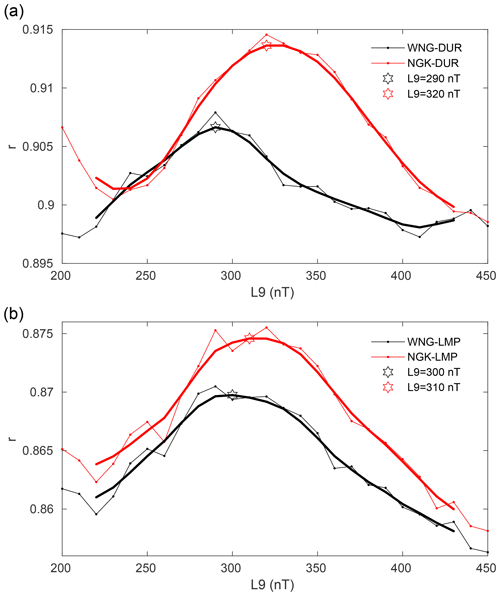
Figure 4Correlation analyses between the K index at NGK and that computed at DUR (a) and LMP (b) by KASM for different L9 values for the 2017–2018 dataset. The thick lines are obtained by smoothing the experimental (thin) lines. In each panel the maximum correlations, referring to the thick lines, are marked by stars (see the text for details).
As expected, both the L9 limit and r increase with the increasing geomagnetic latitude of the considered observatory, here represented by DUR and LMP. In addition, the higher correlations obtained by using NGK are probably due to the lower latitude (i.e., closer to the Italian observatories) and the closer MLT with respect to DUR (Table 1). Also at LMP, even if the MLT is closest to that of WNG, the higher correlation is found with NGK: this result suggests that latitudinal effects are dominant with respect to MLT ones. This can be well understood by taking into account that the MLT range of all selected observatories is within 11 min, which is far shorter than the 3 h interval used for K determination.
From these results we can assert that for the comparison with Italian observatories NGK is slightly better than WNG, and it will be used hereafter as the reference observatory for DUR and LMP. We can also assume that the best estimation of the L9 value at DUR and LMP is 320 and 310 nT, respectively, so the K indices computed by using KASM at DUR with L9 = 320 nT and at LMP with L9 = 310 nT represent the best input parameter for the K evaluation for Italian observatories.
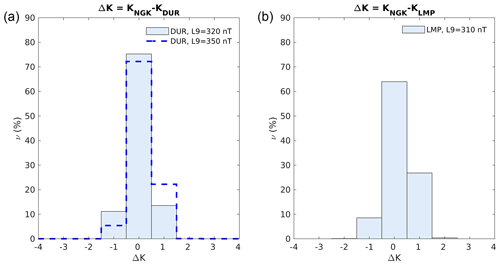
Figure 5(a) Frequency distributions of ΔK = KNGK − KDUR for L9 = 320 nT and, for comparison, the frequency distribution of ΔK = KNGK − KDUR for L9 = 350 nT. (b) ΔK = KNGK − KLMP (L9 = 310 nT).
Figure 5 shows the frequency distribution of the difference between these K-index time series and that computed at NGK. The occurrences for both DUR and LMP are distributed around zero and in the range []. For a comparison, we also show the difference distribution obtained for DUR using L9 = 350 nT (dashed blues line); we recall that this is the L9 value we used up to now. It can be seen that, while for L9 = 320 nT the distribution is almost symmetric around zero, when using L9 = 350 nT it appears more asymmetric and unbalanced towards positive values, confirming that a higher correlation between NGK and DUR is found for L9 = 320 nT. At LMP the distribution appears slightly asymmetric, and this discrepancy with respect to DUR could be attributed to the larger latitudinal and MLT difference between NGK and LMP.
Since our validation procedure aims to estimate comparable K indices at Italian observatories, we found it useful to compute ΔK between DUR and LMP, whose distribution is shown in Fig. 6. It is almost symmetric around zero, closely reflecting the distribution of ΔK computed between K indices at LMP and NGK (from Fig. 5); we can also see that |ΔK| never exceeds 1, confirming the validity of the results obtained at DUR and LMP by using KASM.
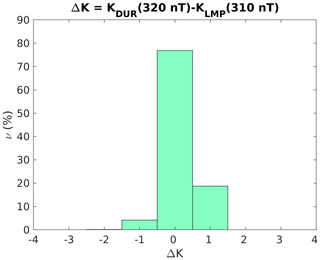
Figure 6Frequency distribution of ΔK = KDUR − KLMP , where K indices are computed by KASM using L9 = 320 and L9 = 310 nT for DUR and LMP, respectively.
It should be noted that our comparative investigation is based on K indices at the reference observatories of NGK and WNG, which are computed by using the FMI algorithm with L9 = 500 nT, while at DUR and LMP K indices are estimated by using KASM. Therefore, the question arising from our calibration method is the following: are the FMI and KASM algorithms consistent?
In order to answer to this question, we performed a correlation analysis between the K indices obtained using FMI (KFMI) and KASM (KKASM); the latter K index is obtained for different L9 levels. In this regard we used NGK 1 min data provided on the INTERMAGNET website. Since at the moment NGK geomagnetic field measurements are stored as definitive and quasi-definitive data for 2017 and 2018, respectively, we preferred to separate the analysis for the 2 years.
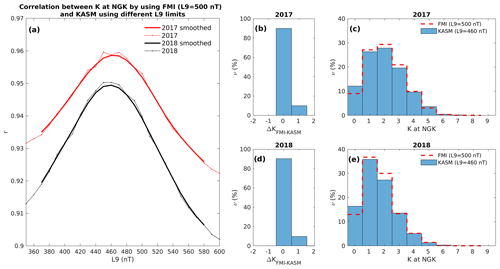
Figure 7The FMI and KASM consistency test. (a) Correlation analyses between the K index at NGK from FMI with L9 = 500 nT and that from KASM for different L9 levels for the years 2017 (definitive NGK 1 min data, red) and 2018 (quasi-definitive NGK 1 min data, black), respectively. The thick lines are obtained by smoothing the experimental (thin) lines. In each year the maximum correlations are found at L9 = 460 nT. The occurrences of ΔK = KFMI − KKASM during 2017 (b) and 2018 (d). Frequency distributions of the KKASM (460 nT) and KFMI (500 nT) indices for the years 2017 (c) and 2018 (e).
Figure 7a shows the correlation analyses between the K indices at NGK (from the FMI algorithm) and that computed by KASM using L9 in the range 350–600 nT, with a step size of 10 nT. It can be seen that the r maxima (∼0.96 and ∼0.95) are reached for L9 = 460 nT in both years. Assuming that KKASM computed for L9 = 460 nT represents the better K indices in comparison to KFMI, we examined the occurrences of ΔK = KFMI−KKASM (Fig. 7b and d). We can see that for ∼90 % of cases (and for both years) ΔK is equal to zero. Frequency distributions of the KKASM (460 nT) and KFMI (500 nT) indices for the years 2017 (panel c) and 2018 (panel e) are also shown. We point out how the distributions are close to each other, suggesting that FMI and KASM are consistent algorithms, even if they are based on different L9 limits applied for the same observatory, in agreement with Coles and Menvielle (1991), Menvielle (1991), and Menvielle et al. (1995).
3.2 Comparison with a previous L9 estimation method
As explained in the Introduction, geomagnetic indices are historically assigned through the visual inspection of magnetograms. The main difficulty for K-index evaluation is to assign a proper value for the L9 limit from which to determine the quasi-logarithmic scale for the geomagnetic fluctuations in order to satisfy the AFD principle (Bartels et al., 1939). Mayaud (1968, 1980) proposed a method for calculating the geomagnetic activity level L at a given site by comparing the amplitude of geomagnetic fluctuations at the reference observatory (A0) with that, for example, at new one (A) as follows: , where L0 represents the level of geomagnetic activity at the reference observatory, equivalent to L9, and all quantities are dependent on δ= min[λoval−λ], i.e., the minimum angular separation between the site located at geomagnetic latitude λ and the auroral region at λoval. According to Mayaud (1968, 1980), an approximate value of δ could be given by , where the latitude 69∘ in the corrected geomagnetic coordinate system defines the auroral zone.
We searched for a simple relationship that relates L9 (or L) to the geomagnetic latitude of the observatory.
As shown by Mayaud (1980), L9 increases with decreasing δ(L9), as expected for a geomagnetic field induced by a current system. Figure 8 shows L9(δ) (blue points) provided in Table 5 by Mayaud (1980), considering only the Northern Hemisphere. These points are well represented by a linear law considering an increasing induction effect with increasing parameter .
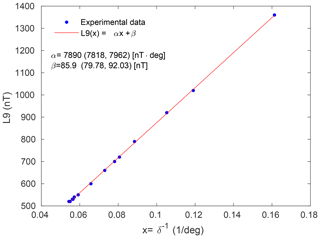
Figure 8The linear relation between the L9 limit and (Eq. 1) with values from Mayaud (1980). The linear regression fit results are shown: α and β coefficients and their 95 % confidence intervals.
Therefore, by using x = 1∕δ, the previous relationship is linearized and can be formulated as follows:
The results of the linear regression analysis performed on the experimental points are also reported in Fig. 8.
Equation (1) is therefore useful for estimating a reasonable L9 limit at a different site. In order to evaluate L9 at DUR, LMP, and, for comparison, NGK, the corresponding δ parameter is required. However, it is not clear how δ was estimated by Mayaud (1980), since it requires, for example, an auroral oval model for estimating λoval and an IGRF model for evaluating the geomagnetic latitude λ of a given site (this aspect will be further discussed at the end of this section).
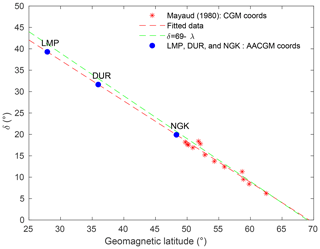
Figure 9The linear relation between δ and the corrected geomagnetic latitude λ (Eq. 2), with values from Mayaud (1980) indicated by red stars and the extrapolated values for our observatories by pink dots. The linear regression fit is shown in red, and the relation is shown in green. The blue dots indicate LMP, DUR, and NGK with AACGM latitudes and extrapolated δth (see the text for details).
In this regard, we empirically estimated δ(λ) by a linear fit of the experimental data reported by Mayaud (1980). Figure 9 shows experimental points (red stars) and the corresponding linear law (red line),
which allows us to extrapolate an estimation of the theoretical δth(λ) for the observatories of DUR, LMP, and, for comparison, NGK (blue circles), where λ represents the corrected geomagnetic latitude used by Mayaud (1980). Finally, by inserting δth into the Eq. (1) we estimated the L9(δth) level at the observatories of DUR, LMP, and NGK.
Table 2L9 estimated by different procedures; (approximate angular distance from the auroral region); L9(δapp) obtained from δapp using the linear fit in Fig. 8; δth (δ estimated from AACGM latitude and the linear fit in Fig. 9); L9(δth) obtained from δth using the linear fit in Fig. 8; L9A(Λ) obtained from a correction procedure on the key parameter δ(λ) explained at the end of Sect. 3.2. The 95 % confidence intervals are also indicated. The last column reports L9 experimentally determined by our calibration procedure.

All these results are reported in Table 2, which also shows for comparison the L9(δapp) obtained by computing and L9exp experimentally derived by our calibration procedure, together with the 95 % confidence intervals for the fitted L9 values.
It can be seen that all L9exp values are consistent with each other within their respective confidence interval at a given observatory. The small difference between L9exp and L9th could be due to a different method for calculating the geomagnetic coordinates used in Mayaud and in this work (we use AACGM). In order to verify this hypothesis, we performed a correction on the key parameter δ(λ) as follows:
-
we computed the AACGM latitudes Λ of geomagnetic observatories from Table 5 of Mayaud and corrected λ through the linear relationship ;
-
we performed a linear fit of δ(λ), λC, which provides the relationship for the adjusted δA(λC); and
-
finally we performed a linear fit of L9(δ), δA, which provides the adjusted L9A(Λ) estimated at our geomagnetic observatories as a function of AACGM latitude.
With respect to the L9(δ) it can be seen that the adjusted L9A(Λ) values (shown in Table 2) are closer to the experimental L9exp, indicating that the correction on geomagnetic coordinate makes a significant contribution to the L9 estimation. LMP is the only one that shows a discrepancy between L9exp and L9 estimated with different methods. A possible reason for this discrepancy lies in the low latitude of the LMP observatory where the ring current and/or electrojet current dynamics could affect L9 estimations.
Four different automated methods for the calculation of local geomagnetic activity indices K were endorsed by the IAGA, through the ISGI and distributed from the ISGI (http://isgi.unistra.fr/softwares.php, last access: 3 February 2020) website. For the Italian geomagnetic observatories of Duronia (DUR) and Lampedusa (LMP), we used one of them, i.e., the KASM algorithm based on the adaptive smoothed method (Nowozyński et al., 1991), which is the only one also provided by INTERMAGNET (https://www.intermagnet.org/publication-software/software-eng.php, last access: 3 February 2020)
An input parameter required by KASM code, as well as FMI code, is the L9 value, the so-called “K = 9 lower limit”, which allows us to determine, for each magnetic observatory, the conversion table between classes of geomagnetic field variation ranges and K-index values.
We found L9 values for DUR and LMP through a correlation analysis using as a reference the corresponding data from the two European observatories of Wingst (WNG) and Niemegk (NGK), both located in Germany. The choice of these two observatories was prompted by the fact that they are among the 13 observatories that provide their K indices for the determination of the planetary Kp index, and their magnetic local time is very close to that of the Italian observatories.
We note that NGK is the best reference observatory for the Italian geomagnetic observatory of DUR, possibly due to the closest magnetic local time; indeed, the amplitude of magnetic disturbances has a dependence on (magnetic) local time, which inevitably affects different K-index values (Chambodut et al., 2013).
Based on a dataset related to 2 years (2017 and 2018), this analysis allowed us to establish that for DUR and LMP the L9 values are 320 and 310 nT, respectively. These values are in good agreement with the ones directly obtained from Mayaud's method, which leads to approximately 355 and 315 nT for DUR and LMP, respectively (personal communication with ISGI members, 2019). The method can be generalized and applied to every observatory in the world to verify if the choice to scale local fluctuations of the Earth's magnetic field is properly calibrated by a suitably selected L9 value, regardless of whether it is manually or automatically computed. Our analysis also highlighted the possibility of establishing a linear relationship between a pair of analyzed observatory datasets, which can be useful for predicting or deriving the index of one when the other is known.
Another interesting result that we found is related to the consistency of the KASM code and the FMI code; the latter is in use at the two German observatories for the K-index computation and subsequent release. Although FMI code is based on a different procedure, we verified that the results obtained are consistent with those obtained by KASM code and stable in the 2-year time interval, although with a slightly different value of the input L9 parameter. This confirms that the choice of a certain algorithm in place of another does not invalidate the results.
Before the introduction of automatic procedures, based on the definition introduced by Bartels et al. (1939) for the K-index concept, in the 1980s Mayaud (1980) used an empirical relation to calculate the level of local magnetic activity L (equivalent to the L9 values) for a generic point of observation with respect to a referenced observatory. Through a linearization process, we used this relation, which includes some approximations and the necessity of determining the minimum angular separation between the observational point and the auroral region, i.e., a method for determining the geomagnetic latitude, to obtain an independent estimate of the L9 values for our observatories that is consistent, within the 95 % interval of confidence, with that obtained by our previous analysis. Moreover, Mayaud (1980) notes that the limitation of the method he proposes is that it is conceived for sub-auroral and midlatitudes; indeed, he suggests that for lower latitudes a constant L9 = 300 nT can be chosen. This very approximate value is not very far from the values we estimate (320 nT for DUR and 310 nT for LMP), but it would certainly not be as accurate in the comparison with the values from other reference observatories. Indeed, our results clearly show that a very precise L9 limit is necessary for obtaining K values that are consistent at different sites. As a final remark, from the overall view of this work, we are also convinced that the habit to round the value of L9 in multiples of 50 nT, firstly suggested by Bartels et al. (1939), cannot be changed for observatories that started providing the K index in the past since the homogeneity of the series is of primary importance. However, before a new observatory starts providing K-index values, it is worth evaluating K indices with a provisional L9 value assigned by the ISGI and then refining them with a procedure like the one we have shown, based on a comparison with reference observatories.
Data from the geomagnetic observatories (DUR, NGK, and WNG) that are members of the INTERMAGNET consortium can be downloaded at the following URL: https://www.intermagnet.org/data-donnee/download-eng.php, last access: 3 February 2020. Data from the LMP observatory can be downloaded at the following URL: http://geomag.rm.ingv.it/index.php?op=view_download_sourcedata&system=LMP, last access: 3 February 2020. Codes for the computation of the K index can be downloaded from the ISGI website at the following URL: http://isgi.unistra.fr/softwares.php, last access: 3 February 2020.
DDM, SL, and MR planned the study. MR performed the data analysis and wrote the codes. PB studied the KASM code functionality and, together with MR, tested and validated its results. DDM, LC, and SL improved the quality of the paper. All authors read and approved the final paper.
The authors declare that they have no conflict of interest.
The results presented in this paper rely on data collected at magnetic observatories. We thank the national institutes that support them and INTERMAGNET for promoting high standards of magnetic observatory practice (https://www.intermagnet.org, last access: 3 February 2020). We also thank Jürgen Matzka from the Helmholtz Centre Potsdam, GFZ German Research Centre for Geosciences (Germany) for providing K indices at Niemegk and Wingst.
Paolo Bagiacchi was partially supported by Programma Nazionale di Ricerche in Antartide (PNRA).
This paper was edited by Valery Korepanov and reviewed by three anonymous referees.
Bartels, J.: The standardized index, Ks, and the planetary index, Kp, Int. Union Geod. Geophys. IATME Bull., 12, 97 pp., 1949.
Bartels, J., Heck, N. H., and Johnston, H. F.: The three-hour-range index measuring geomagnetic activity, Terr. Magn. Atmos. Elec., 44, 411–454, https://doi.org/10.1029/TE044i004p00411, 1939.
Chambodut, A., Marchaudon, A., Menvielle, M., ElLemdani, F., and Lathuillere, C.: The K-derived MLT sector geomagnetic indices, Geophys. Res. Lett., 40, 4808–4812, https://doi.org/10.1002/grl.50947, 2013.
Chiappini, M., Meloni, A., Boschi, E., Faggioni, O., Beverini, N., Carmisciano, C., and Marson, I.: Shaded relief magnetic anomaly map of Italy and surrounding marine areas, Ann. Geophys., 43, 983–989, https://doi.org/10.4401/ag-3676, 2000.
Coles, R. and Menvielle, M.: Some thoughts concerning new digital magnetic indices, Geophys. Trans., 36, 303–312, 1991.
GEOMAG: Data from the LMP observatory, available at: http://geomag.rm.ingv.it/index.php?op=view_download_sourcedata&system=LMP1, last access: 3 February 2020.
INTERMAGNET: Magnetic observatory practice, available at: https://www.intermagnet.org/data-donnee/download-eng.php, last access: 3 February 2020.
Johnston, H. F.: Mean K indices from twenty-one magnetic observatories and five quiet and five disturbed days for 1942, Terr. Magn. Atmos. Elec., 47, 219–227, https://doi.org/10.1029/TE048i004p00219, 1943.
Mayaud, P. N.: Indices Kn, Ks et Km 1964–1967, IAGA Bull 21, Éditions du CNRS, Paris, available at: http://isgi.unistra.fr/Documents/References/Mayaud_CNRS_1968.pdf (last access: 22 January 2020), 1968.
Mayaud, P. N.: Range Indices (K, R, Q), in: Derivation, Meaning, and Use of Geomagnetic Indices (16–40 pp.), American Geophysical Union (AGU), edited by: Mayaud, P. N., 154 pp., https://doi.org/10.1002/9781118663837.ch4, 1980.
Menvielle, M.: Evaluation of algorithms for computer production of K indices, Geophys. Trans., 36, 313–320, 1991.
Menvielle, M., Papitashvili, N., Häkkinen, L., and Sucksdorff, C.: Computer production of K indices: review and comparison of methods, Geophys. J. Int., 123, 866–886, https://doi.org/10.1111/j.1365-246X.1995.tb06895.x, 1995.
Nowozyński, K., Ernst, T., and Jankowski, J.: Adaptive smoothing method for computer derivation of K-indices, Geophys. J. Int., 104, 85–93, https://doi.org/10.1111/j.1365-246X.1991.tb02495.x, 1991.
Parkinson, W. D.: The Influence of Continents and Oceans on Geomagnetic Variations, Geophys. J. Int., 6, 441–449, https://doi.org/10.1111/j.1365-246X.1962.tb02992.x, 1962.
Regi, M., Redaelli, G., Francia, P., and Lauretis, M. D.: ULF geomagnetic activity effects on tropospheric temperature, specific humidity, and cloud cover in Antarctica, during 2003–2010, J. Geophys. Res.-Atmos., 122, 6488–6501, https://doi.org/10.1002/2017JD027107, 2017.
Regi, M., Lauretis, M. D., Francia, P., Lepidi, S., Piancatelli, A., and Urbini, S.: The geomagnetic coast effect at two 80∘ S stations in Antarctica, observed in the ULF range, Ann. Geophys., 36, 193–203, https://doi.org/10.5194/angeo-36-193-2018, 2018.
Shepherd, S. G.: Altitude-adjusted corrected geomagnetic coordinates: Definition and functional approximations, J. Geophys. Res.-Space, 119, 7501–7521, https://doi.org/10.1002/2014JA020264, 2014.
Upton, L. and Hathaway, D. H.: An updated solar cycle 25 prediction with AFT: The modern minimum, Geophys. Res. Lett., 45, 8091–8095, https://doi.org/10.1029/2018GL078387, 2018.


