the Creative Commons Attribution 4.0 License.
the Creative Commons Attribution 4.0 License.
 | 08 Sep 2021
Accounting for meteorological effects in the detector of the charged component of cosmic rays
Vladimir Makhmutov
Galina Bazilevskaya
Fedor Zagumennov
Vladimir Fomenko
Yuri Stozhkov
Andrey Orlov
In this paper, we discuss the influence of meteorological effects on the data of the ground installation CARPET, which is a detector of the charged component of secondary cosmic rays (CRs). This device is designed in the P.N. Lebedev Physical Institute (LPI, Moscow, Russia) and installed at the Dolgoprudny scientific station (Dolgoprudny, Moscow region; 55.56∘ N, 37.3∘ E; geomagnetic cutoff rigidity (Rc = 2.12 GV) in 2017. Based on the data obtained in 2019–2020, the barometric and temperature correction coefficients for the CARPET installation were determined. The barometric coefficient was calculated from the data of the barometric pressure sensor included in the installation. To determine the temperature effect, we used the data of upper-air sounding of the atmosphere obtained by the Federal State Budgetary Institution “Central Aerological Observatory” (CAO), also located in Dolgoprudny. Upper-air sounds launch twice a day and can reach an altitude of more than 30 km.
- Article
(4753 KB) - Full-text XML
- BibTeX
- EndNote


The CARPET installation is designed for permanent monitoring of charged component of secondary cosmic ray (CR) flux at the ground level. It allows analysis of secondary CR fluxes variations, caused by geomagnetic and solar activity on the processes affecting the behavior of cosmic rays in near-Earth space and Earth's atmosphere (Makhmutov et al., 2013, 2015).
The basis of the CARPET installation (Fig. 1) is the STS-6 gas-discharge Geiger–Müller counters, combined in 12 detector blocks of 10 counters each. The detector block consists of two layers: five upper and five lower counters, separated with an aluminum absorber (filter) 7 mm thick. Experimental data are recorded using three channels with a time resolution of 1 ms. The first channel (UP) corresponds to the integral count rate of charged particles passing through the top layer of 60 counters. The second channel (LOW) corresponds to the integral count of charged particles passing through the bottom layer of 60 counters. Particles simultaneously registered by both the upper and lower counters, i.e., passed through the filter, are registered in the coincidence channel – TEL.

Figure 1CARPET-MOSCOW installation and its components. (a) CARPET module with cover and (b) CARPET module without cover.
In addition, there is a channel of auxiliary information (“telemetry”), which consists of the data on atmospheric pressure, temperature, and supply voltages.
The CARPET installation detects particles of the following energies: in the UP and the LOW channels there are electrons and positrons with energies E>200 keV, protons with E>5 MeV, muons with E>1.5 MeV (efficiency ∼ 100 %), and photons with E>20 keV (efficiency <1 %). The TEL coincidence channel registers more energetic particles: electrons with energies E>5 MeV, protons with E>30 MeV, and muons with E>15.5 MeV. Detailed information on the principles of CARPET operation was given previously (Philippov et al., 2020a). In addition to the CARPET installations, there are two other types of detectors which are also integrated to the network: “neutron detector” (ND) installations (Philippov et al., 2020c), which are sensitive to the neutron component of cosmic rays, and “gamma spectrometer” installations (Philippov et al., 2021), which are sensitive to gamma rays with energies from 50 keV to 5 MeV.
Nowadays there is an international network of the CARPET installations: the first module was launched in 2006 (De Mendonca et al., 2011, 2013; Mizin et al., 2011) at CASLEO (San Juan, Argentina; 31.47∘ S, 69.17∘ W, geomagnetic cutoff rigidity Rc=9.8 GV), and two modules were launched (Maghrabi et al., 2020) in 2015 at KACST (King Abdulaziz City for Science and Technology, Saudi Arabia, Riyadh, 24.39∘ N, 46.42∘ E; Rc=14.4 GV). In 2015 and 2016 at L.N. Gumilyov Eurasian National University (Nur-Sultan, Republic of Kazakhstan; 51.10∘ N, 71.26∘ E; Rc=2.9 GV), the first and second modules of the CARPET installation were launched (Philippov et al., 2020b; Tulekov et al., 2020).
This paper investigates the influence of meteorological conditions on the data of the installation, which has been operating since 2017 at the Dolgoprudny Scientific Station of the Lebedev Physical Institute RAS.
Ground-based CARPET installations detect secondary charged particles, mainly muons, generated in the interaction of primary CRs with nuclei in the atmosphere. Muons are not nuclear-active particles (such as protons, neutrons, and also charged pions and kaons) and lose energy for the excitation and ionization of air atoms. Ionization losses depend on the amount of matter above the detector; therefore, the barometric effect must be taken into account. The altitude of muon generation in the decays is temperature dependent; therefore the temperature effect in the atmosphere must be taken into account (Dorman, 1972, 2004, 2006).
2.1 Barometric effect
The barometric effect can be determined through variations in atmospheric pressure at the level of CR registration (Eq. 1):
where is the relative variation of the count rate of the CARPET installation; ; ; N0 is the average (standard) count rate [pulses/h] for the period of measurements; N is the current count rate [pulses/h]; P0 is the average (standard) ground atmospheric pressure [hPa] for the period of measurements; P is the current atmospheric pressure [hPa].
According to the data for 2019, hourly averaged average count rate and atmospheric pressure for the CARPET-MOSCOW installation N0 = 53 667 pulses/h, mean square deviation of the count rate σN = 2187 pulses/h; P0 = 988.7 hPa, and mean square deviation of the atmospheric pressure σP = 9.8 hPa.
For calculating the barometric coefficient β, it is necessary to determine the linear relationship between and ΔP (Fig. 2). The barometric coefficient β for the CARPET-MOSCOW installation (which is located at the Dolgoprudny Scientific Station of the Lebedev Physical Institute RAS, Moscow region) is determined for the data of June 2019 (during this period there were no significant geomagnetic, solar, and temperature disturbances): %/hPa; coefficient of determination R2=0.8975. Using Eq. (1), we obtain pressure-corrected data:
where NPC is the average pressure-corrected count rate [impulses/h] of the CARPET installation.

Figure 2Relationship between and ΔP for the CARPET-MOSCOW installation determined on the data of June 2019.
To prove that secondary CR variations associated with barometric effect are more significant than variations of primary CR variations, we use pressure-corrected data of the Moscow neutron monitor (http://cr0.izmiran.ru/mosc/, last access: 5 September 2021). The average count rate according to the data of 2019 is pulses/min and σnm=66 pulses/min.
Figure 3 shows neutron monitor count rate variations on the data of 2019. The black horizontal line is the average count rate [pulses/min] according to the annual data. Black vertical dashed lines are the boundaries of the months. The names of the month are signed at the bottom. The standard deviations for the data of each month are shown at the top. The relative magnitude of the effect determined by the variations in primary CRs over a given period of time can be estimated by the ratio (0.7 %).
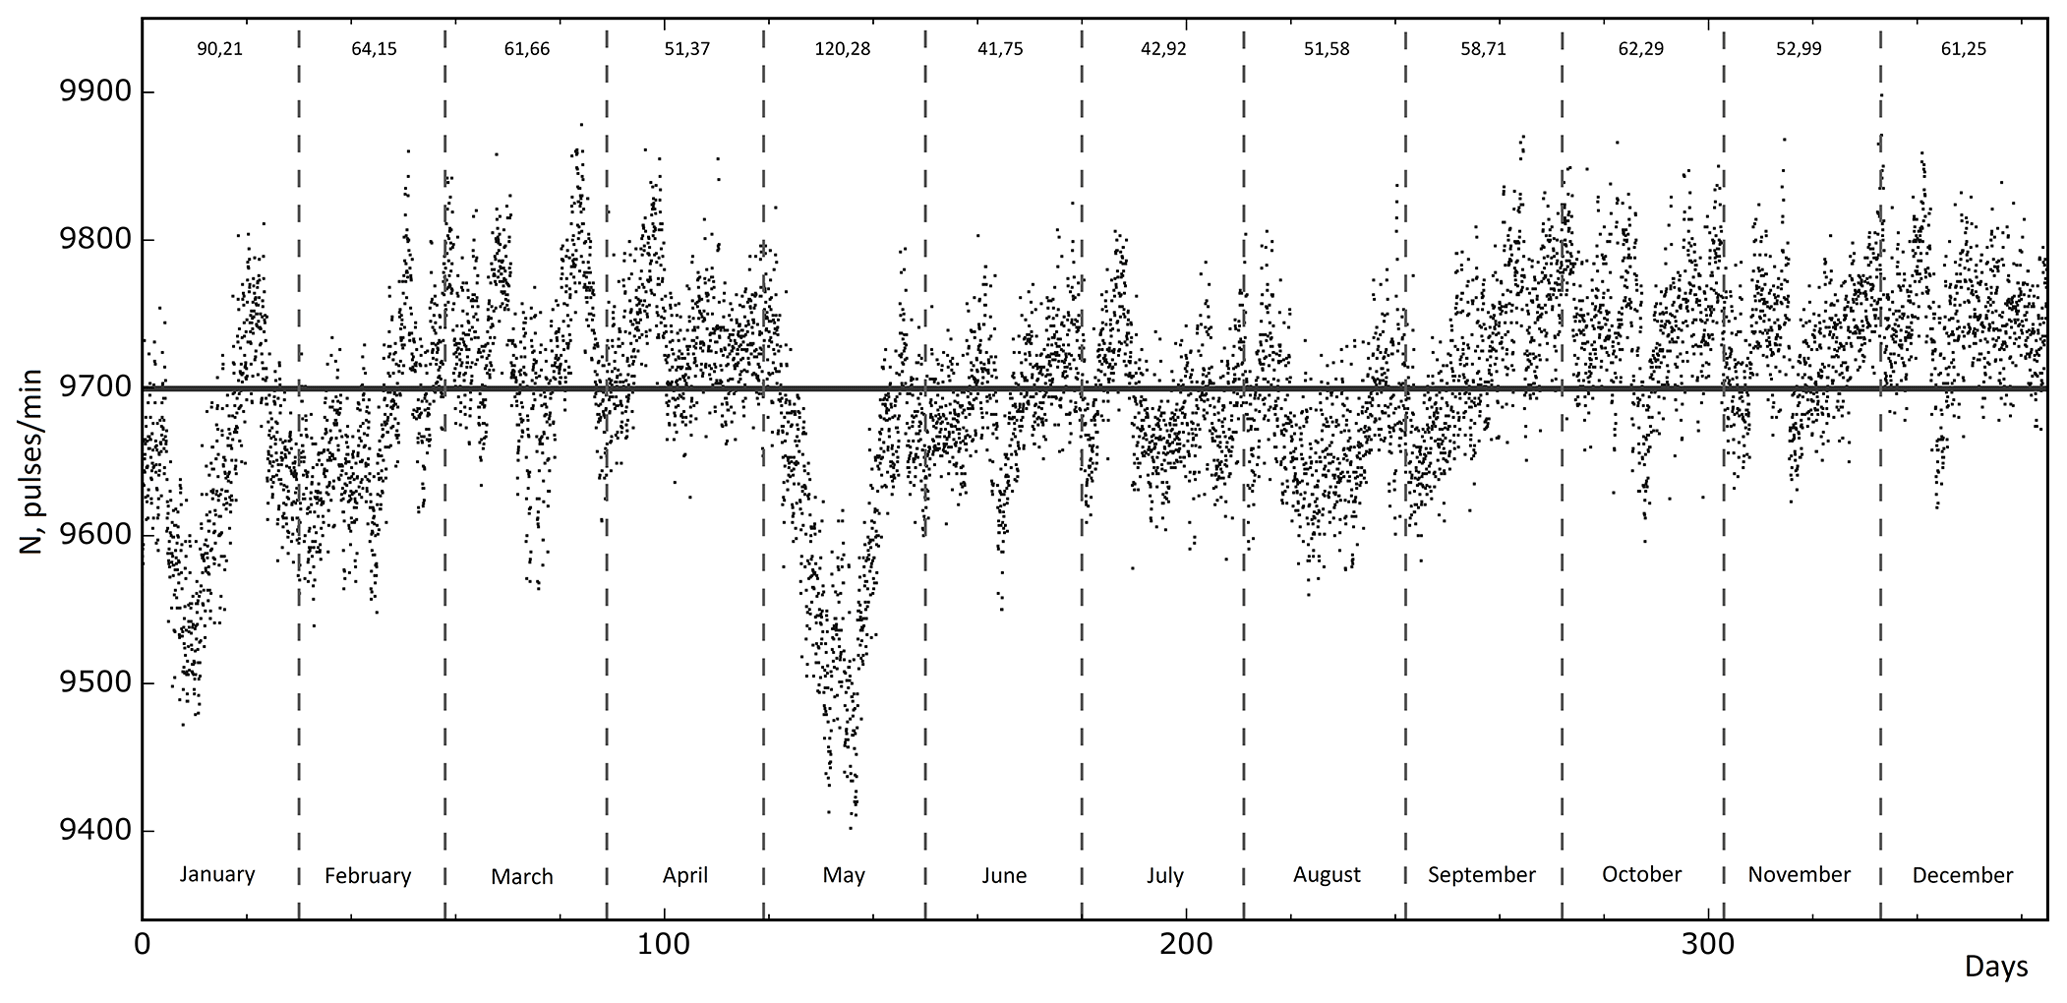
Figure 3Pressure-corrected count rate variations of the Moscow neutron monitor for the period of 2019. The horizontal line is the average count rate. The vertical dashed lines are the boundaries of the months. The standard deviations for the data of each month are shown at the top.
Magnitude of the barometric effect of the CARPET-MOSCOW can be estimated as (1.8 %), which is more than 2 times higher than variations of primary CRs. Therefore, the barometric effect is significant for the CARPET installations and must be taken into account in the further data processing.
2.2 Temperature effect
The muon component of secondary CRs is characterized by a significant temperature effect (Yanke et al., 2011). To correct the CR measurements for this effect, it is necessary to carry out temperature measurements in the atmosphere close to the location of the CR instrument. The temperature effect has two components: negative and positive. The negative temperature effect is associated with a decrease in muon fluxes during heating and expansion of the atmosphere. The positive temperature effect is associated with the appearance of additional muons, due to a decrease in the density of the atmosphere and, in connection with this, a decrease in the probability of interaction of charged pions and kaons with air nuclei. As a consequence, the probability of decays of charged pions and kaons and the appearance of additional muons increases. These two effects (positive and negative) are competitive (Dorman, 1972, 2004, 2006; Yanke et al., 2011).
To estimate the temperature effect, we used data of the TEL channel of the CARPET-MOSCOW installation for 2019–2020. The altitude profiles of temperature and pressure were determined from the experimental data of the Central Aerological Observatory (CAO; Dolgoprudny).
The temperature effect was determined in two ways: based on the effective generation level method and the integral method (Dmitrieva et al., 2013; Ganeva et al., 2013; Zazyan et al., 2015).
2.2.1 Effective generation level method
To eliminate the barometric effect, original data (Fig. 4a) were processed according to Eq. (1) (Fig. 4b). The barometric correction mainly compensates for the daily variations in the count rate.
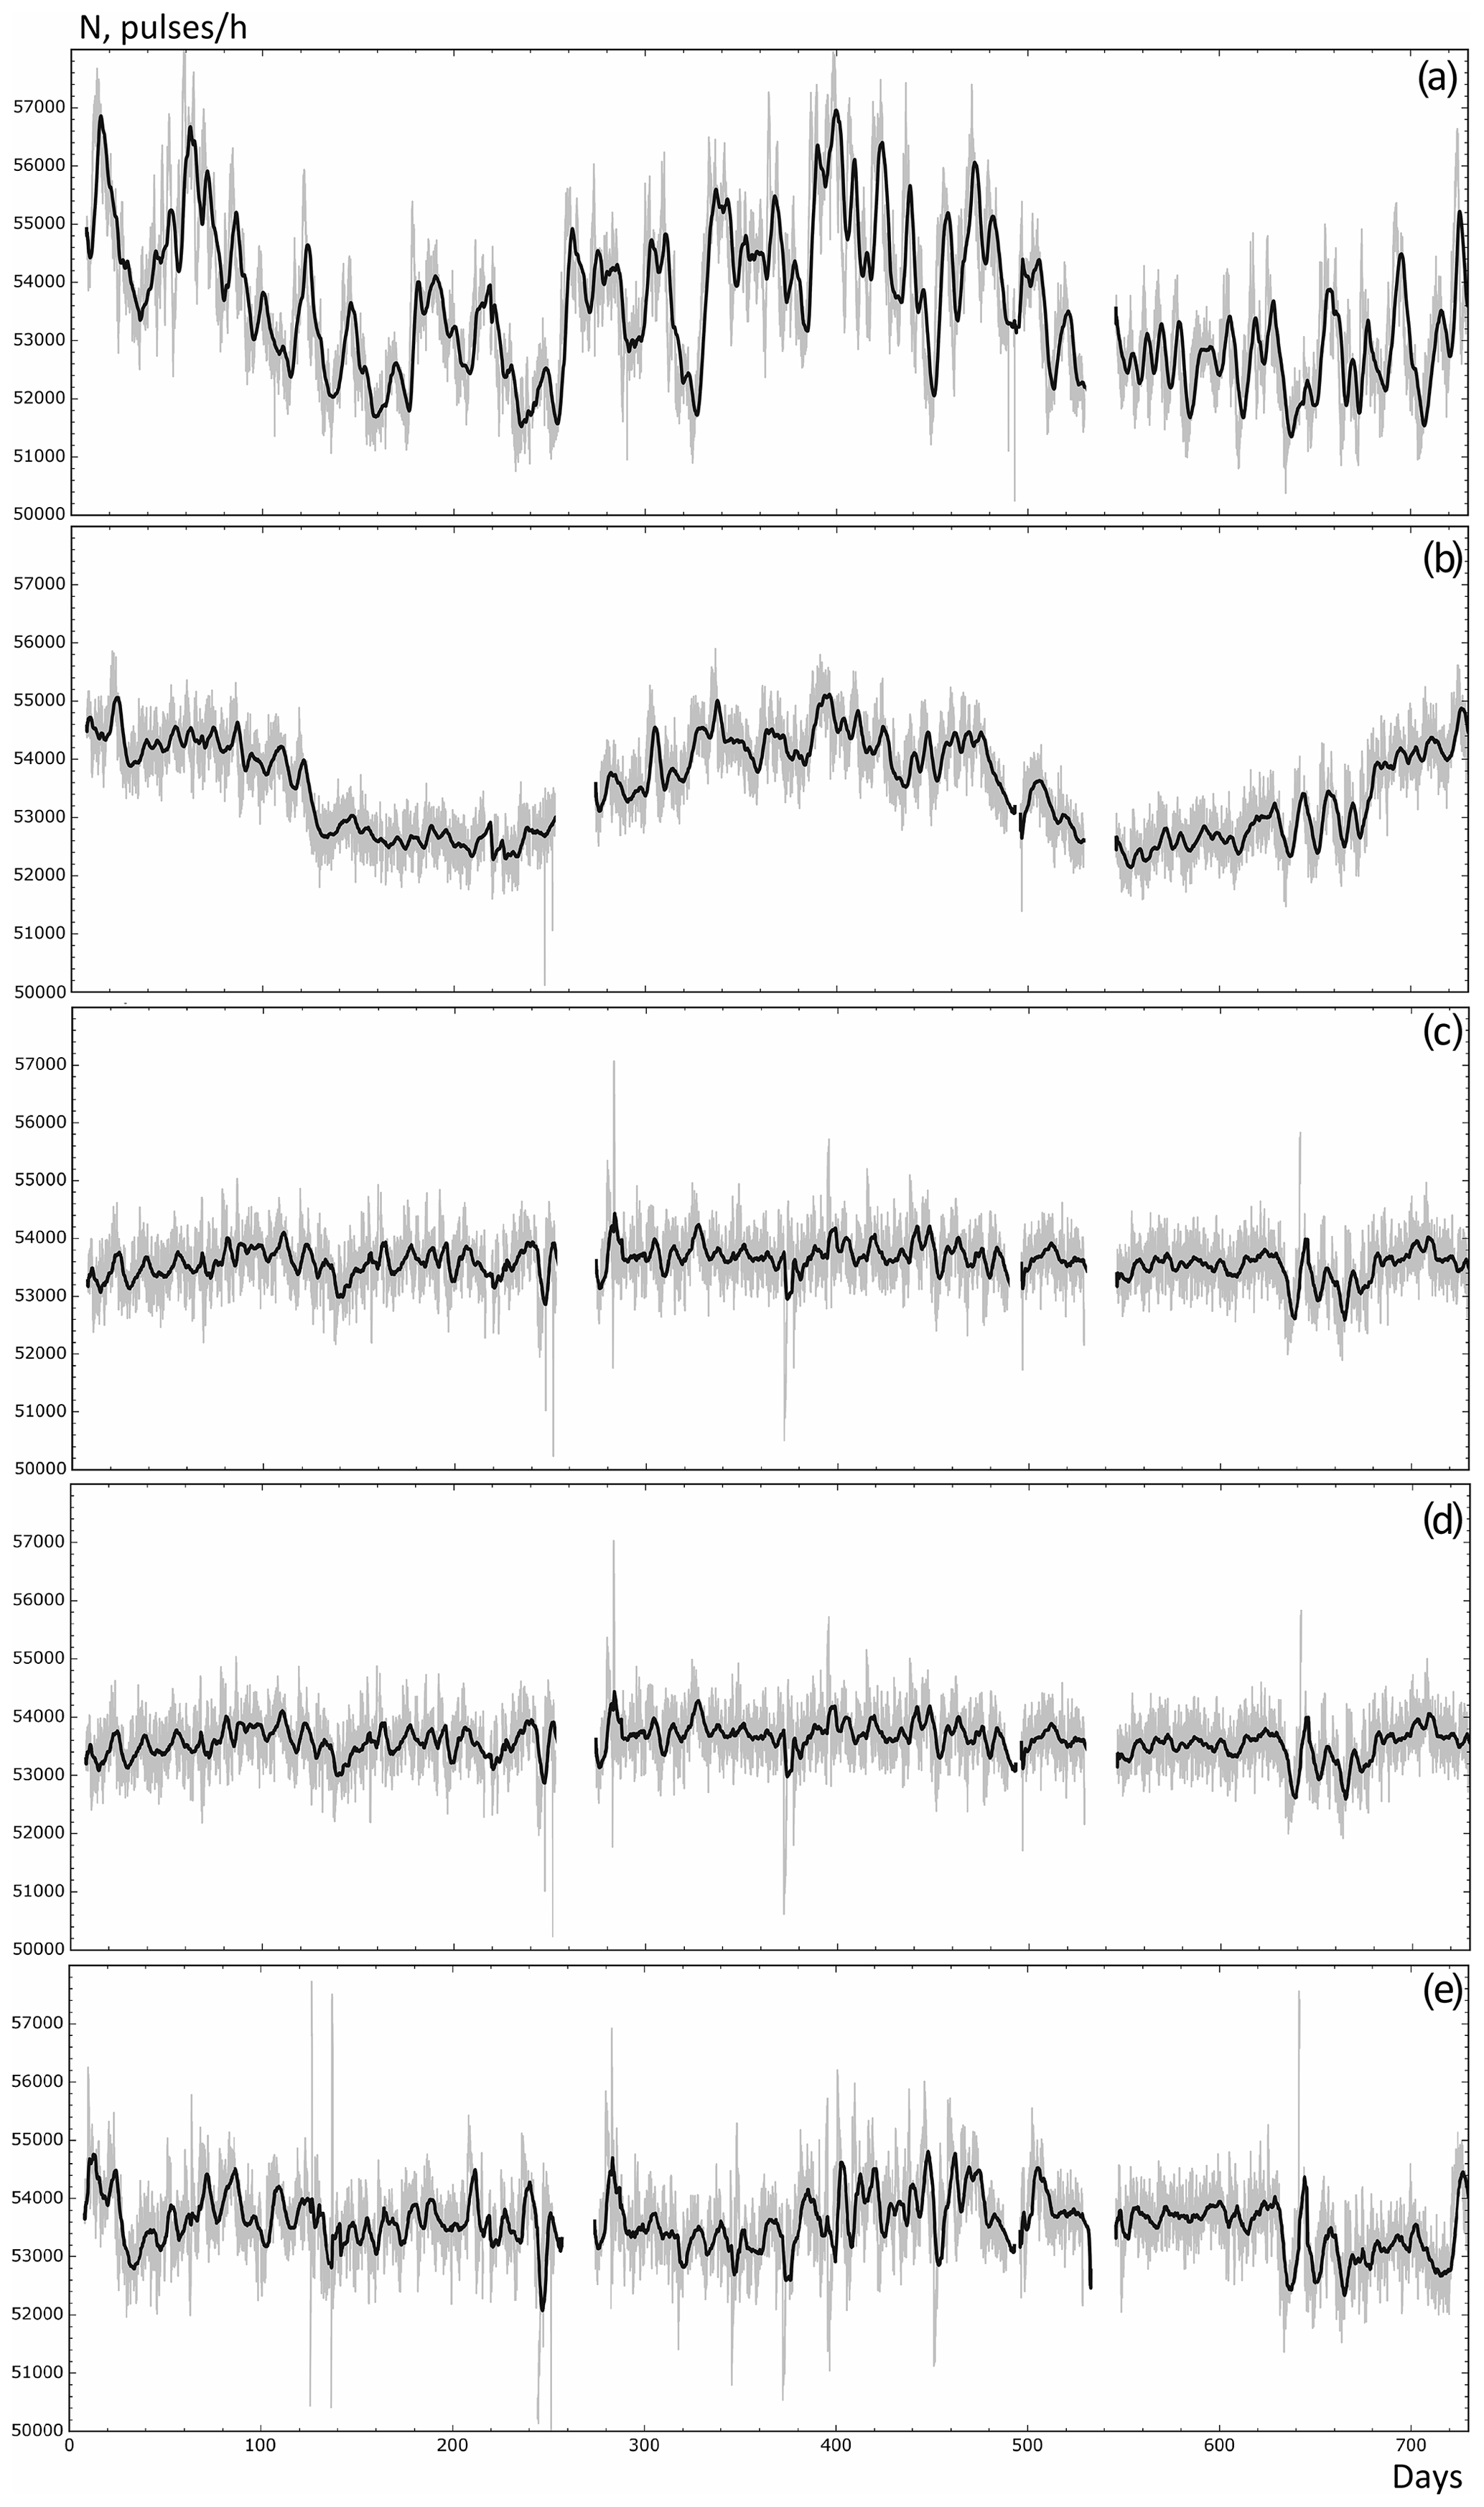
Figure 4Count rate variations of the CARPET-MOSCOW installation for the period of 2020–2021: (a) uncorrected data, (b) pressure-corrected data, (c) pressure- and temperature-corrected (negative effect applying the effective generation method) data, (d) pressure- and temperature-corrected (negative and positive effect applying the effective generation method) data, (e) pressure- and temperature-corrected (the integral method) data. Grey lines indicate initial data, and black lines indicate data with averaging by 24 points.
The effective generation rate method is based on the assumption that muons are mainly generated at a certain isobaric level, which is 100 hPa (Dmitrieva et al., 2013). The height H of this level depends on the atmospheric temperature. The deviation of the count rate of the installation, therefore, depends on the change in the height of the generation level ΔH and the change in the temperature of this layer of air:
where is the count rate relative variations of the CARPET installation; ΔH is absolute deviation of the effective generation level [km]; αH is negative temperature coefficient [%/km]; ΔT is absolute temperature deviation at the level of effective generation [∘C]; αT is positive temperature coefficient [%/∘C].
Upper-air meteorological sondes are launched twice a day, at 11:30 and 23:30 UTC (Kochin et al., 2021). The picture of a typical MRZ-3AK1 sonde is presented in Fig. 5. Flights last, on average, about 1.5 h. Therefore, from the available data of the CARPET-MOSCOW installation, samples were made of hourly data from 12:00 to 13:00 and 00:00 to 01:00 UTC.
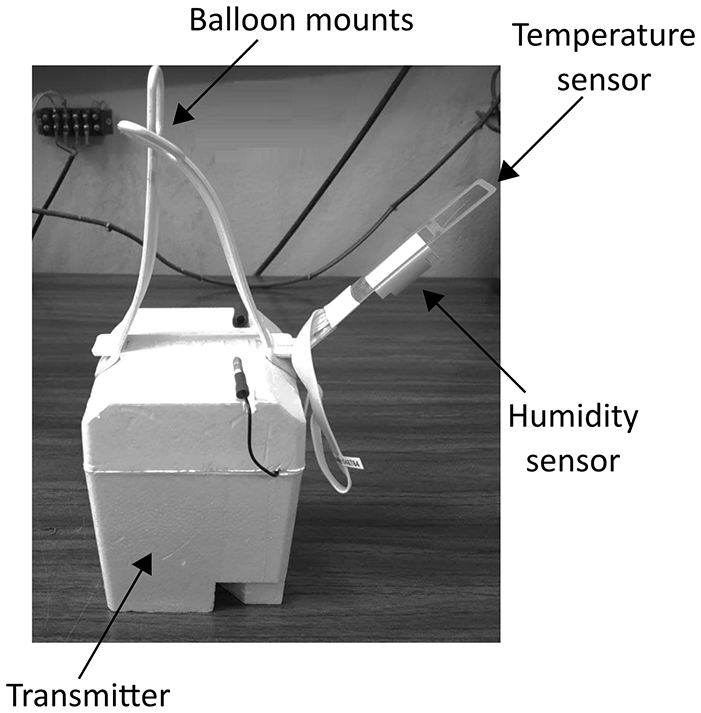
Figure 5Upper air sonde MRZ-3AK1 (CAO; Dolgoprudny).
To calculate the contribution of the negative component of the temperature effect, we define the linear relationship between and ΔH (Fig. 6), where ; ; H0 is the average (standard) height of the level of effective generation [km] for 2019–2020; H is the current height of the level of effective generation [km].
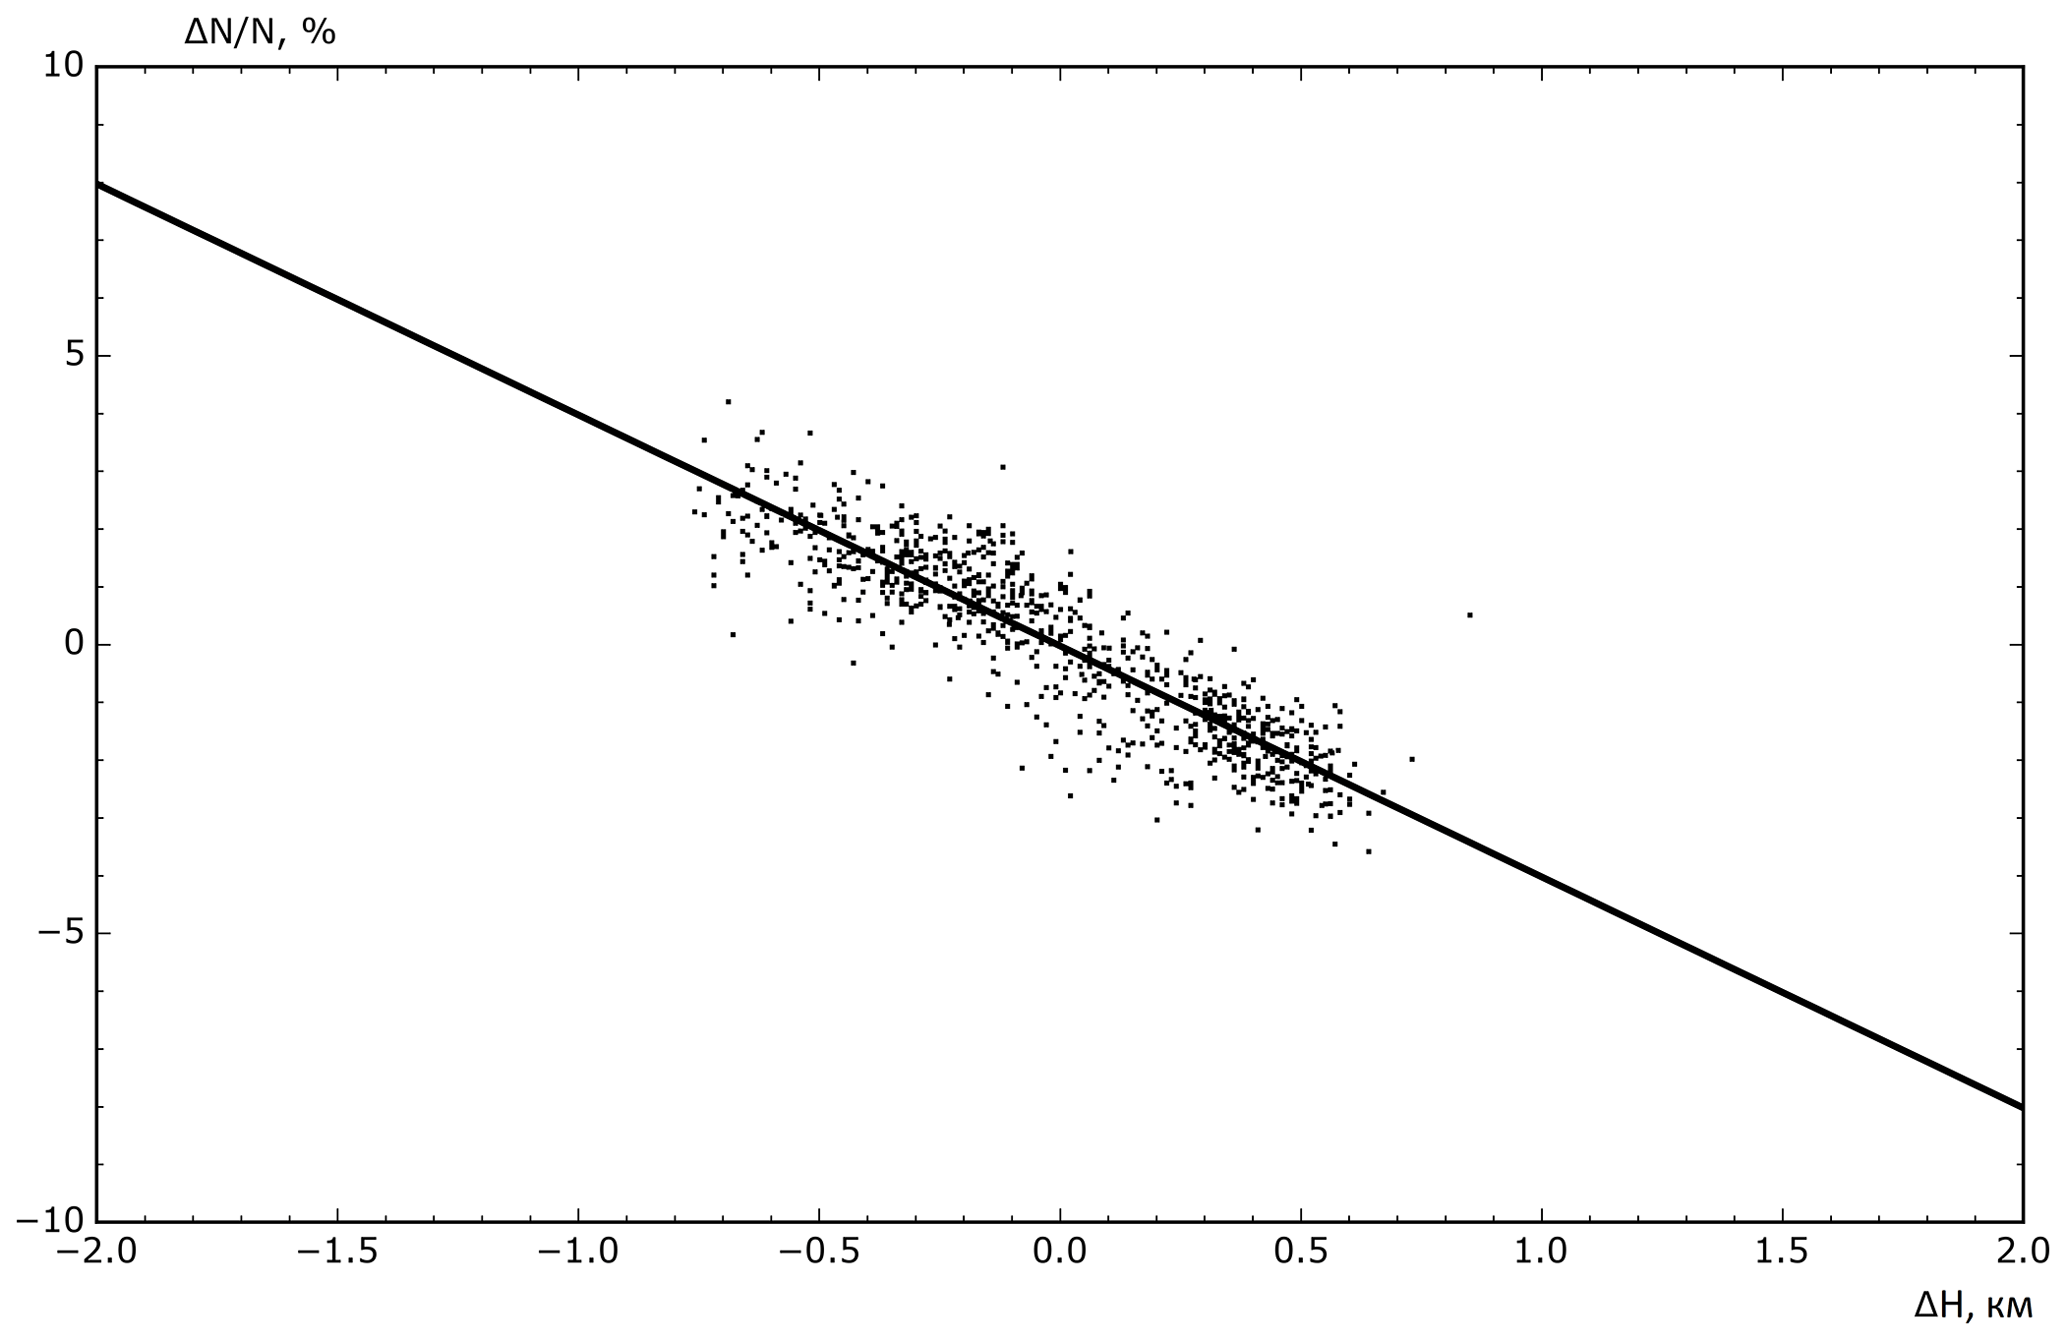
Figure 6Relationship between and ΔH (negative temperature effect) for the CARPET-MOSCOW installation determined on the data of 2019–2020.
For the CARPET-MOSCOW installation, H0=16.1 km and σH=0.3 km. Using the least squares method, we define the approximating line, the slope of which is equal to αH.
%/km; coefficient of determination R2=0.8191.
The corrected data series (Fig. 4c) is calculated by the following equation:
where NHPC is the count rate [pulses/h] of the CARPET installation with negative temperature effect correction.
To calculate the contribution of the positive component of the temperature effect, we define the linear dependence between and ΔT (Fig. 7), where ; ; T0 is the average (standard) temperature at the level of effective generation [∘C] for 2019–2020 according to CAO measurements; T is the current temperature at the level of effective generation [∘C]. ∘C, and σT=6.0 ∘C.
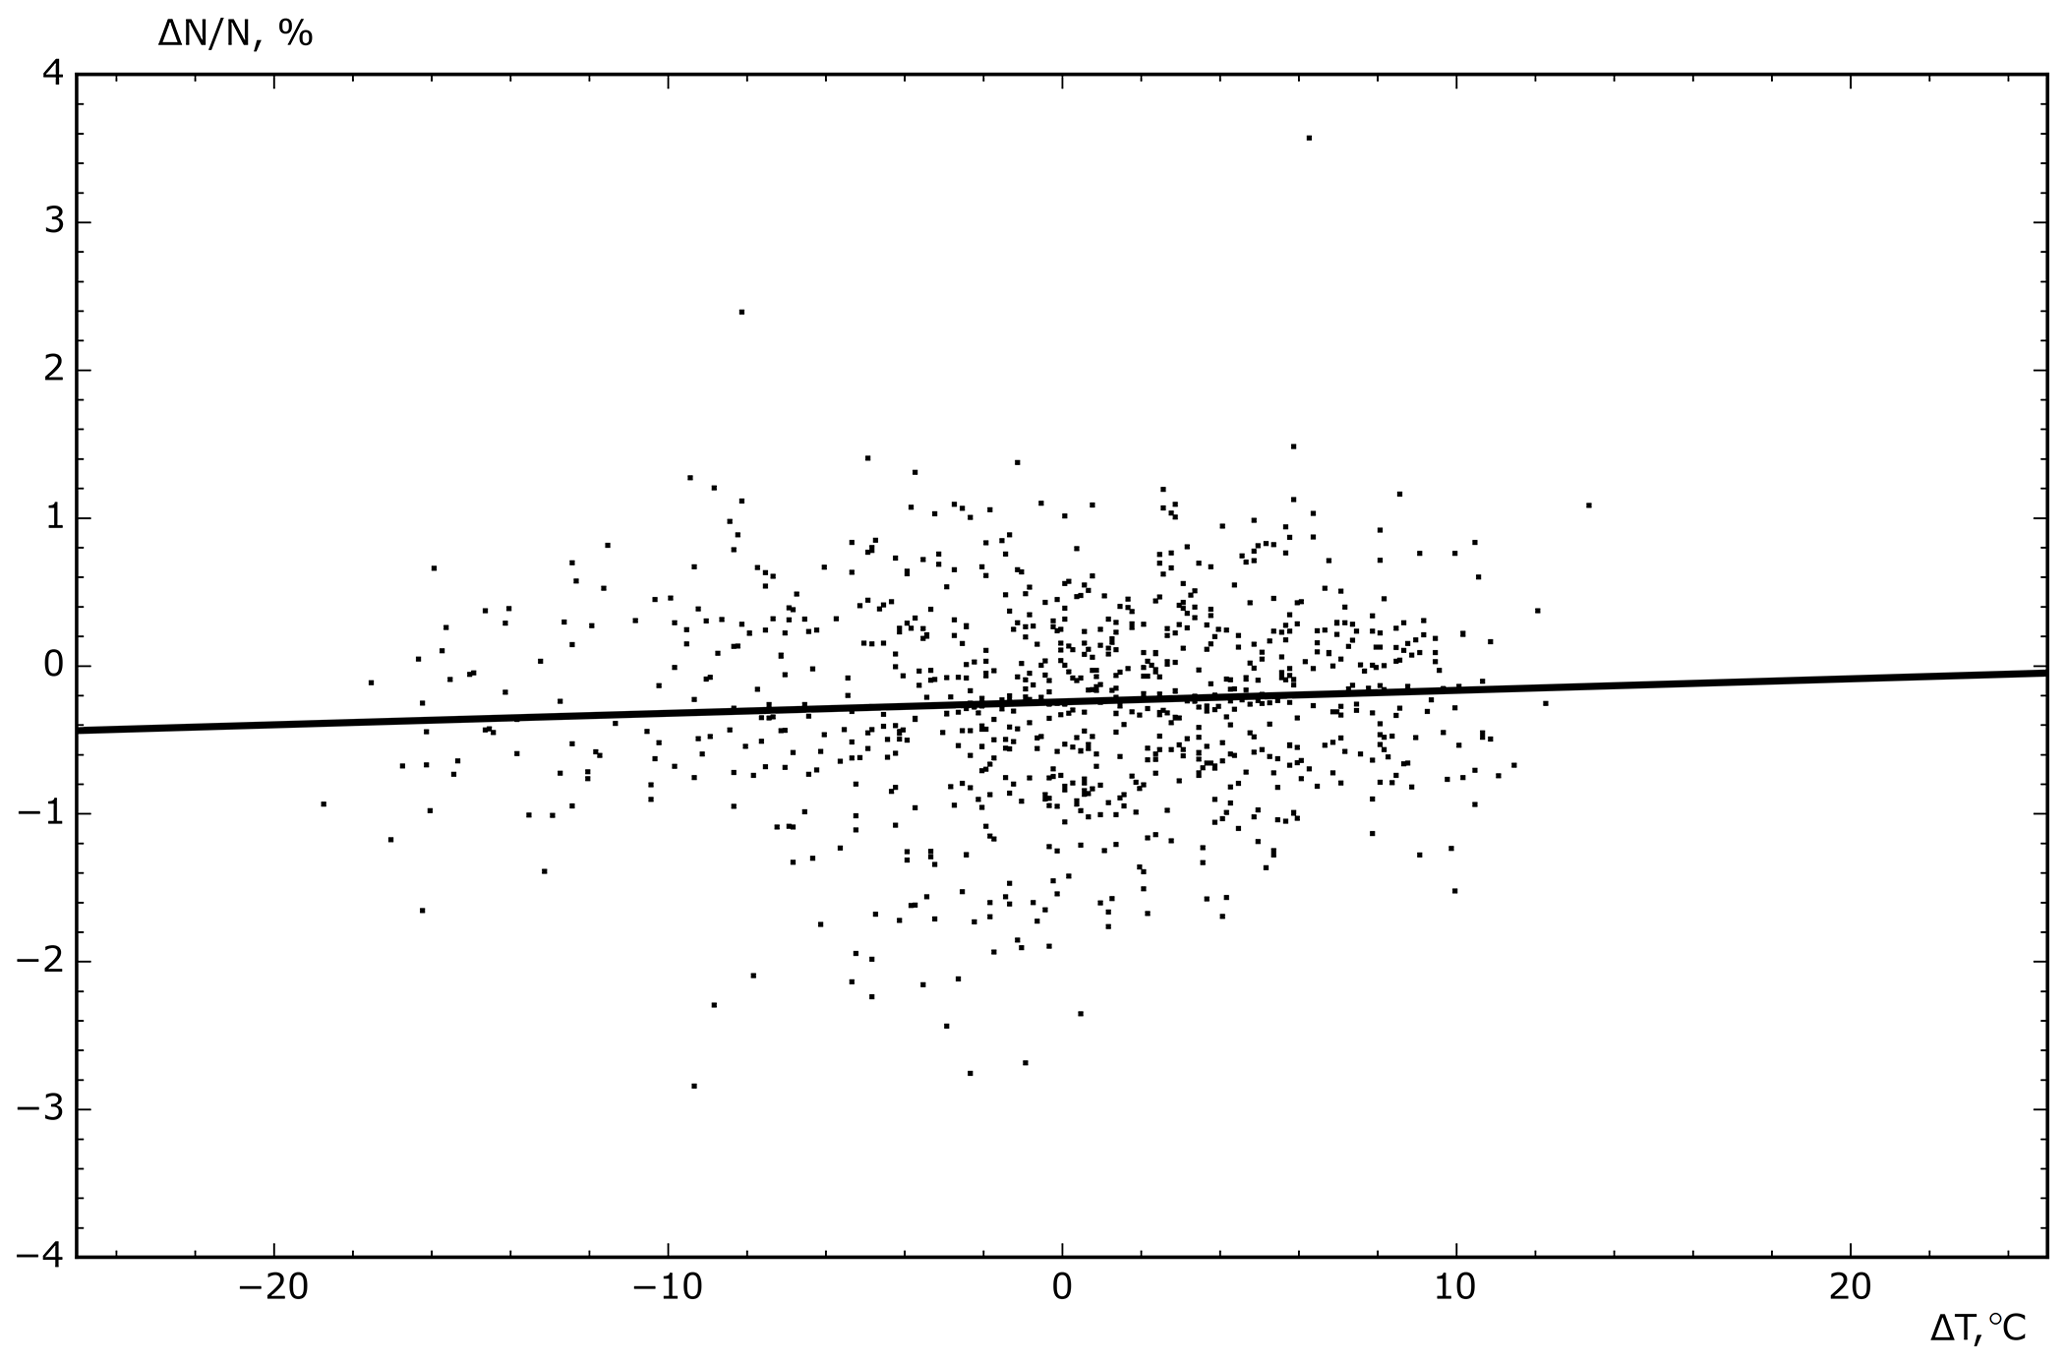
Figure 7Relationship between and ΔT (positive temperature effect) for the CARPET-MOSCOW installation determined on the data of 2019–2020.
Using the least squares method, we define the approximating line, whose slope is αT.
%/∘C; coefficient of determination R2=0.0049.
As seen in Fig. 7, there is a slight positive temperature effect. Corrected data series is calculated by the following equation (Fig. 4d):
where NTHPC is the count rate [pulses/h] of the CARPET installation with positive temperature effect correction.
2.2.2 Integral method
Consider the integral method for determining the temperature effect:
where P is the atmospheric pressure at the point of determination of the temperature effect [hPa]; α(x) is the density of the temperature coefficient [%/∘C/hPa]; ΔT(x) is the temperature deviation from the average value in the air layer corresponding to the pressure from x to x+dx.
There are 16 isobaric surfaces commonly accepted while analyzing upper-air atmospheric effects: 1000, 925, 850, 700, 500, 400, 300, 250, 200, 150, 100, 70, 50, 30, 20, and 10 hPa. They are also used in observations by CAO. It was decided to exclude the surface of 10 hPa from the calculations, since for the time period 2019–2020 there are only 148 measurements for this isobaric surface pressure level.
Represent Eq. (6) as a sum:
where α(P) is the temperature coefficient for a given isobaric surface [%/∘C]; ΔT(P) is the deviation of temperature from the average value for a given isobaric surface [∘C].
Starting from the first isobaric surface (20 hPa), we will determine the dependence between and ΔT. The corrected data for the first surface are then used to determine the temperature coefficient for the next surface, and so on:
where αi+1(P) is the temperature coefficient of the isobaric surface i+1 [%/∘C]; ΔTi+1(P) is the temperature deviation from the average value for the isobaric surface i+1 [∘C]; Ni is the count rate of the CARPET-MOSCOW, with temperature correction along the isobaric surface i; Ni+1 is the count rate of the CARPET-MOSCOW, with temperature correction along the isobaric surface i+1.
The results are shown in Table 1: the first column is the atmospheric pressure on the given surface, the second column is the average temperature according to the data for 2019–2020, the third column is the standard deviation of the temperature, the fourth column is the temperature coefficient for the given isobaric surface, and the fifth column is number of measurements (number of launches at which the sound reached the required altitude). Figure 4e shows the count rate of the CARPET-MOSCOW installation, corrected with integral method, according to the data for 2019–2020.
Table 1The results of determining the temperature coefficient for each isobaric surface.
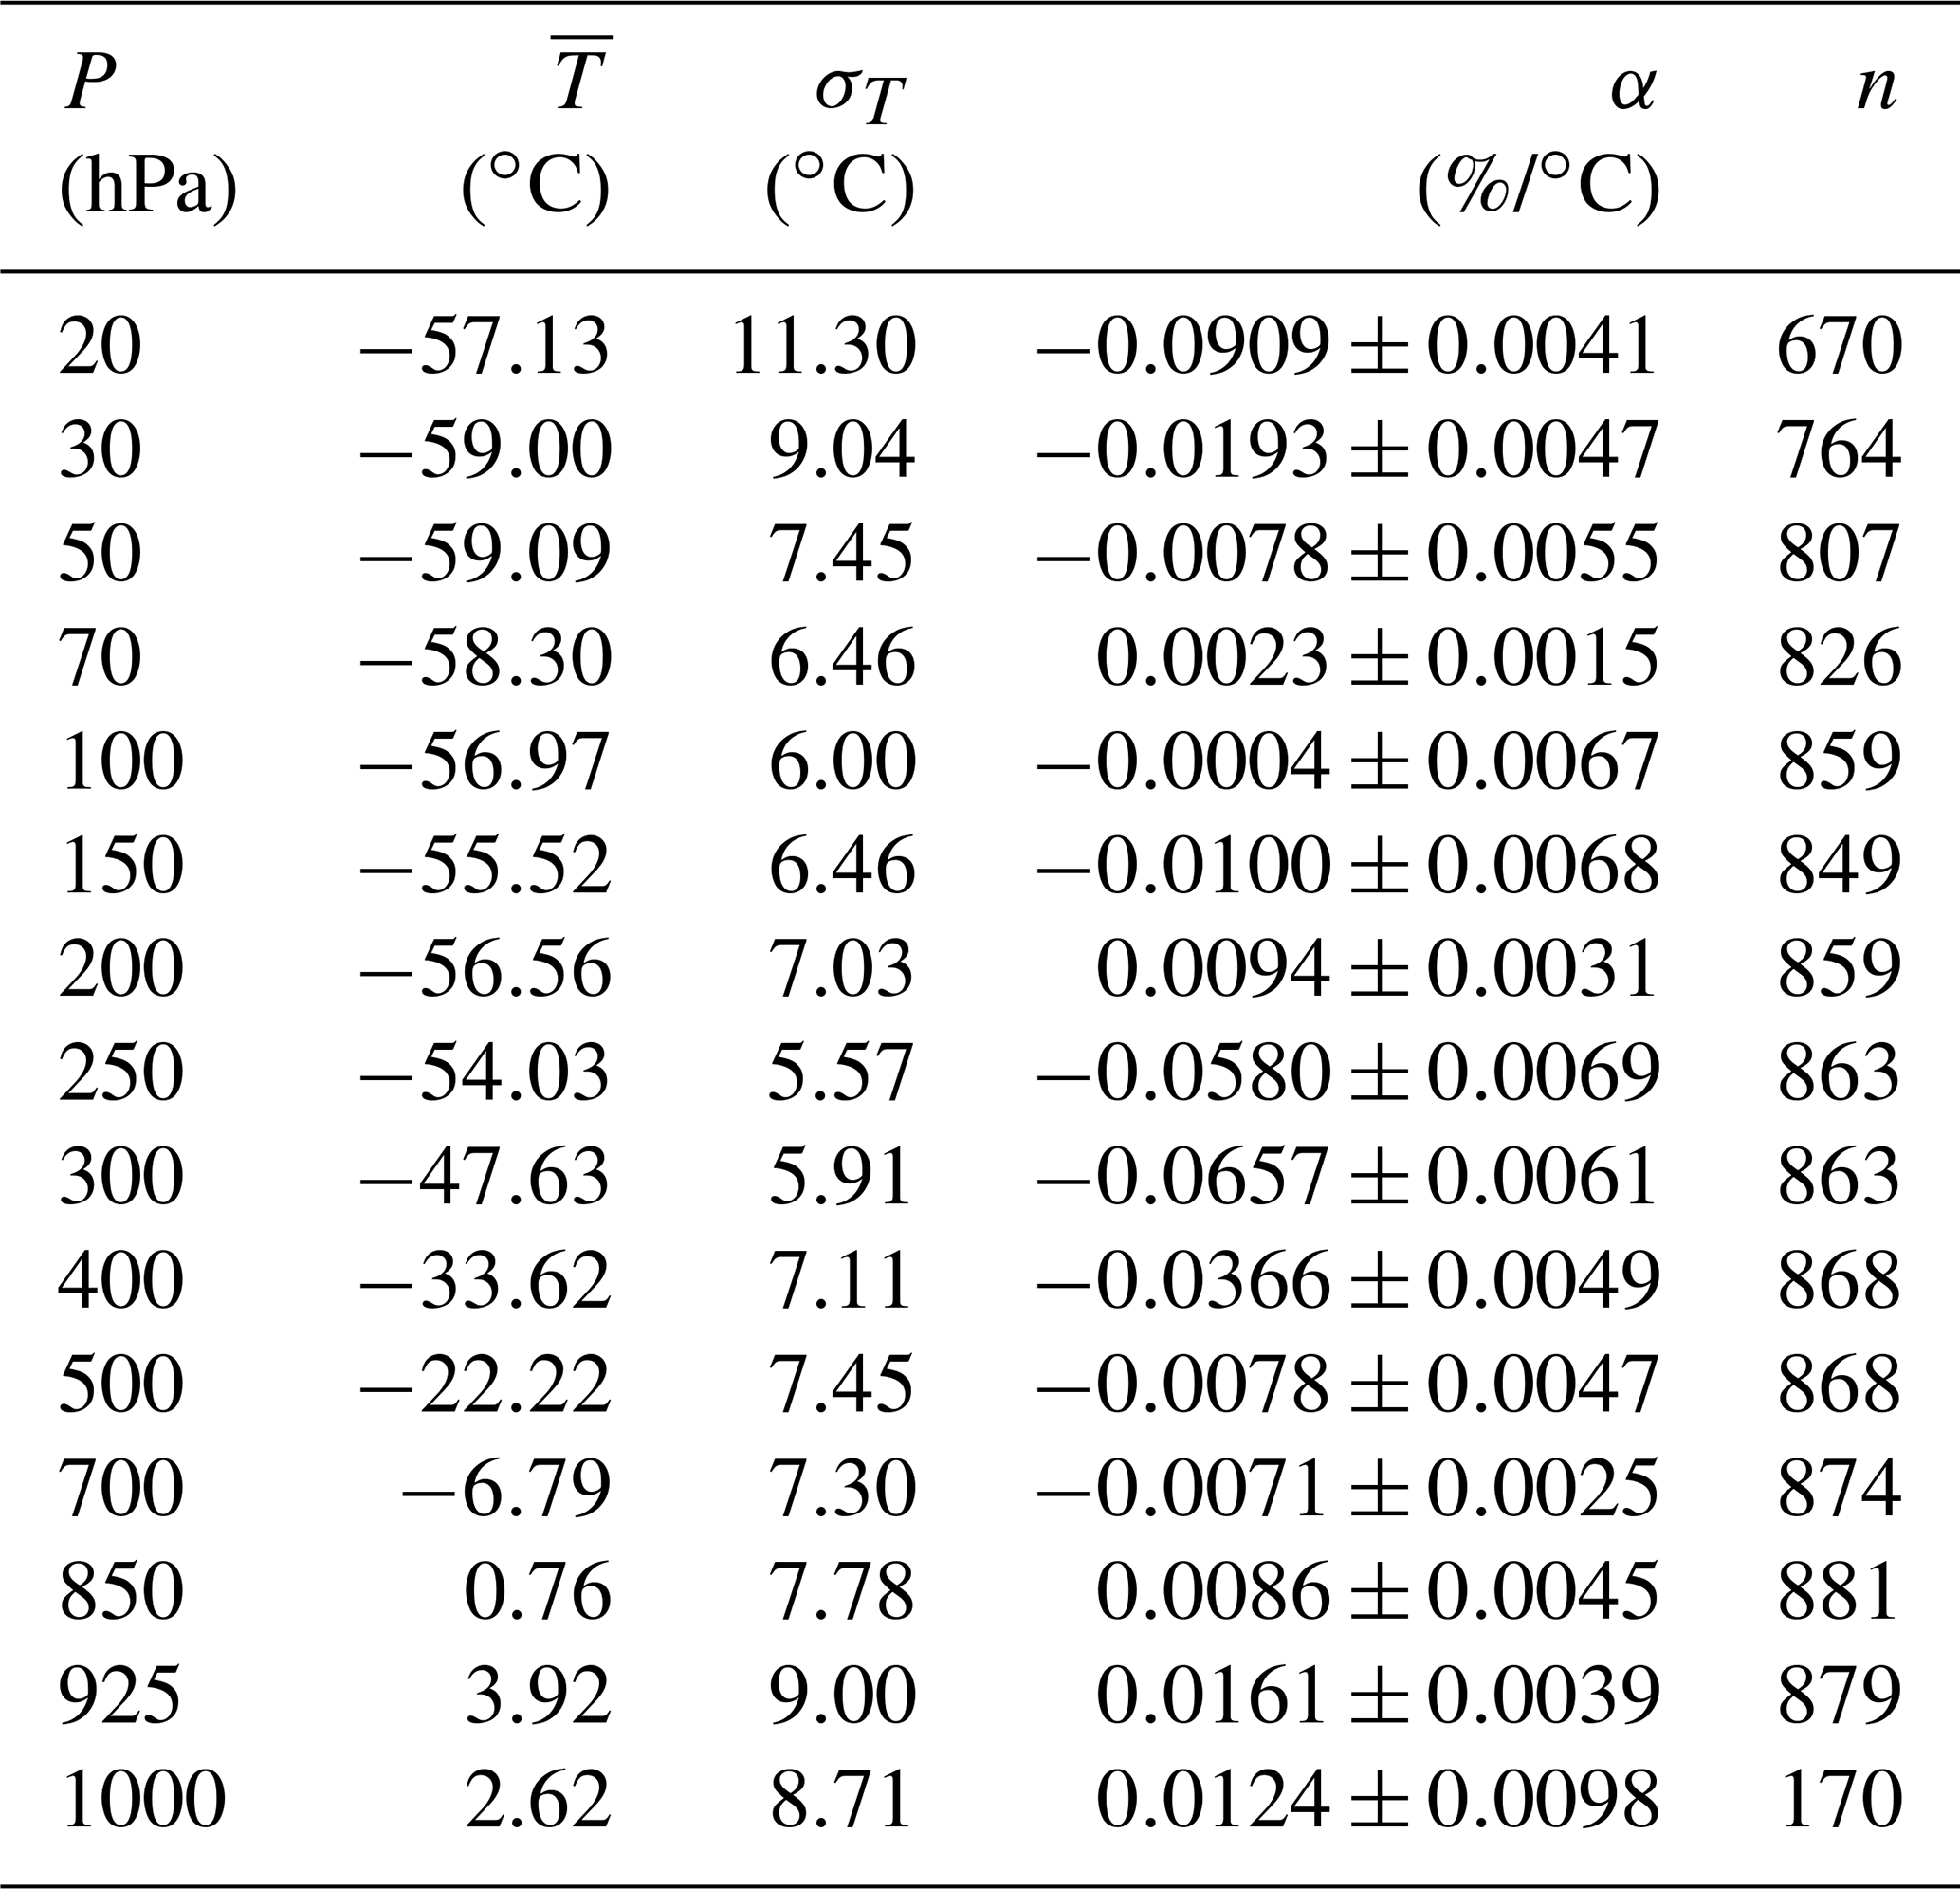
Comparison of Fig. 4c and d shows that the contribution of the positive temperature effect is small. Comparison of Fig. 4d and e demonstrates that the efficiency of data correction using the integral method is worse than using the effective generation method.
We can compare the efficiency of the correction for positive and negative temperature effects by comparing the CARPET-MOSCOW data with the data of a neutron monitor, which is practically not sensitive to the influence of temperature. The correlation coefficient between the pressure-corrected neutron monitor data for the period of 2019–2020 and the CARPET-MOSCOW data corrected for pressure and the negative temperature effect is R=0.38, taking into account that the positive temperature effect is R=0.39. Thus, the contribution of the correction for the positive temperature effect to the results of the CARPET-MOSCOW installation is small.
This paper describes the CARPET installation, designed for detecting the charged component of secondary CRs. The barometric coefficient was determined using the built-in pressure sensor. The temperature coefficient was determined by two methods using the data of the upper-air sounding. The integral method for determining the temperature effect is the most accurate. However, due to the lack of regular measurements at high altitudes (since not all sounds reach high altitudes), it can be seen that the data processed with this method are less accurate. It also shows less correlation with the data of the Moscow neutron monitor. In this connection, it is more optimal to use the method of the effective generation level, since it does not require a complete temperature profile. Also, for the CARPET-MOSCOW installation, it is possible to use only the negative component of the temperature effect, since variations of the count rate have a good (R2=0.8191) correlation with ΔH.
Data related to this article are available upon request to the corresponding authors.
MP was responsible for the conceptualization, methodology, software, electronics, data curation, and writing of the original draft. VM was responsible for the conceptualization, methodology, data curation, and writing of the original draft. GB was responsible for the conceptualization and prepared the writing of the original draft, FZ carried out the data curation and prepared the original draft. VF curated the data. YS was responsible for the conceptualization. AO participated in data curation.
The authors declare that they have no conflict of interest.
Publisher’s note: Copernicus Publications remains neutral with regard to jurisdictional claims in published maps and institutional affiliations.
The authors express their gratitude to the Neutron Monitor Database (NMDB) team (http://www01.nmdb.eu, last access: 5 September 2021) and IZMIRAN team (https://www.izmiran.ru/, last access: 5 September 2021) for the data from the ground network of neutron monitors and Federal State Budgetary Institution “Central Aerological Observatory” (CAO) team (http://www.cao-rhms.ru/, last access: 5 September 2021) for providing the data of upper-air sounding of the atmosphere for 2019–2020.
This paper was edited by Ciro Apollonio and reviewed by two anonymous referees.
De Mendonca R., Raulin J.-P., Bertoni F., Echer E., Makhmutov V., and Fernandes G.: Long-term and transient time variation of cosmic ray fluxes detected in Argentina by CARPET cosmic ray detector, J. Atmos. Sol.-Terr. Phy., 73, 410, https://doi.org/10.1016/j.jastp.2010.09.034, 2011.
De Mendonca, R. R. S., Raulin, J.-P., Echer, E., Makhmutov, V. S., and Fernandez, G.: Analysis of atmospheric pressure and temperature effects on cosmic ray measurements, J. Geophys. Res.-Space, 118, 1403–1409, https://doi.org/10.1029/2012JA018026, 2013.
Dmitrieva, A. N., Astapov, I. I., Kovylyaeva, A. A., and Pankova, D. V.: Temperature effect correction for muon flux at the Earth surface: estimation of the accuracy of different methods, J. Phys. Conf. Ser., 409, 012130, https://doi.org/10.1088/1742-6596/409/1/012130, 2013.
Dorman, L.: Cosmic rays in the Earth's atmosphere and underground, Kluwer Academic Publishers, USA, 2004.
Dorman, L.: Long-term cosmic ray intensity variation and part of global climate change, controlled by solar activity through cosmic rays, Adv. Space Res., 37, 1621–1628, https://doi.org/10.1016/j.asr.2005.06.032, 2006.
Dorman, L. I.: The Meteorological Effects of Cosmic Rays, Nauka Press, Moscow, Russia, 1972.
Ganeva, M., Peglow, S., Hippler, R., Berkova, M., and Yanke, V.: Seasonal variations of the muon flux seen by muon telescope MuSTAnG, J. Phys. Conf. Ser., 409, 012242, https://doi.org/10.1088/1742-6596/409/1/012242, 2013.
Kochin, A. V., Zagumennov, F. A., and Fomenko, V. L.: Examination of Optical Processes, in The Atmosphere During Upper Air Soundings, J. Atmos. Ocean. Tech., https://doi.org/10.1175/JTECH-D-20-0158.1, online first, 2021.
Maghrabi, A., Makhmutov, V. S., Almutairi, M., Aldosari, A., Altilasi, M., Philippov, M. V., and Kalinin, E. V.: Cosmic ray observations by Carpet detector installed in central Saudi Arabia – preliminary results, J. Atmos. Sol.-Terr. Phys., 200, 105194, https://doi.org/10.1016/j.jastp.2020.105194, 2020.
Makhmutov, V., Raulin, J.-P., De Mendonca, R. R. S., Bazilevskaya, G. A., Correia, E., Kaufmann, P., Marun, A., Fernandes, G., and Echer, E.: Analysis of cosmic ray variations observed by the CARPET in association with solar flares in 2011–2012, J. Phys. Conf. Ser., 409, 012185/1-4, https://doi.org/10.1088/1742-6596/409/1/012185, 2013.
Makhmutov, V. S., Bazilevskaya, G. A., Stozhkov, Y. I., Raulin, J.-P., and Philippov, M. V.: Analysis of Cosmic Ray Variations Recorded in October–December 2013, B. Russ. Acad. Sci. Ch., 79, 570–572, https://doi.org/10.3103/S1062873815050299, 2015.
Mizin, S. V., Makhmutov, V. S., Maksumov, O. S., and Kvashnin, A. N.: Application of multithreading programming to physical experiment, Kratk. Soobshch. Fiz., 2, 9–17, https://doi.org/10.3103/S1068335611020023, 2011.
Philippov, M. V., Makhmutov, V. S., Stozhkov, Y. I., and Maksumov, O. S.: The CARPET Ground Facility for Detecting the Charged Component of Cosmic Rays, Instrum. Exp. Tech., 63, 388–395, https://doi.org/10.1134/S0020441220030033, 2020a.
Philippov, M. V., Makhmutov, V. S., Stozhkov, Yu. I., Maksumov, O. S., Bazilevskaya, G. A., Morzabaev, A. K., and Tulekov, Ye. A.: Characteristics of the ground-based “CARPET-ASTANA” instrument for detecting charged component of cosmic rays and preliminary analysis of the first experimental data, Nucl. Instrum. Meth. A, 959, 163567, https://doi.org/10.1016/j.nima.2020.163567, 2020b.
Philippov, M. V., Makhmutov, V. S., Stozhkov, Yu. I., and Maksumov, O. S.: A Neutron Detector Ground-Based Facility for Detecting the Neutral Component of Cosmic Rays, Instrum. Exp. Tech., 63, 716–723, https://doi.org/10.1134/S0020441220050292, 2020c.
Philippov, M. V., Makhmutov, V. S., Kvashnin, A. N., Maksumov, O. S., Stozhkov, Yu. I., Raulin, J.-P., and Tacza, J.: A Gamma-Spectrometer Ground Installation for Detecting Cosmic Rays in the Casleo Astronomic Complex, Instrum. Exp. Tech., 64, 566–569, https://doi.org/10.1134/S0020441221040035, 2021.
Tulekov, E. A., Makhmutov, V. S., Bazilevskaya, G. A., Stozhkov, Yu. I., Morzabaev, A. K., Philippov, M. V., Erkhov, V. I., and Dyusembekova, A. S.: Ground-based Instrument for the Study of Cosmic Ray Variation in Nur-Sultan, Geomagn. Aeron., 60, 693–698, https://doi.org/10.1134/S0016793220060134, 2020.
Yanke, V., Asipenka, A., Berkova, M., De Mendonca, R. R. S., Raulin, J.-P., Bertoni, F. C. P., Echer, E., Fernandez, G., and Makhmutov, V.: Temperature effect of general component seen by cosmic ray detectors, Proceedings of 32nd International Cosmic Ray Conference, Beijing, 11, 377–380, https://doi.org/10.7529/ICRC2011/V11/0627, 2011.
Zazyan, M., Ganeva, M., Berkova, M., Yanke, V., and Hippler, R.: Atmospheric effect corrections of MuSTAnG data, J. Space Weather Space Clim., 5, A6, https://doi.org/10.1051/swsc/2015007, 2015.
CARPET. Today there is a network of such installations located in different parts of the world. For ground-based installations, meteorological effects must be considered as they affect the data. This paper shows a technique for eliminating barometric and temperature dependences based on data for 2019–2020.