the Creative Commons Attribution 4.0 License.
the Creative Commons Attribution 4.0 License.
 | 28 Oct 2021
Intercomparison of photoacoustic and cavity attenuated phase shift instruments: laboratory calibration and field measurements
Jialuo Zhang
Meng Wang
Mingxu Su
Wu Zhou
Ravi Varma
The study of aerosol optical properties is essential to understand its impact on the global climate. In our recent field measurement carried out in the Gehu area of southwest Changzhou City, a photoacoustic extinctiometer (PAX) and a cavity attenuated phase shift albedo monitor (CAPS-ALB) were used for online aerosol optical properties measurement. Laboratory calibration with gas and particle samples were carried out to correct disagreements of field measurements. During particle calibration, we adopted ammonium sulfate (AS) samples for scattering calibration of nephelometer parts of both the instruments, then combined these with number-size distribution measurements in the MIE model for calculating the value of the total scattering (extinction) coefficient. During gas calibration, we employed high concentrations of NO2 for absorption calibration of the PAX resonator and then further intercompared the extinction coefficient of CAPS-ALB with a cavity-enhanced spectrometer. The correction coefficient obtained from the laboratory calibration experiments was employed on the optical properties observed in the field measurements correspondingly and showed good results in comparison with reconstructed extinction from the IMPROVE model. The intercomparison of the calibrated optical properties of PAX and CAPS-ALB in field measurements was in good agreement with slopes of 1.052, 1.024 and 1.046 for extinction, scattering and absorption respectively, which shows the reliability of measurement results and verifies the correlation between the photoacoustic and the cavity attenuated phase shift instruments.
- Article
(1436 KB) - Full-text XML
- BibTeX
- EndNote


Atmospheric aerosols can directly affect the earth's energy balance and cause global temperature changes by absorbing and scattering solar radiation (Horvath, 1993; Haywood and Shine, 1995; Penner et al., 2001). Therefore, considerable studies were undertaken to investigate the optical properties of aerosol particles from different regions (Baynard et al., 2007; Petzold et al., 2013; Moosmüller et al., 1998). The optical properties of regional aerosols depend on particle size distribution, mixing state and complex refractive index; thus online measurements are necessary (Nakayama et al., 2015; Schwartz et al., 2010). Furthermore, the calibration of instruments is a key step to ensure the reliability and quality of online measurement data of aerosol optical properties.
Ideally, the complete set of aerosol optical properties need to be measured simultaneously, including aerosol extinction, scattering and absorption coefficients, for aerosol optical closure studies, where the aerosol extinction coefficient is the sum of the scattering coefficient and absorption coefficient. Integrating nephelometry (IN) is an effective, economical and widely recognized method for obtaining aerosol scattering coefficients online (Beuttell and Brewer, 1949; Heintzenberg and Charlson, 1996; Abu-Rahmah et al., 2006). Early on the systematic limitations of this technique were noted; i.e., the so-called truncation error made it technically impossible to cover the full range of the scattering angle and was mainly studied through numerical simulations with a Mie model (Ensor and Waggoner, 1970; Anderson et al., 1996; Anderson and Ogren, 1998; Heintzenberg et al., 2006; Müller et al., 2009). The measurement techniques for the extinction coefficient of atmospheric aerosols mainly include cavity ring-down spectroscopy (CRDS), cavity attenuation phase shift (CAPS) and cavity enhanced absorption spectroscopy (CEAS). CRDS has an extremely high detection accuracy and mature measurement system, which performed well in laboratory studies and field measurements (O'Keefe and Deacon, 1988; Baynard et al., 2007; Berden et al., 2010; Pettersson et al., 2004; Strawa et al., 2003). Related in its basic principle to CRDS, CAPS was previously used to calibrate the reflectivity of mirrors and also applied to measure atmospheric nitrogen dioxide (Kebabian et al., 2005; Ge et al., 2013; Herbelin and McKay, 1981). It has currently been extended to the field of aerosol extinction coefficient measurement (Kebabian et al., 2007; Petzold et al., 2013). Massoli et al. (2010) gave a detailed description of CAPS results in the aerosol extinction coefficient measurements, including the first laboratory characterization and field deployment. Onasch et al. (2015) calibrated the optical path length error of CAPS with a MIE model using monodisperse polystyrene spheres generated in the laboratory. Rather than single wavelength measurements, CEAS with a broadband light source applied for atmospheric trace gas detection (Fiedler et al., 2003; Ball et al., 2004; Chen and Venables, 2011) was later extended to quantitative aerosol extinction (Varma et al., 2013; Zhao et al., 2014; Suhail et al., 2019). The filter-based methods are most commonly used for online measurements of the aerosol absorption coefficient (Horvath, 1997; Hansen et al., 1982; Petzold and Schönlinner, 2004). Considering aerosol morphology changes, multiple scattering and shielding effects, these methods require many correction factors that limits the quality of measurement results (Bond et al., 1999; Weingartner et al., 2003). Recently, the photoacoustic spectroscopy (PAS) technique (Terhune and Anderson, 1977; Bruce and Pinnick, 1977; Adams et al., 1990), a direct method that can be easily calibrated, has been developed into a stable instrument in the field measurement of aerosol absorption (Moosmüller et al., 1998; Arnott et al., 1999; Lack et al., 2006; Lewis et al., 2008; Sharma et al., 2013; Nakayama et al., 2015). Arnott et al. (2000) calibrated their aerosol photoacoustic instrument by measuring the photoacoustic response in the presence of NO2 and compared its result with an Aethalometer. Lack et al. (2006) used ozone with a known optical absorption level to calibrate the photoacoustic system with CRDS.
During our recent field campaign in Yangtze River Delta (YRD), the measurements of aerosol optical properties showed discrepancies from different instruments, among which the extinction, absorption, and scattering coefficients were measured by CAPS, PAS, and IN respectively (Du et al., 2020). For investigation of the discrepancy between instruments and correction of the measurement data, this study carried out an aerosol optical properties intercomparison measurement. During calibration measurement, the extinction coefficient was calibrated with a MIE model using mono-disperse particles, and the absorption coefficient was calibrated with the transmission method using an absorbing gas, while the scattering coefficient was calibrated with a combination of above model and the method using no-absorbing particles. In addition, an Incoherent Broad-Band Cavity Enhanced Absorption Spectrometer (IBBCEAS) was used to measure the extinction coefficient of NO2 for comparison with CAPS. Then the correction factors obtained from the laboratory calibration experiments were employed on the data observed in the field measurement correspondingly and compared with the reconstructed extinction of the Interagency Monitoring of Protected Visual Environments (IMPROVE) model. Furthermore, the calibrated field measurement results from photoacoustic and cavity attenuated phase shift instruments were intercompared. For aerosol optical properties, different optical methods showed good agreement and closure correlation after calibration, which has been rarely studied in laboratory calibration and field measurement. In addition, the corrected field measurement data are more reliable for subsequent study of aerosol optical properties in YRD region.
2.1 Instrument description
During calibration experiments, the optical properties of aerosol were measured by a Cavity Attenuation Phase Shift-ALBedo monitor (CAPS-ALB) (Shoreline Science Research, Japan) and a Photoacoustic Extinctiometer (PAX) (Droplet Measurement Technologies, US). In addition, a Scanning Mobility Particle Sizer Spectrometer (SMPS) (Model 3938, TSI, US) was employed to measure the number-size distribution for the MIE model, and an IBBCEAS setup was used to measure NO2 concentration for extinction calculation. Details on the above instruments are summarized in Table 1.

Aerosol sample flow was drawn into the PAX using an external vacuum pump, then split between the wide-angle integrating reciprocal nephelometer and photoacoustic resonator for simultaneous online measurements of light scattering coefficient and absorption coefficient. In the photoacoustic cavity, the laser beam passing through the sample stream was modulated at the resonant frequency of the cavity, and the light-absorbing molecules were heated and quickly transferred the heat to the receiving end of the instrument; the pressure wave generated by periodic heating was detected by a sensitive microphone. The calculation formula of absorption coefficient () is as follows (Rosencwaig, 1980):
where Pmic is the pressure at the microphone at the resonant frequency fres, PL is laser power, Ares is the geometric cross section of the resonator, γ is the ratio of specific heat at constant pressure and volume, and Q is the quality factor of the resonator calculated from temperature, pressure, and relative humidity (RH).
The wide-angle integrating reciprocal nephelometer with a scattering integration angle of 6–174∘ range used in PAX detects scattering light from a parallel beam through a cosine-weighted detector. The detector located in the center of the cavity is fiber coupled to a photo-multiplier tube (PMT), where the measured laser power is proportional to the total scattering cross section. The expression for determining scattering coefficient () is given by the following (Abu-Rahmah et al., 2006):
where PPMT is the value of the PMT signal with scattering background subtracted, and PL is measured laser power. The scattering background was measured during the zeroing process of the instrument operation.
In addition, the extinction coefficient () considered as a theoretical value in the recommended calibration method of PAX can be obtained by measuring the intensity of transmitted light with a photodetector combined with Lambert–Beer's law as follows:
where I0 and I are the laser intensity with or without extinction substances, respectively. L is the path length of the laser beam through the cavity in meters, which is 0.354 m here. 106 is a conversion factor to express extinction in Mm−1.
The CAPS-ALB uses an internal vacuum pump to introduce aerosol flow into the sample cell to measure the extinction coefficient and scattering coefficient simultaneously. A nearly 1∘ truncation angle integrating sphere integrating nephelometer (ISIN) has been employed in CAPS-ALB. The integrating sphere with attached truncation reduction tubes located around the sample cell and PMT are equipped to collect scattering light, which effectively reduces the angle truncation error (Varma et al., 2003). As a typical kind of reciprocal nephelometer, its scattering coefficient () can also be calculated using Eq. (2).
The extinction measurement system of CAPS-ALB utilizes a visible light-emitting diode (LED) with the luminescence as a light source and a sample cell incorporating two high reflectivity mirrors centered at the wavelength of the LED and a vacuum photodiode detector. The extinction coefficient of CAPS-ALB () is obtained by measuring the light attenuation of the visible long optical path with a vacuum photodiode, and detecting the phase shift of the square wave frequency modulation heterodyne detection of the light source, its expression as follows:
where cot is the cotangent, c is the speed of light, f is the LED modulation frequency, and T and P are the sample temperature and pressure, respectively. The amount of phase shift (ϑ) is a function of fixed instrument properties such as cell length, mirror reflectivity and modulation frequency, and of the presence of aerosols (Kebabian et al., 2007). The term cotϑ0 is obtained from a periodic baseline measurement (using particle-free air). It is worth mentioning that the effective optical-path error in the sample cell of CAPS-ALB, which is caused by the purge airflow of the mirror limiting the space of the aerosol samples, has been initially corrected in the internal calculation process. The original correction factor was 0.7, close to the value reported by Onasch et al. (2015), which means that the effective optical-path error is generally calibrated with the Mie model calculation.
Our IBBCEAS device developed in-house was used to measure gas concentration in the NO2 comparison experiment (Chen and Venables, 2011). The IBBCEAS measures the light intensity change of the light source through the optical cavity, then inverts the concentration of the gaseous samples. When a pair of high-reflectivity plano-concave mirrors with a reflectivity of R are composed of an optical cavity with a length of L that is illuminated by continuous broadband incoherent light, the output light intensity I is equal to the sum of the output light intensity of each order. Combined with Lambert–Beer's law, the expression for extinction coefficient bext-CEAS at a measured wavelength is as follows (Fiedler et al., 2003; Ball et al., 2004):
Here, I0 is light intensity without absorbing matter, and σi and Ni are the absolute extinction cross section and concentration of species i. I0, I, R, σi and Ni are functions of wavelength. Therefore, for different detection wavelengths, the extinction coefficient cannot be compared directly. A simple method is to establish a relationship with the species concentration. Fitting the extinction cross section σi to the extinction coefficient (bext-CEAS), the concentration of the measured gas Ni can be inverted. Noting that the reflectivity R of the cavity mirrors in IBBCEAS has been calibrated before our experiments, so the result of IBBCEAS can be considered as absolute value.
The number size distribution for MIE model calculation was obtained from SMPS, which consists of an electrostatic classifier (Model3082, TSI, US) and a condensation particle counter (CPC) (Model 3750, TSI, US). The electrostatic classifier was used with a long differential mobility analyzer (LONG DMA) (Model 3081, TSI, US); its particle-size selection range is 14.1–736.5 nm, with a sample flow of 0.3 L min−1 and a sheath flow of 3 L min−1. The aerosol sample passes through the radioactive neutralizer to be charged, then enters the DMA to select particles of different particle sizes by changing the voltage. The number of selected particles is counted after the process of hygroscopic growth in CPC, which has an uncertainty of within ±10 % in measuring particle concentration (Petzold et al., 2013).
2.2 Experiment
Based on the above principles, we adopted the following experimental procedures to compare PAX and CAPS-ALB as Fig. 1 shows. The blue solid line represents the process of particle calibration, the red solid line represents the procedures of gas calibration. All joints have been leak tested to ensure tightness.
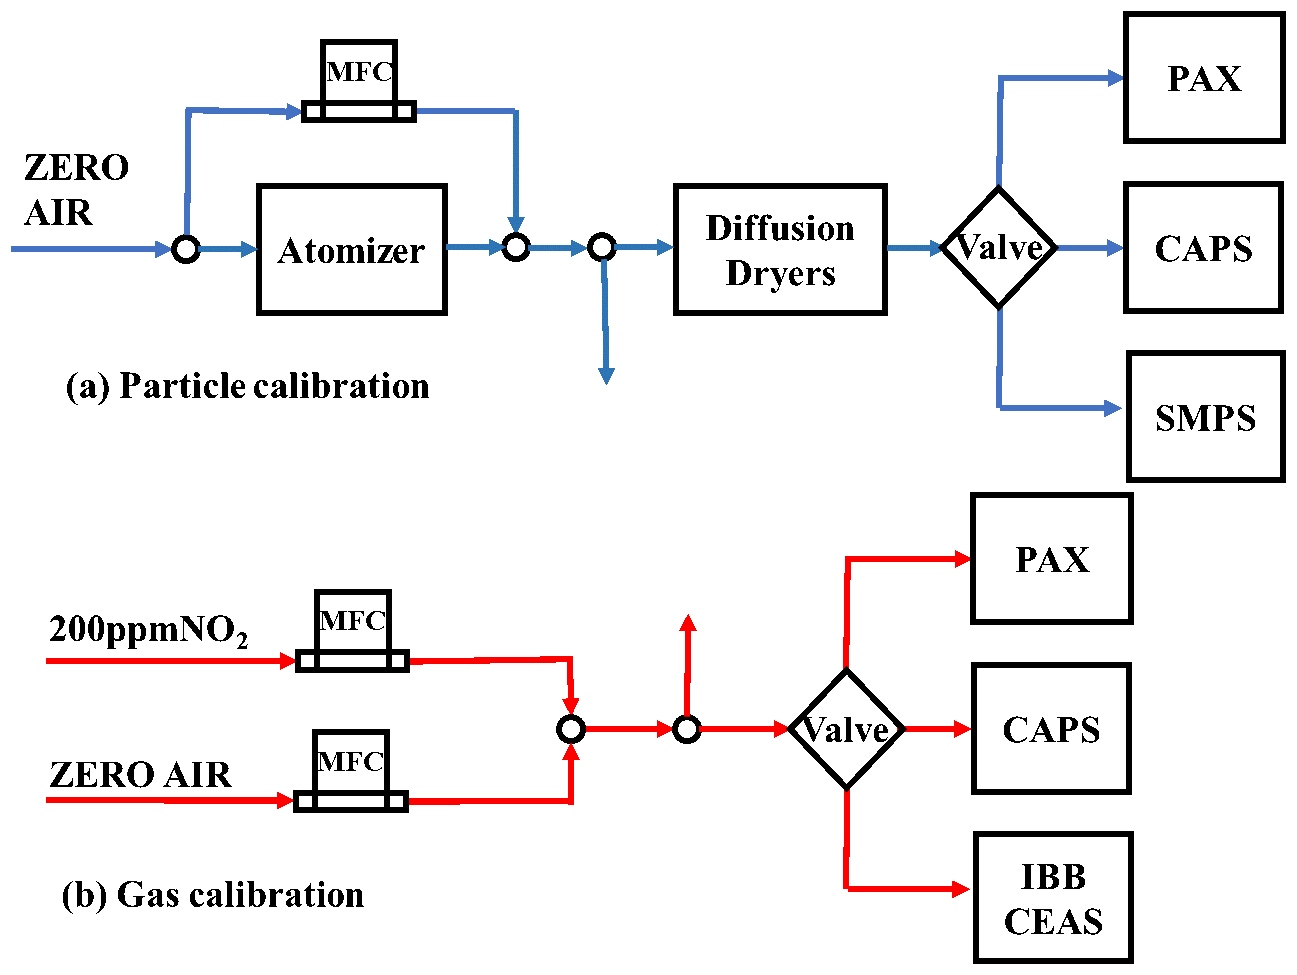
2.2.1 Particle calibration
For systematic errors, such as angle truncation, laboratory-generated nebulized ammonium sulfate (AS) (AR 99 %, Aladdin Chemical) aerosols were used to calibrate and test the nephelometers of CAPS-ALB and PAX using same experimental procedure as follows. An AS aqueous solution was nebulized by an atomizer (Model 9032, TSI, US) with filter air at a constant inlet pressure of 20 psi, which can generate a stable outlet flow rate of ∼5 L min−1. As shown by the blue solid line in Fig. 1a, the nebulized aerosol flow was diluted with filtered air to adjust its concentration and then dried using diffusion dryers with silica gel that reduced the sample RH to ∼ 10 % before delivery to the instruments, where the excess airflow was discharged by bypass. Only opening PAX or CAPS-ALB valves, the dry aerosol flow was connected to the instruments sampling port for at least ∼ 5 min until the measured value stabilized. The entire flow system used conductive silicone tubing and reduced bending to minimize the loss of particles during aerosol transportation. For high concentrations of non-absorbing AS aerosol with refractive index of 1.53+0.00i, the absorption effect can be ignored. Therefore, the scattering calibration factor () was calculated by comparing the measured extinction coefficient () and scattering coefficient () (Lewis et al., 2008; Cross et al., 2010).
For the purpose of estimating the scattering or extinction coefficients measured in the above experiments and further correcting the absolute total scattering (extinction) coefficient, we performed an additional calibration using polystyrene latex (PSL) spheres with a Mie model. This model is a rigorous analytical solution of the scattering field distribution of monochromatic light illuminated on spherical particles (Born and Wolf, 1999). Thus, assuming the particles to be round, it is considered feasible to apply the Mie model to retrieve the number size distribution for calculating the total scattering coefficient of atmospheric aerosol. The scattering and extinction efficiency factors Qsca and Qext can be calculated from the function of the particle complex refractive index, light source wavelength and size distribution (Wu et al., 2018; Bohren and Huffman, 1983). By integrating the particle cross-sectional area , particle number concentration N(D), and on the particle diameter D distribution, yields the calculated scattering and extinction coefficient as in the following expression:
The experiments incorporating mono-disperse PSL spheres with complex refractive index 1.60+0.00i and diameter of 350±6 nm (Thermo Scientific) were carried out following the calibration procedures of scattering calibration (replace PSL with AS). The SMPS valve was opened and the diluted dry aerosol flow was connected to the its sampling port and then continuously measured together with CAPS-ALB or PAX for ∼ 20 min to collect at least three sets of effective data of particle-size distribution at each concentration. By comparing the MIE calculated average with the measured value for multiple concentrations, the MIE model correction factor (, can be determined.
2.2.2 Gas calibration
As noted in previous studies (Arnott et al., 2000), the PAS resonator acoustic calibration used sufficiently high concentrations of absorbing gas to generate a huge absorption, so that the Rayleigh scattering was negligible. Therefore, our experiment adopted high concentrations of NO2 for absorption calibration and determined the absorption correction factor () from comparison of measured absorption () and extinction () coefficients without knowing NO2 concentration. In the case of only the PAX valve being opened, by diluting 200 ppm NO2 in different dilution ratios, the filtered air and NO2 mixture were introduced to PAX for ∼ 5 min, in which the flow of filtered air and NO2 were controlled by the mass flow controller to specified proportion, respectively. The entire flow system used Teflon tubes to minimize NO2 loss and contaminations, and a bypass was set to ensure the stability of the sample flow and pressure.
Subsequently, considering the possible particulate loss of CAPS-ALB calibration, IBBCEAS and CAPS-ALB were used to measure NO2 samples simultaneously to compare the measured extinction coefficient by gaseous calibration. This experiment was carried out based on the experimental procedure for PAX absorption calibration, through closing the PAX route and simultaneously opening the valves of CAPS and IBBCEAS. Based on the limitation of IBBCEAS the NO2 concentration was controlled below 1 ppm and each concentration was maintained for at least about 15 min until the measured value stabilized. The NO2 concentration measured by IBBCEAS and the NO2 extinction cross section from a previous study of Voigt et al. (2002) was multiplied at the CAPS-ALB detection wavelength. For reasonable comparison of the extinction coefficients of IBBCEAS and CAPS-ALB, the spectral resolution of two instruments needed to be synchronized. CAPS-ALB uses an LED as the light source and a 10 nm wide optical filter to define the measurement range, but its specific band range has not been found; here we presumed that to be 525–535 nm. Therefore, when calculating the extinction coefficient of IBBCEAS from measured NO2 concentration and its absorption cross section at the specific wavelength, the average value of the NO2 absorption cross section in the range of wavelength 525 to 535 nm was applied. Then the conversion result of the extinction coefficient (bext-CEAS) measured by IBBCEAS was obtained. Thus, the extinction correction factor () from comparison with IBBCEAS can be determined.
3.1 PAX calibration results
In our calibration experiments for PAX, with an assumption of linearity in calibration down to the detection limit of the instruments (Arnott et al., 2000), the high concentration of absorbing gas and scattering particles generated a huge absorption and scattering effect that weakened the interference of noise and corrected the response curve of the PAX photoacoustic resonator and nephelometer respectively.
Figure 2a shows the relationship between the absorption coefficient () and the extinction coefficient () in the NO2 measurement results. The slope of the fitted line in Fig. 2a, which represents , was determined to be 0.961 ± 0.019 with correlation factor R2∼0.985. The calibration result showed that the absorption measurement of PAX only needs slight correction and has high accuracy. Figure 2b presents typical correlation plots comparing the extinction coefficient from transmissivity () for AS samples (the black solid dot) and MIE model calculation () for PSL samples (the red solid dot) with the measured scattering coefficient () respectively in PAX scattering calibration, where the extinction and scattering are theoretically equivalent due to negligible absorption.
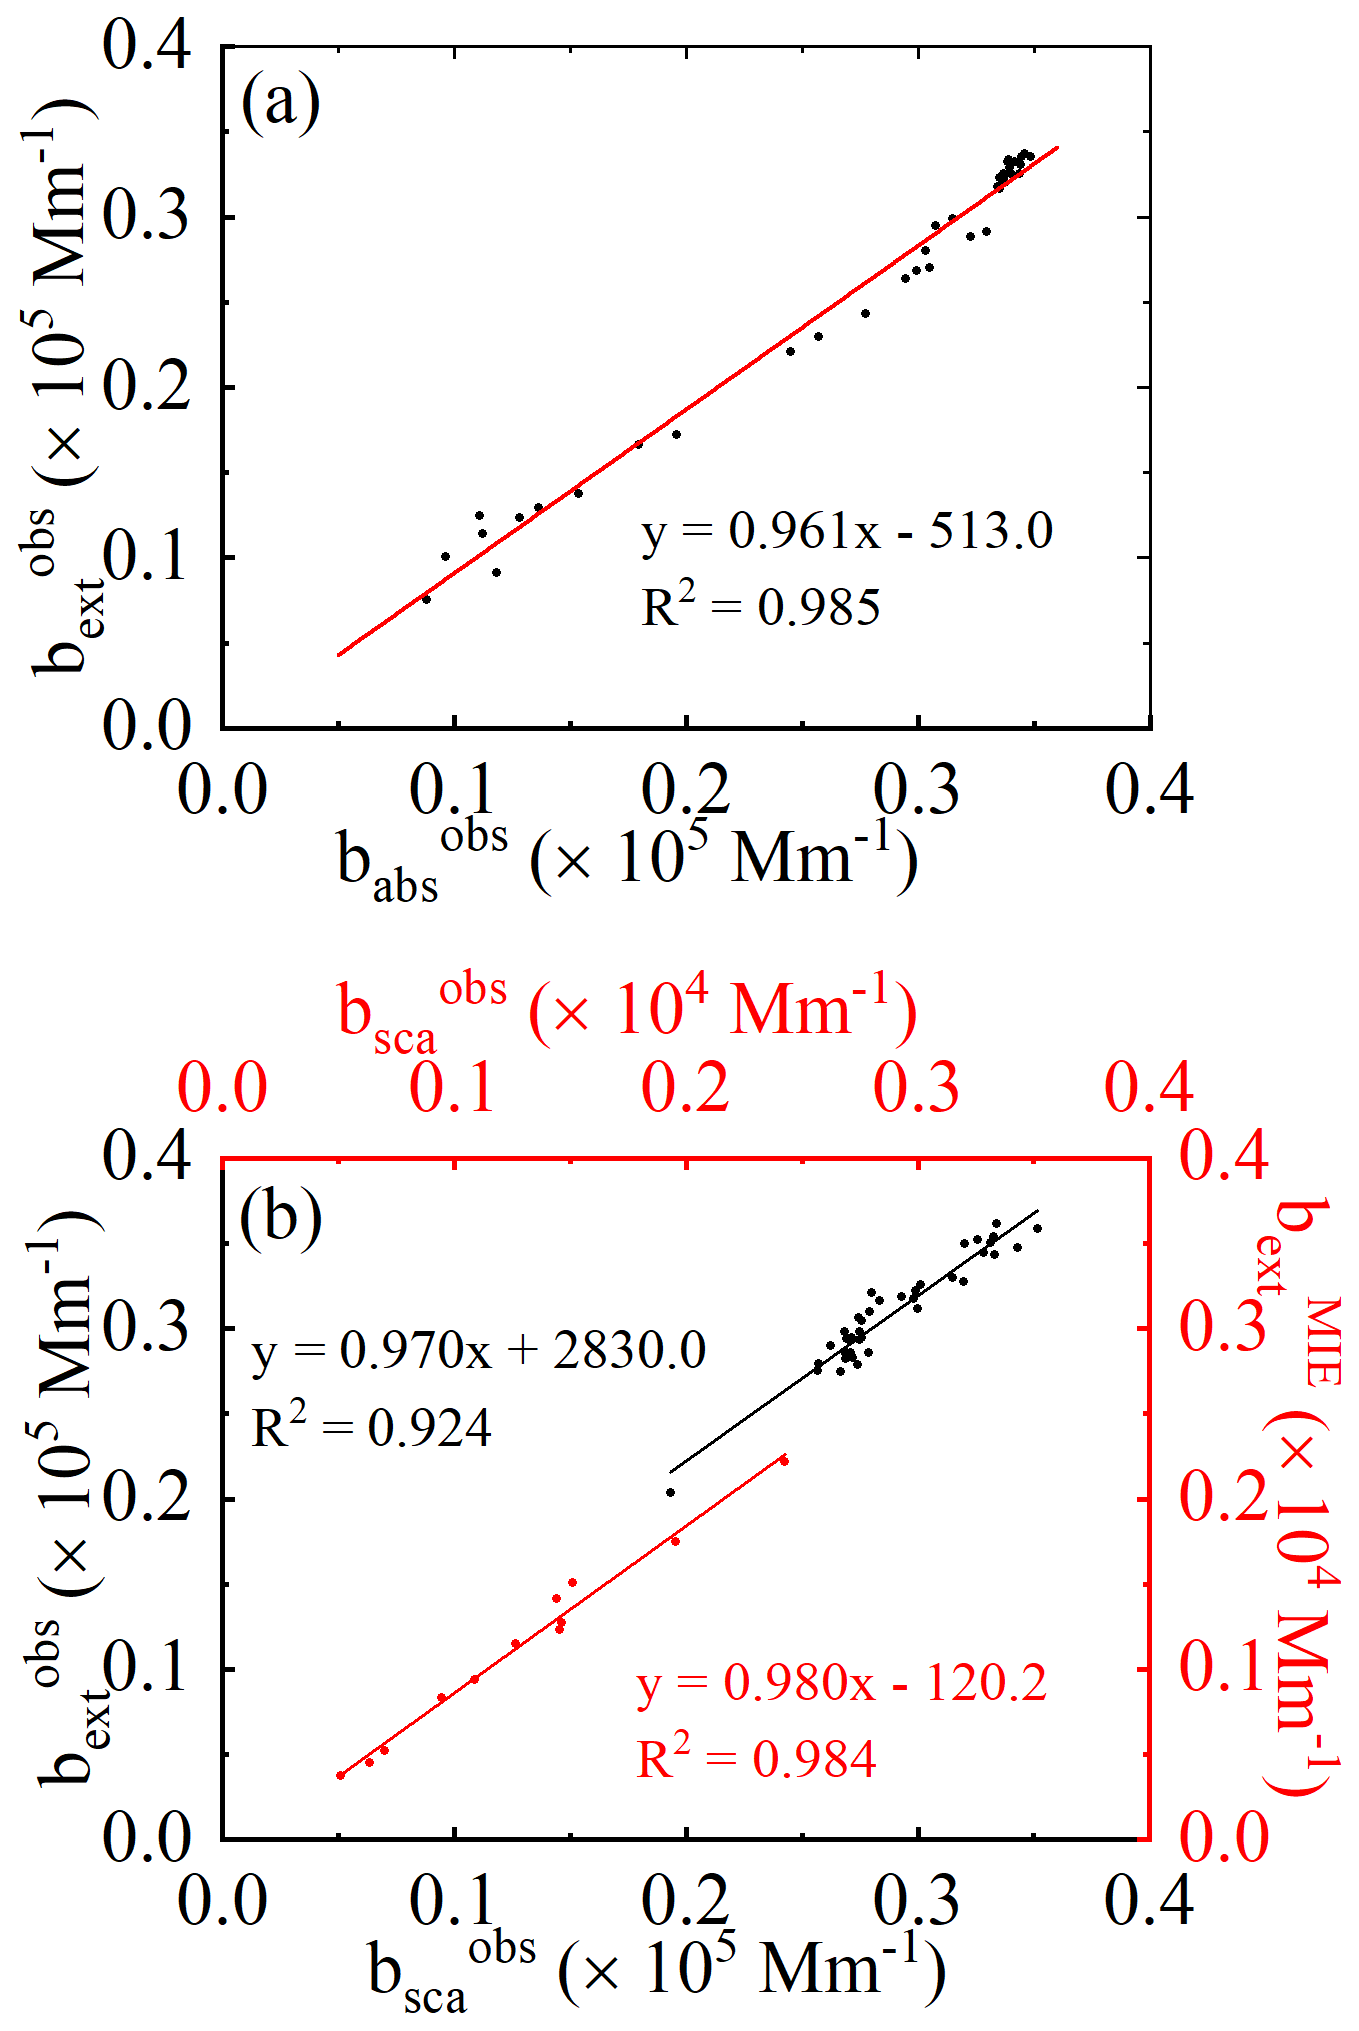
Figure 2PAX calibration results: (a) comparison of the measured extinction and absorption coefficient; (b) comparison of the measured and MIE model calculated extinction coefficient with the measured scattering coefficient.
In Fig. 2b, the slope of the black solid line indicates the measured scattering correction factor () that was determined to be 0.970 ± 0.046 with correlation factor R2∼0.924. Moreover, we calculated the absolute extinction coefficient with the MIE model for further correction. Here, limited by the detection range, another set of coordinates was used for comparison. The slope of the red solid line that indicates the MIE model scattering correction factor () was determined to be 0.980 ± 0.039 with correlation factor R2∼0.984. The scattering correction factors from transmission method and MIE model were within an acceptable range of the truncation error and had only ∼1 % discrepancy in a different measurement range, showing a good agreement between the two methods and the reliability of PAX scattering calibration result.
3.2 CAPS-ALB calibration results
In the CAPS-ALB calibration experiment, we first utilized PSL spheres to correct its extinction coefficient through an MIE model calculation and then employed AS samples to correct its scattering coefficient compared to the calibrated extinction coefficient. In addition, we used a self-developed experimental IBBCEAS device to further verify the correction factor calculated by the MIE model.
Figure 3a shows a correlation of extinction measured by CAPS-ALB () and extinction calculated by the MIE model () for 350 nm mono-disperse PSL spheres. The slope in Fig. 3a represents the extinction correction factor (), which was determined to be 0.983 ± 0.018 with correlation factor R2∼0.999. It shows that for the accuracy of the original calibration factor for the effective optical path error, only slight adjustment was required. Another factor that might affect the extinction calibration is the uncertainty of the aging effects of LEDs and detectors (PMT and vacuum photodiode), which have different effects according to cell geometry.
Correlation plots comparing scattering coefficient () and extinction coefficient () for AS samples measured by CAPS-ALB are shown in Fig. 3b. According to its linear fitting result, was determined to be 1.016 ± 0.002 with correlation factor R2∼0.996. It showed that the measured scattering coefficient has high accuracy and verified the reliability of extinction correction factor of CAPS-ALB ().
Figure 3c presents the comparison between the measured extinction coefficient of CAPS () and IBBCEAS () for NO2 samples. The slope of Fig. 3c shows the extinction correction factor (), which was determined to be 0.946 ± 0.007 with correlation factor R2∼0.998. The experimental correction factor of IBBCEAS () was consistent with the theoretical correction factor of the MIE model () within an acceptable error range of 4 %, proving the reliability of the MIE model calculation and the applicability of CAPS-ALB calibration, whether choosing calibration using standard gas bottles or standard particles.
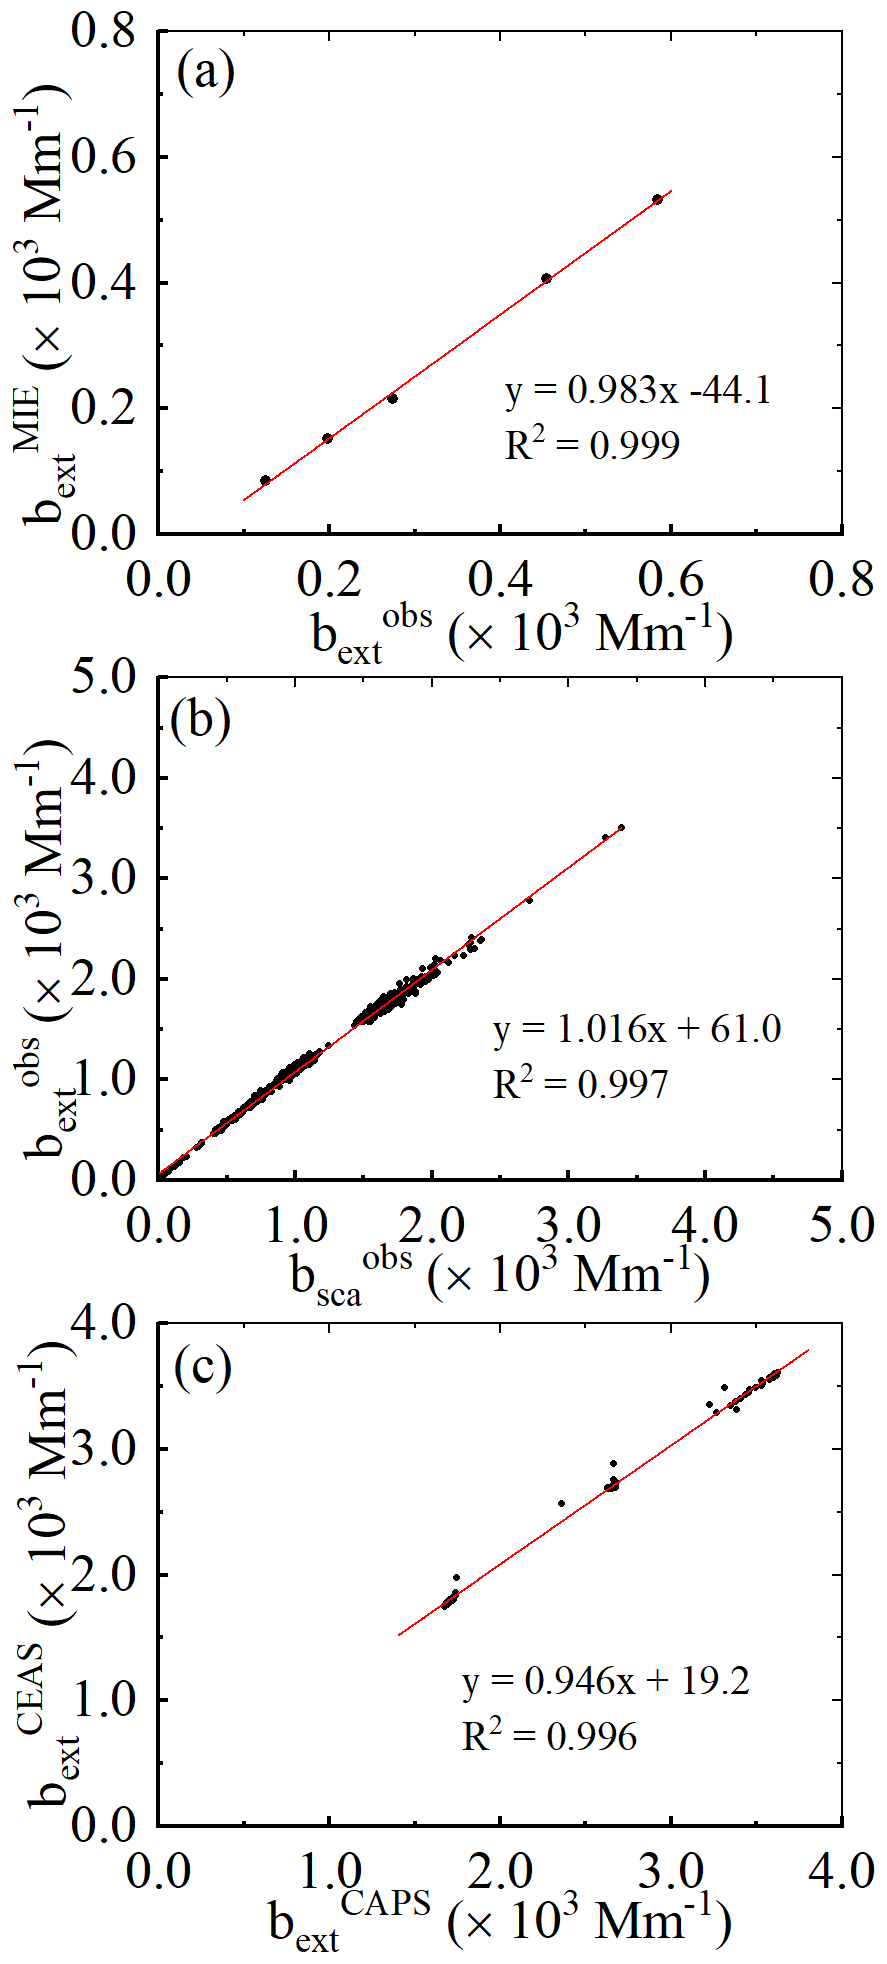
Figure 3CAPS-ALB calibration results: (a) comparison of the measured and MIE-calculated extinction coefficient; (b) comparison of the measured extinction and scattering coefficient; (c) comparison between measured extinction coefficient of CAPS-ALB and IBBCEAS.
3.3 Calibrated field measurement
The field measurements were carried out in the Gehu area of southwest Changzhou City, Jiangsu Province (31∘63′ N, 119∘90′ E), from 25 May to 27 June before the rainy season in 2019. Changzhou has a location in the center of the Yangtze River Delta and has a subtropical monsoon climate. The measurement site was surrounded by 60 % ecological wetlands and green gardens and 20 % territorial waters, which represent the regional ambient conditions of the Yangtze River Delta before the rainy season. The sampling point was located on the top floor of a building at the height of 15 m above ground, and all sampling tubes used a cyclone size cutter (URG, 2.5 µm, 5 L min−1).
The correction factor obtained from the laboratory calibration experiments was employed on the optical properties observed in the field measurement correspondingly. For comparison, the IMPROVE model was applied to identify aerosol light extinction contribution of major chemical components during field measurement. The IMPROVE model was established by analyzing the data from the long-term monitoring of aerosol mass concentration carried out in multi-site of the Inter-agency Monitoring of PROtected Visual Environments network in the United States. The IMPROVE model reconstructs extinction coefficient using the mass concentration of aerosol chemical components and their mass extinction efficiency, which has been used worldwide for estimating the aerosol extinction coefficient (Pitchford et al., 2007; Tao et al., 2014). The major chemical components in this study including water-soluble inorganic ions, organic carbon (OC) and elemental carbon (EC) were analyzed and quantified by a monitor for aerosols and gases in ambient air (MARGA) (ADI 2080, Metrohm, Switzerland) and an OC/EC analyzer (Model RT-4, Sunset, US). The simplified general formula of IMPROVE model used in reconstruction of total scattering (extinction) coefficient () can be expressed as follows (Xia et al., 2017):
where [X] represent the mass concentration of aerosol chemical component X, µg m−3; ammonium sulfate ; ammonium nitrate ; organic matter [OM] = 1.6 [OC]; Sea Salt [SS] = 1.8 [Cl−]; fine soil [FS] = 2.2 [Al] + 2.49 [Si] + 1.94 [Ti] + 1.63 [Ca] + 2.42 [Fe]; coarse mass [CM] = [PM10] − [PM2.5]; fs(RH), fL(RH) and fss represent RH growth curves of sulfate, nitrate and SS (Jung et al., 2009). Due to the lack of soil element information, Ca2+ was assumed to account for 5 % of the concentration of fine soil mass based on previous studies, thus [FS] = 20 [Ca2+] (Amato and Hopke, 2012).
Considering unavailable period of aerosol composition measurement (due to status of MARGA), only from 1 to 6 June were selected for the comparison. Figure 4a and b showed intercomparison of the measured extinction coefficient of PAX and CAPS-ALB with IMPROVE-calculated extinction coefficient, the linear fitting slopes are 1.182 and 1.183 with the correlation factor R2 of 0.807 and 0.824, respectively. Comparing the correlation factor, it is in good agreement with Shanghai (0.83) and Hangzhou (0.81) in previous studies (Wang et al., 2016). Thus, it can be concluded that the IMPROVE model has good applicability in Gehu area. Here, the extinction of PAX was the sum of the measured absorption and scattering. In addition, Fig. 4c showed a timing diagram of the extinction coefficient from PAX, CAPS-ALB measurement and IMPROVE model calculation. It showed a good agreement between the measured and theoretical value and proved the reliability of our measurement data.
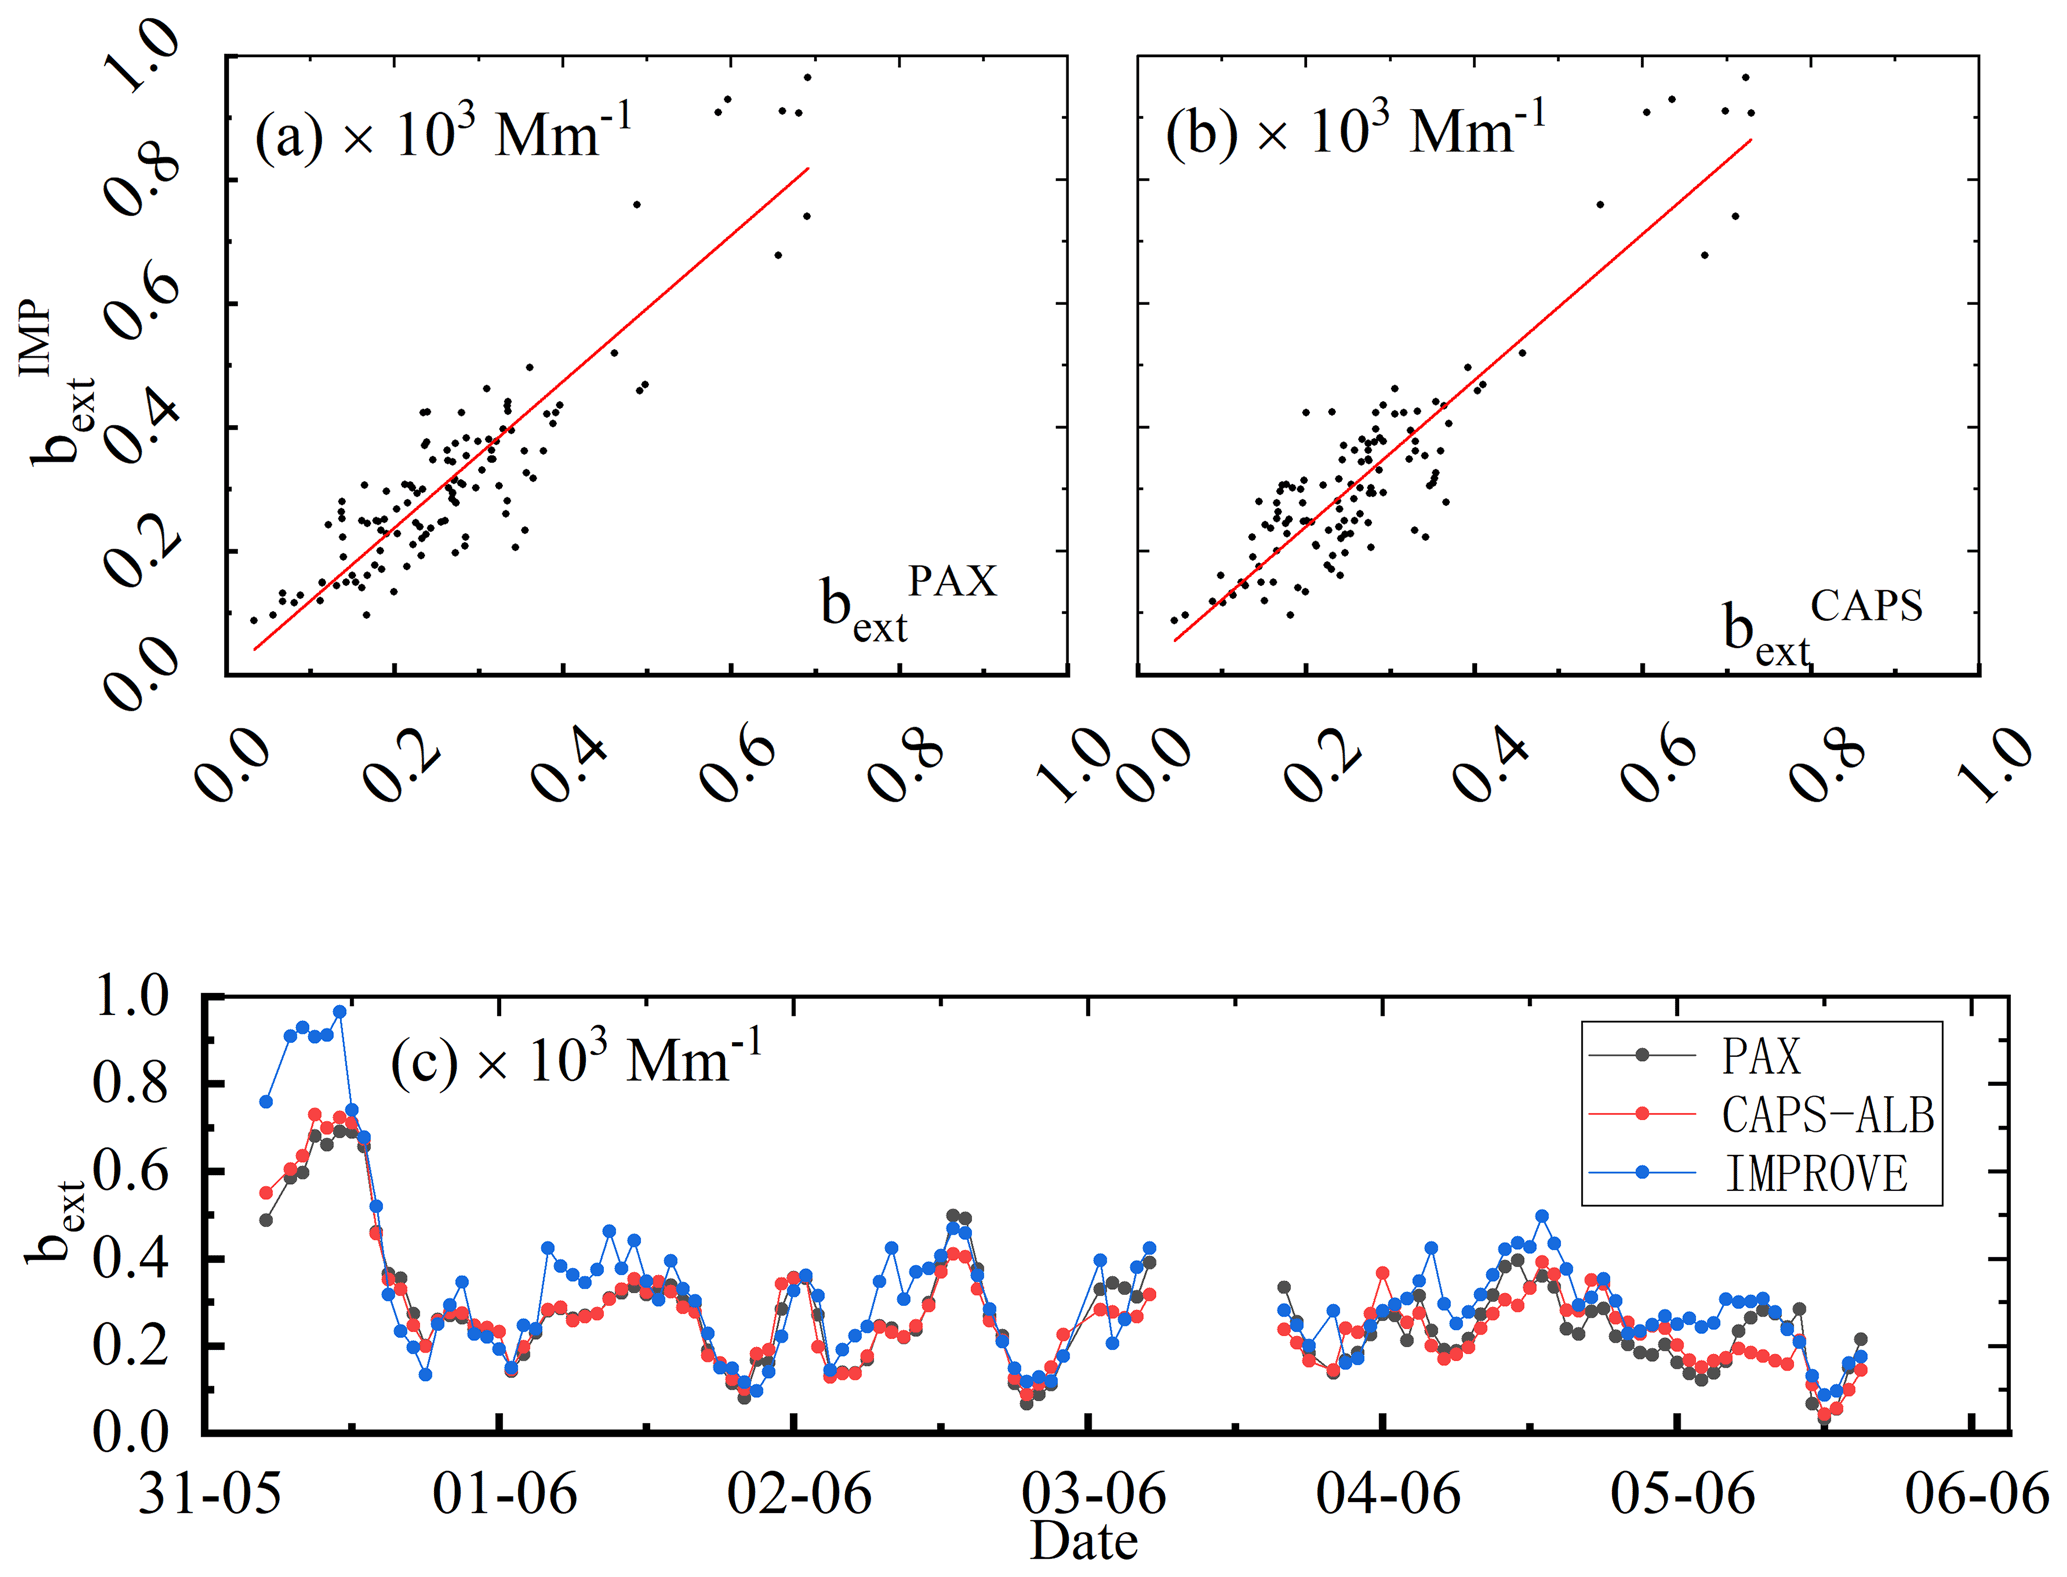
Figure 4Intercomparison of the measured extinction coefficient of (a) PAX and (b) CAPS-ALB with IMPROVE-calculated extinction coefficient during field measurement (1–6 June 2019), and (c) the timing diagram of the extinction coefficient from PAX, CAPS-ALB measurement and IMPROVE model calculation.
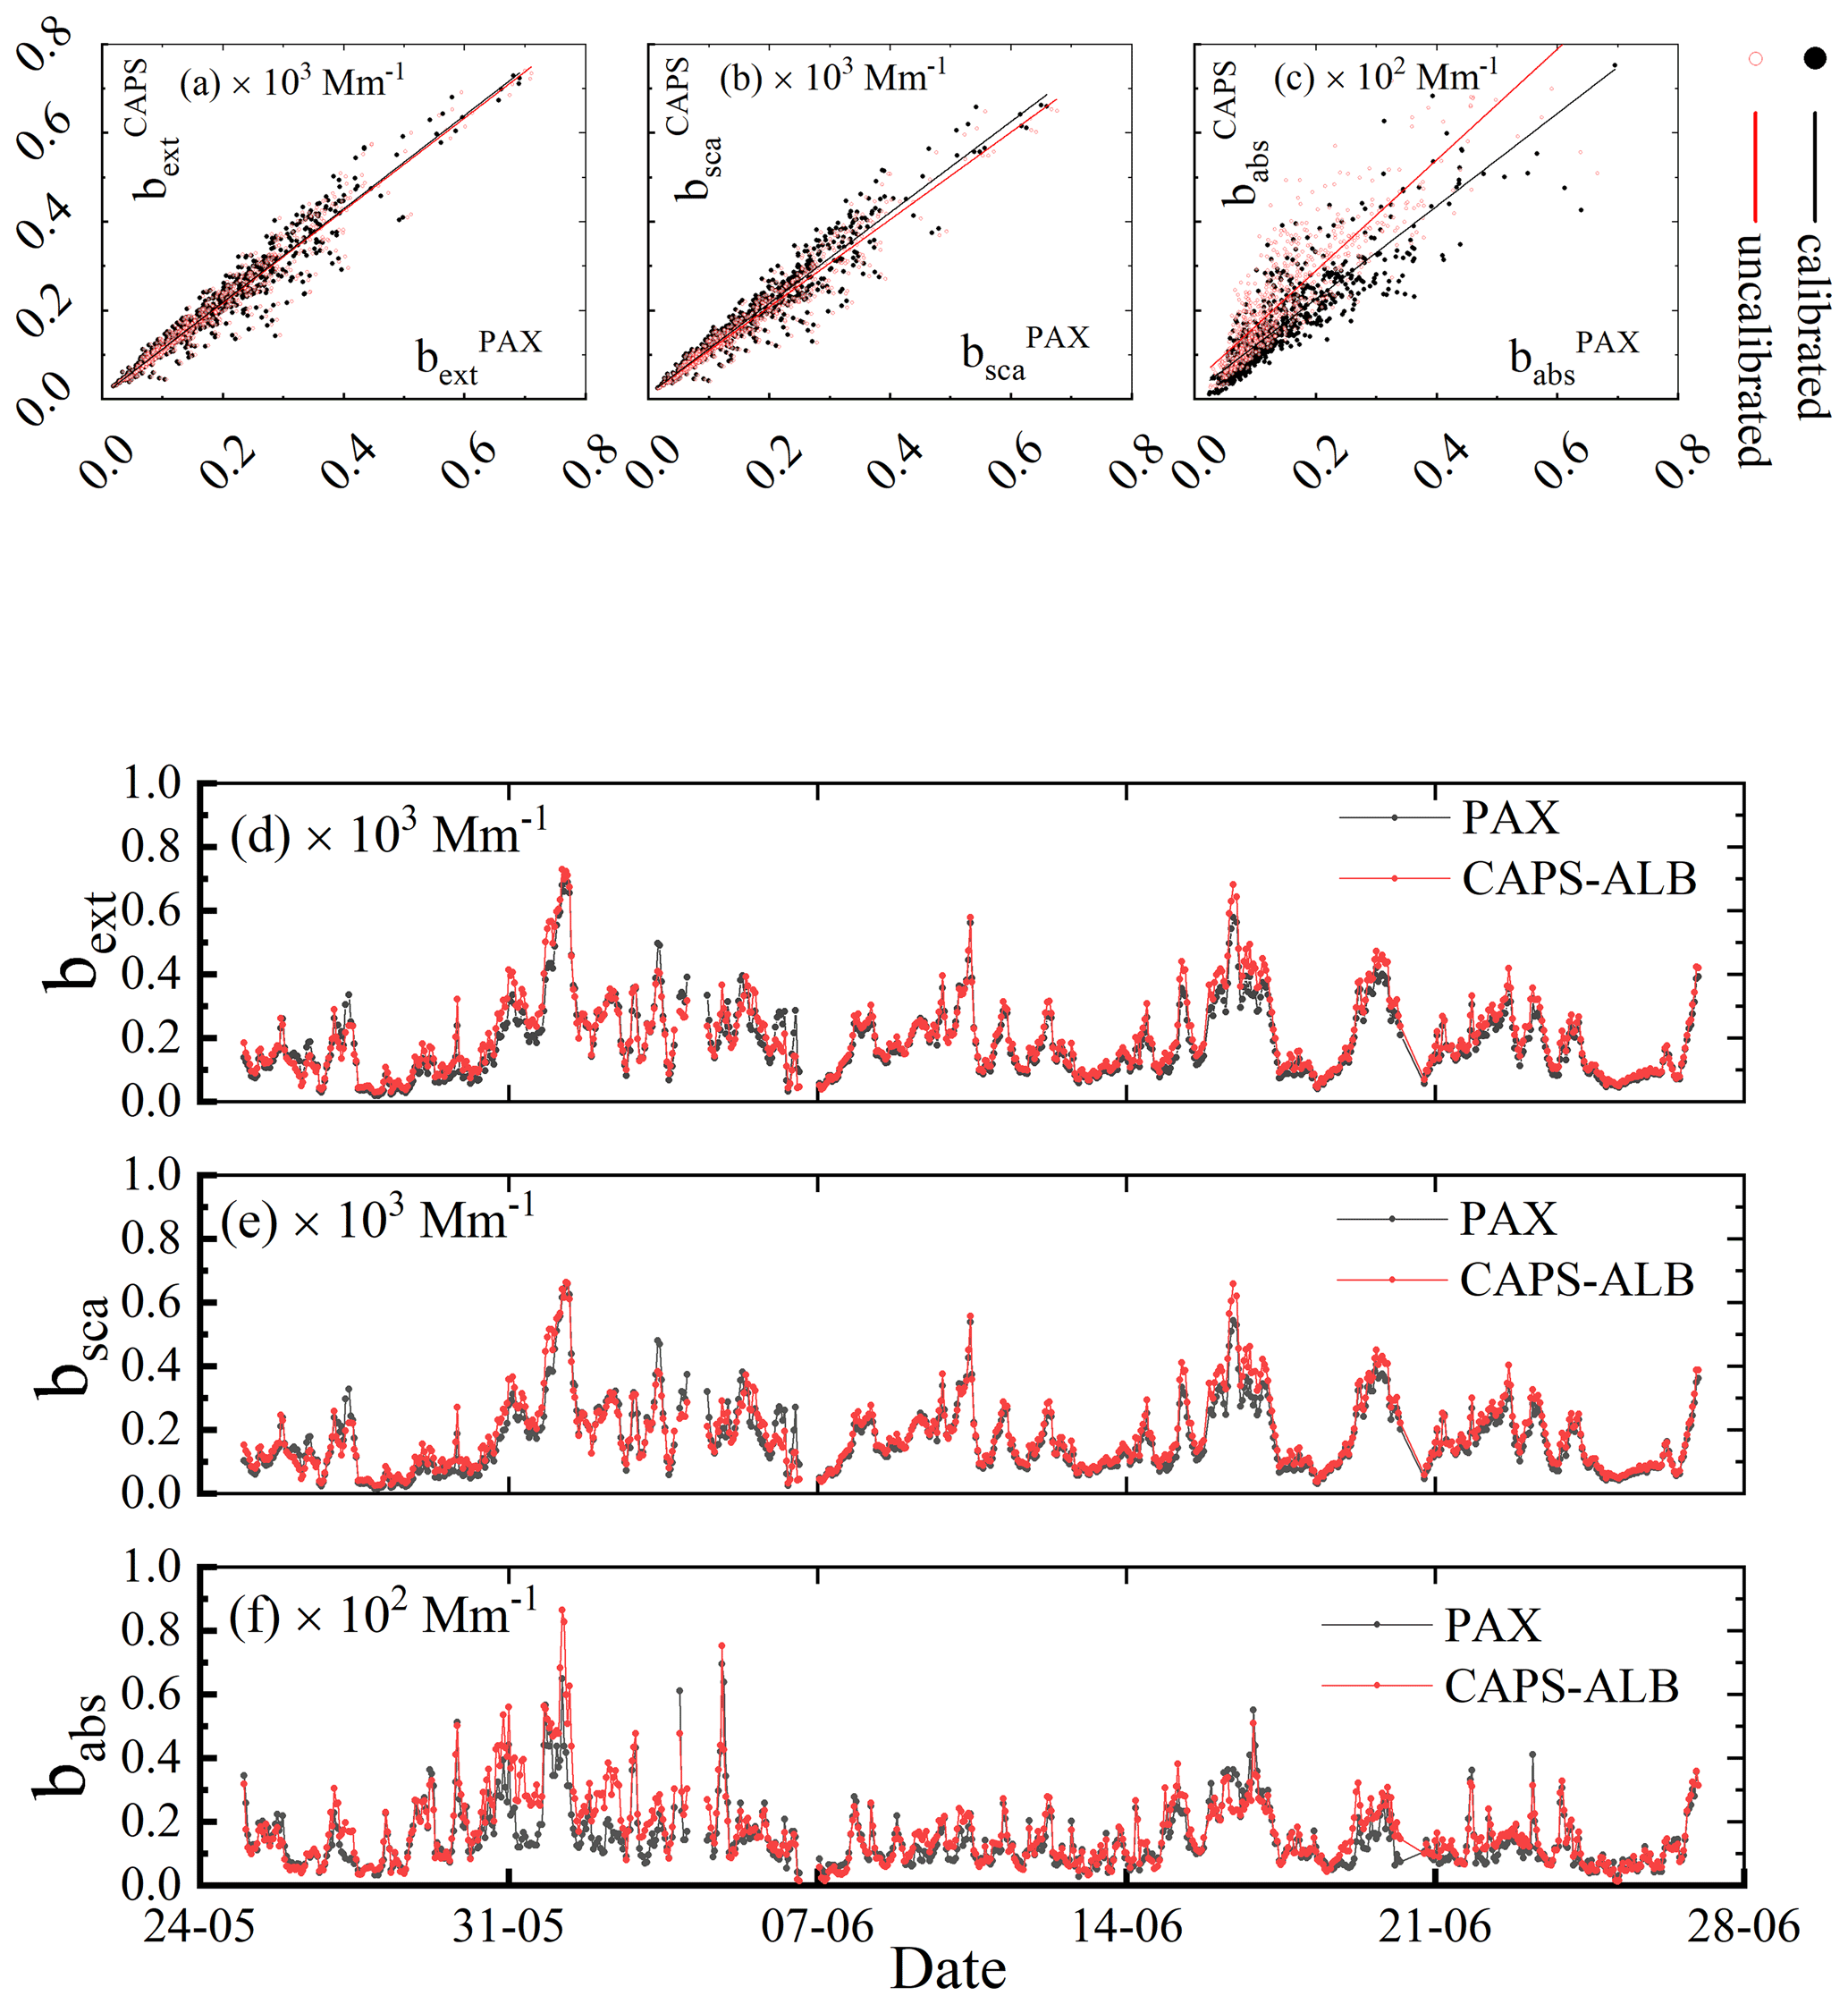
Figure 5Intercomparison of the CAPS-ALB and PAX (in the case of calibrated and uncalibrated) for (a) extinction, (b) scattering and (c) absorption coefficients during field measurement (From 25 May to 27 June), and the timing diagram of the calibrated (d) extinction, (e) scattering and (f) absorption coefficients of CAPS-ALB and PAX.
Then the CAPS-ALB and PAX corresponding optical properties of field measurement were compared respectively in the case of calibrated and uncalibrated as Fig. 5a, b and c showed. Here, the extinction coefficient of PAX has been mentioned above as well as the absorption of CAPS-ALB was the difference between the measured extinction and scattering. The linear fitting slope was 1.052, 1.024 and 1.046 from comparison of PAX and CAPS calibrated extinction, scattering and absorption coefficient, with the correlation factor R2 as 0.936, 0.924 and 0.772. Comparing the calibrated and uncalibrated results, only slight corrections existed in the extinction and scattering coefficients, while the discrepancy in the absorption coefficient has been corrected from ∼30 % to less than 5 %. It can be considered that the optical properties measured from PAX and CAPS-ALB with different measurement principles had a good agreement, which in turn proved the reliability of our laboratory calibration results and the closure correlation of CAPS-ALB and PAX measurements.
In addition, through deleting the time points of instruments data under zero calibration and abnormal working conditions, the overall trend of calibrated extinction, scattering and absorption coefficients during the measurement period (from 25 May to 27 June) were obtained as shown in Fig. 5d, e and f. For the aerosol optical properties of the measurement region, a dominant contribution of the scattering effect to the extinction coefficient and a low value for the absorption coefficient are shown.
The different internal structure of the nephelometers, even using the same principle, caused the slight difference in the measured scattering coefficient, while the relatively small amount of the absorption coefficient of CAPS-ALB derived from the extinction subtracted scattering coefficient has been greatly affected. Therefore, the absorption coefficient is difficult to quantify and was verified by CAPS-ALB by correcting the scattering coefficient and the relationship of optical properties.
In this work we carried out aerosol optical property inter-comparison measurements using photoacoustic and cavity attenuated phase shift instruments. The instruments were calibrated via laboratory experiments and the corrected field measurement data have also been intercompared. Thus, following points can be concluded:
-
The laboratory results showed that disagreements exist between the two instruments before calibration. The scattering coefficient part plays a crucial role as the bridge in constructing the correlation of both instruments. Then the corrected extinction and absorption coefficients from both instruments were in good agreement.
-
The intercomparison of calibrated absorption and extinction coefficients in a field measurement using photoacoustic and cavity attenuated phase shift instruments showed good agreement. Therefore, laboratory calibrations were used for corrections for ensuring the quality of field data and further analysis of radiative study.
The raw data from the experiments are available upon request (j.chen@usst.edu.cn).
Jialuo Zhang was in charge of data curation, methodology, formal analysis, visualization, and writing the original draft. Jun Chen was in charge of conceptualization, investigation, methodology, supervision and funding acquisition as well as writing, review and editing. Meng Wang performed the validation. Mingxu Su curated the data and performed the validation. Wu Zhou contributed to funding acquisition. Ravi Varma was in charge of investigation and methodology. Shengrong Lou was in charge of writing, review and editing as well as validation and supervision.
The authors declare that they have no conflict of interest.
Publisher’s note: Copernicus Publications remains neutral with regard to jurisdictional claims in published maps and institutional affiliations.
The authors were appreciate for the all field campaign members, especially for YingYing Du, YuCun Liu and Benty Chen.
This work was supported by the National Natural Science Foundation of China (grant nos. 91544225 and 51776129), the National Key Research and Development Program of China (grant nos. 2018YFC0213800 and 2017YFC0211500) and the Open Fund Project of State Key Laboratory of Loess and Quaternary Geology (SKLLQG).
This paper was edited by Ciro Apollonio and reviewed by two anonymous referees.
Abu-Rahmah, A., Arnott, W. P., and Moosmüller, H.: Integrating nephelometer with a low truncation angle and an extended calibration scheme, Meas. Sci. Technol., 17, 1723–1732, https://doi.org/10.1088/0957-0233/17/7/010, 2006.
Adams, K. M., Davis Jr., L. I., Japar, S. M., and Finley, D. R.: Real-time, in situ measurements of atmospheric optical absorption in the visible via photoacoustic spectroscopy. IV. Visibility degradation and aerosol optical properties in Los Angeles, Atmos. Environ. A-Gen., 24A, 605–610, https://doi.org/10.1016/0960-1686(90)90015-f, 1990.
Amato, F. and Hopke, P. K.: Source apportionment of the ambient PM2.5 across St. Louis using constrained positive matrix factorization, Atmos. Environ., 46, 329–337, https://doi.org/10.1016/j.atmosenv.2011.09.062, 2012.
Anderson, T. L. and Ogren, J. A.: Determining Aerosol Radiative Properties Using the TSI 3563 Integrating Nephelometer, Aerosol Sci. Tech., 29, 57–69, https://doi.org/10.1080/02786829808965551, 1998.
Anderson, T. L., Covert, D. S., Marshall, S. F., Laucks, M. L., Charlson, R. J., Waggoner, A. P., Ogren, J. A., Caldow, R., Holm, R. L., Quant, F. R., Sem, G. J., Wiedensohler, A., Ahlquist, N. A., and Bates, T. S.: Performance Characteristics of a High-Sensitivity, Three-Wavelength, Total Scatter/Backscatter Nephelometer, J. Atmos. Ocean. Tech., 13, 967, https://doi.org/10.1175/1520-0426(1996)013<0967:pcoahs>2.0.co;2, 1996.
Arnott, W. P., Moosmuller, H., Rogers, C. F., Jin, T. F., and Bruch, R.: Photoacoustic spectrometer for measuring light absorption by aerosol: instrument description, Atmos. Environ., 33, 2845–2852, 1999.
Arnott, W. P., Moosmüller, H., and Walker, J. W.: Nitrogen dioxide and kerosene-flame soot calibration of photoacoustic instruments for measurement of light absorption by aerosols, Rev. Sci. Instrum., 71, 4545, https://doi.org/10.1063/1.1322585, 2000.
Ball, S. M., Langridge, J. M., and Jones, R. L.: Broadband cavity enhanced absorption spectroscopy using light emitting diodes, Chem. Phys. Lett., 398, 68–74, https://doi.org/10.1016/j.cplett.2004.08.144, 2004.
Baynard, T., Lovejoy, E. R., Pettersson, A., Brown, S. S., Lack, D., Osthoff, H., Massoli, P., Ciciora, S., Dube, W. P., and Ravishankara, A. R.: Design and Application of a Pulsed Cavity Ring-Down Aerosol Extinction Spectrometer for Field Measurements, Aerosol Sci. Tech., 41, 447–462, https://doi.org/10.1080/02786820701222801, 2007.
Berden, G., Peeters, R., and Meijer, G.: Cavity ring-down spectroscopy: Experimental schemes and applications, Int. Rev. Phys. Chem., 19, 565–607, https://doi.org/10.1080/014423500750040627, 2010.
Beuttell, R. G., and Brewer, A. W.: Instruments for the Measurement of the Visual Range, J. Sci. Instrum., 26, 357–359, https://doi.org/10.1088/0950-7671/26/11/302, 1949.
Bohren, C. F. and Huffman, D. R.: Absorption and scattering of light by small particles, Cambridge University Press, Cambridge, 1983.
Bond, T. C., Anderson, T. L., and Campbell, D.: Calibration and Intercomparison of Filter-Based Measurements of Visible Light Absorption by Aerosols, Aerosol Sci. Tech., 30, 582–600, https://doi.org/10.1080/027868299304435, 1999.
Born, M. and Wolf, E.: Principles of Optics: Electromagnetic Theory of Propagation, Interference and Diffraction of Light, 7th Edn., Cambridge University Press, Cambridge, 1999.
Bruce, C. W. and Pinnick, R. G.: In-situ measurements of aerosol absorption with a resonant cw laser spectrophone, Appl. Optics, 16, 1762, https://doi.org/10.1364/ao.16.001762, 1977.
Chen, J. and Venables, D. S.: A broadband optical cavity spectrometer for measuring weak near-ultraviolet absorption spectra of gases, Atmos. Meas. Tech., 4, 425–436, https://doi.org/10.5194/amt-4-425-2011, 2011.
Cross, E. S., Onasch, T. B., Ahern, A., Wrobel, W., Slowik, J. G., Olfert, J., Lack, D. A., Massoli, P., Cappa, C. D., Schwarz, J. P., Spackman, J. R., Fahey, D. W., Sedlacek, A., Trimborn, A., Jayne, J. T., Freedman, A., Williams, L. R., Ng, N. L., Mazzoleni, C., Dubey, M., Brem, B., Kok, G., Subramanian, R., Freitag, S., Clarke, A., Thornhill, D., Marr, L. C., Kolb, C. E., Worsnop, D. R., and Davidovits, P.: Soot Particle Studies –Instrument Inter-Comparison – Project Overview, Aerosol Sci. Tech., 44, 592–611, https://doi.org/10.1080/02786826.2010.482113, 2010.
Du, Y. Y., Chen, J., Zhang, J. L., Gan, G. C., Liu, Y. C., Su, M. X., Lou, S. R., Zhou, M., Tao, S. K., and Qiao, L. P.: [Observation of Aerosol Optical Properties and New Particle Formation in the Yangtze River Delta], Huan Jing Ke Xue, 41, 3932–3940, https://doi.org/10.13227/j.hjkx.201911271, 2020.
Ensor, D. S. and Waggoner, A. P.: Angular truncation error in the integrating nephelometer, Atmos. Environ., 4, 481–487, https://doi.org/10.1016/0004-6981(70)90018-1, 1970.
Fiedler, S. E., Hese, A., and Ruth, A. A.: Incoherent broad-band cavity-enhanced absorption spectroscopy, Chem. Phys. Lett., 371, 284–294, https://doi.org/10.1016/s0009-2614(03)00263-x, 2003.
Ge, B., Sun, Y., Liu, Y., Dong, H., Ji, D., Jiang, Q., Li, J., and Wang, Z.: Nitrogen dioxide measurement by cavity attenuated phase shift spectroscopy (CAPS) and implications in ozone production efficiency and nitrate formation in Beijing, China, J. Geophys. Res.-Atmos., 118, 9499–9509, https://doi.org/10.1002/jgrd.50757, 2013.
Hansen, A. D. A., Rosen, H., and Novakov, T.: Real-time measurement of the absorption coefficient of aerosol particles, Appl. Optics, 21, 3060, https://doi.org/10.1364/ao.21.003060, 1982.
Haywood, J. M. and Shine, K. P.: The effect of anthropogenic sulfate and soot aerosol on the clear sky planetary radiation budget, Geophys. Res. Lett., 22, 603–606, https://doi.org/10.1029/95gl00075, 1995.
Heintzenberg, J. and Charlson, R. J.: Design and Applications of the Integrating Nephelometer: A Review, J. Atmos. Ocean. Tech., 13, 987, https://doi.org/10.1175/1520-0426(1996)013<0987:daaoti>2.0.co;2, 1996.
Heintzenberg, J., Wiedensohler, A., Tuch, T. M., Covert, D. S., Sheridan, P., Ogren, J. A., Gras, J., Nessler, R., Kleefeld, C., Kalivitis, N., Aaltonen, V., Wilhelm, R. T., and Havlicek, M.: Intercomparisons and aerosol calibrations of 12 commercial integrating nephelometers of three manufacturers, J. Atmos. Ocean. Tech., 23, 902–914, https://doi.org/10.1175/jtech1892.1, 2006.
Herbelin, J. M. and McKay, J. A.: Development of laser mirrors of very high reflectivity using the cavity-attenuated phase-shift method, Appl. Optics, 20, 3341–3344, https://doi.org/10.1364/ao.20.003341, 1981.
Horvath, H.: Atmospheric light absorption – A review, Atmos. Environ. A-Gen., 27, 293–317, https://doi.org/10.1016/0960-1686(93)90104-7, 1993.
Horvath, H.: Experimental calibration for aerosol light absorption measurements using the integrating plate method – Summary of the data, J. Aerosol Sci., 28, 1149–1161, https://doi.org/10.1016/S0021-8502(97)00007-4, 1997.
Jung, J., Lee, H., Kim, Y. J., Liu, X., Zhang, Y., Gu, J., and Fan, S.: Aerosol chemistry and the effect of aerosol water content on visibility impairment and radiative forcing in Guangzhou during the 2006 Pearl River Delta campaign, J. Environ. Manage., 90, 3231–3244, https://doi.org/10.1016/j.jenvman.2009.04.021, 2009.
Kebabian, P. L., Herndon, S. C., and Freedman, A.: Detection of Nitrogen Dioxide by Cavity Attenuated Phase Shift Spectroscopy, Anal. Chem., 77, 724–728, https://doi.org/10.1021/ac048715y, 2005.
Kebabian, P. L., Robinson, W. A., and Freedman, A.: Optical extinction monitor using cw cavity enhanced detection, Rev. Sci. Instrum., 78, 0631021–0631029, https://doi.org/10.1063/1.2744223, 2007.
Lack, D. A., Lovejoy, E. R., Baynard, T., Pettersson, A., and Ravishankara, A. R.: Aerosol Absorption Measurement using Photoacoustic Spectroscopy: Sensitivity, Calibration, and Uncertainty Developments, Aerosol Sci. Tech., 40, 697–708, https://doi.org/10.1080/02786820600803917, 2006.
Lewis, K., Arnott, W. P., Moosmüller, H., and Wold, C. E.: Strong spectral variation of biomass smoke light absorption and single scattering albedo observed with a novel dual-wavelength photoacoustic instrument, J. Geophys. Res., 113, https://doi.org/10.1029/2007jd009699, 2008.
Massoli, P., Kebabian, P. L., Onasch, T. B., Hills, F. B., and Freedman, A.: Aerosol Light Extinction Measurements by Cavity Attenuated Phase Shift (CAPS) Spectroscopy: Laboratory Validation and Field Deployment of a Compact Aerosol Particle Extinction Monitor, Aerosol Sci. Tech., 44, 428–435, https://doi.org/10.1080/02786821003716599, 2010.
Moosmüller, H., Arnott, W. P., Rogers, C. F., Chow, J. C., Frazier, C. A., Sherman, L. E., and Dietrich, D. L.: Photoacoustic and filter measurements related to aerosol light absorption during the Northern Front Range Air Quality Study (Colorado 1996/1997), J. Geophys. Res.-Atmos., 103, 28149–28157, https://doi.org/10.1029/98jd02618, 1998.
Müller, T., Nowak, A., Wiedensohler, A., Sheridan, P., Laborde, M., Covert, D. S., Marinoni, A., Imre, K., Henzing, B., Roger, J.-C., dos Santos, S. M., Wilhelm, R., Wang, Y.-Q., and de Leeuw, G.: Angular Illumination and Truncation of Three Different Integrating Nephelometers: Implications for Empirical, Size-Based Corrections, Aerosol Sci. Tech., 43, 581–586, https://doi.org/10.1080/02786820902798484, 2009.
Nakayama, T., Suzuki, H., Kagamitani, S., Ikeda, Y., Uchiyama, A., and Matsumi, Y.: Characterization of a Three Wavelength Photoacoustic Soot Spectrometer (PASS-3) and a Photoacoustic Extinctiometer (PAX), J. Meteorol. Soc. Jpn. Ser. II, 93, 285–308, https://doi.org/10.2151/jmsj.2015-016, 2015.
O'Keefe, A. and Deacon, D. A. G.: Cavity ring-down optical spectrometer for absorption measurements using pulsed laser sources, Rev. Sci. Instrum., 59, 2544–2551, https://doi.org/10.1063/1.1139895, 1988.
Onasch, T. B., Massoli, P., Kebabian, P. L., Hills, F. B., Bacon, F. W., and Freedman, A.: Single Scattering Albedo Monitor for Airborne Particulates, Aerosol Sci. Tech., 49, 267–279, https://doi.org/10.1080/02786826.2015.1022248, 2015.
Penner, J. E., Hegg, D., and Leaitch, R.: Peer Reviewed: Unraveling the role of aerosols in climate change, Environ. Sci. Technol., 35, 332A–340A, https://doi.org/10.1021/es0124414, 2001.
Pettersson, A., Lovejoy, E. R., Brock, C. A., Brown, S. S., and Ravishankara, A. R.: Measurement of aerosol optical extinction at with pulsed cavity ring down spectroscopy, J. Aerosol Sci., 35, 995–1011, https://doi.org/10.1016/j.jaerosci.2004.02.008, 2004.
Petzold, A. and Schönlinner, M.: Multi-angle absorption photometry – a new method for the measurement of aerosol light absorption and atmospheric black carbon, J. Aerosol Sci., 35, 421–441, https://doi.org/10.1016/j.jaerosci.2003.09.005, 2004.
Petzold, A., Onasch, T., Kebabian, P., and Freedman, A.: Intercomparison of a Cavity Attenuated Phase Shift-based extinction monitor (CAPS PMex) with an integrating nephelometer and a filter-based absorption monitor, Atmos. Meas. Tech., 6, 1141–1151, https://doi.org/10.5194/amt-6-1141-2013, 2013.
Pitchford, M., Maim, W., Schichtel, B., Kumar, N., Lowenthal, D., and Hand, J.: Revised algorithm for estimating light extinction from IMPROVE particle speciation data, J. Air Waste Manag., 57, 1326–1336, https://doi.org/10.3155/1047-3289.57.11.1326, 2007.
Rosencwaig, A.: Photoacoustic spectroscopy, Annu. Rev. Biophys. Bioeng., 9, 31–54, https://doi.org/10.1146/annurev.bb.09.060180.000335, 1980.
Schwartz, S. E., Charlson, R. J., Kahn, R. A., Ogren, J. A., and Rodhe, H.: Why Hasn't Earth Warmed as Much as Expected?, J. Climate, 23, 2453–2464, https://doi.org/10.1175/2009jcli3461.1, 2010.
Sharma, N., Arnold, I. J., Moosmüller, H., Arnott, W. P., and Mazzoleni, C.: Photoacoustic and nephelometric spectroscopy of aerosol optical properties with a supercontinuum light source, Atmos. Meas. Tech., 6, 3501–3513, https://doi.org/10.5194/amt-6-3501-2013, 2013.
Strawa, A. W., Castaneda, R., Owano, T., Baer, D. S., and Paldus, B. A.: The Measurement of Aerosol Optical Properties Using Continuous Wave Cavity Ring-Down Techniques, J. Atmos. Ocean. Tech., 20, 454–465, https://doi.org/10.1175/1520-0426(2003)20<454:tmoaop>2.0.co;2, 2003.
Suhail, K., George, M., Chandran, S., Varma, R., Venables, D. S., Wang, M., and Chen, J.: Open path incoherent broadband cavity-enhanced measurements of NO3 radical and aerosol extinction in the North China Plain, Spectrochim. Acta A, 208, 24–31, https://doi.org/10.1016/j.saa.2018.09.023, 2019.
Tao, J., Zhang, L., Ho, K., Zhang, R., Lin, Z., Zhang, Z., Lin, M., Cao, J., Liu, S., and Wang, G.: Impact of PM2.5 chemical compositions on aerosol light scattering in Guangzhou – the largest megacity in South China, Atmos. Res., 135–136, 48–58, https://doi.org/10.1016/j.atmosres.2013.08.015, 2014.
Terhune, R. W. and Anderson, J. E.: Spectrophone measurements of the absorption of visible light by aerosols in the atmosphere, Opt. Lett., 1, 70–72, https://doi.org/10.1364/ol.1.000070, 1977.
Varma, R., Moosmller, H., and Arnott, W. P.: Toward an ideal integrating nephelometer, Opt. Lett., 28, 1007, https://doi.org/10.1364/ol.28.001007, 2003.
Varma, R. M., Ball, S. M., Brauers, T., Dorn, H.-P., Heitmann, U., Jones, R. L., Platt, U., Pöhler, D., Ruth, A. A., Shillings, A. J. L., Thieser, J., Wahner, A., and Venables, D. S.: Light extinction by secondary organic aerosol: an intercomparison of three broadband cavity spectrometers, Atmos. Meas. Tech., 6, 3115–3130, https://doi.org/10.5194/amt-6-3115-2013, 2013.
Voigt, S., Orphal, J., and Burrows, J. P.: The temperature and pressure dependence of the absorption cross-sections of NO2 in the 250–800 nm region measured by Fourier-transform spectroscopy, J. Phototech. Photobio. A, 149, 1–7, https://doi.org/10.1016/s1010-6030(01)00650-5, 2002.
Wang, J., Zhang, Y.-F., Feng, Y.-C., Zheng, X.-J., Jiao, L., Hong, S.-M., Shen, J.-D., Zhu, T., Ding, J., and Zhang, Q.: Characterization and source apportionment of aerosol light extinction with a coupled model of CMB-IMPROVE in Hangzhou, Yangtze River Delta of China, Atmos. Res., 178–179, 570–579, https://doi.org/10.1016/j.atmosres.2016.05.009, 2016.
Weingartner, E., Saathoff, H., Schnaiter, M., Streit, N., Bitnar, B., and Baltensperger, U.: Absorption of light by soot particles: determination of the absorption coefficient by means of aethalometers, J. Aerosol Sci., 34, 1445–1463, https://doi.org/10.1016/s0021-8502(03)00359-8, 2003.
Wu, C., Wu, D., and Yu, J. Z.: Quantifying black carbon light absorption enhancement with a novel statistical approach, Atmos. Chem. Phys., 18, 289–309, https://doi.org/10.5194/acp-18-289-2018, 2018.
Xia, Y., Tao, J., Zhang, L., Zhang, R., Li, S., Wu, Y., Cao, J., Wang, X., Ma, Q., and Xiong, Z.: Impact of size distributions of major chemical components in fine particles on light extinction in urban Guangzhou, Sci. Total Environ., 587–588, 240–247, https://doi.org/10.1016/j.scitotenv.2017.02.127, 2017.
Zhao, W., Xu, X., Dong, M., Chen, W., Gu, X., Hu, C., Huang, Y., Gao, X., Huang, W., and Zhang, W.: Development of a cavity-enhanced aerosol albedometer, Atmos. Meas. Tech., 7, 2551–2566, https://doi.org/10.5194/amt-7-2551-2014, 2014.