the Creative Commons Attribution 4.0 License.
the Creative Commons Attribution 4.0 License.
 | 24 Nov 2022
Upgrade of LSA-SAF Meteosat Second Generation daily surface albedo (MDAL) retrieval algorithm incorporating aerosol correction and other improvements
Isabel F. Trigo
Sandra Gomes
Sandra C. Freitas
MDAL is the operational Meteosat Second Generation (MSG)-derived daily surface albedo product that has been generated and disseminated in near real time by EUMETSAT Satellite Application Facility for Land Surface Analysis (LSA-SAF) since 2005. We propose and evaluate an update to the MDAL retrieval algorithm which introduces the accounting for aerosol effects as well as other scientific developments: pre-processing recalibration of radiances acquired by the SEVIRI instrument aboard MSG and improved coefficients for atmospheric correction as well as for albedo conversion from narrow- to broadband. We compare the performance of MDAL broadband albedos pre- and post-upgrade with respect to three types of reference data: the EPS Ten-Day Albedo product ETAL is used as the primary reference, while albedo derived from in situ flux measurements acquired by ground stations and MODIS MCD43D albedo data are used to complete the validation. For the comparison to ETAL – conducted over the whole coverage area of SEVIRI – we see a reduction in average white-sky albedo mean bias error (MBE) from −0.02 to negligible levels (<0.001) and a reduction in average mean absolute error (MAE) from 0.034 to 0.026 (−24 %). Improvements can be seen for black-sky albedo as well, albeit less pronounced (14 % reduction in MAE). Further analysis distinguishing individual seasons, regions and land covers show that performance changes have spatial and temporal dependence: for white-sky albedo we see improvements over almost all regions and seasons relative to ETAL, except for Eurasia in winter; resolved by land cover we see a similar effect with improvements for all types for all seasons except winter, where some types exhibit slightly worse results (crop-, grass- and shrublands). For black-sky albedo we similarly see improvements for all seasons when averaged over the full data set, although sub-regions exhibit clear seasonal dependence: the performance of the upgraded MDAL version is generally diminished in local winter but better in local summer. The comparison with in situ observations is less conclusive due to the well-known problem of the spatial representativeness of near-ground observations with respect to satellite pixel footprint sizes. Comparison with MODIS at the same locations shows mixed results in terms of change in performance following the proposed upgrade but proves the good quality of the MDAL products in general. Based on the evidence presented in this study, we consider the updated algorithm version to be able to deliver a valuable improvement of the operational MDAL product. This improvement is two-fold: primarily, there is the refinement of the albedo values themselves; secondarily, the increased alignment with the ETAL product is beneficial for those who wish to exploit synergies between EUMETSAT's geostationary and polar satellites to generate data sets based on the LSA-SAF albedo products from the two different missions.
- Article
(15218 KB) - Full-text XML
- BibTeX
- EndNote


Land surface albedo, the ratio of upward to downward solar radiation, is a key component of the Earth's surface radiation budget relevant in various research and operational fields and has been declared an essential climate variable by GCOS (the Global Climate Observing System). It is needed, for example, in physical models of the atmosphere that incorporate energy balance (e.g., weather prediction or climate models) or can be used for land cover monitoring to track processes such as deforestation and desertification (e.g., Dirmeyer and Shukla, 1994; Becerril-Piña et al., 2016; Wu et al., 2019). Satellite-based land surface albedo retrievals, in particular, play a crucial role in this context as they are available with high spatial coverage at a continental or global scale.
The European Organisation for the Exploitation of Meteorological Satellites (EUMETSAT) operates two satellite missions that are used as a basis for land surface albedo products: the geostationary Meteosat mission (consisting of a series of satellites with the same name) and the polar-orbiting EUMETSAT Polar System (EPS; comprising the Metop satellite series). For exploiting its missions' observations, EUMETSAT oversees a network of Satellite Application Facilities (SAFs) of which the Satellite Application Facility for Land Surface Analysis (LSA-SAF; Trigo et al., 2011) is responsible for the generation of surface albedo as part of a wide range of land surface variables.
In this capacity, the LSA-SAF generates a Meteosat albedo product, MDAL, which is a near real-time product disseminated daily with a timeliness of 3 h (hours). The product is based on multi-spectral radiance measurements made by SEVIRI, mounted on the Meteosat Second Generation (MSG) satellite series (Meteosat satellites 8, 9, 10 and 11). As MSG is a satellite system in geostationary orbit, the satellites' location relative to Earth (and the field of view of the Earth's surface) do not change over time, yielding two static areas of coverage: the primary 0∘ Service (currently served by Meteosat-11; see Fig. 1) covering an area centered at 0∘ longitude and 0∘ latitude (which includes all of Europe and Africa), and the Indian Ocean Data Coverage Service (IODC), which is served by Meteosat-8 located over the Equator at 41∘ E (an IODC albedo product is currently generated and made available on a best-effort basis). Both of these fields of view cover a “disk”-like area extending about 80∘ in either direction from the sub-satellite point. MDAL is used for various research purposes (e.g., Ghilain et al., 2011; Cedilnik et al., 2012; García et al., 2013) as well as as the base for several derived operational LSA-SAF products, such as evapotranspiration and vegetation parameters (Arboleda et al., 2017; García-Haro et al., 2005). The original MDAL product (MDAL v1 hereafter) has been available since 2005, with few changes to the retrieval algorithm (see Sect. 2.1).
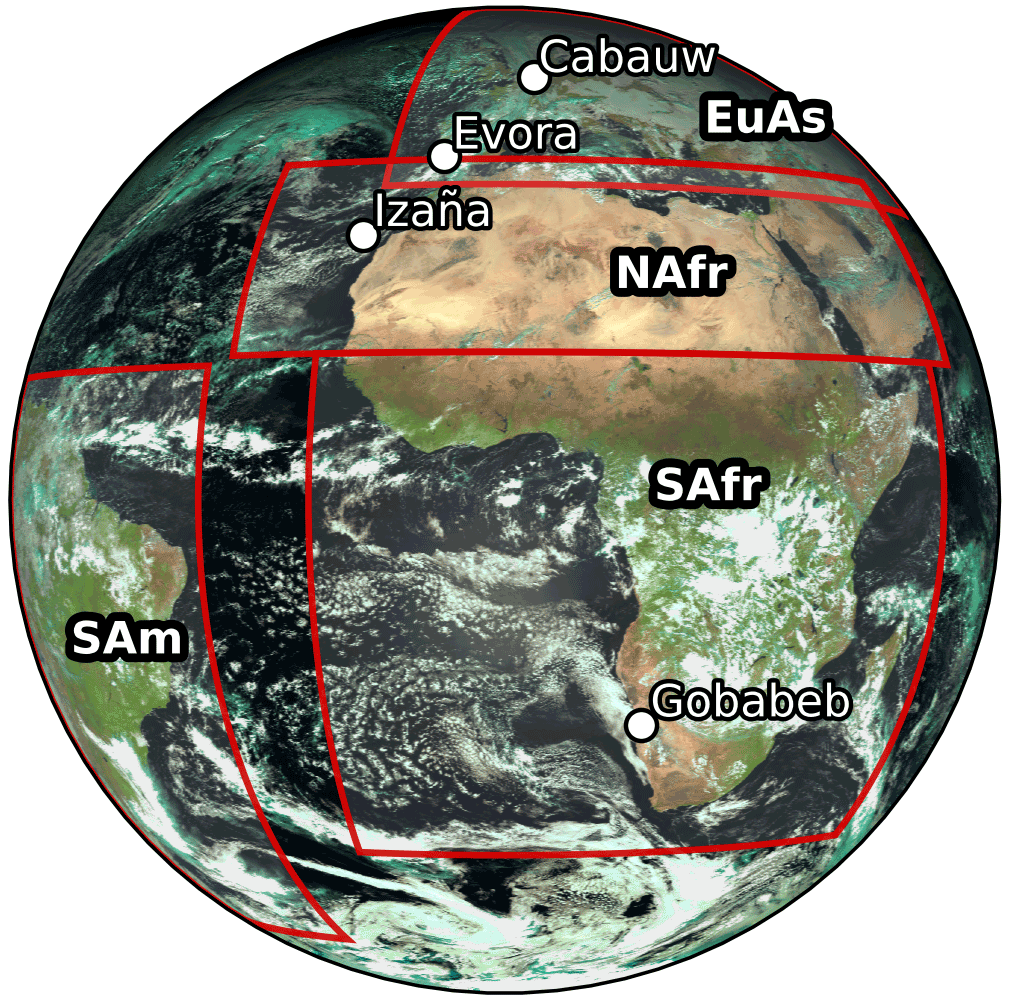
Figure 1False color MSG SEVIRI image showing the region of primary coverage (“full disk”). Red boxes outline the sub-regions used for analysis (EuAs: Eurasia; NAfr: northern Africa; SAfr: sub-Saharan Africa; SAm: South America); white circles indicate locations of in situ stations. Image from 19 December 2020.
In this paper, we propose an update of the MDAL retrieval process (MDAL v2 hereafter), which introduces accounting for aerosol effects as well as several further changes aimed at improving albedo estimates. For validation, we compare the performance of MDAL v2 to that of v1 using three different reference data sets: satellite-derived EPS Ten-Day Albedo (ETAL), ground station measurements from different locations in Africa and Europe, and MODIS MCD43D albedo for the same locations. In all cases we use data spanning 1 full year to account for seasonal variations. The objective of this study is to use this validation to provide justification and scientific background for the update of the retrieval algorithm in the LSA-SAF operational processing chain as well as to inform users about the extent to which it would cause changes to MDAL results. Abbreviations used in this paper are summarized and explained in Appendix A1.
2.1 MDAL v1: current retrieval algorithm
MDAL is an operational daily surface albedo product based on SEVIRI images of the section of Earth's surface seen from the MSG orbital position at 15 min intervals, with a ground resolution of 3 km × 3 km at nadir, with pixel sizes increasing away from the center. MDAL is based on a mature retrieval algorithm described in Geiger et al. (2008), which can be summarized as follows:
-
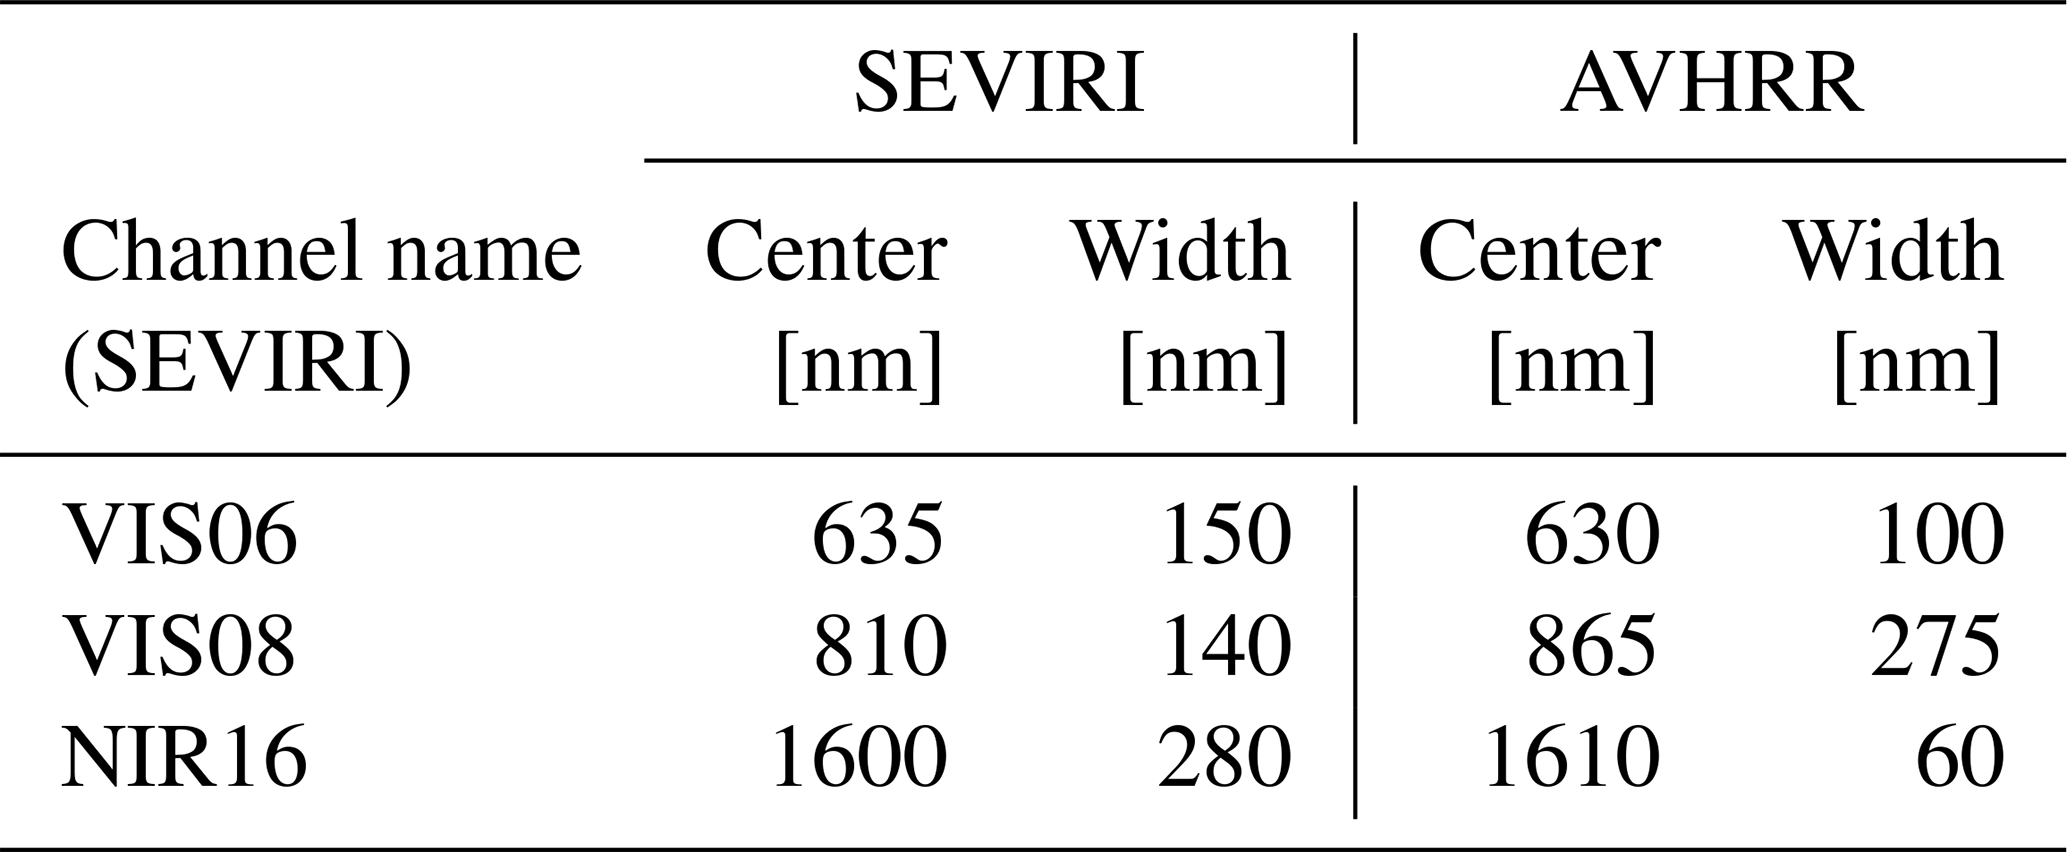
ingest SEVIRI radiances for visible and near-infrared channels (central wavelength – VIS06: 0.6 µm; VIS08: 0.8 µm; NIR16: 1.6 µm);
-
mask cloudy pixels (based on cloud mask provided by the NWC (nowcasting) SAF);
-
correct radiances for atmospheric effects using SMAC (Simplified Method for Atmospheric Correction; Rahman and Dedieu, 1994) to obtain top-of-canopy (TOC) reflectances. SMAC performs an efficient correction for the different interactions between solar radiation and atmospheric constituents such as gases and, if included, aerosols;
-
accumulate TOC reflectances over 1 d (day) and then calculate parameters of the bidirectional reflectance distribution function (BRDF; Roujean model; see Roujean et al., 1992, for specifics) for that day;
-
perform angular integration of BRDF to obtain spectral albedos, both white-sky albedo (also bi-hemispherical, BH, reflectance) and black-sky albedo (or directional–hemispherical, DH, reflectance);
-
perform spectral integration to obtain broadband albedo (full solar spectrum, visible- and near-infrared spectrum; see Appendix, Sect. A3, and Liang, 2001, for reference).
Additionally, the algorithm employs a Kalman filter to propagate the BRDF parameters in time to be used as a priori information in future retrievals. This step helps to avoid data gaps and to stabilize the results.
MDAL has previously been validated against the MODIS-based surface albedo product (MODIS is the imaging spectroradiometer onboard NASA's Terra and Aqua satellites; the corresponding albedo retrieval algorithm is developed by the MODIS Land Science Team), with satisfactory results (Carrer et al., 2010). The MDAL product suite contains several albedo variables, consisting of broadband albedo (obtained in step 6 above) as well as single-channel albedos (obtained in step 5) and variances for each data set. Our analysis is focused on the two full solar spectrum albedo products, white-sky albedo (product variable AL-BB-BH) and black-sky albedo (product variable AL-BB-DH), which are the MDAL variables that are required by most land surface and weather forecast models.
2.2 Proposed upgrade to MDAL v2
One shortcoming in MDAL v1 is the lack of correction for aerosol effects, i.e., their contribution to attenuation (scattering and absorption) of incoming solar radiation in the atmosphere, thus ignoring a major physical effect. Simply speaking, their omission results in attenuation that takes place in the atmosphere being misattributed to the surface, leading to a bias in estimated surface reflectance. This bias can take the form of underestimation over bright surfaces or overestimation over dark surfaces, essentially depending on whether surface reflectivity is higher or lower than aerosol reflectivity. The reason for the previous exclusion of aerosol correction was the difficulty in obtaining acceptable processing results when they were integrated, mainly due to the lack of reliable input data on aerosol optical depth (AOD, the quantity used to measure atmospheric aerosol content). Indeed, previous tests using climatological (i.e., long-term averaged) AOD values showed a degraded quality of the estimated albedo compared to no aerosol compensation. Because the situation regarding available aerosol data has significantly improved in recent years, however, this shortcoming can now be addressed.
It is notable that the previous omission of aerosol effects in the processing did not result in obviously recognizable flaws in albedo estimates. In fact, after a preliminary update of the algorithm to include aerosol effects we found (a) no actual improvement of the albedo estimates with respect to reference values and (b) an introduction of unrealistic values in some regions of high solar or view zenith angles.

Figure 2Long-term average aerosol optical depth (AOD) used in MDAL v2 processing, based on CAMS reanalysis (monthly values, linearly interpolated between the 15th of each month to obtain daily values). (a) Full-disk AOD for 15 July. (b) Histograms of full-disk AOD fields for the 15th of each month.
As for point (a), we think that this lack of improvement may be due to an interplay of the aerosol omission and other sources of error (possibly attenuating each other's effects), which is why we decided on a comprehensive update, adding the effect of aerosols but further implementing three other scientific improvements: SEVIRI radiance bias correction and updating SMAC as well as narrow- to broadband conversion coefficients. The details are as follows:
-
Incorporation of aerosol effects. Thanks to work done within the framework of the Copernicus Atmosphere Monitoring Service (CAMS), reliable climatological AOD estimates have been made available, since 2017, as part of the CAMS reanalysis suite (CAMSRA; Inness et al., 2019). In MDAL v2 we incorporate monthly AOD based on averages (the lower tercile to be precise, to avoid overcorrection of AOD) of CAMSRA AOD from the time period of 2003 to 2012, linearly interpolated for each day (see Fig. 2 as an example). We chose reanalysis AOD over AOD forecasts based on the findings of Ceamanos et al. (2014): their experiments with respect to retrieval of LSA-SAF downwelling surface shortwave flux (DSSF) suggest the reanalysis AOD to be preferable due to biases introduced into DSSF estimates when using CAMS AOD forecasts. The capability for incorporating aerosol effects in the MDAL processing chain already existed as part of SMAC, only previously AOD had been set to be 0 for all pixels. The new AOD inputs are the same as the ones used for other LSA-SAF products (e.g., ETAL; see Lellouch et al., 2020).
-
SEVIRI bias correction. Meirink et al. (2013) investigated the bias of SEVIRI shortwave channels with respect to comparable bands of MODIS based on regression analysis of collocated near-nadir reflectance measurements. They found negative biases for the two visible channels and a positive bias for the near-infrared channel. Based on their findings the authors publish calibration slopes (https://msgcpp.knmi.nl/solar-channel-calibration.html, last access: 17 February 2022) which can be used to calculate recalibration coefficients for a given point in time. We extract the coefficients for the time interval used for validation (November 2020 to October 2021) and apply them in MDAL v2 to adjust the input radiance values. The resulting adjustments are as follows for each channel: VIS06 – +10 %; VIS08 – +6 %; NIR16 – −4 %. We expect this change to generally lead to increased albedo estimates. According to Ceamanos et al. (2021), including bias correction provided improved AOD retrievals from SEVIRI.
-
Updated SMAC coefficients. SMAC is a simplified method to compensate for atmospheric effects in satellite data based on the more complex but computationally prohibitive 6S radiative transfer algorithm (Vermote et al., 1997). For SMAC to work, 6S results have to be calculated only once (for a given sensor), and the results are used to fit the equations used for parametrization in SMAC. The coefficients obtained as a result of this fitting can then be used for the SMAC correction of individual images, using the same equations. A vector version of 6S, 6SV1, was developed by Kotchenova et al. (2006), enabling accounting for the effect of radiation polarization, among other improvements. MDAL v2 uses the re-calculated SMAC coefficients based on 6SV1 (as do other, more recently updated LSA-SAF albedo products such as ETAL), while MDAL v1 uses 6S.
-
Updated narrow- to broadband conversion coefficients. The narrow- to broadband conversion in the MDAL retrieval algorithm involves a set of conversion coefficients which are estimated by using synthetic albedos which were generated with the SAIL (Scattering by Arbitrary Inclined Leaves; Verhoef, 1984) canopy reflectance model for different surface types (for more details on the procedure, see Sect. 2.5.2 in Carrer et al., 2021). The database of synthetic spectral reflectances used to calculate albedos has been updated to include a more exhaustive set of vegetation and bare-soil surfaces and has been used to obtain conversion coefficients for MDAL v2 (values of coefficients are given in the Appendix, Table A2). The same updated database has been used for other LSA-SAF albedo products (e.g., ETAL), as well.
Regarding point (b) mentioned above, i.e., the occurrence of unrealistic values in situations of extreme solar or viewing geometry, we assert that this is due to known limitations of SMAC (limited reliability at high solar and view zenith angles; see Rahman and Dedieu, 1994; Proud et al., 2010). Those limitations are amplified, in particular in the outer region of the SEVIRI disk, leading to unrealistic values with errors increasing as a function of view zenith angle, solar zenith angle and aerosol optical depth. We mitigate those effects by limiting the solar zenith angles that are taken into account for each retrieval and by discarding obviously unphysical values after the atmospheric correction step. More precisely, in MDAL v2 we
-
exclude observations with solar zenith angles above 80∘ (instead of 85∘ as used before),
-
discard negative TOC reflectances after atmospheric correction, and
-
discard TOC reflectances above 1.5 (previous upper limit was 3.2768, for numerical reasons).
It should be noted that the reduction in solar zenith angles from 85∘ to 80∘ leads to a (minor) loss of coverage at high latitudes in winter.
3.1 Data to evaluate: MDAL
For the analysis we use a full year of MDAL data, both for v1 and v2, spanning from 1 November 2020 to 31 October 2021. The data cover the full disk observed by MSG primary coverage (Meteosat-11 centered at 0∘/0∘, with coverage to approximately 80∘ N, S, E, W). Both experiments are based on the retrieval algorithm outlined in Sect. 2.1, with MDAL v2 incorporating the changes described in Sect. 2.2. Both MDAL v1 and v2 are initialized with the same starting conditions, i.e., the same a priori BRDF parameters ingested by the Kalman filter. This implies that during the first weeks, the MDAL v2 results will have a bias towards MDAL v1 due to the memory of the Kalman filter. This effect disappears with time.

Figure 3Broadband bi-hemispherical (BB-BH) albedo of MDAL v1, MDAL v2 and resampled ETAL. Date: 15 April 2021.
The data have a temporal resolution of 1 d, and the grid spacing is 3 km at Nadir and increases towards the disk's edge. Albedo maps of both MDAL versions are shown in Fig. 3a, b.
3.2 Reference data 1: ETAL
ETAL, short for EPS Ten-Day Albedo, is a global near real-time operational albedo product generated by the LSA-SAF since 2015. ETAL is based on observations made by the AVHRR instrument aboard the primary Metop satellite (currently Metop-B), which is part of the EUMETSAT Polar System (EPS). The Metop satellites are polar orbiting at an altitude of around 830 km, and their AVHRR sensors provide images with a ground resolution of approximately 1 km × 1 km. The data are collected into daily global images, which in turn are accumulated over a 20 d composite window (the longer time window when compared to MDAL is necessary to compensate for the lower temporal resolution – one per day – of polar-orbiting satellites compared to geostationary satellites). A global albedo product is generated approximately every 10 d (the 5th, 15th and 25th of each month), based on the preceding 20 d window. Except for the differences in temporal composition, the ETAL retrieval algorithm is generally the same as for MDAL. As mentioned in Sect. 2.2, three of the four proposed changes to the MDAL retrieval algorithm (see Sect. 2.2; all except SEVIRI bias correction as it does not apply to AVHRR) are already implemented for ETAL, taking into account differences in sensor and orbit characteristics between the two missions.
Like SEVIRI, AVHRR uses three channels with similar but slightly shifted central wavelengths and band widths (see Table 1). As for MDAL, broadband albedos are calculated based on albedo estimates made for all three channels. ETAL has recently been validated against MODIS collection 6 surface albedo for the years 2015 to 2018 by Lellouch et al. (2020), who concluded that the data meet the accuracy targets set by the LSA-SAF, with a mean MBE of 0.001 and RMSD of 0.014 for albedos of less than 0.15 and a relative mean MBE and RMSD of 6 % and 19 %, respectively, for albedos greater than 0.15 (numbers for global analysis for the years 2015 to 2018). Based on these findings we deem ETAL a suitable reference data set in this study.
Following the acquisition of ETAL data through the LSA-SAF website (for the validation time period from November 2020 to October 2021), we resample them onto the MDAL grid through interpolation by inverse distance weighting (see example of resulting albedo map in Fig. 3c).
3.3 Reference data 2: in situ data
We compare MDAL v1 and v2 to in situ observations of various stations in Europe and Africa: Cabauw, Evora, Gobabeb and Izaña; additional details for stations are listed in Table 2 and locations within the SEVIRI disk are shown in Fig. 1. Cabauw, Gobabeb and Izaña are part of the BSRN network (Driemel et al., 2018); Evora is operated by the Karlsruhe Institute of Technology within the framework of the LSA-SAF. All stations measure shortwave downwelling (SWD) and upwelling (SWU) radiation and have a data acquisition frequency of 1 min. For the three BSRN stations we use the same time period as for the comparison to ETAL, i.e., a full year November 2020 to October 2021, and we obtained the data from the BSRN data portal (https://dataportals.pangaea.de/bsrn/, last access: 1 June 2022). For Evora we only use data from November 2020 to May 2021 due to technical problems at the site; the data were provided by the Karlsruhe Institute of Technology. These sites encompass all the stations within the SEVIRI 0∘ disk that we found suitable for comparison, have data coverage for the validation period, and measure both SWD and SWU.
(Knap, 2021)(Vogt, 2021)(Cuevas-Agulló, 2021)Table 2In situ stations used for comparison with MDAL as well as properties of nearest SEVIRI pixel and surrounding MODIS pixels. In situ footprint was calculated using Eq. (1); in situ vegetation is inferred from visual inspection of high-resolution satellite images (https://earthexplorer.usgs.gov, last access: 22 March 2022). SEVIRI footprint vegetation types based on MODIS land cover MCD12Q1 (Sect. 3.5); it should be noted that the automatic classification algorithm may not always match “ground truth” (e.g., savanna classification at Cabauw). SEVIRI and MODIS footprint sizes based on distance between center coordinates of neighboring pixels.

Albedo values for each station can be calculated by taking the mean ratio of SWU to SWD. This yields blue-sky albedo, which is albedo observed under mixed illumination conditions, essentially falling somewhere between the two end-member cases of black-sky albedo (purely direct illumination conditions) and white-sky albedo (purely diffuse illumination conditions; Schaepman-Strub et al., 2006). Since MDAL albedo products are of either of the two latter types (i.e., not blue-sky), it is required to align in situ albedo estimates with their satellite counterparts. Kharbouche et al. (2019) outline a procedure to estimate either white-sky or black-sky albedo from in situ observations, which can be done if diffuse radiation is measured at the site. Essentially, this approach assumes that blue-sky albedo estimates from observations with very high diffuse radiation content are suitable proxies for white-sky albedo, while those with very low diffuse radiation content correspond to black-sky albedo. The method can be summarized in two steps:
-
Calculate the ratio β of diffuse radiation to SWD.
-
For estimating white-sky albedo only consider time slots where β tends towards 1 (i.e., greater than a chosen threshold value, e.g., 0.99); for black-sky albedo this ratio should tend toward 0 (i.e., less than a chosen threshold value, e.g., 0.1).
Whether we can estimate black- or white-sky albedo for a given station depends on the local atmospheric as well as solar and view angle, conditions during the investigated time interval; some stations will yield more observations with β close to 1, while for others it may more often be close to 0. For any given station we will calculate one or the other (see Table 2) depending on how many valid data points are available for estimating either albedo type. Furthermore, there is a trade-off between the chosen threshold value and the number of valid albedo estimates that can be generated; if the threshold is very close to 1 or 0, we can produce more reliable estimates for white- and black-sky albedo, respectively, but at the same time only very few measurements may meet this criterion. In order to obtain a sufficient number of data points we adjust the threshold value. We estimate white-sky albedo for Cabauw, black-sky albedo for Gobabeb and Izaña, and (due to lack of diffuse radiation measurements) blue-sky albedo for Evora (threshold values for white-sky and black-sky albedo estimates are given in Table 2).
3.3.1 Station footprint diameters and representativeness
The spatial representativeness of a station (“the degree to which a ground-based retrieval of surface albedo is able to resolve the surrounding landscape extending to the satellite footprint”, Román et al., 2009) depends on the difference in reflective properties between the in situ and the satellite footprint. A key factor affecting this difference is, necessarily, the difference in scale of the observed surface patch, which is why the footprint of each in situ station – i.e., the area within its field of view – needs to be known.
For an instrument measuring upward radiation, the diameter D of the covered ground footprint is a function of the instrument's field of view (FOV), the height of the instrument above the surface hinst and the local vegetation height hveg (Kharbouche et al., 2019):
For the stations Cabauw, Gobabeb and Izaña we have FOV=170∘ and mounting heights of hinst=2 m with negligible hveg, resulting in d≈46 m (Table 2). In the case of Evora the instrument has a height of hinst=13 m, which is the height of the tree canopies in the sparsely vegetated forest the station is located in, and has a field of view of FOV=150∘. Because the vegetation is sparse, the effective footprint is irregular and varies with viewing direction, depending on the distance and height of vegetation at a given azimuthal viewing angle. We give a maximum value in Table 2 calculated for a clear field of view.
The implications of the calculated footprint diameters for comparison to MDAL are further discussed in Sect. 4.2.
3.4 Reference data 3: MODIS albedo MCD43D51 & MCD43D61
In order to complement the local comparison with in situ albedo we use the MODIS-based albedo products of the MCD43D group (version 6.1), which are given on the MODIS climate modeling grid and have a spatial resolution of 30 arcsec. In particular, we use the black-sky shortwave broadband (MCD43D51; Schaaf and Wang, 2021a) and white-sky shortwave broadband (MCD43D61; Schaaf and Wang, 2021b) products. Both data sets are produced daily using 16 d of MODIS observations, whereas the data are weighted to the central day of this moving window. The constant spatial resolution of the grid in spherical coordinates of 30 arcsec results in a constant Cartesian grid spacing across degrees of latitude of around 0.9 km, and a varying grid spacing across degrees of longitude that decreases towards the poles, with about 0.9 km at the Equator and around 0.2 km at 80∘ latitude. Both data sets have a gap between (exclusive) 31 December 2020 and 9 April 2021 (data downloaded on 27 September 2022 from https://earthdata.nasa.gov).
3.5 Auxiliary data: MODIS IGBP land cover types
For the land-cover-type-based analysis we use the MODIS Land Cover Type Yearly L3 Global 500 m Version 6 (MCD12Q1 v006) product of 2019 (Friedl and Sulla-Menashe, 2019), created using supervised classification of reflectance data (Sulla-Menashe and Friedl, 2018; Friedl et al., 2010). The data set was obtained through the NASA Earthdata portal (https://earthdata.nasa.gov, last access: 10 October 2022). We resample the land cover types from the 500 m MODIS grid onto the coarser SEVIRI grid by assigning each SEVIRI pixel the most common cover type of the MODIS pixels that are located within a 1.5 km radius around that pixel's center (result shown in Fig. 4).
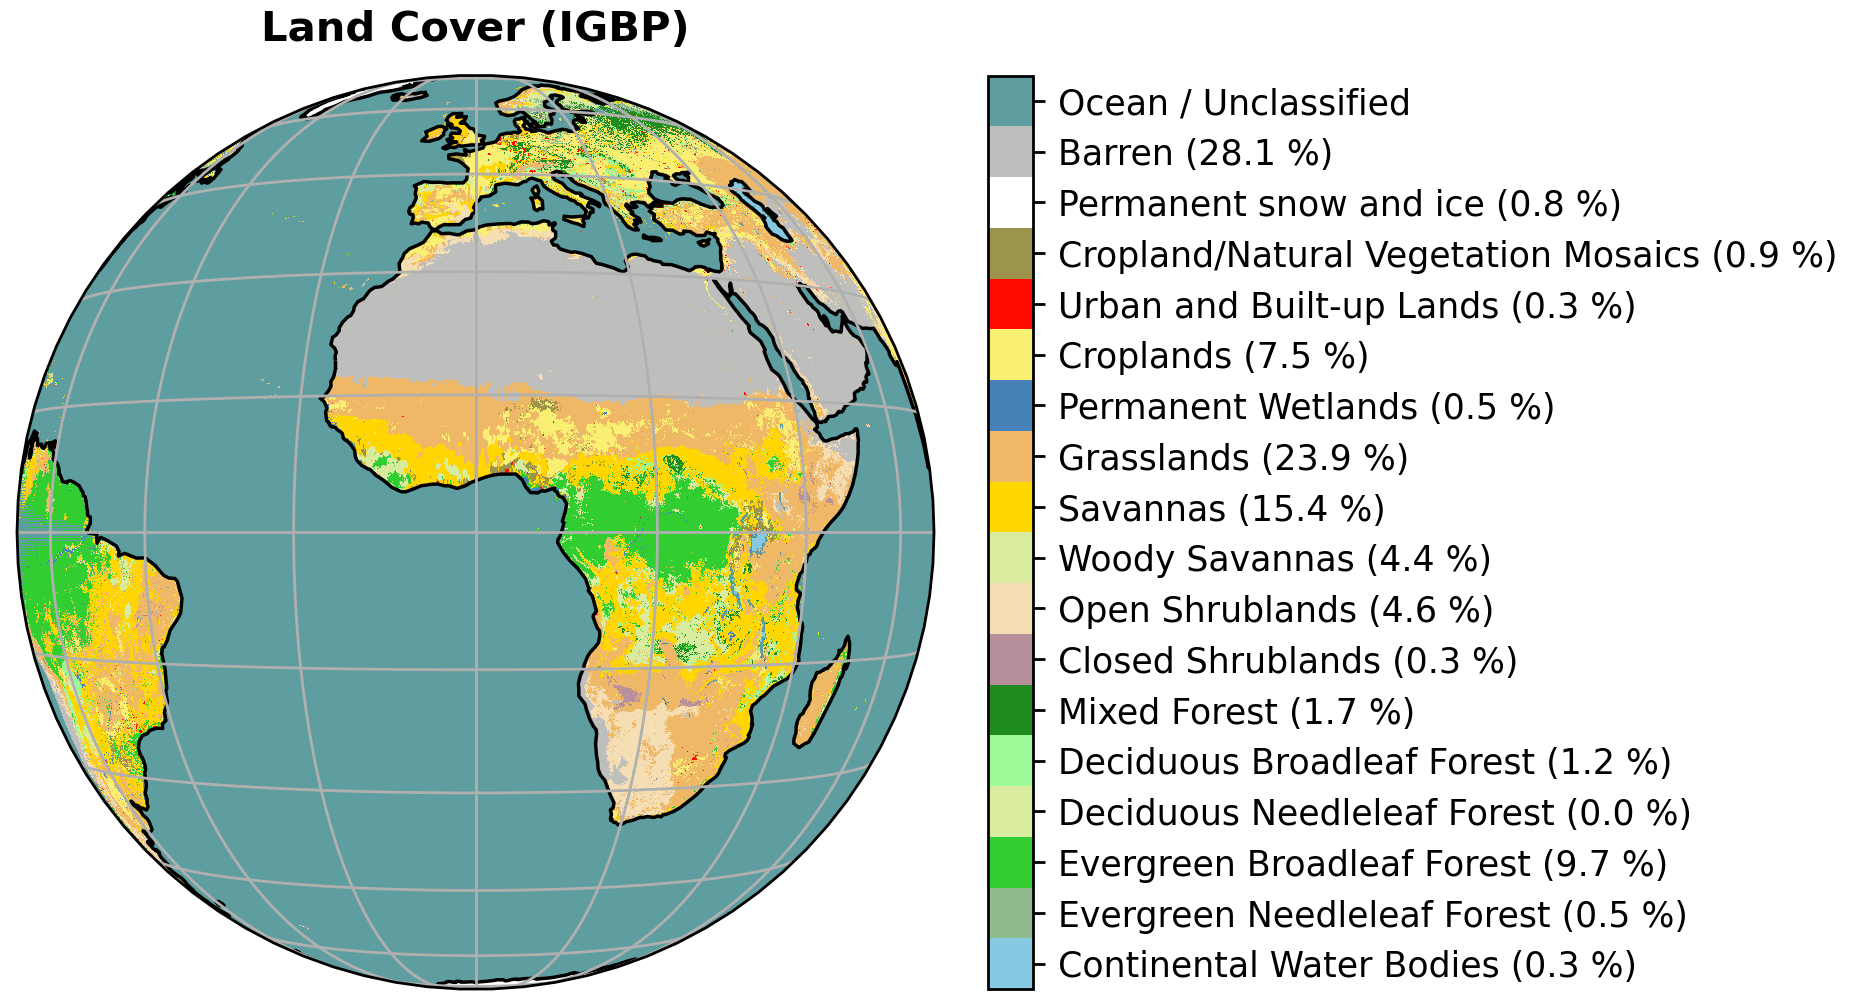
Figure 4MODIS-based IGBP land cover types, resampled on SEVIRI pixels. The description of each land cover type is given in the Appendix, Table A1.
The results retrieved with the upgraded MDAL results are validated with the main objective of evaluating their performance against albedo values from different data sources, i.e., the data sets described in Sect. 3.1: ETAL, in situ observations and MODIS albedo.
The comparison with ETAL, in particular, is of interest to us because an increased alignment between MDAL and ETAL would not only suggest improvement of albedo results but is also beneficial for the LSA-SAF product suite. This is because there are synergies between SEVIRI and AVHRR-based products which can potentially be exploited. The higher the agreement between data sets from both sensors, the better.
For this reason, the comparison with ETAL is the main focus of our validation, which we conduct over the full globe, investigating seasonal, regional and land-cover-type-related variations. Additionally, we do pixel-wise comparisons at the locations of several in situ stations, with albedo estimates based on the station's measurements. Due to problems of comparability at some of the locations, described in this section, we additionally use MODIS-derived albedo values to complete our analysis.
To quantify the comparison of MDAL against the different references we calculate various error metrics such as mean bias error (MBE), mean absolute error (MAE), root-mean-square deviation (RMSD) and temporal correlation. Details on these metrics are given in Sect. A4.
4.1 Full SEVIRI disk comparison with ETAL
While satellite data validation using other satellite-based products suffers from the drawback that none of the compared products can claim to be “ground truth”, it is still very useful, mainly because comparisons can be made with extensive spatial coverage which cannot be reached with in situ data.
A successful comparison of satellite data sets requires spatial, temporal and spectral agreement between them. We obtain spatial agreement by interpolation of the more finely resolved ETAL product onto the grid of the coarser MDAL, as mentioned in Sect. 3.2. To satisfy spectral agreement, we perform the comparison of MDAL and ETAL only for broadband products (AL-BB-BH and AL-BB-DH), which allows us to ignore the slight differences in central wavelength and width for individual channels (see Table 1). For temporal agreement we need to consider that MDAL is a daily product, while ETAL is a 20 d composite product, disseminated at ∼10 d intervals. We follow the approach of Lellouch et al. (2020) and match MDAL and ETAL data sets at the last day of the ETAL composite (the 5th, 15th and 25th of each month). An example of the matched data sets for one date can be seen in Fig. 3.
For our analysis we match pixels of the respective MDAL versions with those of ETAL for each time slot and calculate various validation measures: bivariate histograms, MBE, MAE and temporal correlation coefficients. For additional detail we conduct in-depth analysis of temporal and spatial subsets, defined by specific season, region and land cover type. The land cover types are based on the IGBP classification (see Sect. 3.5); the sub-regions are Eurasia, northern Africa, sub-Saharan Africa and South America (see Fig. 1).

Figure 5The footprints and surroundings of the in situ stations Cabauw, Evora, Gobabeb and Izaña as well as approximate footprints of the nearest SEVIRI pixel.
4.2 Local comparison with in situ and MODIS data
In situ observations are generally considered a good validation reference for satellite-based albedo. The key advantage of in situ measurements is the instrument's location close to the ground, much less affected by atmospheric effects than a satellite measurement. However, because the covered area of in situ and satellite observations is usually not identical, in particular with respect to scale, the CEOS (Committee on Earth Observation Satellites) land product validation group recommends that “only sites that are spatially representative of the satellite field of view should be used for validation purposes” (Wang et al., 2019). While SEVIRI pixels have an extent of at least 3 km (at sub-nadir point and increasing towards the edge of the disk; the size for each pixel covering an in situ station is given in Table 2), the footprints of the in situ stations used for reference in this study are generally just around 50 m (see values in Table 2; Fig. 5 for visual reference), which is why the interpretation of the difference between satellite and in situ data needs to be done with care. To give proper context when presenting the results (Sect. 3.3), we will give a brief qualitative assessment by comparing the land cover at the station with the dominant land cover types within the MDAL pixel which we use to compare to the in situ data. It should be noted, however, that a qualitative land cover comparison can only be a rough indication of the quality of the comparison of albedos as it does not capture the effect of the difference in scale very well nor possible effects due to varying albedo within a single land cover type.
We compare both MDAL versions to in situ albedo, for the respective SEVIRI pixel that covers each station (see Fig. 5). The type of albedo (BH or DH) we compare depends on which type yields more data points (in turn depending on prevalent sky conditions as well as view angles) for each of the stations (see Sect. 3.3).
Because of the aforementioned caveats, we complement the comparison by adding MODIS MCD43D albedo as an additional reference for the MDAL albedos. The comparison to another satellite product is not affected by problems of representativeness, unlike comparison to in situ observations. Instead, we need to take the difference in spatial resolution between satellite products into account. Because the resolution of the MODIS product is higher than that of SEVIRI, for each location we calculate the mean of all MODIS pixels that fall into the single SEVIRI pixel that is used for the local comparison. The number of MODIS pixels used at each station is different because of the latitude-dependent resolution (in distance units) of the MODIS climate modeling grid. We use either MODIS black- or white-sky albedo depending on the selection we made for each station. We temporally match the final date of the MODIS 16 d window to the MDAL data sets.
The results of the local comparison are shown in Sect. 5.2.
5.1 Results of full SEVIRI disk comparison with ETAL
Figure 6 shows a comparison between both MDAL versions and ETAL (for white-sky albedo), based on mean error measures (MBE and MAE) calculated over the full validation time window (1 full year). The MBE maps indicate a widespread underestimation of albedo values in MDAL v1, which is notably reduced in v2 (on average from 0.02 to less than 0.001 below ETAL values). The same analysis for black-sky albedo (AL-BB-DH) reveals a slight average improvement from approximately −0.02 to +0.01 (Appendix, Fig. A4, top left), i.e., from negative to a noticeable but less pronounced positive bias (see Fig. A1a, b). The MAE maps (Fig. 6c, d) show good agreement between both MDAL versions and ETAL, although in the edge regions the high SEVIRI view zenith angles lead to less accurate results. The map also shows slightly elevated MAE just east of the sub-satellite point along the coast of the Gulf of Guinea. It should be noted that this region exhibited worse than average performance in the validation of ETAL against MODIS (see Figs. 15 and 17 in Lellouch et al., 2020), a possible indicator that ETAL is less reliable here. Looking at averages over the full disk, however, there is an overall improvement of absolute errors from MDAL v1 to v2 with respect to ETAL, with a reduction from 0.034 to 0.026, an improvement of 24 % (for AL-BB-DH the change is from 0.028 to 0.024 or 14 % improvement, see Fig. A5, top left). Temporal correlation by the measure of Pearson's coefficient r is shown in Fig. 6e and f, where we can see an overall improvement, in particular in northern and central Africa. The poor correlations in the tropics obtained for MDAL v1, which prevail to a lesser extent in v2 as well, are likely associated with cloud contamination. This introduces noise in both ETAL and MDAL estimates, which in an area where albedo is very stable, leads to negligible (or event negative) correlations between the different data sets.
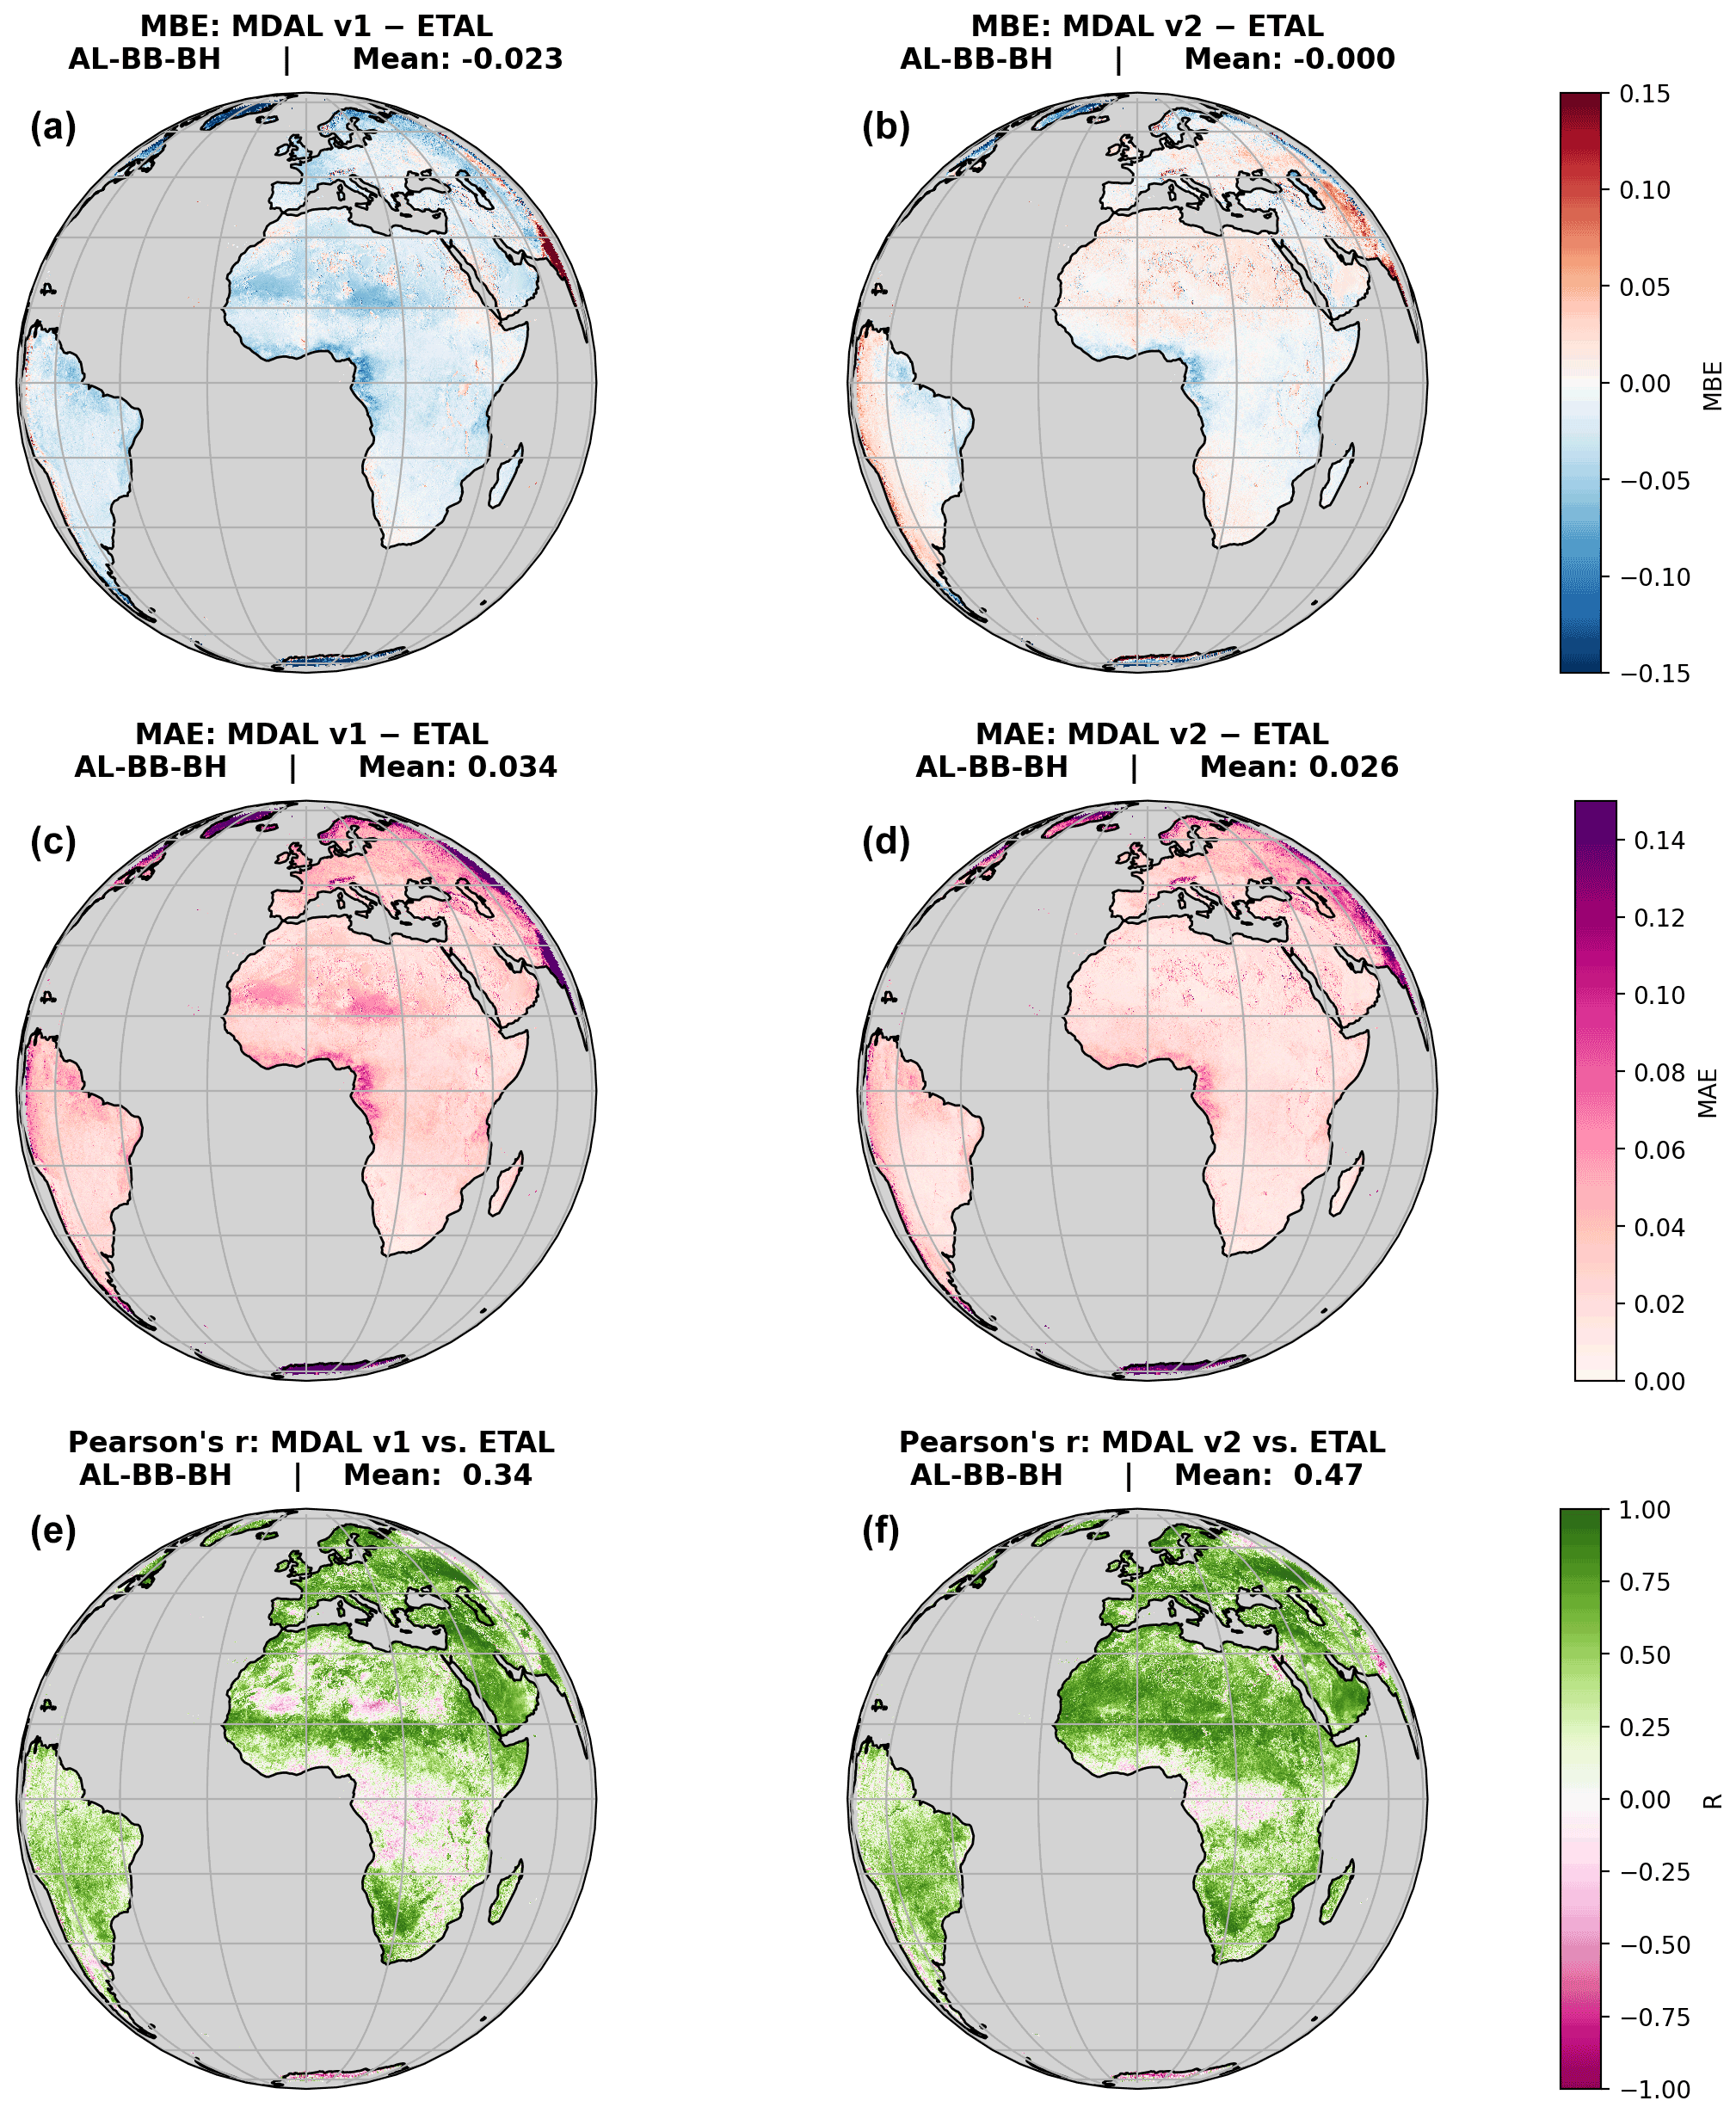
Figure 6Plots showing performance of MDAL v1 and v2 against ETAL for all pixels, for AL-BB-BH and analysis over 1 full year, from 1 November 2020 to 31 October 2021. (a, b) MBE; (c, d) MAE; (e, f) Pearson's correlation coefficient r.
Figure 7 shows a qualitative comparison in terms of which of the MDAL versions is on average closer to the ETAL value, for AL-BB-BH, highlighting that MDAL v2 is on average closer to ETAL than v1 for 76 % of pixels (66 % for AL-BB-DH; see Fig. A2).
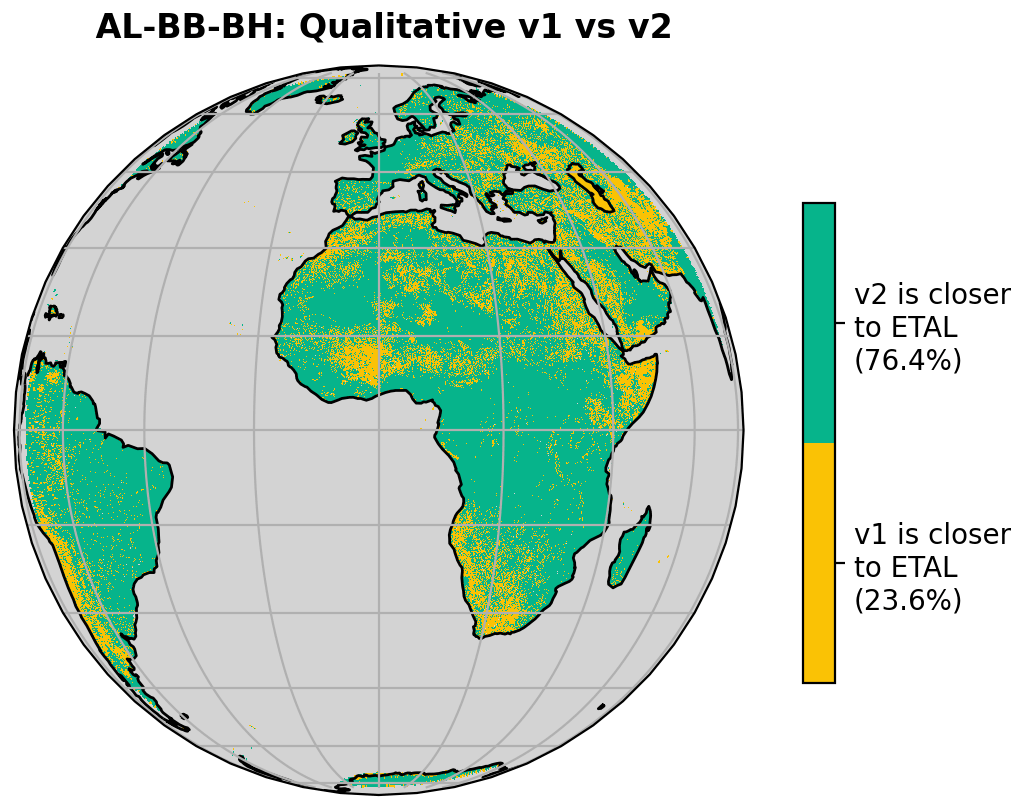
Figure 7Qualitative comparison of performance of MDAL v1 and v2 with respect to ETAL, for broadband white-sky albedo (AL-BB-BH).
These observations are further corroborated by the 2-D histograms in Fig. 8 (showing AL-BB-BH; see Fig. A3 for AL-BB-DH), calculated for four different dates across all seasons, for pixels in the Northern Hemisphere (to ensure seasonal effects are not masked). The plots show a trend of negative bias in MDAL v1 for all dates (except January for AL-BB-DH) when compared to ETAL, which is eliminated in MDAL v2 resulting in improved correlation and errors with regard to ETAL except for January. A slight positive bias of MDAL v2 compared to ETAL, however, can be seen for albedo values greater than 0.4 for most dates and both types of albedo.
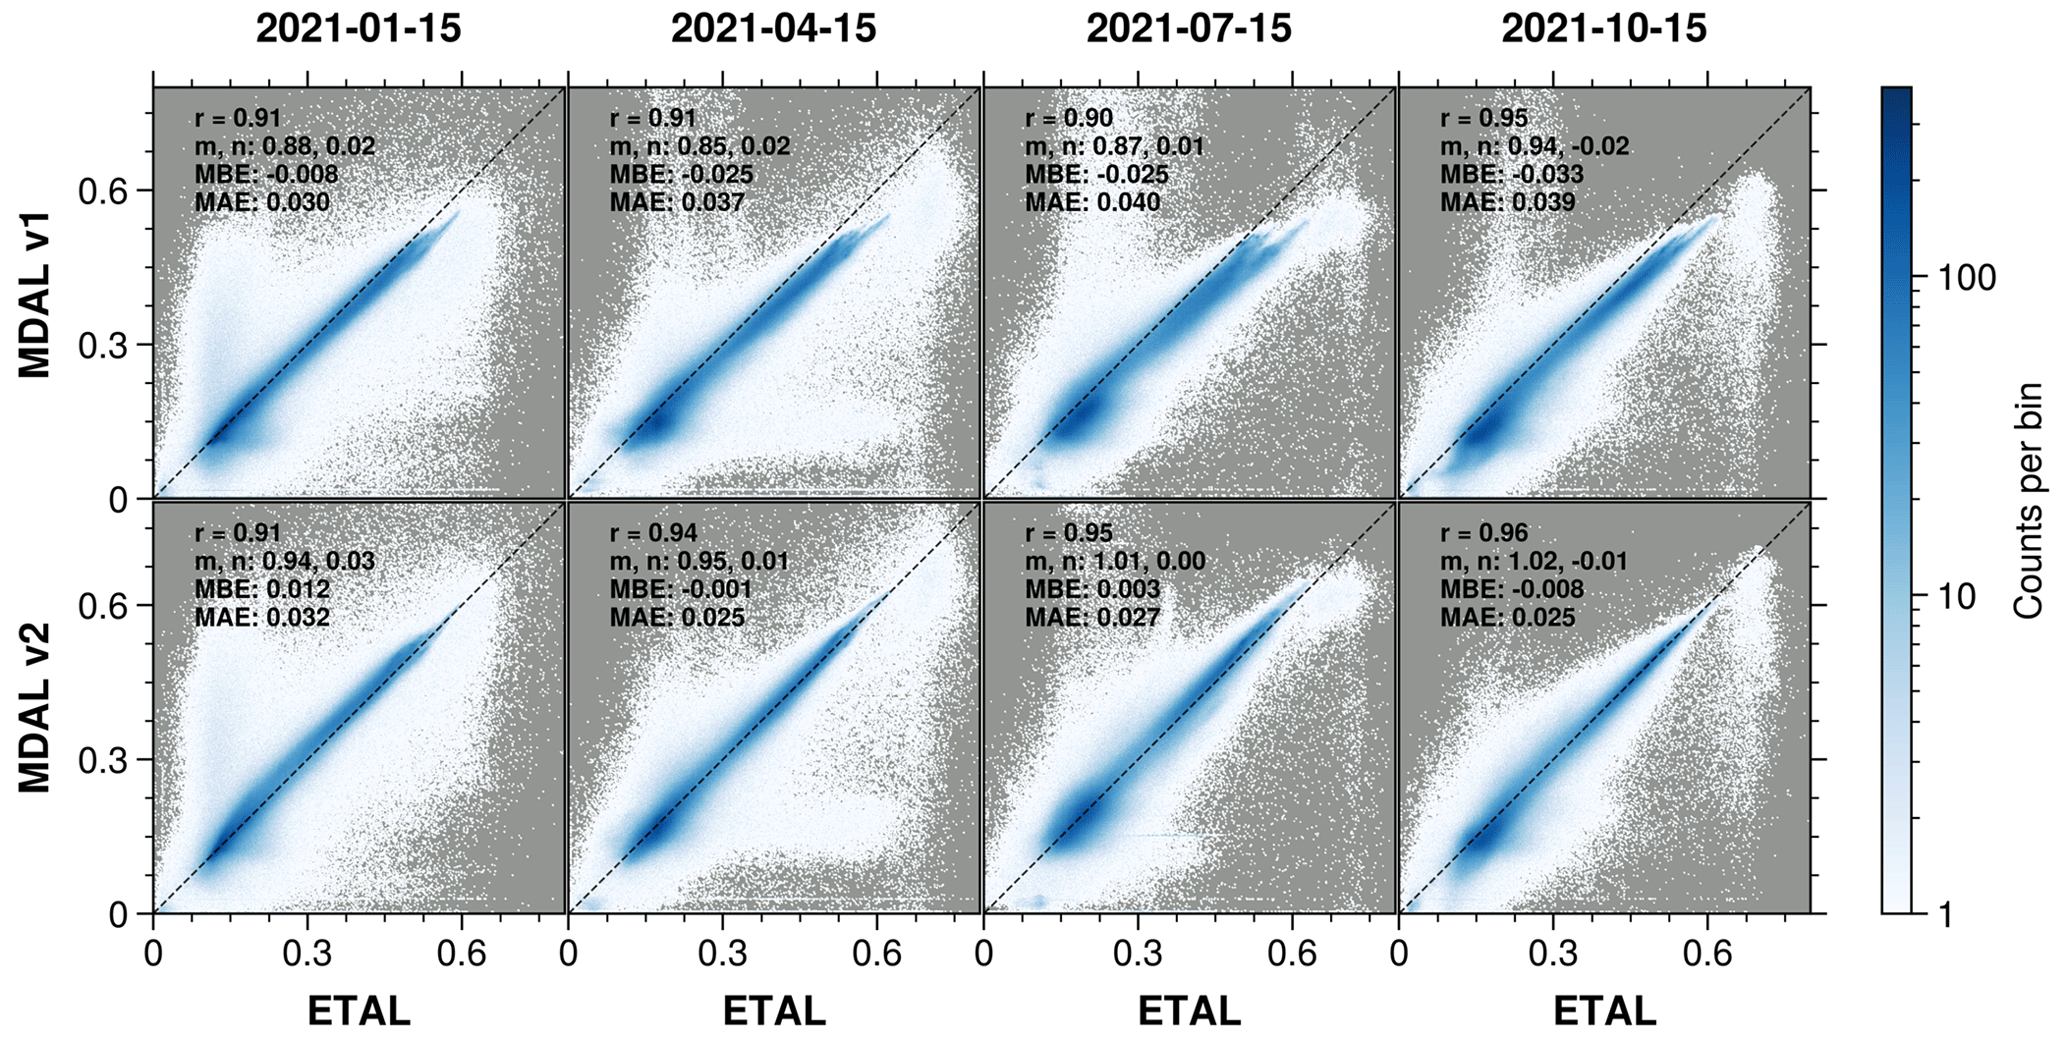
Figure 8Two-dimensional histogram highlighting correlation between MDAL v1 (top) and v2 (bottom) and ETAL, for BB-BH albedos for January, April, July and October 2021 (15th of each month). r is Pearson's correlation coefficient; m and n are the slope and intercept of a least-squares fitted linear regression line. The color scale is normalized to logarithmic scale for better visibility. The dashed line is the line of perfect correlation (m=1, n=0).
For a more detailed analysis we additionally calculate mean MBE and MAE values for varying combinations of spatial (Eurasia, northern Africa, sub-Saharan Africa, South America) and temporal (individual seasons) subsets; values for MDAL v1 and v2 shown side by side in Figs. 9 and 10 (first row in each). The MBE numbers in Fig. 9 highlight that underestimation of albedos in MDAL v1 (with regard to ETAL) is prevalent in all regions and for all seasons. Similar to the average over the full-disk data set, significant improvements can be seen in MDAL v2 in mean MBE for all regions as well as notable improvements in mean MAE, most pronounced in northern Africa. There is only a single instance where MDAL v2 shows inferior error measures compared to v1: for Eurasia mean winter MAE increases slightly from 0.064 to 0.066. For black-sky albedo the seasonal dependence on the results is more obvious: in northern Africa and southern America the performance of MDAL v2 with respect to ETAL is diminished in local winter but improved in local summer (Figs. A4 and A5). In Eurasia there is a full-year average deterioration of black-sky MDAL v2 performance compared to v1, both for MBE and MAE, and observable for almost all seasons except for MBE in spring. The magnitude of MBE and MAE differences varies between seasons but is again strongest in winter, with values of +0.034 and 0.071, respectively. It can also be noted that MAE in Eurasia is the highest of all regions and is relatively high during all seasons, both in MDAL v1 and v2. It is likely that is caused by the fact that this region includes many edge pixels, i.e., pixels with extremely high view angles, which exhibit some of the highest MAE values (see Fig. 6). Additionally, pixels that experience many days of snow cover throughout the year (e.g., in the Alps and in Scandinavia; see Fig. 6) that are found in this region may contribute to this effect. The other three regions are not particularly affected by these conditions.
By distinguishing different land cover types, we attempt to determine whether certain cover types exhibit better or worse results than others, which may help explain the slightly diminished performance of MDAL v2 in winter. Indeed, Fig. 11 shows MDAL v2 achieving smaller mean MAE values for all land cover types except inland waterbodies, for all seasons except winter (neither MDAL nor ETAL are designed for retrieval of albedo of water surfaces, so this result is of no real concern). For the other land cover types, we can see for winter that some are not improved or show slightly increased absolute errors: these are crops, closed and open shrublands, grasslands, and in Eurasia also “barren” areas (but not globally). Crops and grasslands are the most common land cover types in the Eurasia region (together around 50 % of pixels), which may contribute to the minor increase in MAE in winter in this region. Averaged over the whole disk (first column in Fig. 11), however, we can see that there is improvement in mean MAE for each land cover type. This can most strongly be seen for cropland/natural vegetation mosaics, (woody) savannas and barren land cover. The results for black-sky albedo (Fig. A6), while showing worse results for MDAL v2 for barren land cover, deciduous broadleaf forests, and urban and built-up lands in winter as well as for evergreen needleleaf forests in summer, are generally similar to those of white-sky albedo and exhibit improvements for most land cover types.
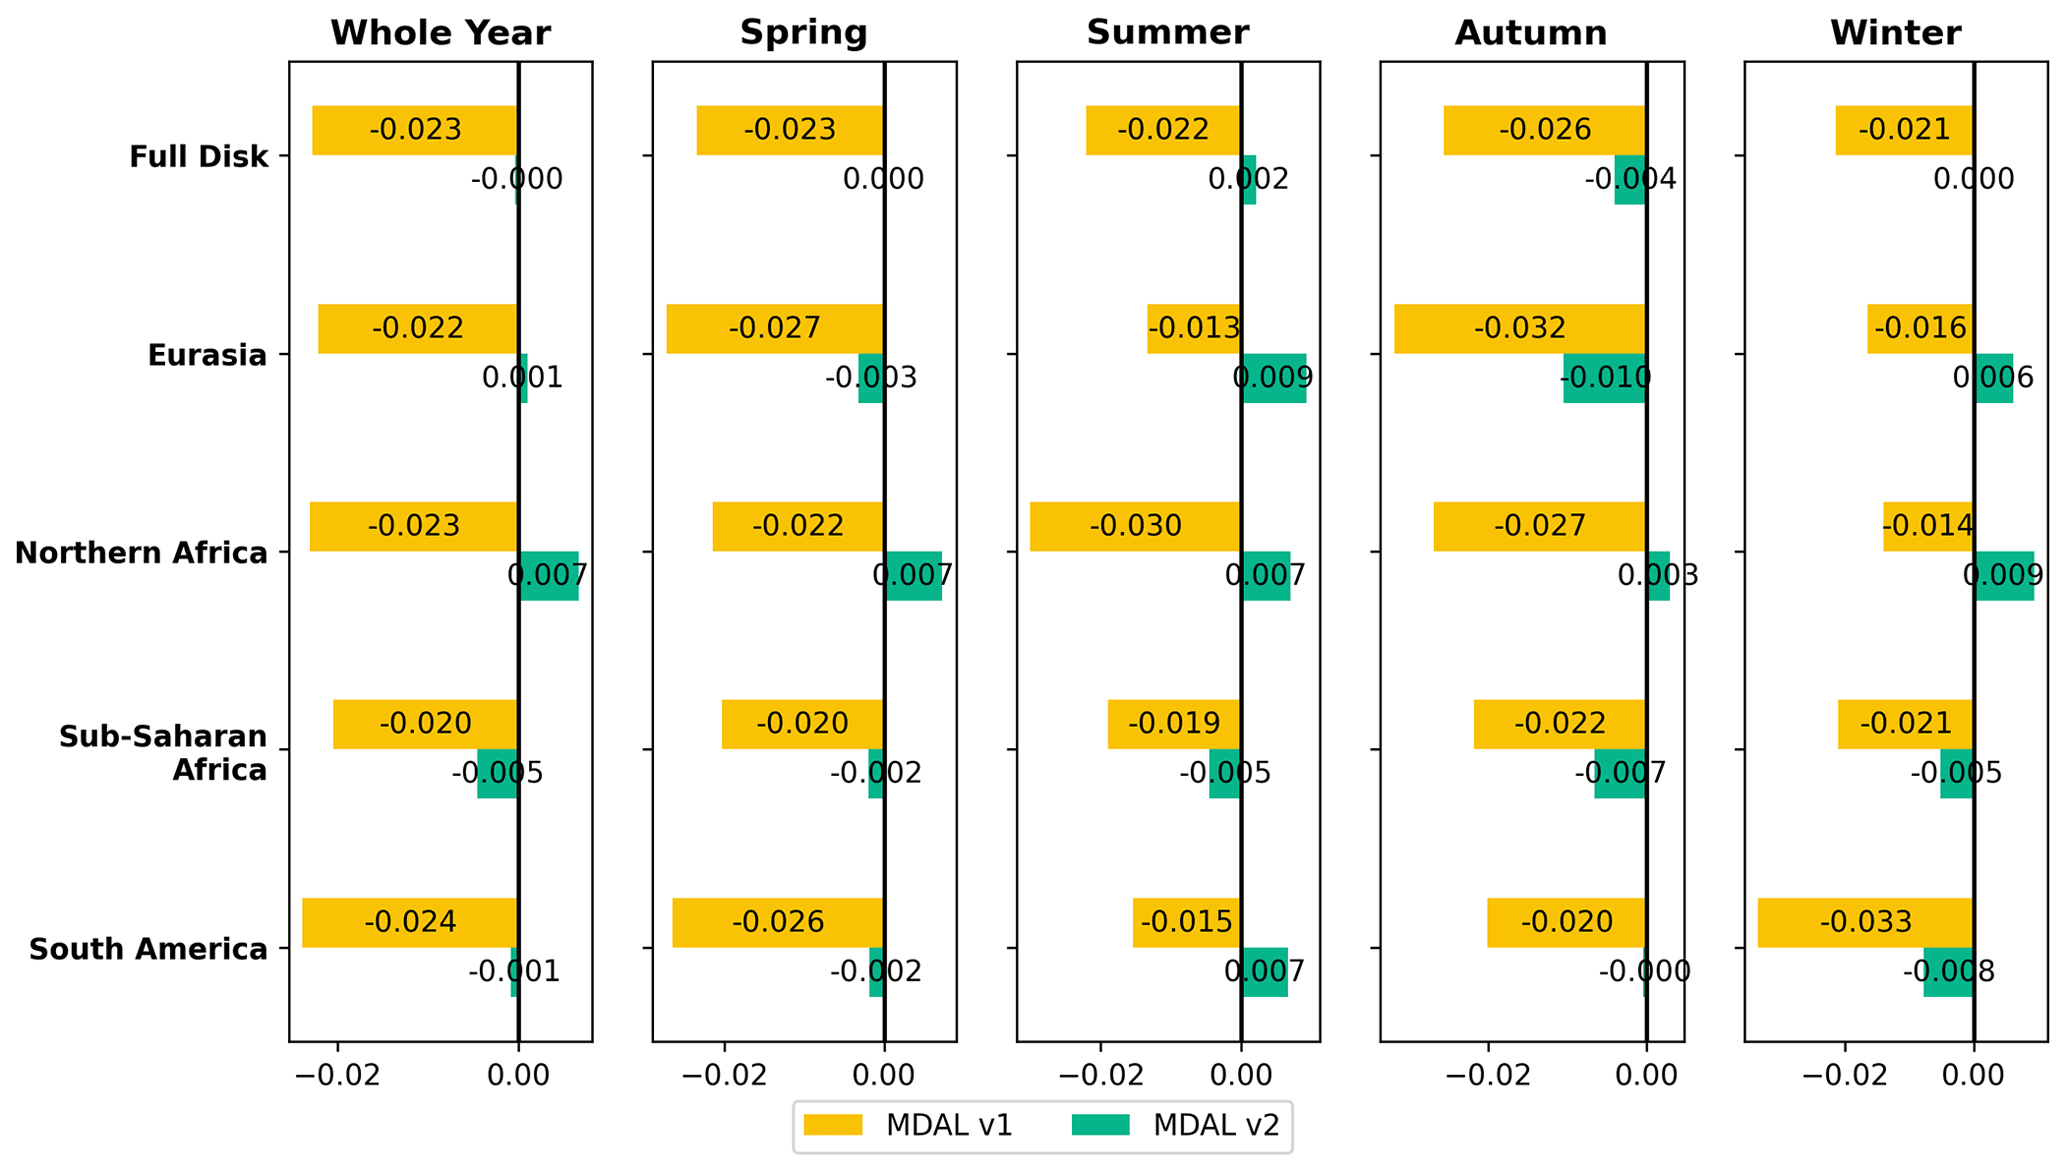
Figure 9Mean MBE with respect to ETAL by region and season (season names referring to season months of the Northern Hemisphere; spring: MAM; summer: JJA; autumn: SON; winter: DJF).
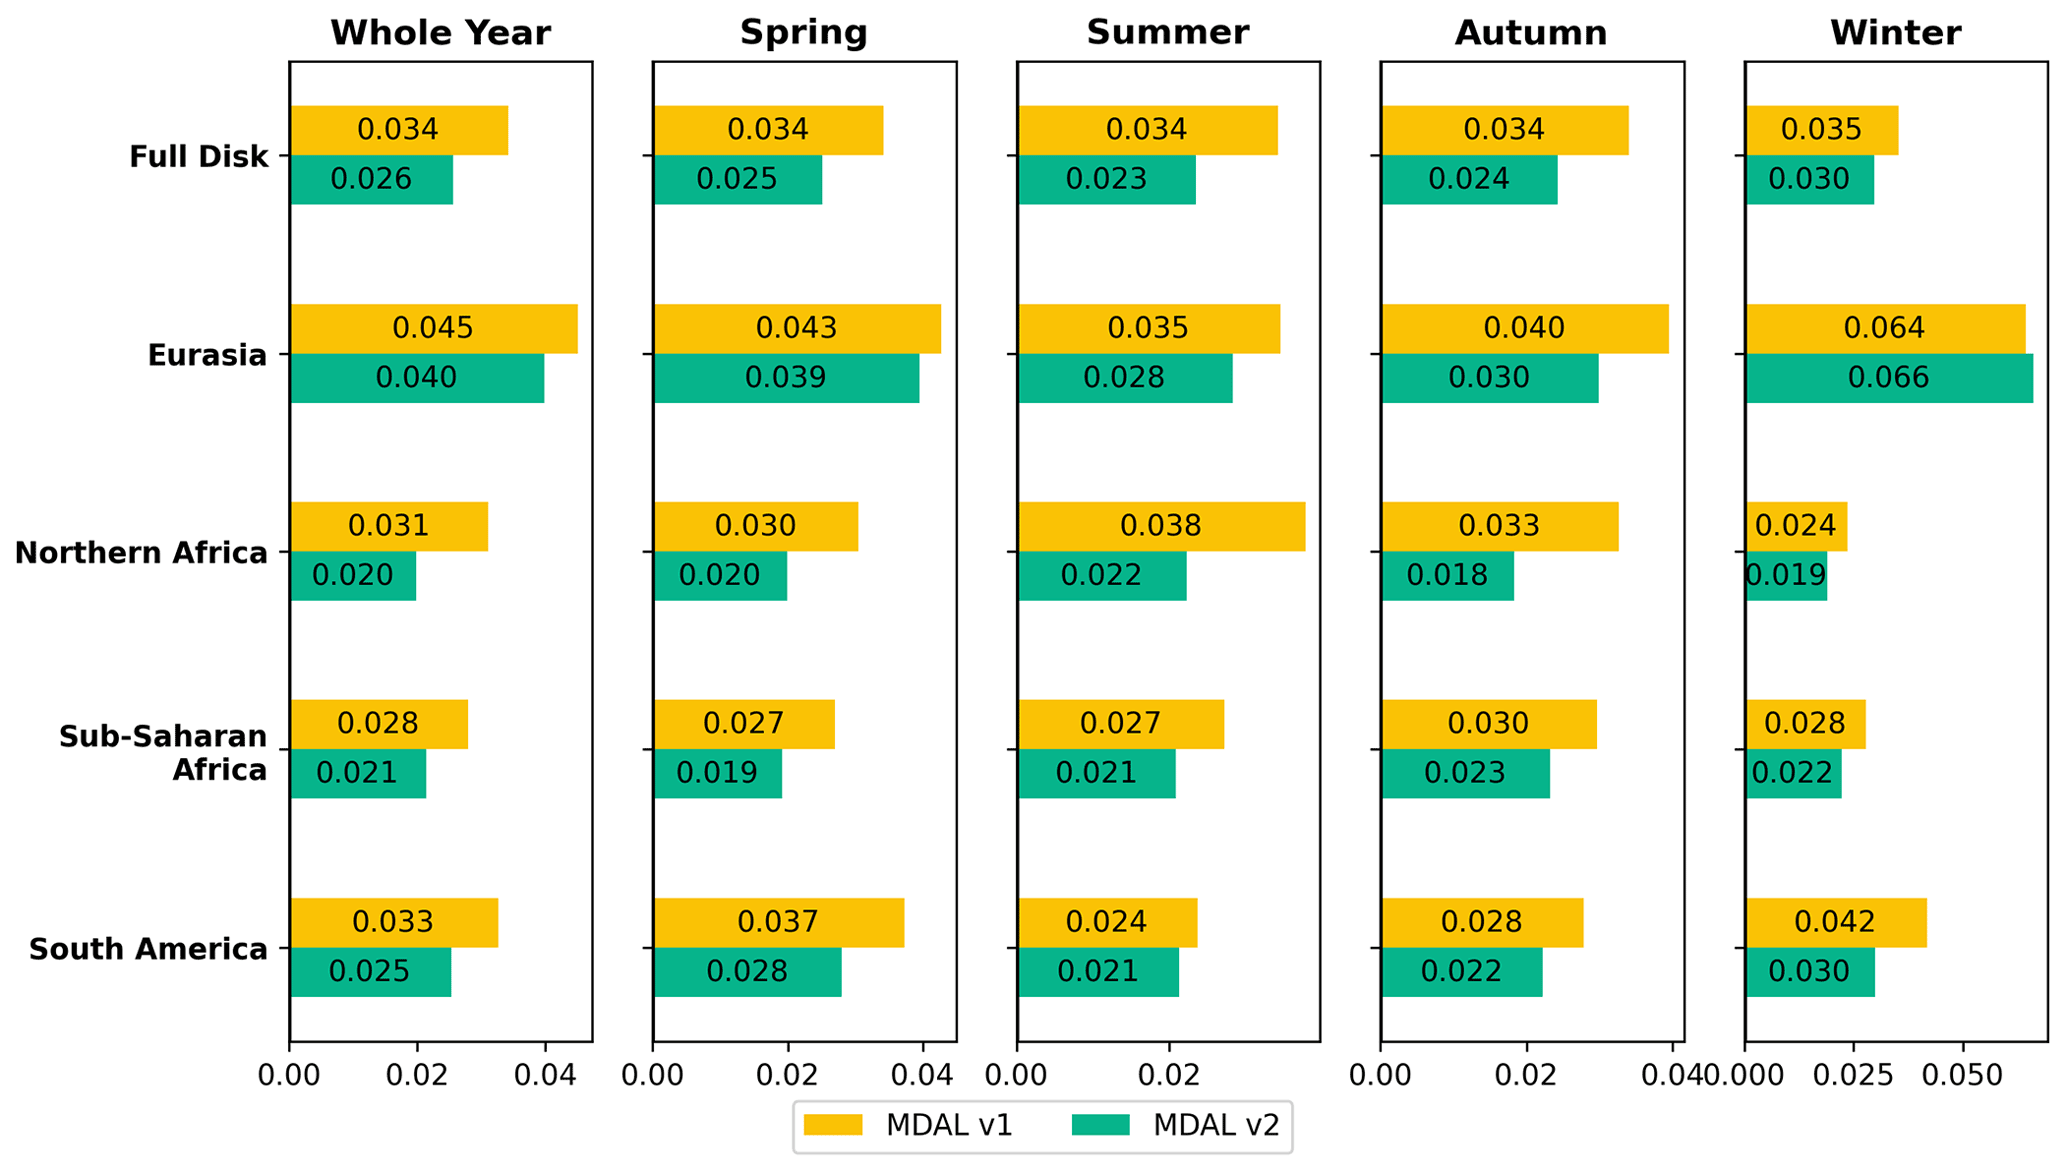
Figure 10Mean MAE with respect to ETAL by region and season (season names referring to season months of the Northern Hemisphere; spring: MAM; summer: JJA; autumn: SON; winter: DJF).
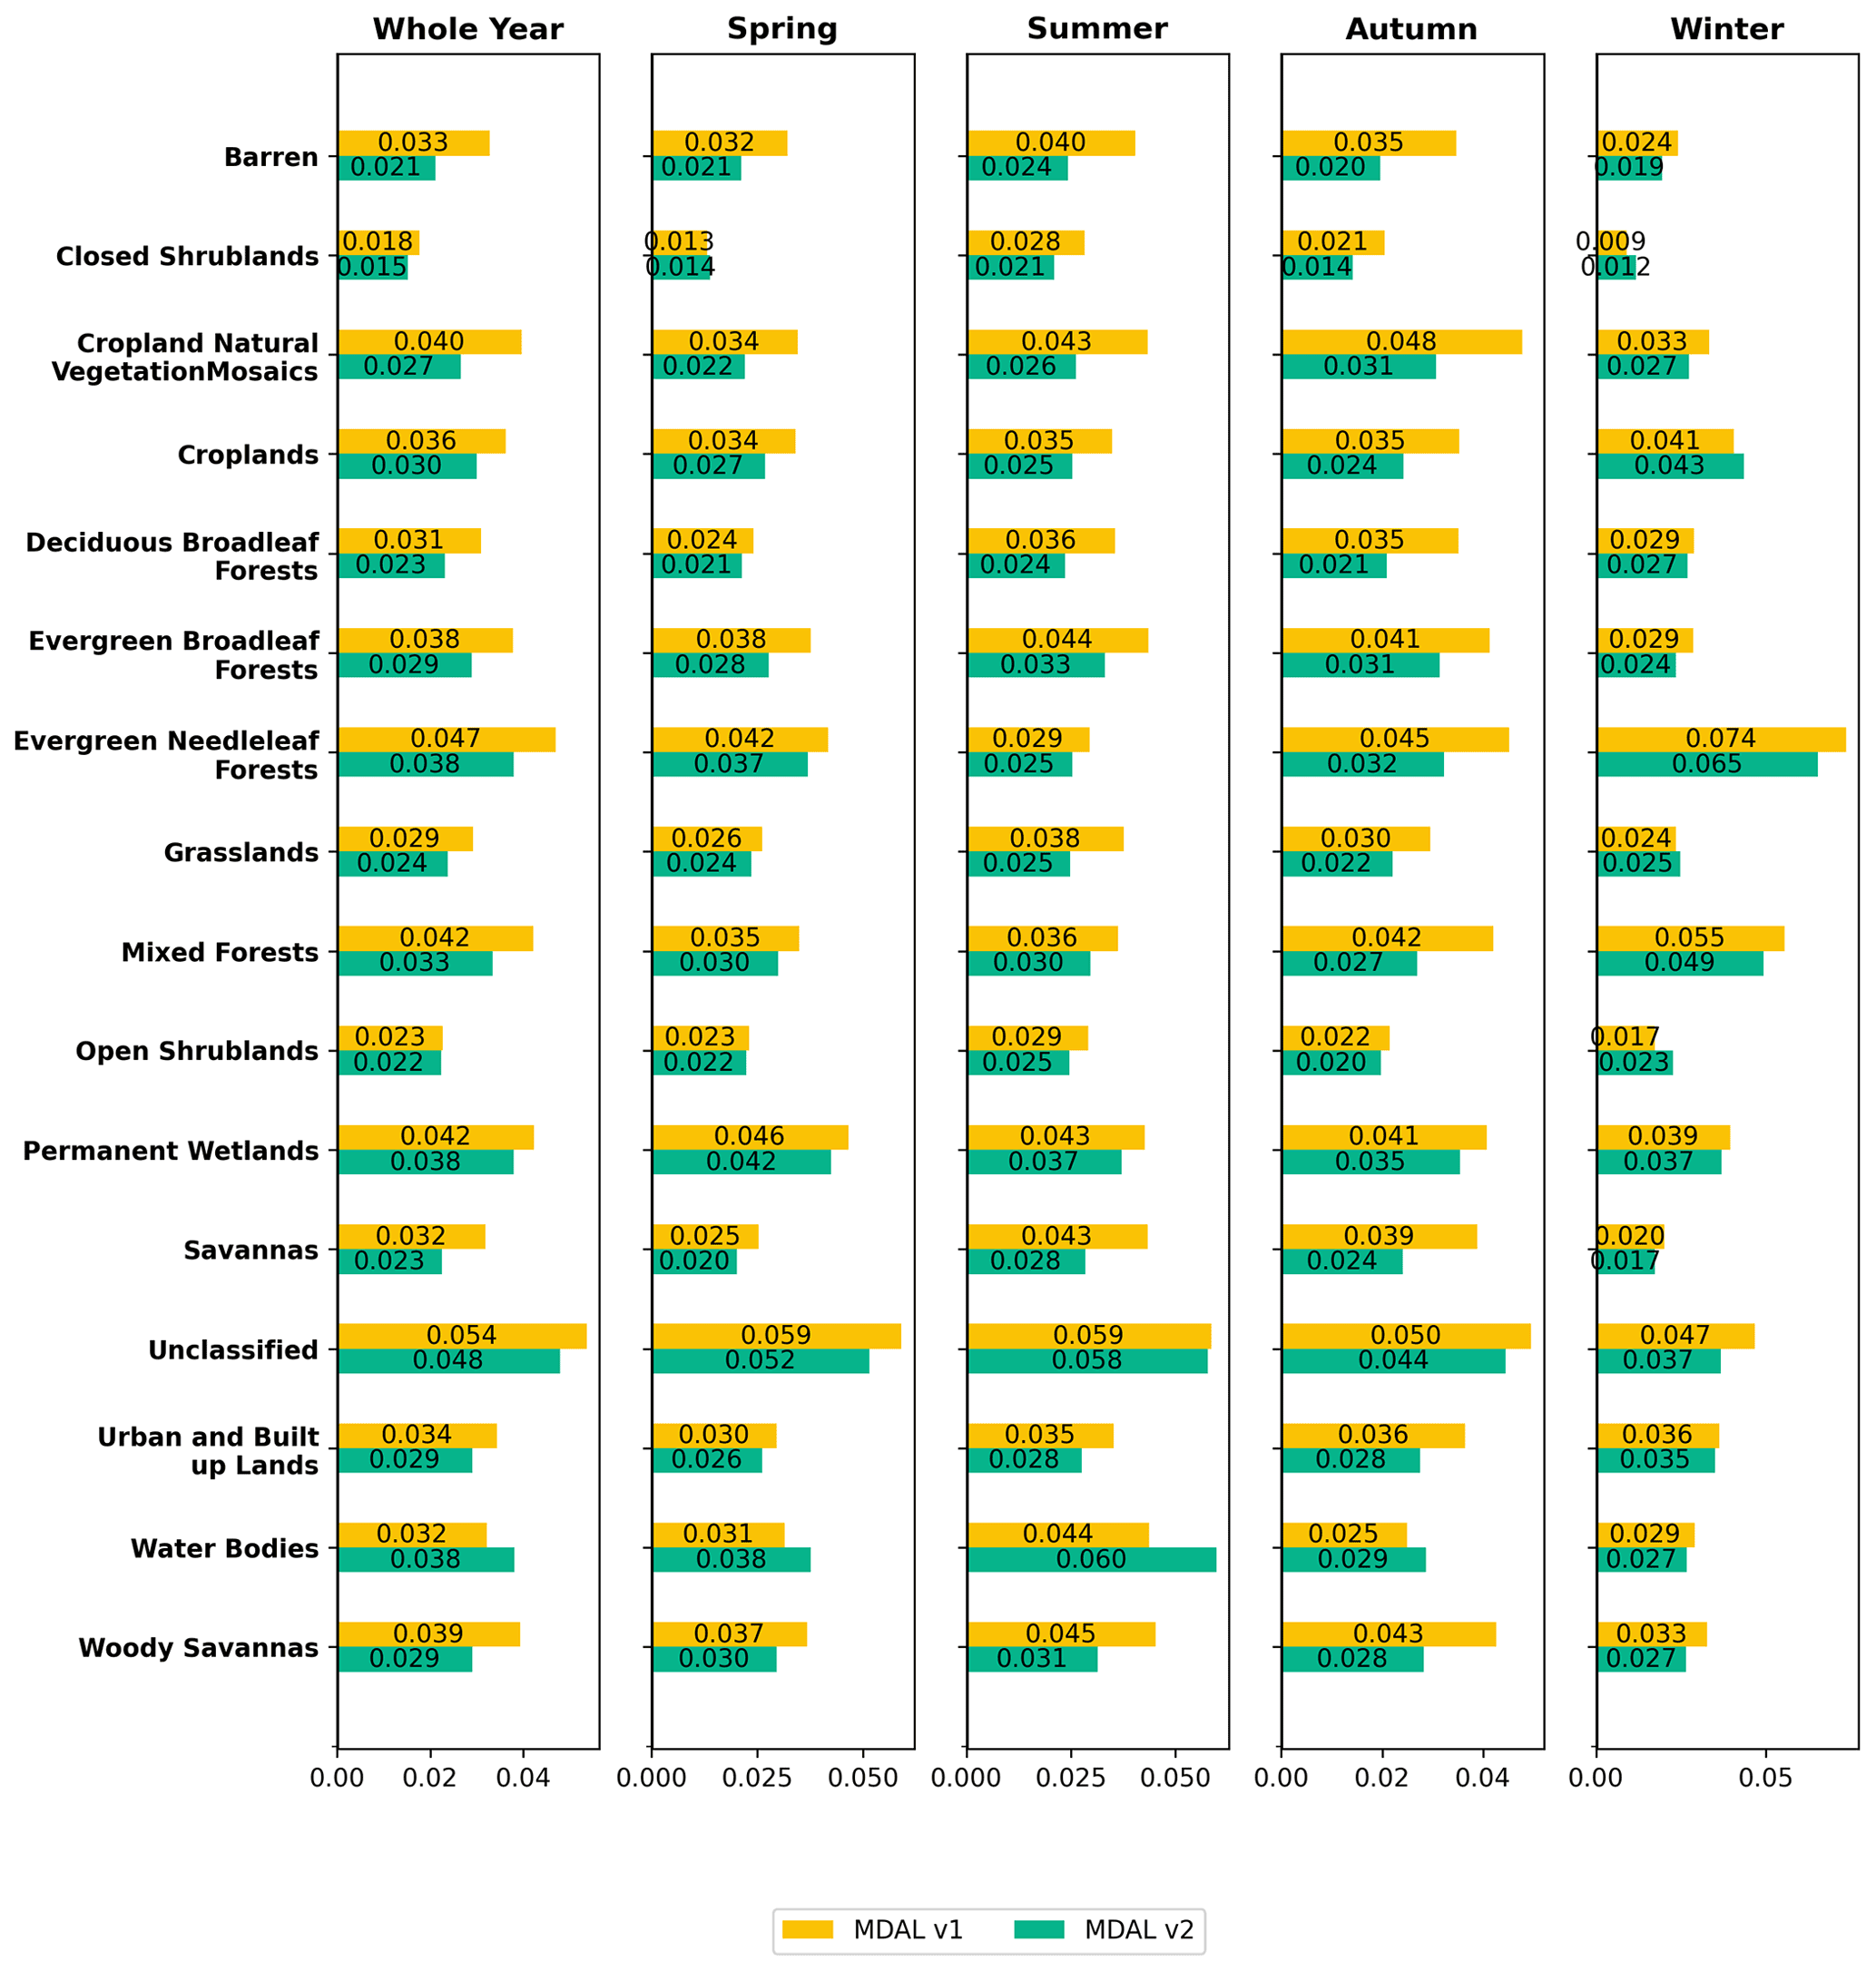
Figure 11Mean MAE with regard to ETAL by land cover and season. For all pixels the “true” season was taken into account, depending on whether the pixel is located in the Northern or Southern Hemisphere.
5.2 Results of local comparison with in situ and MODIS
5.2.1 Cabauw
A comparison between MDAL and Cabauw in situ data for AL-BB-BH is shown in Fig. 12a. The station is located on grass, while the SEVIRI footprint contains a mix of land covers (see Table 2): grasslands (57 %), savannas (37 %) and cropland/natural vegetation mosaic (4 %), according to the MODIS IGBP land cover product (the identification of savannas at this location may be a flaw of the classification algorithm – the only trees in this area are those planted in nearby villages and along roads; see Fig. 5a). We find that both MDAL versions are generally below the in situ estimates, albeit v2 significantly less so with MBE changing from −0.08 in v1 to −0.03 in v2. In particular in winter and autumn MDAL increases noticeably from v1 to v2 (with a change of close to 0.1), becoming closer to the in situ values. A very noticeable difference can be observed in February where a snow episode led to very high in situ values, which is only partly captured, or rather, smoothed, by MDAL. This is caused by the Kalman filter implementation for the retrieval of MDAL which can lead to temporal smoothing when land cover changes suddenly (e.g.; after snowfall). RMSD is relatively poor for both MDAL versions with 0.09 in v1 and 0.07 in v2. The temporal correlation between MDAL and in situ albedo is very low and does not change significantly in the updated MDAL version (∼0.1 for both versions), although this might be due to the lack of seasonal variations in the data at this location, making the correlation coefficient more susceptible to noise. The discrepancy between both MDAL versions and in situ measurement-derived albedos is likely connected to the limited comparability between the two, due to the differences in scale and land cover described earlier. That is why, while the improvements in error measures such as MBE and RMSD may indicate an improvement in MDAL v2 relative to v1, this cannot be stated with certainty.
For the comparison of the MDAL albedos to MODIS MCD43D61 albedo, we calculated the mean of 30 MODIS pixels (grid spacing of ∼0.6 km across degrees of longitude) that fall into the footprint of the larger SEVIRI (MDAL) pixel. The comparison shows a better agreement of MDAL v1 with MODIS than MDAL v2, in particular during spring and summer. MDAL v2 consistently yields higher albedo estimates than MODIS with an MBE of +0.04.
5.2.2 Evora
Due to lack of diffuse radiation measurements at Evora we compare the MDAL black-sky AL-BB-DH values to the in situ blue-sky albedo, for 7 months of data from November 2020 to May 2021 (Fig. 12b). The tower-mounted sensor sees a mix of grassland and tree canopies (see Fig. 5b), generally representative of a savanna-type landscape, while the satellite field of view covers a range of land covers, mostly savannas (47 %) and grass- (34 %) and croplands (16 %; see Table 2). The fact that savannas here are essentially grass vegetation with a tree cover of 10 %–30 % (see Table A1) and the combination of savannas and grasslands adds up to 81 % can be seen as a positive for representativeness of the in situ footprint (i.e., both footprints primarily comprising grass cover and tree canopies). However, the difference in scale between the two footprints in combination with the mixed vegetation necessarily implies that comparability remains problematic. That said, the results that can be seen in Fig. 12b show that both MDAL versions agree well with in situ albedo estimates with MDAL v2 being slightly closer with improvements in RMSD from 0.02 to 0.01, in MBE (from −0.020 to +0.004) and in temporal correlation (from 0.1 to 0.3). As for Cabauw, whether this indicates a real improvement of MDAL at this location cannot be said with certainty.
For the additional comparison with MODIS MCD43D51 black-sky albedo at Evora we use the mean of 16 MODIS pixels to achieve comparability between the two products. Seasonal trends in spring, summer and autumn can be seen in all three satellite products. In particular from late spring until winter, we see a strong agreement between MDAL v2 and MODIS, although in early spring the MODIS albedo is closer to MDAL v1. While on average there has been a slight underestimation of MDAL v1 with respect to MODIS, the MBE in MDAL v2 is close to negligible (<0.01). RMSD is slightly reduced in MDAL v2, as well. Furthermore we can observe that during sudden changes in albedo, such as those seen in June and September, there is a temporal shift between the time series of MODIS and MDAL. This can be attributed to the larger-coverage window of a single MODIS data point of 16 d which results in the MODIS product not being able to capture fast changes in albedo values as well as MDAL.
5.2.3 Gobabeb
We compare MDAL AL-BB-DH to the black-sky albedo estimate at Gobabeb (see Fig. 12c). The station is located in an area of homogeneous land cover type, barren for both the in situ instrument's footprint as well as SEVIRI's (see Table 2; Fig. 5). We can see that both MDAL versions are in good agreement with the in situ observations. In particular, the fit between MDAL v1 and in situ albedo at Gobabeb is good to begin with, with a RMSD value of 0.007 and MBE of +0.003. MDAL v2 estimates a higher albedo than v1 throughout the whole year with an MBE of +0.020, leading to a slightly worse fit with the Gobabeb station (RMSD of 0.015), except for the months May to July where we see improvement. The high correlation coefficient of about 0.8 for both MDAL versions as well as the agreement of land cover type between station and satellite footprint (both being barren) indicate good representativity of the in situ observation (although the latter does not rule out possible reflectance variations within the barren cover). The slight deterioration of results at this location is consistent with the comparison to ETAL which finds smaller differences for MDAL v1 in this region (see Fig. A2).
Since for Gobabeb we have a reliable location for satellite against in situ comparison, the additional comparison with MODIS is less of a requirement in this case. Rather, by comparing the MODIS results (mean of nine pixels) to Gobabeb in situ albedo, we find that MODIS albedo values are consistently lower, in particular from April to October. The same can be seen when compared to both MDAL versions, which are distinctly closer to the in situ results. These observations might suggest a general negative bias of MODIS at this location, at least for the aforementioned months.
5.2.4 Izaña
The difference between the two MDAL versions for the pixel closest to Izaña is essentially negligible (see Fig. 12d), and both are significantly lower than the albedo estimate from Izaña station. The higher in situ estimate is probably due to a lack of representativity of the local station footprint, which covers mainly bare ground on a mountain top; the SEVIRI footprint includes a significant amount of vegetation, in particular on the nearby mountain slopes (see Fig. 5d), which likely contributes to the lower MDAL albedos.

Figure 12MDAL v1 and v2 compared to albedo estimates at in situ observation stations (a) Cabauw (white-sky albedo), (b) Evora (in situ: blue-sky albedo; satellites: black-sky albedo), (c) Gobabeb (black-sky albedo) and (d) Izaña (black-sky albedo).
Similarly to Cabauw, snow episodes in January and February 2021 are not fully captured. Again, this is in part caused by the incorporated Kalman filter, but it is also due to the altitude difference between the in situ station (2367 m and on a mountain top) and the average within the SEVIRI pixel.
The additional comparison with MODIS (mean of 16 pixels) shows a very strong agreement between both MDAL data sets and MODIS, although the MODIS time series is smoother. No significant difference between the performance of MDAL v1 and v2 can be observed.
The proposed upgrade described here of the MDAL retrieval algorithm aims to better account for physical conditions by inclusion of aerosol effects and to keep up with recent scientific developments (update of processing coefficients and sensor bias correction). The comparison of the MDAL albedo values pre- and post-upgrade (v1 and v2) with respect to the reference ETAL and in situ data highlights significant changes in MDAL values. A previously noticeable negative bias in white-sky broadband albedo with respect to ETAL is now strongly reduced in most areas that are part of MSG primary coverage (and on average), while a similar negative bias in black-sky broadband albedo is changed, on average, to a smaller positive bias. The results imply that in regions where a negative bias in MDAL v1 exists (more common in white-sky albedo), MDAL v2 often offers clear improvements, while in regions where agreement between MDAL v1 and reference data was good to begin with (for example in central and eastern Europe and more common in black-sky albedo), there is a risk of obtaining a positive bias with respect to ETAL in MDAL v2. On average, however, MBE, MAE and temporal correlation improve for both albedo types. In-depth analysis shows a certain dependence of the relative performance between MDAL v1 and v2 on season, region and land cover, highlighting slightly diminished results of v2 compared to v1 under certain circumstances, such as increased white-sky albedo MAE in Eurasia in winter and increased black-sky albedo during the whole year; an increase in black-sky albedo MAE in South America in autumn and winter and in northern Africa in winter; and the introduction of positive biases in black-sky albedo in Eurasia, northern Africa and South America (all with regard to ETAL). Some land cover types show – almost exclusively in winter – a minor deterioration of results, such as crop-, grass- and shrublands. On average and for most regions, seasons and land cover types, however, the results for MDAL v2 are positive with general improvements with respect to ETAL by all applied error measures.
This general observed improved agreement between MDAL and ETAL is consistent with the nature of the update: now the two products use the same aerosol inputs, narrow- to broadband conversion coefficients based on the same spectral database, and the same base algorithm (6SV1) for calculating SMAC coefficients for atmospheric correction. This shows that (a) the implementation of the update was successful and the new version works as intended and (b) considering the recent favorable validation of ETAL against MODIS that the changes in MDAL results can be seen as an improvement. On top of that, the increased alignment between MDAL and ETAL adds to the potential of exploiting synergies between the two products, e.g., combining them to obtain increased data coverage for research purposes or for the generation of derived vegetation products (e.g., LSA-SAF SEVIRI and AVHRR-based leaf area index, LAI, and fraction of absorbed photosynthetically active radiation, FAPAR, products).
The comparison to in situ stations requires attention to comparability between the footprint of each respective station and the SEVIRI field of view at the station's location. Gobabeb has the most favorable ground situation in this regard, being very homogeneous with a single land cover in both in situ and satellite footprint (although due to the difference in spatial scale the two sensors likely do not see the same level of variation, even within a single land cover type). Here, we see good agreement of both MDAL versions with in situ albedo, albeit with a slight increase in RMSD in v2 compared to v1. This slightly diminished performance of MDAL v2 is consistent with the comparison to ETAL, which shows a similar tendency in the region. For the other three locations the satellite captures additional land cover types that are not present in the field of view of the ground station, which poses a challenge for the comparison in these cases. For Cabauw and Evora, improvements in RMSD and MBE can be seen for MDAL v2, but we cannot be certain whether these are actual improvements or merely artifacts, caused by a wanting representativeness of the in situ footprint compared to the satellite one. At Izaña changes between MDAL v1 and v2 are negligible with significant difference to in situ albedo for both. Problems with representativeness are most obvious at this location, with significant, visually noticeable land cover variability in the SEVIRI footprint. Comparison with MODIS albedo at the in situ stations' locations provides additional insight, showing an improvement of MDAL v2 compared to v1 at Evora, diminishment (positive bias) at Cabauw and no significant change (but strong agreement of both MDAL versions with MODIS) at Izaña. For the homogeneous Gobabeb station, we find that both MDAL products seem to perform better than MODIS. In general, we observe a good agreement of both MDAL versions with MODIS, indicating the overall good quality of MDAL.
Considering the sum of evidence gathered from the validation exercise presented here, the proposed update of the MDAL retrieval process (MDAL v2) is found to yield a veritably improved albedo product. Based on our findings we recommend the implementation of this update in the LSA-SAF MDAL operational near real-time processing chain. At the time of writing the MDAL v2 upgrade has already been implemented in the processing chain for the demonstrational IODC albedo product. Implementation of the upgrade in the processing chain for the MSG primary coverage product is awaiting the results of the corresponding operational readiness review.
A1 Abbreviations
| AL-BB-BH | Broadband white-sky (bi-hemispherical) albedo |
| AL-BB-DH | Broadband black-sky (directional–hemispherical) albedo |
| AOD | Aerosol optical depth |
| AVHRR | Advanced Very High Resolution Radiometer (Instrument aboard EPS-Metop satellites) |
| BRDF | Bidirectional reflectance distribution function |
| BSRN | Baseline Surface Radiation Network |
| CAMS | Copernicus Atmosphere Monitoring Service |
| CEOS | Committee on Earth Observation Satellites |
| EPS | EUMETSAT Polar System |
| ETAL | EPS Ten-Day Albedo |
| EUMETSAT | The European Organisation for the Exploitation of Meteorological Satellites |
| IGBP | International Geosphere-Biosphere Programme |
| IODC | Indian Ocean Data Coverage |
| LSA-SAF | EUMETSAT Satellite Application Facility for Land Surface Analysis |
| MAE | Mean absolute error |
| MBE | Mean bias error |
| MDAL | MSG daily albedo |
| MODIS | Moderate Resolution Imaging Spectroradiometer: instrument aboard NASA's Terra and Aqua satellites |
| MSG | Meteosat Second Generation |
| NWC SAF | EUMETSAT Satellite Application Facility for Nowcasting and Very Short Range Forecasting |
| RMSD | Root-mean-square deviation |
| SAF | EUMETSAT Satellite Application Facility |
| SEVIRI | Spinning Enhanced Visible and InfraRed Imager: instrument aboard Meteosat Second Generation satellites |
| SMAC | Simplified Method for Atmospheric Correction |
| SWD | Shortwave downwelling (radiation) |
| SWU | Shortwave upwelling (radiation) |
| TOC | Top of canopy |
A2 IGBP land cover definitions
Table A1IGBP land cover definitions, extracted and reprinted from Sulla-Menashe and Friedl (2018).

A3 Narrow- to broadband conversion
MDAL broadband albedo estimates for a given target interval γ are obtained by a linear combination of albedos calculated for the three utilized SEVIRI channels and a set of conversion coefficients cβ,γ (Geiger et al., 2008):
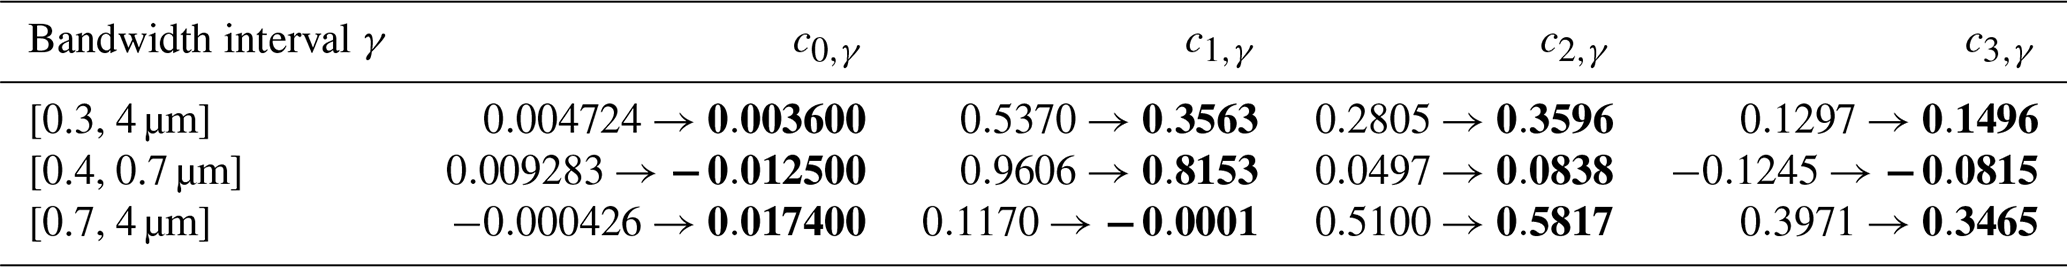
The changes to cβ,γ as part of the update of the MDAL retrieval algorithm described in this paper are given in Table A2.
Table A2Narrow- to broadband conversion coefficients used for MDAL albedo retrieval, before and after update. New values in bold.
A4 Error measures
Mean bias error
The mean bias error is the mean difference between two sets of observations, e.g., a set of values whose quality we want to assess v and a set of reference values vr.
Mean absolute error
The mean absolute error is the mean absolute difference between two sets of observations, e.g., a set of values whose quality we want to assess v and a set of reference values vr.
Root mean square deviation
Root mean square deviation is the square root of the mean square error between a set of observations v and a set of reference values vr.
Pearson's correlation coefficient r
The Pearson correlation coefficient measures the linear correlation between two data sets. For a set of observations v and a set of reference values vr, with respective means μ and μr,
r can range between −1 and 1, where 1 implies perfect linear correlation, −1 perfect anticorrelation and 0 implies no linear dependency between the two variables.
A5 Figures for broadband black-sky albedo (AL-BB-DH)
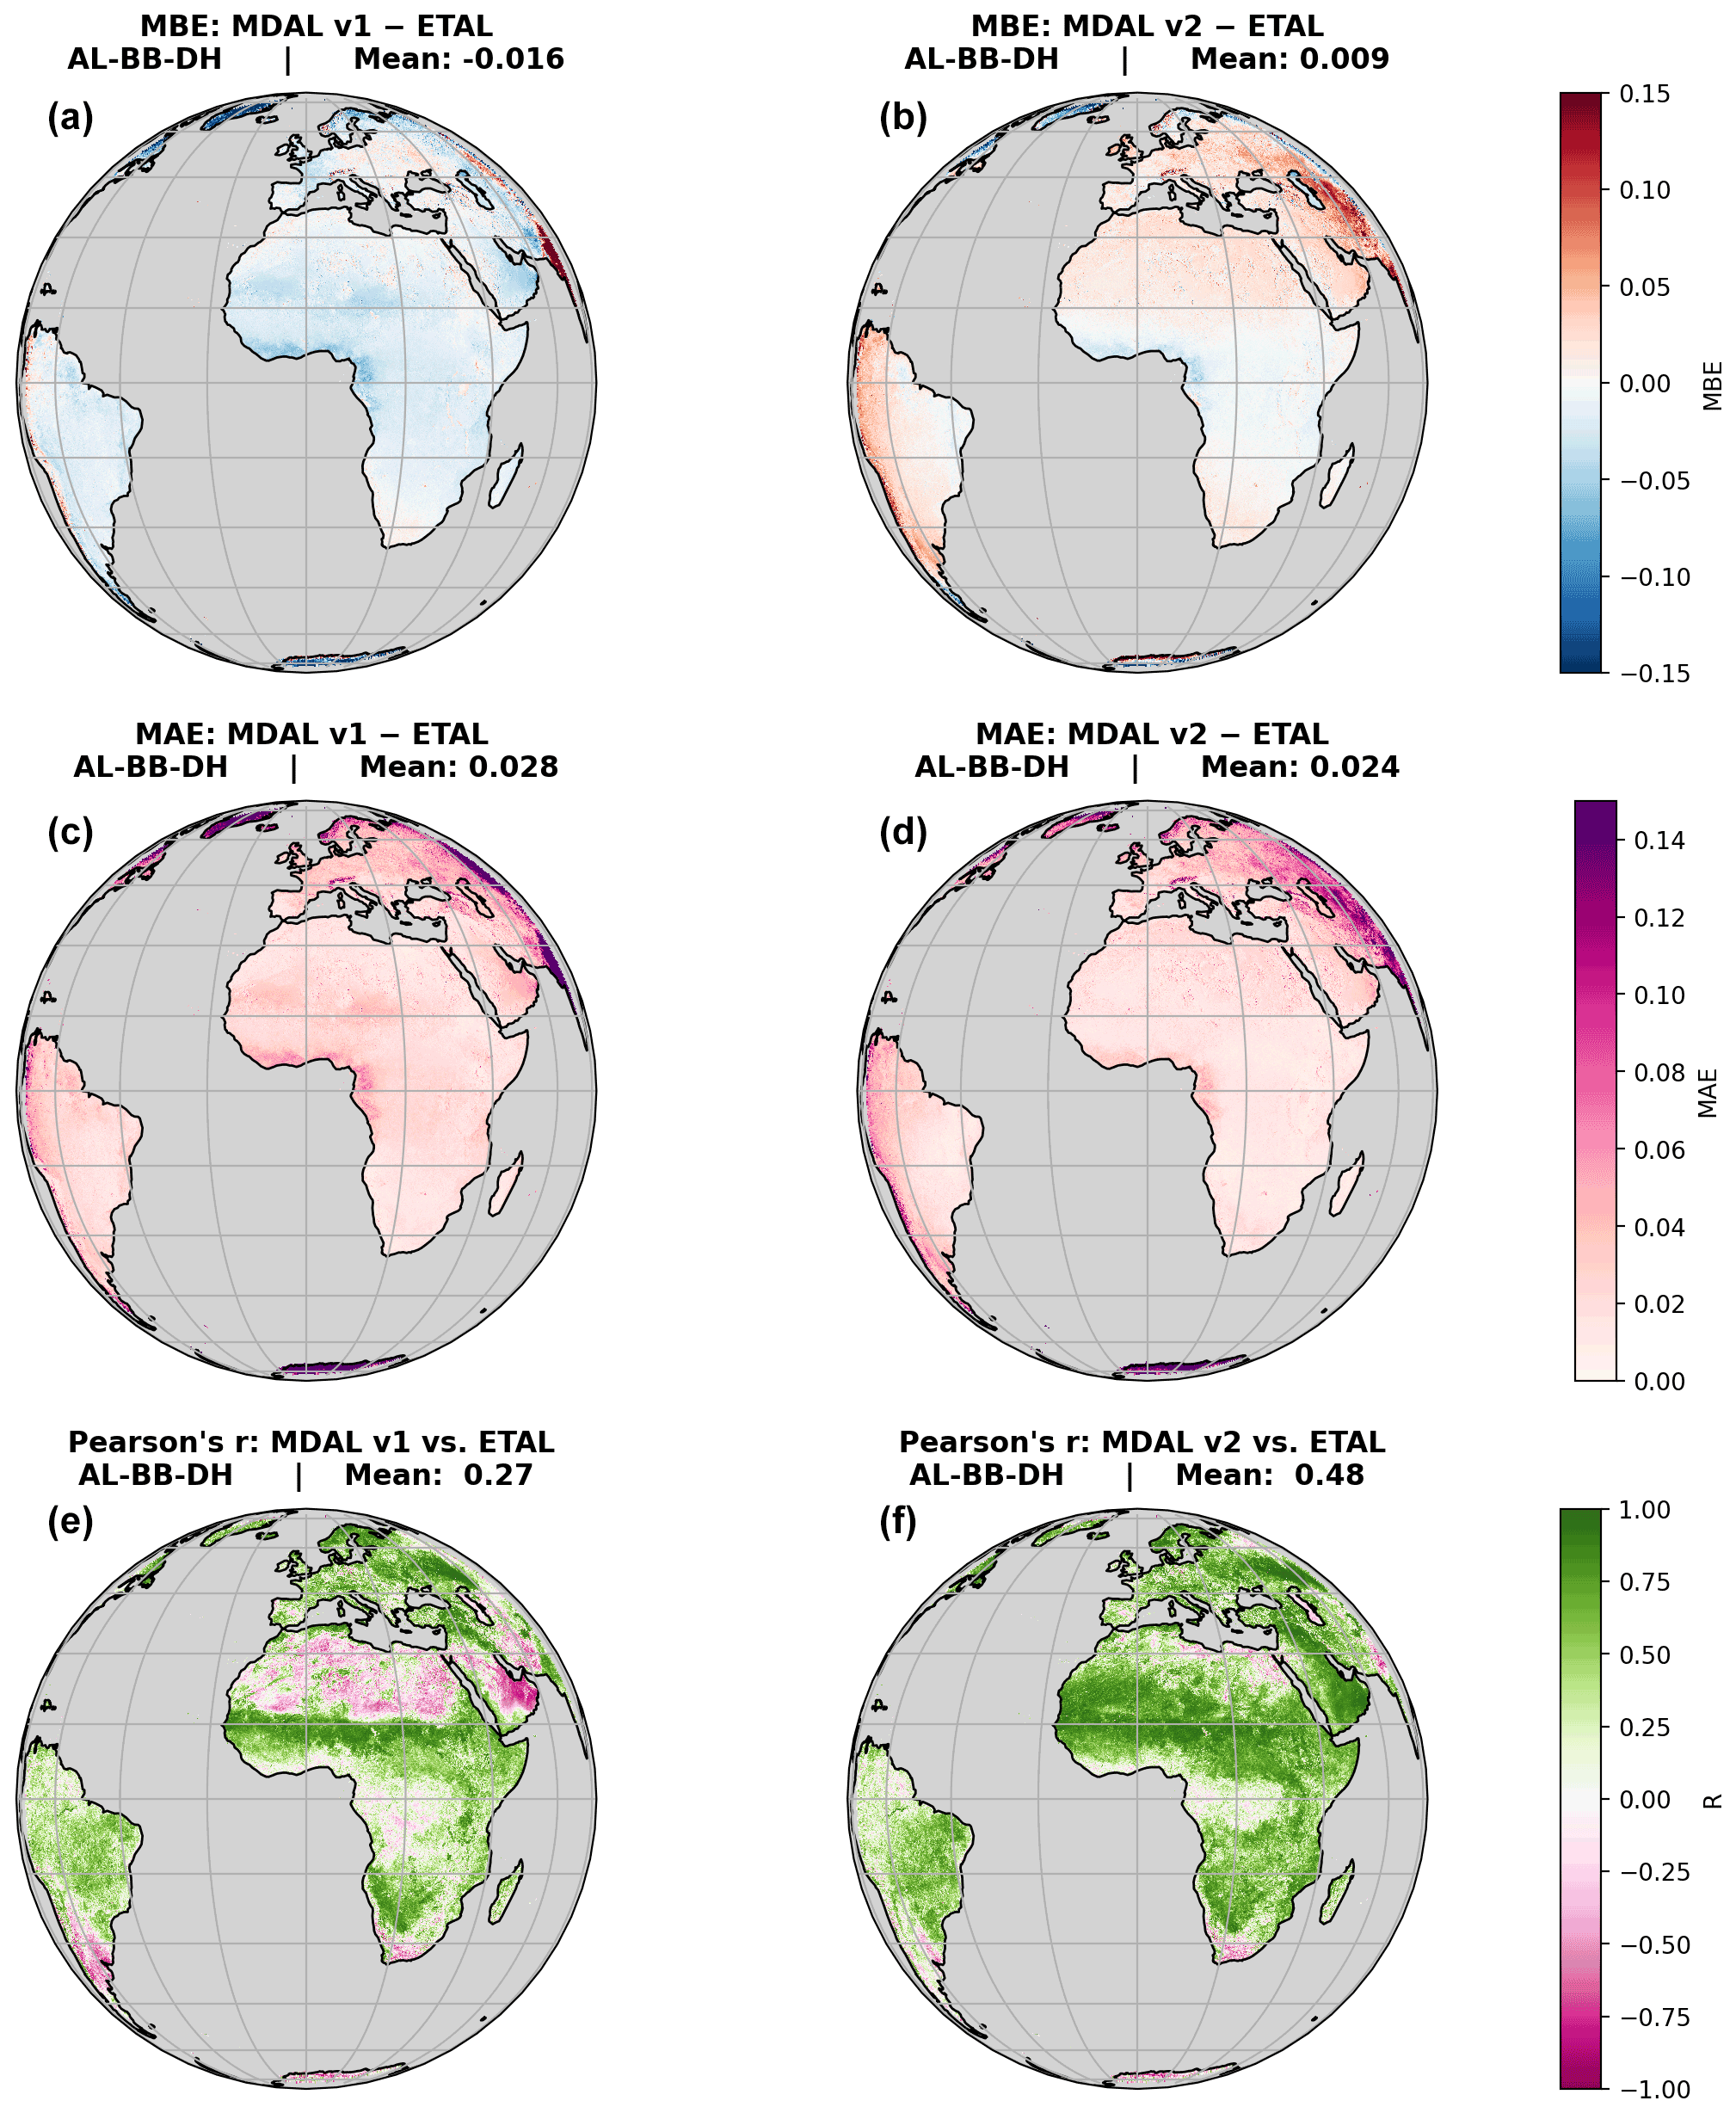
Figure A1Plots showing performance of MDAL v1 and v2 against ETAL for all pixels, for AL-BB-DH and analysis over 1 full year, from 1 November 2020 to 31 October 2021. (a, b) MBE; (c, d) MAE; (e, f) Pearson's correlation coefficient r.
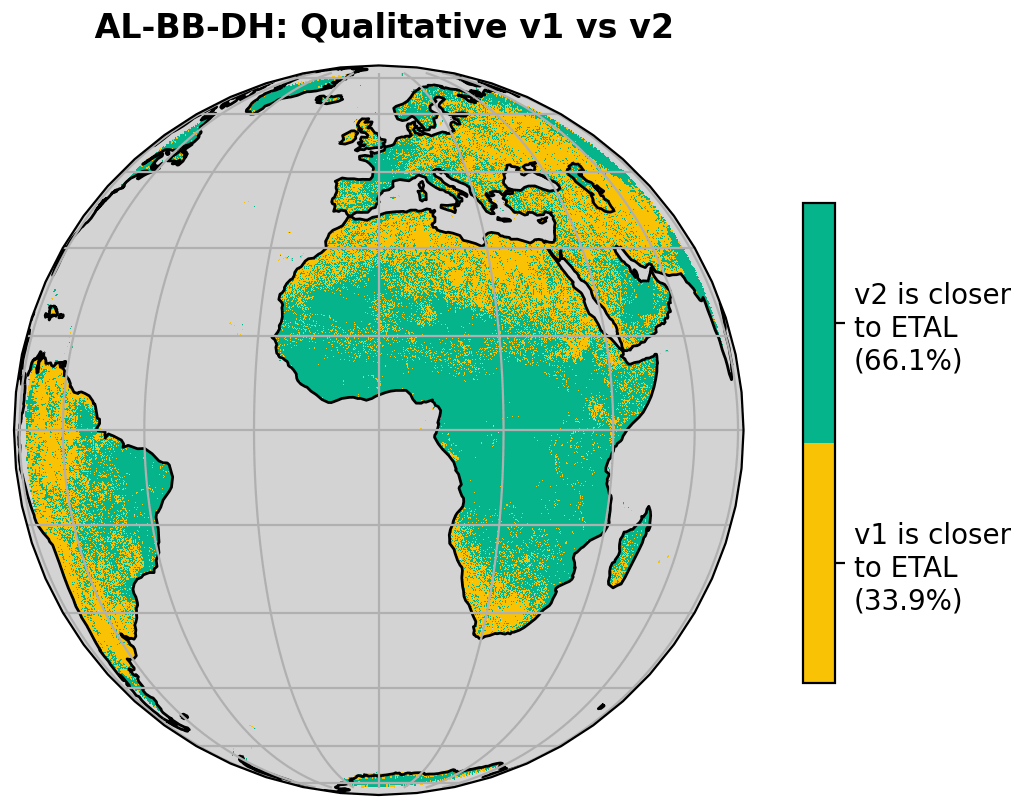
Figure A2Qualitative comparison of performance of MDAL v1 and v2 with respect to ETAL for AL-BB-DH.
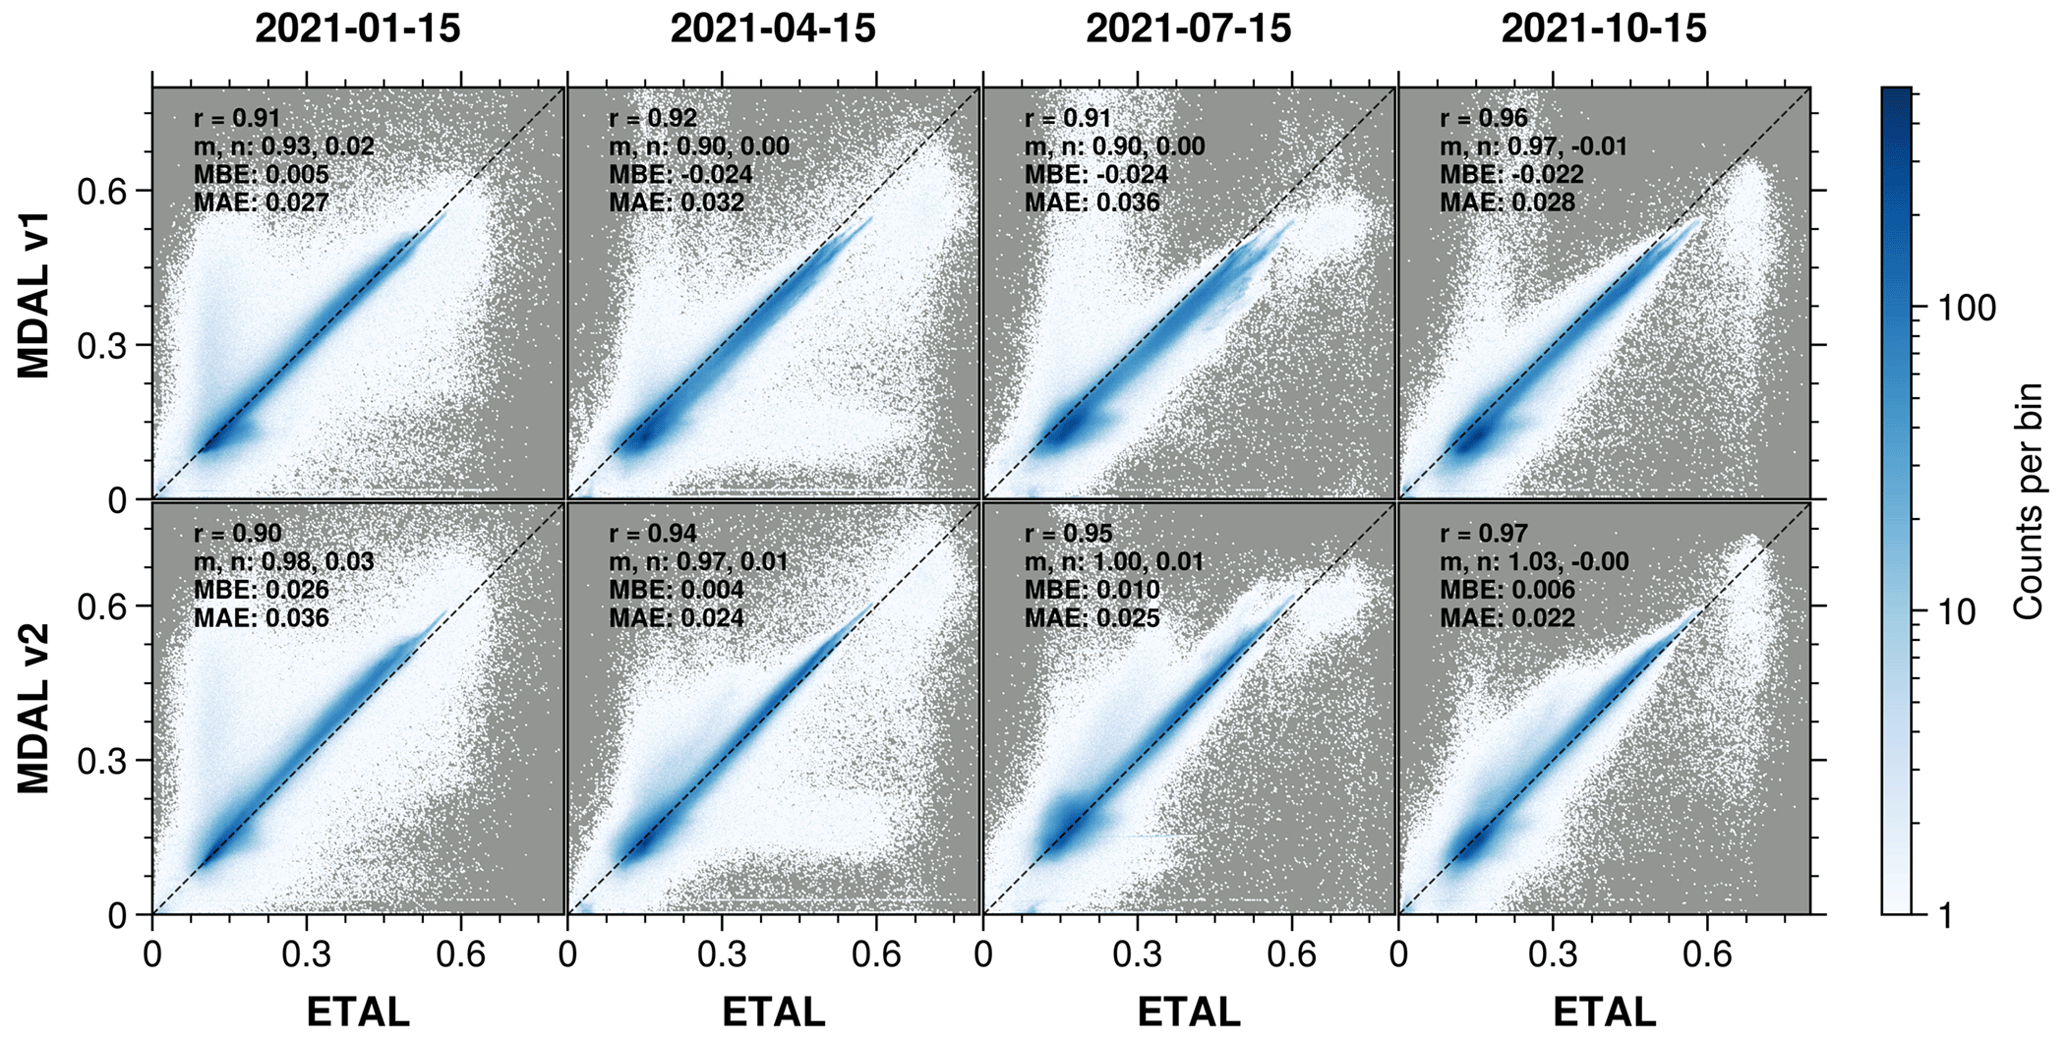
Figure A3Two-dimensional histogram highlighting correlation between MDAL v1 (top) and v2 (bottom) and ETAL, for BB-DH albedos for January, April, July and October 2021 (15th of each month). r is Pearson's correlation coefficient; m and n are the slope and intercept of a least-squares fitted linear regression line. The color scale is normalized to logarithmic scale for better visibility. The dashed line is the line of perfect correlation (m=1, n=0).
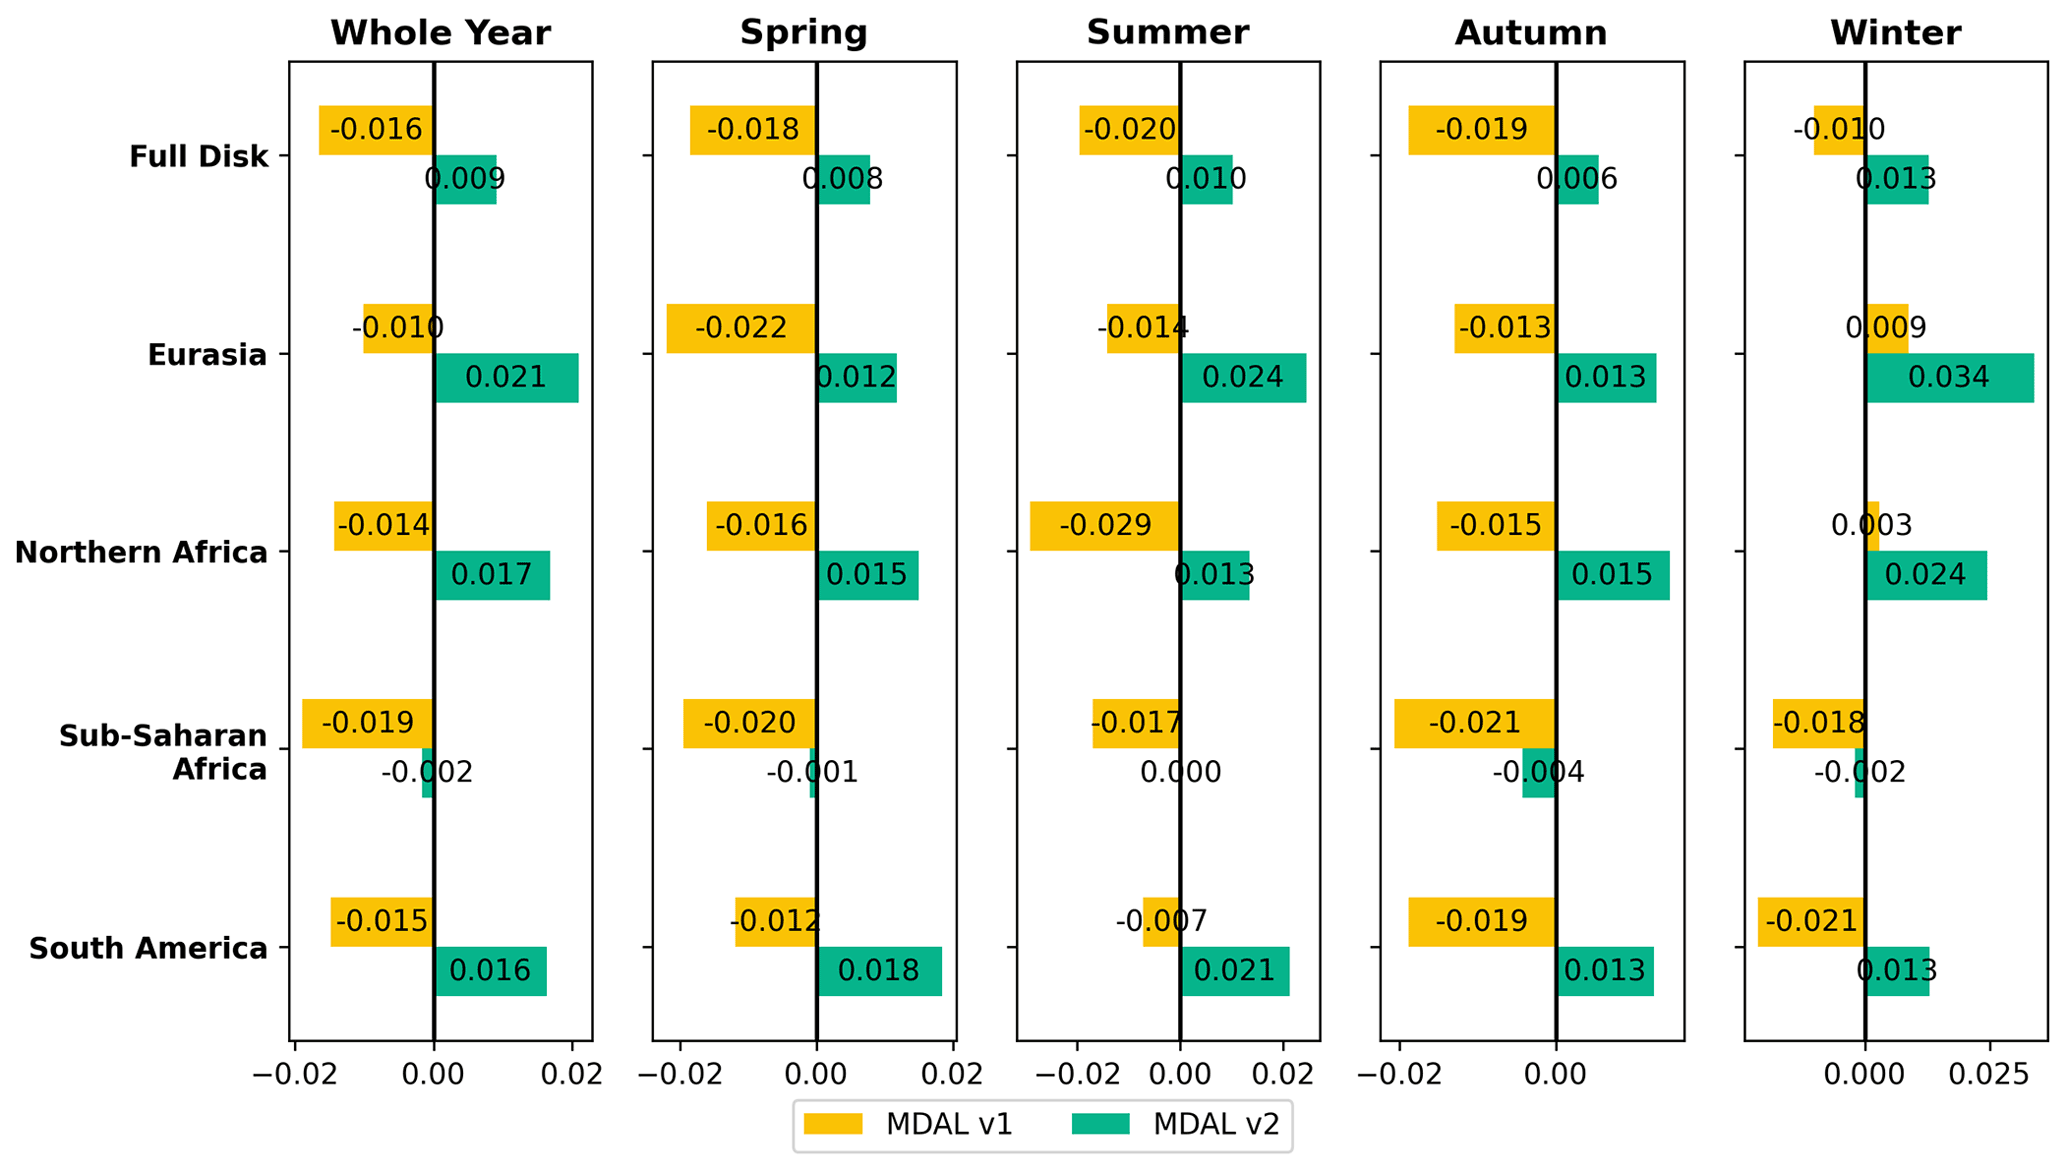
Figure A4Mean MBE with regard to ETAL by region and season (AL-BB-DH; season names referring to season months of the Northern Hemisphere; spring: MAM; summer: JJA; autumn: SON; winter: DJF).
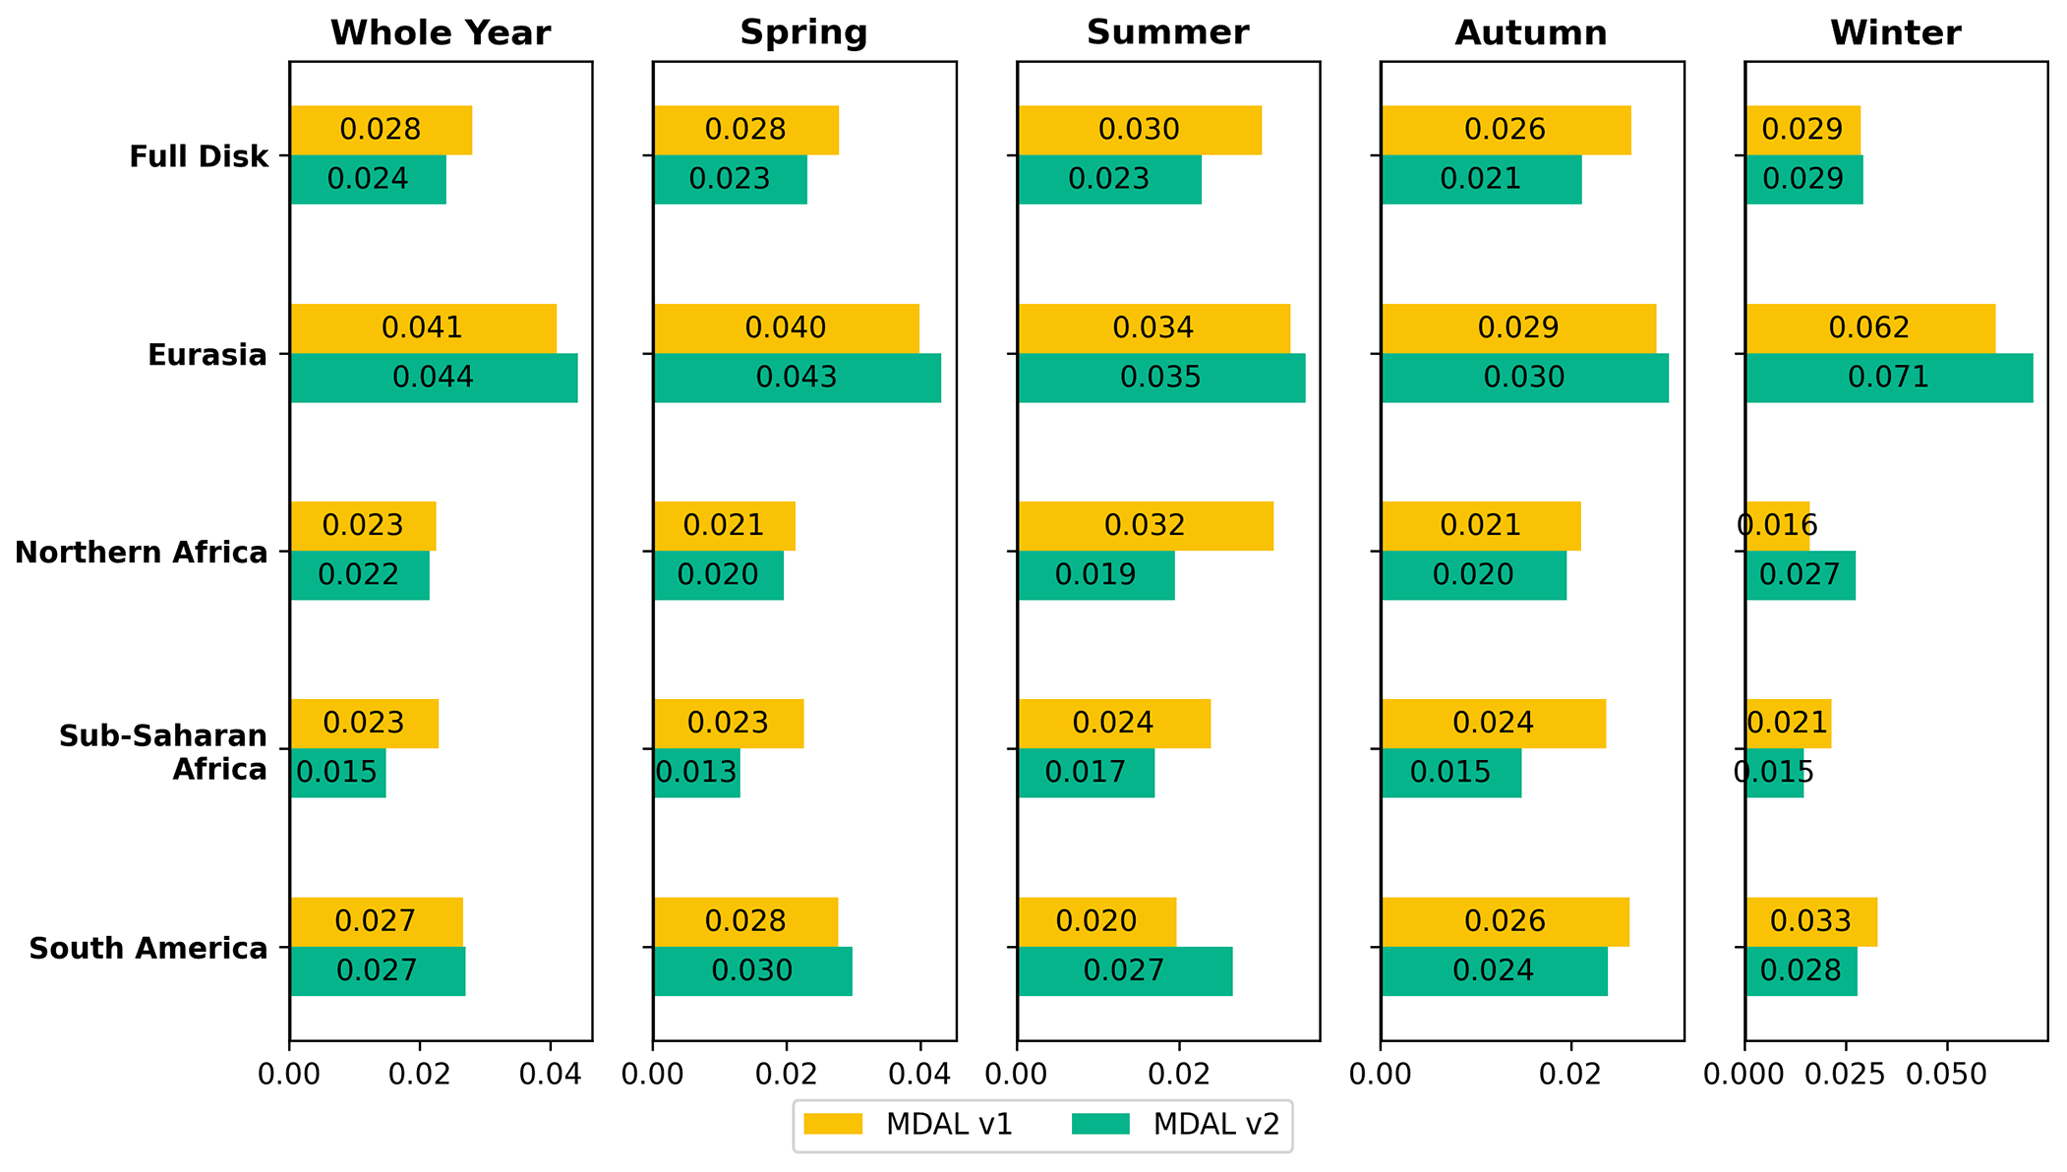
Figure A5Mean MAE with regard to ETAL by region and season (AL-BB-DH; season names referring to season months of the Northern Hemisphere; spring: MAM; summer: JJA; autumn: SON; winter: DJF).
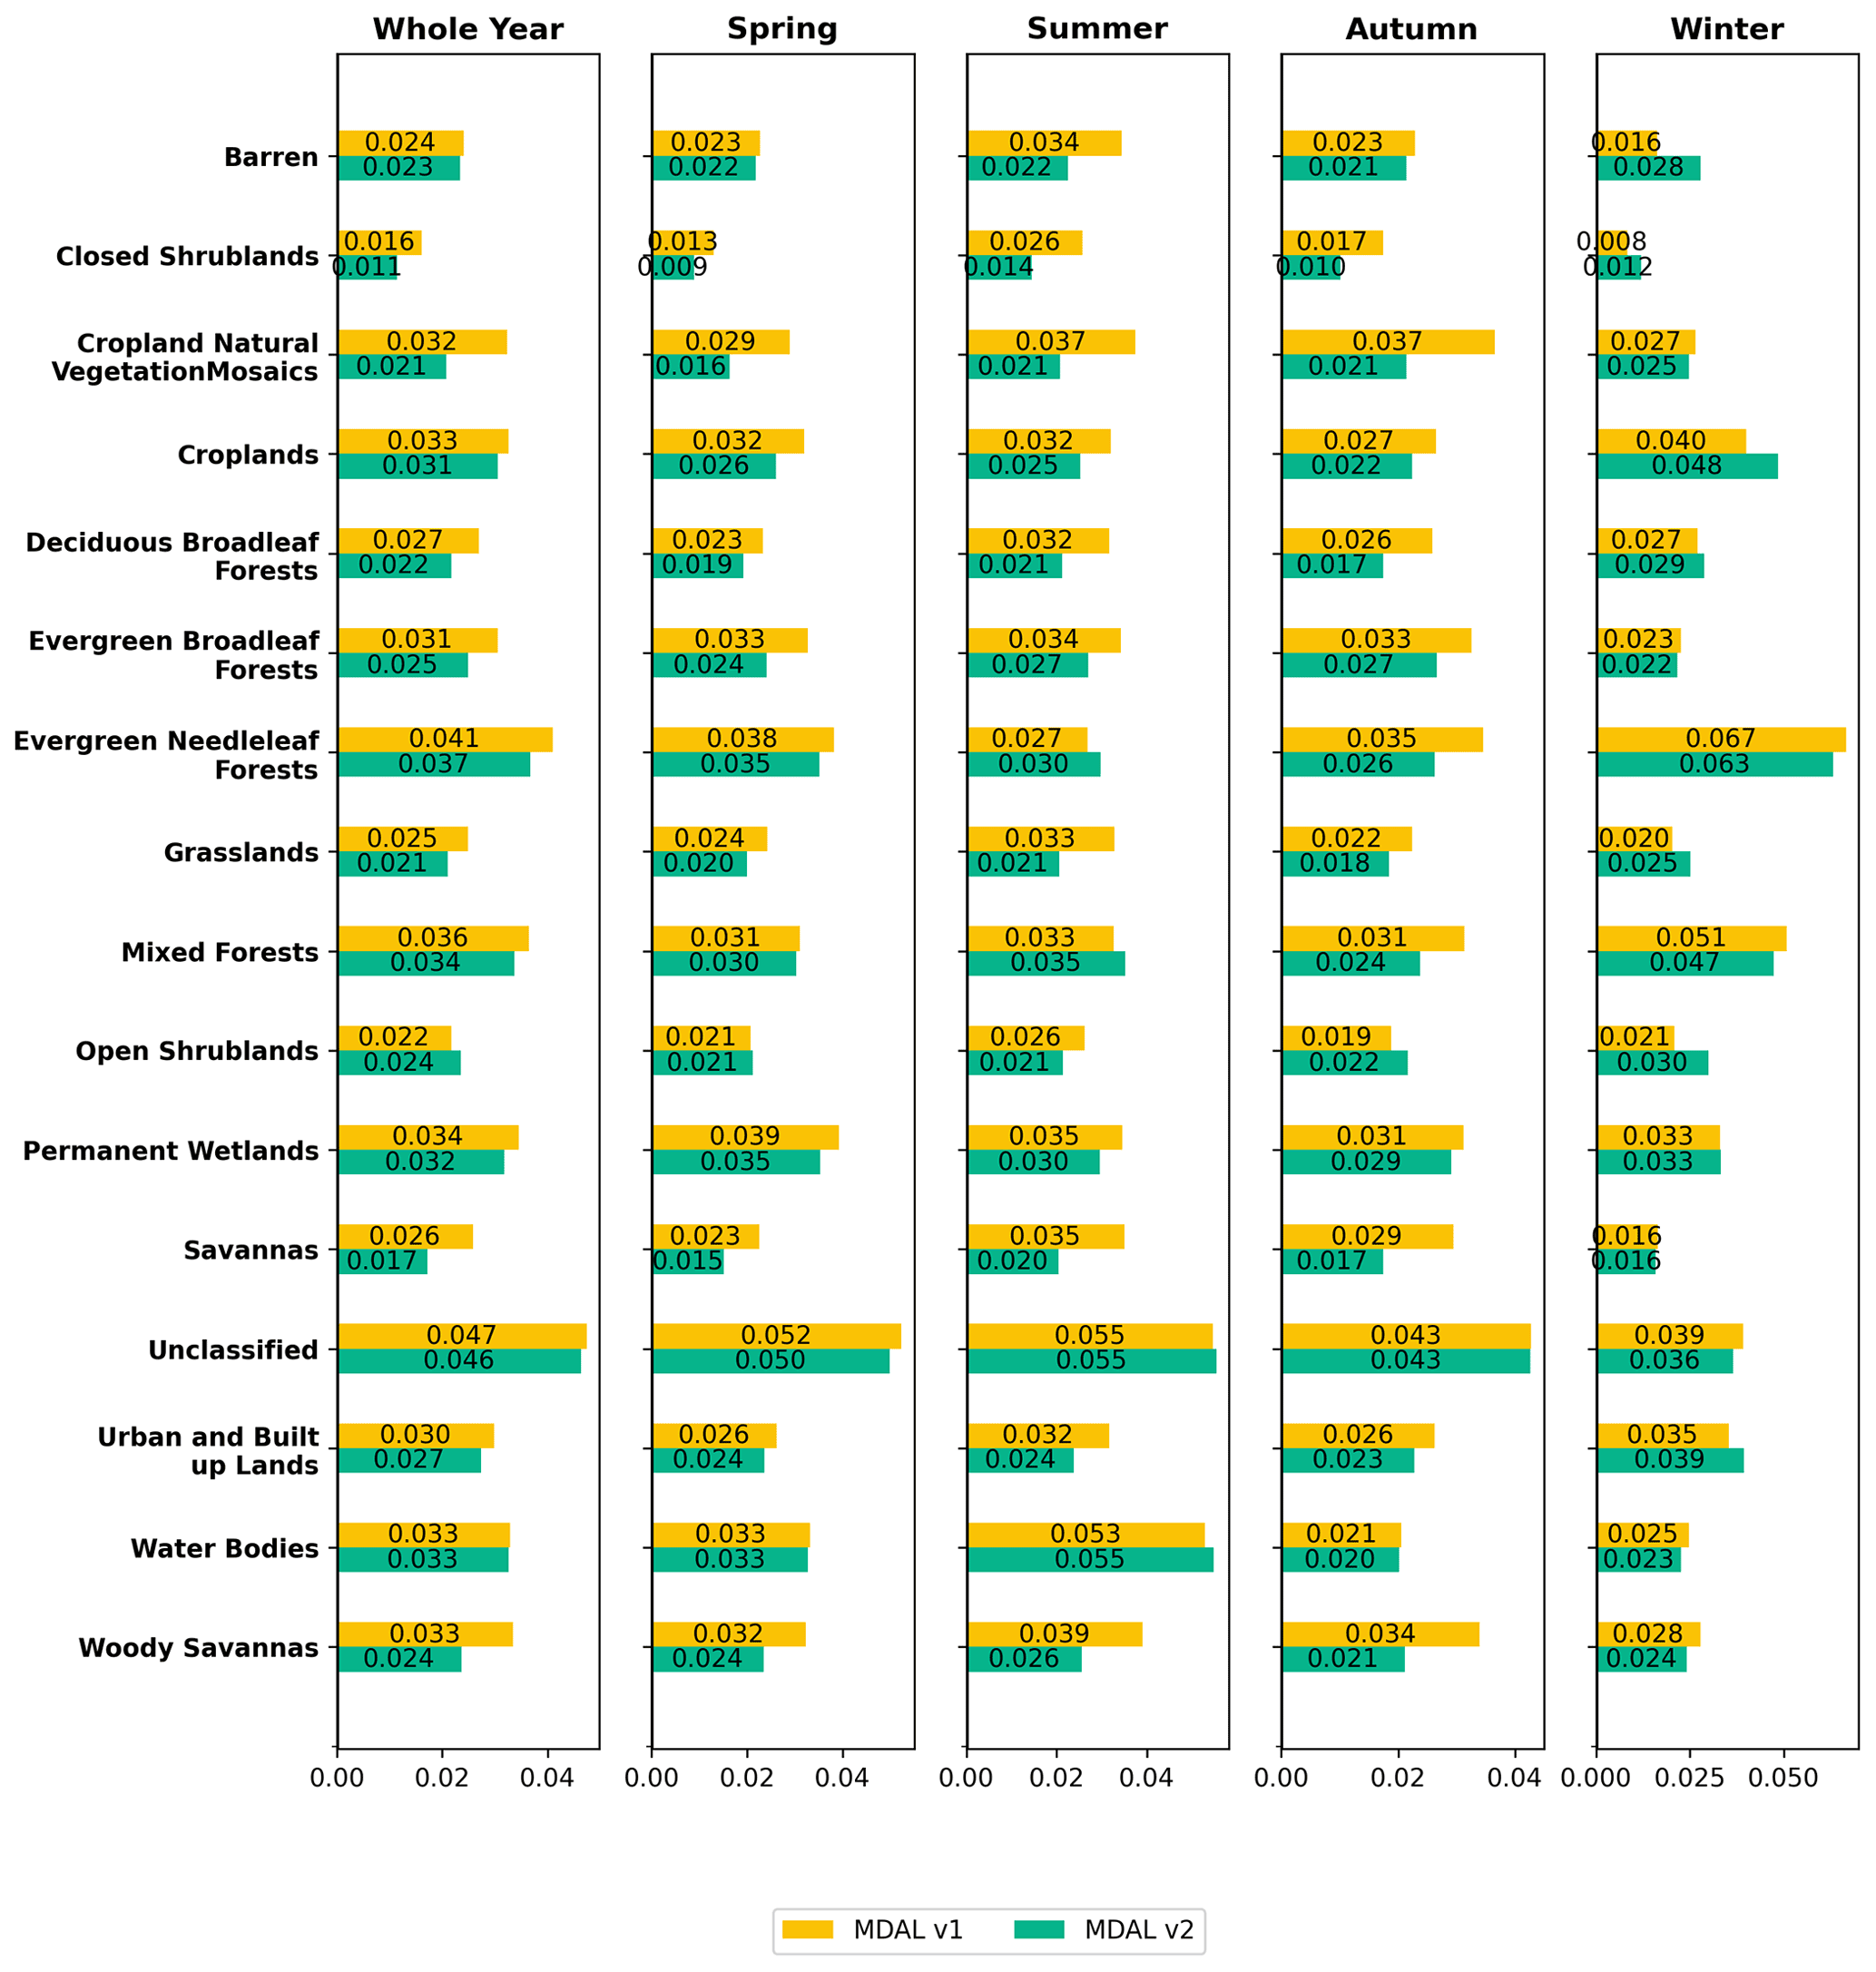
Figure A6Mean MAE with regard to ETAL by land cover and season (AL-BB-DH). For all pixels the “true” season was taken into account, depending on whether the pixel is located in the Northern or Southern Hemisphere.
All data used in this study are freely available. Operational MDAL and ETAL products are accessible through the EUMETSAT LSA-SAF website (respectively: https://landsaf.ipma.pt/en/products/albedo/albedo-copy/, https://landsaf.ipma.pt/en/products/albedo/etal/, EUMETSAT, 2022a, b). Results of the MDAL v2 experiment are available at https://doi.org/10.5281/zenodo.6414693 (Juncu et al., 2022). In situ data used in this study are provided by third parties: data from Cabauw (https://doi.org/10.1594/PANGAEA.940531, Knap, 2021), Gobabeb (https://doi.org/10.1594/PANGAEA.938527, Vogt, 2021) and Izana (https://doi.org/10.1594/PANGAEA.937907, Cuevas-Agulló, 2021) were obtained from BSRN through the PANGEA data portal (https://dataportals.pangaea.de/bsrn/, last accessed: 20/04/2022); data from Evora were obtained from Frank Göttsche (Karlsruhe Institute of Technology). MODIS MCD43D51 v6.1 and MCD43D61 v6.1 are available at https://doi.org/10.5067/MODIS/MCD43D51.061 and https://doi.org/10.5067/MODIS/MCD43D61.061, respectively (Schaaf and Wang, 2021a, b). MODIS MCD12Q1 v6 is available at https://doi.org/10.5067/MODIS/MCD12Q1.006 (Friedl and Sulla-Menashe, 2019).
The retrieval algorithm update was conceptualized by XC and IFT; it was implemented by DJ. The validation methodology was established by DJ and XC, validation execution and visualizations were done by DJ. Data were acquired and pre-processed by DJ. The MDAL v2 experiment was processed by SG and SCF. The article was written by DJ (original draft and paper preparation), XC (review and editing) and IFT (review). Project administration was done by IFT and XC.
The contact author has declared that none of the authors has any competing interests.
Publisher’s note: Copernicus Publications remains neutral with regard to jurisdictional claims in published maps and institutional affiliations.
MDAL and ETAL albedo data were provided by the EUMETSAT Satellite Application Facility on Land Surface Analysis (LSA-SAF: http://lsa-saf.eumetsat.int, last access: 16 November 2022; Trigo et al., 2011). For help regarding in situ data we thank Frank Göttsche (Karlsruhe Institute of Technology) for providing data and information for Evora and useful information for Gobabeb and Wouter Knap (Royal Netherlands Meteorological Institute) for providing additional information on Cabauw. This work was done within the framework of the LSA-SAF project, funded by EUMETSAT.
This research has been supported by the European Organization for the Exploitation of Meteorological Satellites (grant no. LSA-SAF CDOP-3).
This paper was edited by Ralf Srama and reviewed by two anonymous referees.
Arboleda, A., Ghilain, N., and Gellens-Meulenberghs, F.: Continuous monitoring of evapotranspiration (ET) overview of LSA-SAF evapotranspiration products, in: Remote Sensing for Agriculture, Ecosystems, and Hydrology XIX, Vol. 10421, 104210E, International Society for Optics and Photonics, https://doi.org/10.1117/12.2278249, 2017. a
Becerril-Piña, R., Díaz-Delgado, C., Mastachi-Loza, C. A., and González-Sosa, E.: Integration of remote sensing techniques for monitoring desertification in Mexico, Hum. Ecol. Risk Assess., 22, 1323–1340, https://doi.org/10.1080/10807039.2016.1169914, 2016. a
Carrer, D., Roujean, J.-L., and Meurey, C.: Comparing Operational MSG/SEVIRI Land Surface Albedo Products From Land SAF With Ground Measurements and MODIS, IEEE T. Geosci. Remote Sens., 48, 1714–1728, https://doi.org/10.1109/TGRS.2009.2034530, 2010. a
Carrer, D., Pinault, F., Lellouch, G., Trigo, I. F., Benhadj, I., Camacho, F., Ceamanos, X., Moparthy, S., Munoz-Sabater, J., Schüller, L., and Sánchez-Zapero, J.: Surface Albedo Retrieval from 40-Years of Earth Observations through the EUMETSAT/LSA SAF and EU/C3S Programmes: The Versatile Algorithm of PYALUS, Remote Sensing, 13, 372, https://doi.org/10.3390/rs13030372, 2021. a
Ceamanos, X., Carrer, D., and Roujean, J.-L.: Improved retrieval of direct and diffuse downwelling surface shortwave flux in cloudless atmosphere using dynamic estimates of aerosol content and type: application to the LSA-SAF project, Atmos. Chem. Phys., 14, 8209–8232, https://doi.org/10.5194/acp-14-8209-2014, 2014. a
Ceamanos, X., Six, B., and Riedi, J.: Quasi-Global Maps of Daily Aerosol Optical Depth From a Ring of Five Geostationary Meteorological Satellites Using AERUS-GEO, J. Geophys. Res.-Atmos., 126, e2021JD034906, https://doi.org/10.1029/2021JD034906, 2021. a
Cedilnik, J., Carrer, D., Mahfouf, J.-F., and Roujean, J.-L.: Impact assessment of daily satellite-derived surface albedo in a limited-area NWP model, J. Appl. Meteorol. Clim., 51, 1835–1854, https://doi.org/10.1175/JAMC-D-11-0163.1, 2012. a
Cuevas-Agulló, E.: Basic and other measurements of radiation at station Izana (2021-10). Izaña Atmospheric Research Center, Meteorological State Agency of Spain, PANGAEA [data set], https://doi.org/10.1594/PANGAEA.937907, 2021. a, b
Dirmeyer, P. A. and Shukla, J.: Albedo as a modulator of climate response to tropical deforestation, J. Geophys. Res.-Atmos., 99, 20863–20877, https://doi.org/10.1029/94JD01311, 1994. a
Driemel, A., Augustine, J., Behrens, K., Colle, S., Cox, C., Cuevas-Agulló, E., Denn, F. M., Duprat, T., Fukuda, M., Grobe, H., Haeffelin, M., Hodges, G., Hyett, N., Ijima, O., Kallis, A., Knap, W., Kustov, V., Long, C. N., Longenecker, D., Lupi, A., Maturilli, M., Mimouni, M., Ntsangwane, L., Ogihara, H., Olano, X., Olefs, M., Omori, M., Passamani, L., Pereira, E. B., Schmithüsen, H., Schumacher, S., Sieger, R., Tamlyn, J., Vogt, R., Vuilleumier, L., Xia, X., Ohmura, A., and König-Langlo, G.: Baseline Surface Radiation Network (BSRN): structure and data description (1992–2017), Earth Syst. Sci. Data, 10, 1491–1501, https://doi.org/10.5194/essd-10-1491-2018, 2018. a
EUMETSAT: MSG Daily Surface Albedo (MDAL), EUMETSAT [data set], https://landsaf.ipma.pt/en/products/albedo/albedo-copy/, last access: 16 November 2022a. a
EUMETSAT: EPS Surface Albedo (ETAL), EUMETSAT [data set], https://landsaf.ipma.pt/en/products/albedo/etal/, last access: 16 November 2022b. a
Friedl, M. and Sulla-Menashe, D.: MCD12Q1 MODIS/Terra+Aqua Land Cover Type Yearly L3 Global 500m SIN Grid V006, NASA EOSDIS Land Processes DAAC [data set], https://doi.org/10.5067/MODIS/MCD12Q1.006, 2019. a, b
Friedl, M. A., Sulla-Menashe, D., Tan, B., Schneider, A., Ramankutty, N., Sibley, A., and Huang, X.: MODIS Collection 5 global land cover: Algorithm refinements and characterization of new datasets, Remote Sens. Environ., 114, 168–182, https://doi.org/10.1016/j.rse.2009.08.016, 2010. a
García, M., Sandholt, I., Ceccato, P., Ridler, M., Mougin, E., Kergoat, L., Morillas, L., Timouk, F., Fensholt, R., and Domingo, F.: Actual evapotranspiration in drylands derived from in-situ and satellite data: Assessing biophysical constraints, Remote Sens. Environ., 131, 103–118, https://doi.org/10.1016/j.rse.2012.12.016, 2013. a
García-Haro, F., Camacho-de Coca, F., Meliá, J., and Martínez, B.: Operational derivation of vegetation products in the framework of the LSA SAF project, in: Proceedings of 2005 EUMETSAT Meteorological Satellite Conference, Dubrovnik, Croatia, 19–23, 2005. a
Geiger, B., Carrer, D., Franchisteguy, L., Roujean, J.-L., and Meurey, C.: Land surface albedo derived on a daily basis from Meteosat Second Generation observations, IEEE T. Geosci. Remote Sens., 46, 3841–3856, https://doi.org/10.1109/TGRS.2008.2001798, 2008. a, b
Ghilain, N., Arboleda, A., and Gellens-Meulenberghs, F.: Evapotranspiration modelling at large scale using near-real time MSG SEVIRI derived data, Hydrol. Earth Syst. Sci., 15, 771–786, https://doi.org/10.5194/hess-15-771-2011, 2011. a
Inness, A., Ades, M., Agustí-Panareda, A., Barré, J., Benedictow, A., Blechschmidt, A.-M., Dominguez, J. J., Engelen, R., Eskes, H., Flemming, J., Huijnen, V., Jones, L., Kipling, Z., Massart, S., Parrington, M., Peuch, V.-H., Razinger, M., Remy, S., Schulz, M., and Suttie, M.: The CAMS reanalysis of atmospheric composition, Atmos. Chem. Phys., 19, 3515–3556, https://doi.org/10.5194/acp-19-3515-2019, 2019. a
Juncu, D., Ceamanos, X., Trigo, I. F., Gomes, S., and Freitas, S. C.: MDAL v2: Experimental MSG daily albedo 01-11-2020 – 31-10-2021, Zenodo [data set], https://doi.org/10.5281/zenodo.6414693, 2022. a
Kharbouche, S., Song, R., and Muller, J.-P.: Ground-Based Observations for Validation (GBOV) of Copernicus Global Land Products: Algorithm Theoretical Basis Document – Energy products, Algorithm theoretical basis document, Copernicus/University College London, https://gbov.acri.fr/public/docs/products/2019-11/GBOV-ATBD-RM1-LP1-LP2_v1.3-Energy.pdf (last access: 16 November 2022), 2019. a, b
Knap, W.: Basic and other measurements of radiation at station Cabauw (2005-02 et seq). Koninklijk Nederlands Meteorologisch Instituut, De Bilt, PANGAEA [data set], https://doi.org/10.1594/PANGAEA.940531, 2022. a, b
Kotchenova, S. Y., Vermote, E. F., Matarrese, R., and Klemm, F. J.: Validation of a vector version of the 6S radiative transfer code for atmospheric correction of satellite data. Part I: Path radiance, Appl. Optics, 45, 6762–6774, https://doi.org/10.1364/AO.45.006762, 2006. a
Lellouch, G., Carrer, D., Vincent, C., Pardé, M., C. Frietas, S., and Trigo, I. F.: Evaluation of Two Global Land Surface Albedo Datasets Distributed by the Copernicus Climate Change Service and the EUMETSAT LSA-SAF, Remote Sensing, 12, 1888, https://doi.org/10.3390/rs12111888, 2020. a, b, c, d
Liang, S.: Narrowband to broadband conversions of land surface albedo I: Algorithms, Remote Sens. Environ., 76, 213–238, https://doi.org/10.1016/S0034-4257(00)00205-4, 2001. a
Meirink, J. F., Roebeling, R. A., and Stammes, P.: Inter-calibration of polar imager solar channels using SEVIRI, Atmos. Meas. Tech., 6, 2495–2508, https://doi.org/10.5194/amt-6-2495-2013, 2013. a
Proud, S. R., Fensholt, R., Rasmussen, M. O., and Sandholt, I.: A comparison of the effectiveness of 6S and SMAC in correcting for atmospheric interference of Meteosat Second Generation images, J. Geophys. Res.-Atmos., 115, D17209, https://doi.org/10.1029/2009JD013693, 2010. a
Rahman, H. and Dedieu, G.: SMAC: a simplified method for the atmospheric correction of satellite measurements in the solar spectrum, Int. J. Remote Sens., 15, 123–143, https://doi.org/10.1080/01431169408954055, 1994. a, b
Román, M. O., Schaaf, C. B., Woodcock, C. E., Strahler, A. H., Yang, X., Braswell, R. H., Curtis, P. S., Davis, K. J., Dragoni, D., Goulden, M. L., Gu, L., Hollinger, D. Y., Kolb, T. E., Meyers, T. P., Munger, J. W., Privette, J. L., Richardson, A. D., Wilson, T. B., and Wofsy, S. C.: The MODIS (Collection V005) BRDF/albedo product: Assessment of spatial representativeness over forested landscapes, Remote Sens. Environ., 113, 2476–2498, https://doi.org/10.1016/j.rse.2009.07.009, 2009. a
Roujean, J.-L., Leroy, M., and Deschamps, P.-Y.: A bidirectional reflectance model of the Earth's surface for the correction of remote sensing data, J. Geophys. Res.-Atmos., 97, 20455–20468, https://doi.org/10.1029/92JD01411, 1992. a
Schaaf, C. and Wang, Z.: MODIS/Terra+Aqua BRDF/Albedo Black Sky Albedo Shortwave Daily L3 Global 30ArcSec CMG V061, NASA EOSDIS Land Processes DAAC [data set], https://doi.org/10.5067/MODIS/MCD43D51.061, 2021a. a, b
Schaaf, C. and Wang, Z.: MODIS/Terra+Aqua BRDF/Albedo White Sky Albedo Shortwave Daily L3 Global 30ArcSec CMG V061, NASA EOSDIS Land Processes DAAC [data set], https://doi.org/10.5067/MODIS/MCD43D61.061, 2021b. a, b
Schaepman-Strub, G., Schaepman, M. E., Painter, T. H., Dangel, S., and Martonchik, J. V.: Reflectance quantities in optical remote sensing—Definitions and case studies, Remote Sens. Environ., 103, 27–42, https://doi.org/10.1016/j.rse.2006.03.002, 2006. a
Sulla-Menashe, D. and Friedl, M. A.: User Guide to Collection 6 MODIS Land Cover (MCD12Q1 and MCD12C1) Product, https://lpdaac.usgs.gov/documents/101/MCD12_User_Guide_V6.pdf (last access: 16 November 2022), 2018. a, b
Trigo, I. F., Dacamara, C. C., Viterbo, P., Roujean, J.-L., Olesen, F., Barroso, C., Camacho-de Coca, F., Carrer, D., Freitas, S. C., García-Haro, J., Geiger, B., Gellens-Meulenberghs, F., Ghilain, N., Meliá, J., Pessanha, L., Siljamo, N., and Arboleda, A.: The Satellite Application Facility for Land Surface Analysis, Int. J. Remote Sens., 32, 2725–2744, https://doi.org/10.1080/01431161003743199, 2011. a, b
Verhoef, W.: Light scattering by leaf layers with application to canopy reflectance modeling: The SAIL model, Remote Sens. Environ., 16, 125–141, https://doi.org/10.1016/0034-4257(84)90057-9, 1984. a
Vermote, E., Tanre, D., Deuze, J., Herman, M., and Morcette, J.-J.: Second Simulation of the Satellite Signal in the Solar Spectrum, 6S: an overview, IEEE T. Geosci. Remote Sens., 35, 675–686, https://doi.org/10.1109/36.581987, 1997. a
Vogt, R.: Basic and other measurements of radiation at station Gobabeb (2021-10). Meteorology Climatology Remote Sensing, Dep. Umweltwissenschaften, Universität Basel, PANGAEA [data set], https://doi.org/10.1594/PANGAEA.938527, 2021. a, b
Wang, Z., Schaaf, C., Lattanzio, A., Carrer, D., Grant, I., Román, M., Camacho, F., Yu, Y., Sánchez-Zapero, J., and Nickeson, J.: Global Surface Albedo Product Validation Best Practices Protocol. Version 1.0, in: Good Practices for Satellite-Derived Land Product Validation, p. 45, edited by: Wang, Z., Nickeson, J., and Román, M., Land Product Validation Subgroup (WGCV/CEOS), https://doi.org/10.5067/DOC/CEOSWGCV/LPV/ALBEDO.001, 2019. a
Wu, Z., Lei, S., Bian, Z., Huang, J., and Zhang, Y.: Study of the desertification index based on the albedo-MSAVI feature space for semi-arid steppe region, Environ. Earth Sci., 78, 1–13, https://doi.org/10.1007/s12665-019-8111-9, 2019. a