the Creative Commons Attribution 4.0 License.
the Creative Commons Attribution 4.0 License.
 | 07 Feb 2022
Research into using a fiber Bragg grating sensor group for three-dimensional in situ stress measurement
Yimin Liu
Zhengyang Hou
Hao Zhou
Guiyun Gao
Lu Yang
Pu Wang
Peng Wang
The observation and estimation of the deep crustal stress state is a key and difficult problem for in situ stress measurement. Using a borehole wall strain gauge based on the overcoring stress-relieving method is one of the main methods of in situ stress measurement. In this paper, a strain-sensing array based on fiber Bragg grating (FBG) is designed by using the main structure of the classical hollow inclusion cell, and its layout scheme on the hollow inclusion is studied. According to the layout scheme, the in situ stress inversion algorithm of hole wall strain to stress is deduced. Following this, the triaxial loading and unloading experiment platform is built, and the calibration experiment for the FBG strain sensor is designed. Finally, Abaqus finite element software is used to simulate the in situ stress measurement process of the overcoring stress relief. The FBG strain values of each measurement direction before and after the overcoring process are extracted, and the stress inversion equation is used to carry out the stress inversion. The comparison of the inversion results proved that the FBG strain sensor group is feasible and reliable. The quasi-distributed FBG sensor module designed in this paper can invert the three-dimensional in situ stress by measuring the hole wall strain, which places a theoretical and experimental foundation for the development and application of an FBG hole wall strain gauge. It makes up for the deficiency of the existing hole wall strain gauge based on a resistance strain gauge, provides direct and accurate observations for hole wall strain measurement, and has important practical value for the development of in situ stress measurement technology.
- Article
(2937 KB) - Full-text XML
- BibTeX
- EndNote


The undisturbed stress in rock mass is called geo-stress or in situ stress (Amadei and Stephansson, 1997). Accurate determination of the in situ stress state of deep rock mass is one of the necessary methods for solving difficult problems in the study of rock mechanics in deep mining and crustal dynamics, and thus it is necessary to develop in situ stress testing methods and techniques. Among the recommended methods for rock mass stress measurement and estimation published by ISRM (International Society for Rock Mechanics) in 2003 (Ulusay, 2014), the hydraulic fracturing method and the overcoring stress-relieving method are mainly recommended (Hill et al., 1997; Amadei and Stephansson, 1997). The overcoring stress-relieving method is an in situ stress measurement method, based on use of a borehole, which inverses the in situ stress field by detecting the strain and deformation in the process of releasing the core from the parent rock.
As early as 1951, Swedish scholar Nils Hast began to use piezomagnetic (inductive) sensors to measure stress changes in the mining industry (Hast, 1958). The hole wall strain measuring instruments in the world are mainly the Centre for Scientific and Industrial Research (CSIR, South Africa) strain cell (Leeman, 1964), the CSIR-type triaxial strain gauge (Leeman, 1971), the (CSIRO) hollow inclusion (HI)-type cell (Worotnicki and Walton, 1979), and the Borre triaxial hole wall strain gauge of the Swedish National Electricity Authority (Sjöberg and Klasson, 2003). Some scholars use (CSIRO)HI-type digital hollow inclusion cells to evaluate stress state in the rock mass near the coring point (Iabichino, 2014). In China, the main devices used are CKX01 hollow inclusion triaxial strain gauges developed by the Yangtze River Academy of Sciences (Zhong et al., 2002), an improved hollow inclusion cell, with complete temperature compensation developed by University of Science and Technology Beijing (Cai et al., 2000) and KX2002-type hollow inclusion triaxial strain cells developed by the Institute of Geomechanics at the Chinese Academy of Geological Sciences (Liu et al., 2011).
As an improved hole wall strain gauge, a hollow inclusion cell uses multiple groups of resistance strain gauges with temperature compensation as sensors to calculate the in situ stress. The epoxy resin shell wrapped outside the resistance strain gauge is better bonded to and coupled with the hole wall. A photo of hollow inclusion cell and a layout diagram of the strain gauges are shown in Fig. 1. This gauge can measure the stress tensor in a single hole to obtain the three-dimensional stress state of rock mass and form a set of standardized measurement procedures, making it one of the most applicable and reliable in situ stress measurement methods (Cai et al., 2000; Liu et al., 2011).
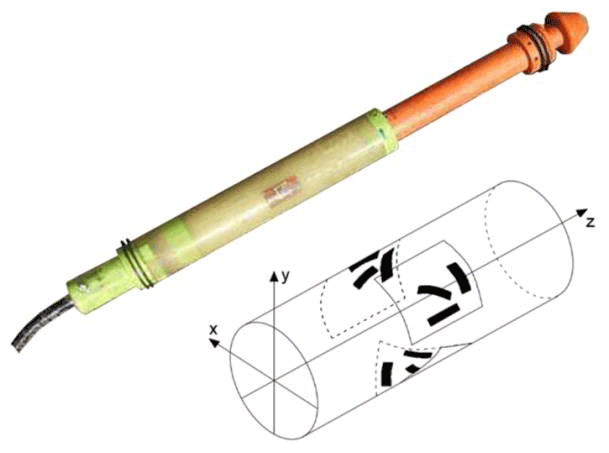
Figure 1The hollow inclusion cell and a layout diagram of the strain gauges.
At present, the hollow inclusion cell is based on the traditional resistance strain gauge electrical testing instruments. They are generally vulnerable to the interference of temperature, vibration (and other environmental factors), low measurement success rate, fewer data, but there is a lack of more advanced in situ stress measurement methods. A fiber Bragg grating (FBG) sensor has the advantage of having a small volume, high detection accuracy and spatial resolution, long sensing distance, and strong anti-electromagnetic interference ability, and thus it is very suitable for the field of stress and strain detection in underground space, borehole walls, rock, and soil mass (Hill and Meltz, 1997). In recent years, researchers have done a lot of scientific research and engineering practice on FBG stress and strain sensors. American scholars buried eight FBG strain sensors into a panel of Waterbury bridge on the Winooski River in the United States and detected a maximum strain value of 50 με (Fuhr et al., 1998). Chinese academic Ou Jinping embedded the encapsulated FBG strain gauge into the reinforced concrete beam to measure the strain of concrete and steel bars inside it and applied FBG technology to the field of health monitoring of major engineering structures (Ou, 2005). Dewolf et al. (2015) designed a vertical, unidirectional borehole strain meter based on optical fiber to measure Earth strain (Dewolf et al., 2015). Zhong et al. (2018) designed an FBG 3D geo-stress sensor and conducted a stress-loading simulation experiment on the sensor device, and the monitoring results of the sensor are basically consistent with the actual load stress. Maccioni et al. (2019) developed a three-axial fiber Bragg grating strain sensor for volcano monitoring, and the three-axial device showed a dynamic range of hundreds of microstrains at microstrain resolution (sub-microstrain concerning the vertical component).
The above research mainly focused on the health monitoring of engineering structures and the monitoring of dangerous rock masses and landslides. Up until now, there has been less research and fewer applications of FBG strain detection technology in the field of in situ stress measurement: there are only a few borehole Earth strain meters, geo-stress sensors, and volcano monitoring sensors based on optical fiber sensing technology, and there are even fewer mature and stable in situ measurement instruments and corresponding monitoring technologies. In this paper, FBG sensing technology is used to develop hole wall strain measurement technology for in situ stress measurement, and a three-dimensional in situ stress measurement sensor group based on an FBG sensor array is designed. The arrangement of the sensor array is studied, and the in situ stress inversion algorithm of FBG strain gauge is deduced, which lays an important theoretical and experimental foundation for the development and application of an FBG hole wall strain gauge.
2.1 Main structure
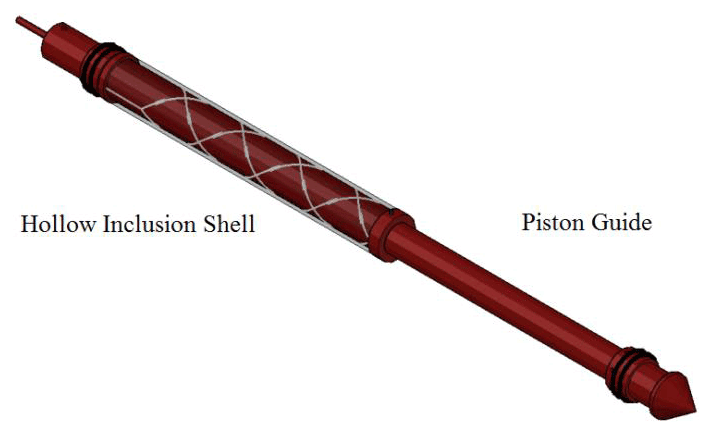
Referring to the main structure of the resistance strain gauge hollow inclusion cell, the main structure and size are designed by using AutoCAD mechanical design software, and the hollow inclusion shell and deformation tube are manufactured by using 3D printing technology. Following this, the FBG strain sensor is encapsulated in the hollow inclusion shell and covered with an epoxy resin shell to couple with the hole wall. The main structure is composed of two parts: the hollow inclusion shell and the piston guide. The tail of the piston guide is inserted into the hollow inclusion shell. The three-dimensional schematic diagram of the main structure is shown in Fig. 2.
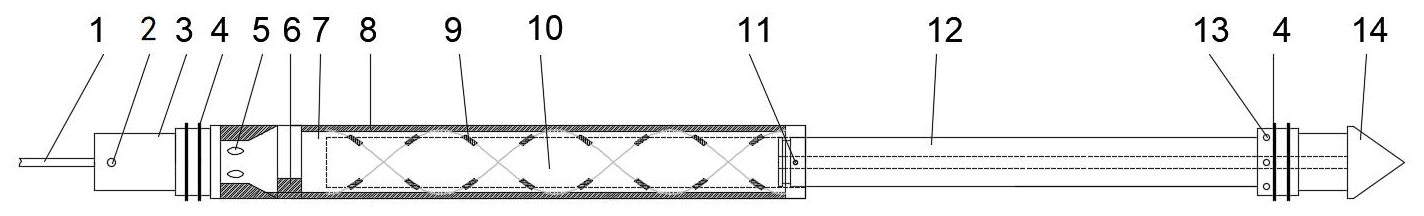
Figure 3Schematic diagram of the main structure: sensing optical fiber (1), locating pin (2), mounting rod (3), block circle (4), threading hole (5), conductor groove (6), tube body (7), epoxy resin (8), FBG sensor group (9), glue capsule (10), pin hole (11), piston rod (12), rubber outlet hole (13), conical guider (14).

In Fig. 3, the hollow inclusion shell in the main structure is composed of components (1)–(11), and the piston guide is composed of components (12)–(14). Before installation, the tail of the piston guide is inserted into the hollow inclusion shell, the glue capsule (10) in the hollow inclusion shell is filled with the prepared epoxy resin, and the piston and the shell are connected by an aluminum wire through the pin hole (11). The main body of the guiding part of the piston is made using 3D printing, and the top is a conical guider (14). There is a hollow channel in the center of the piston, which is connected with the rubber outlet hole (13), and below the rubber outlet hole are two block circles (4).
The hollow inclusion shell is the load-bearing matrix of the FBG sensor, which adopts a three-layered structure design, as shown in Fig. 4. The inner layer is a hollow matrix, which is used to store epoxy resin binder. The second layer is a thin PVC deformation tube that is sheathed on the hollow inclusion shell substrate, upon which the FBG sensor array is pasted. There is a gap between the deformation tube and the matrix, which can eliminate the interference of the matrix by presenting a higher hardness for the epoxy resin. The outermost layer is encapsulated with epoxy resin to protect the FBG sensor and play the role of strain coupling.

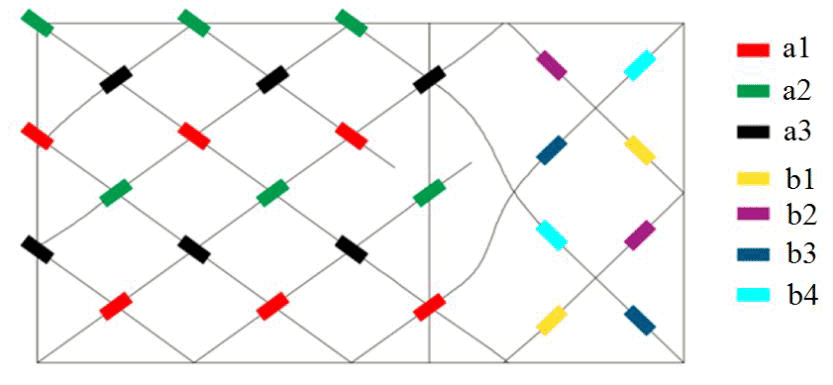
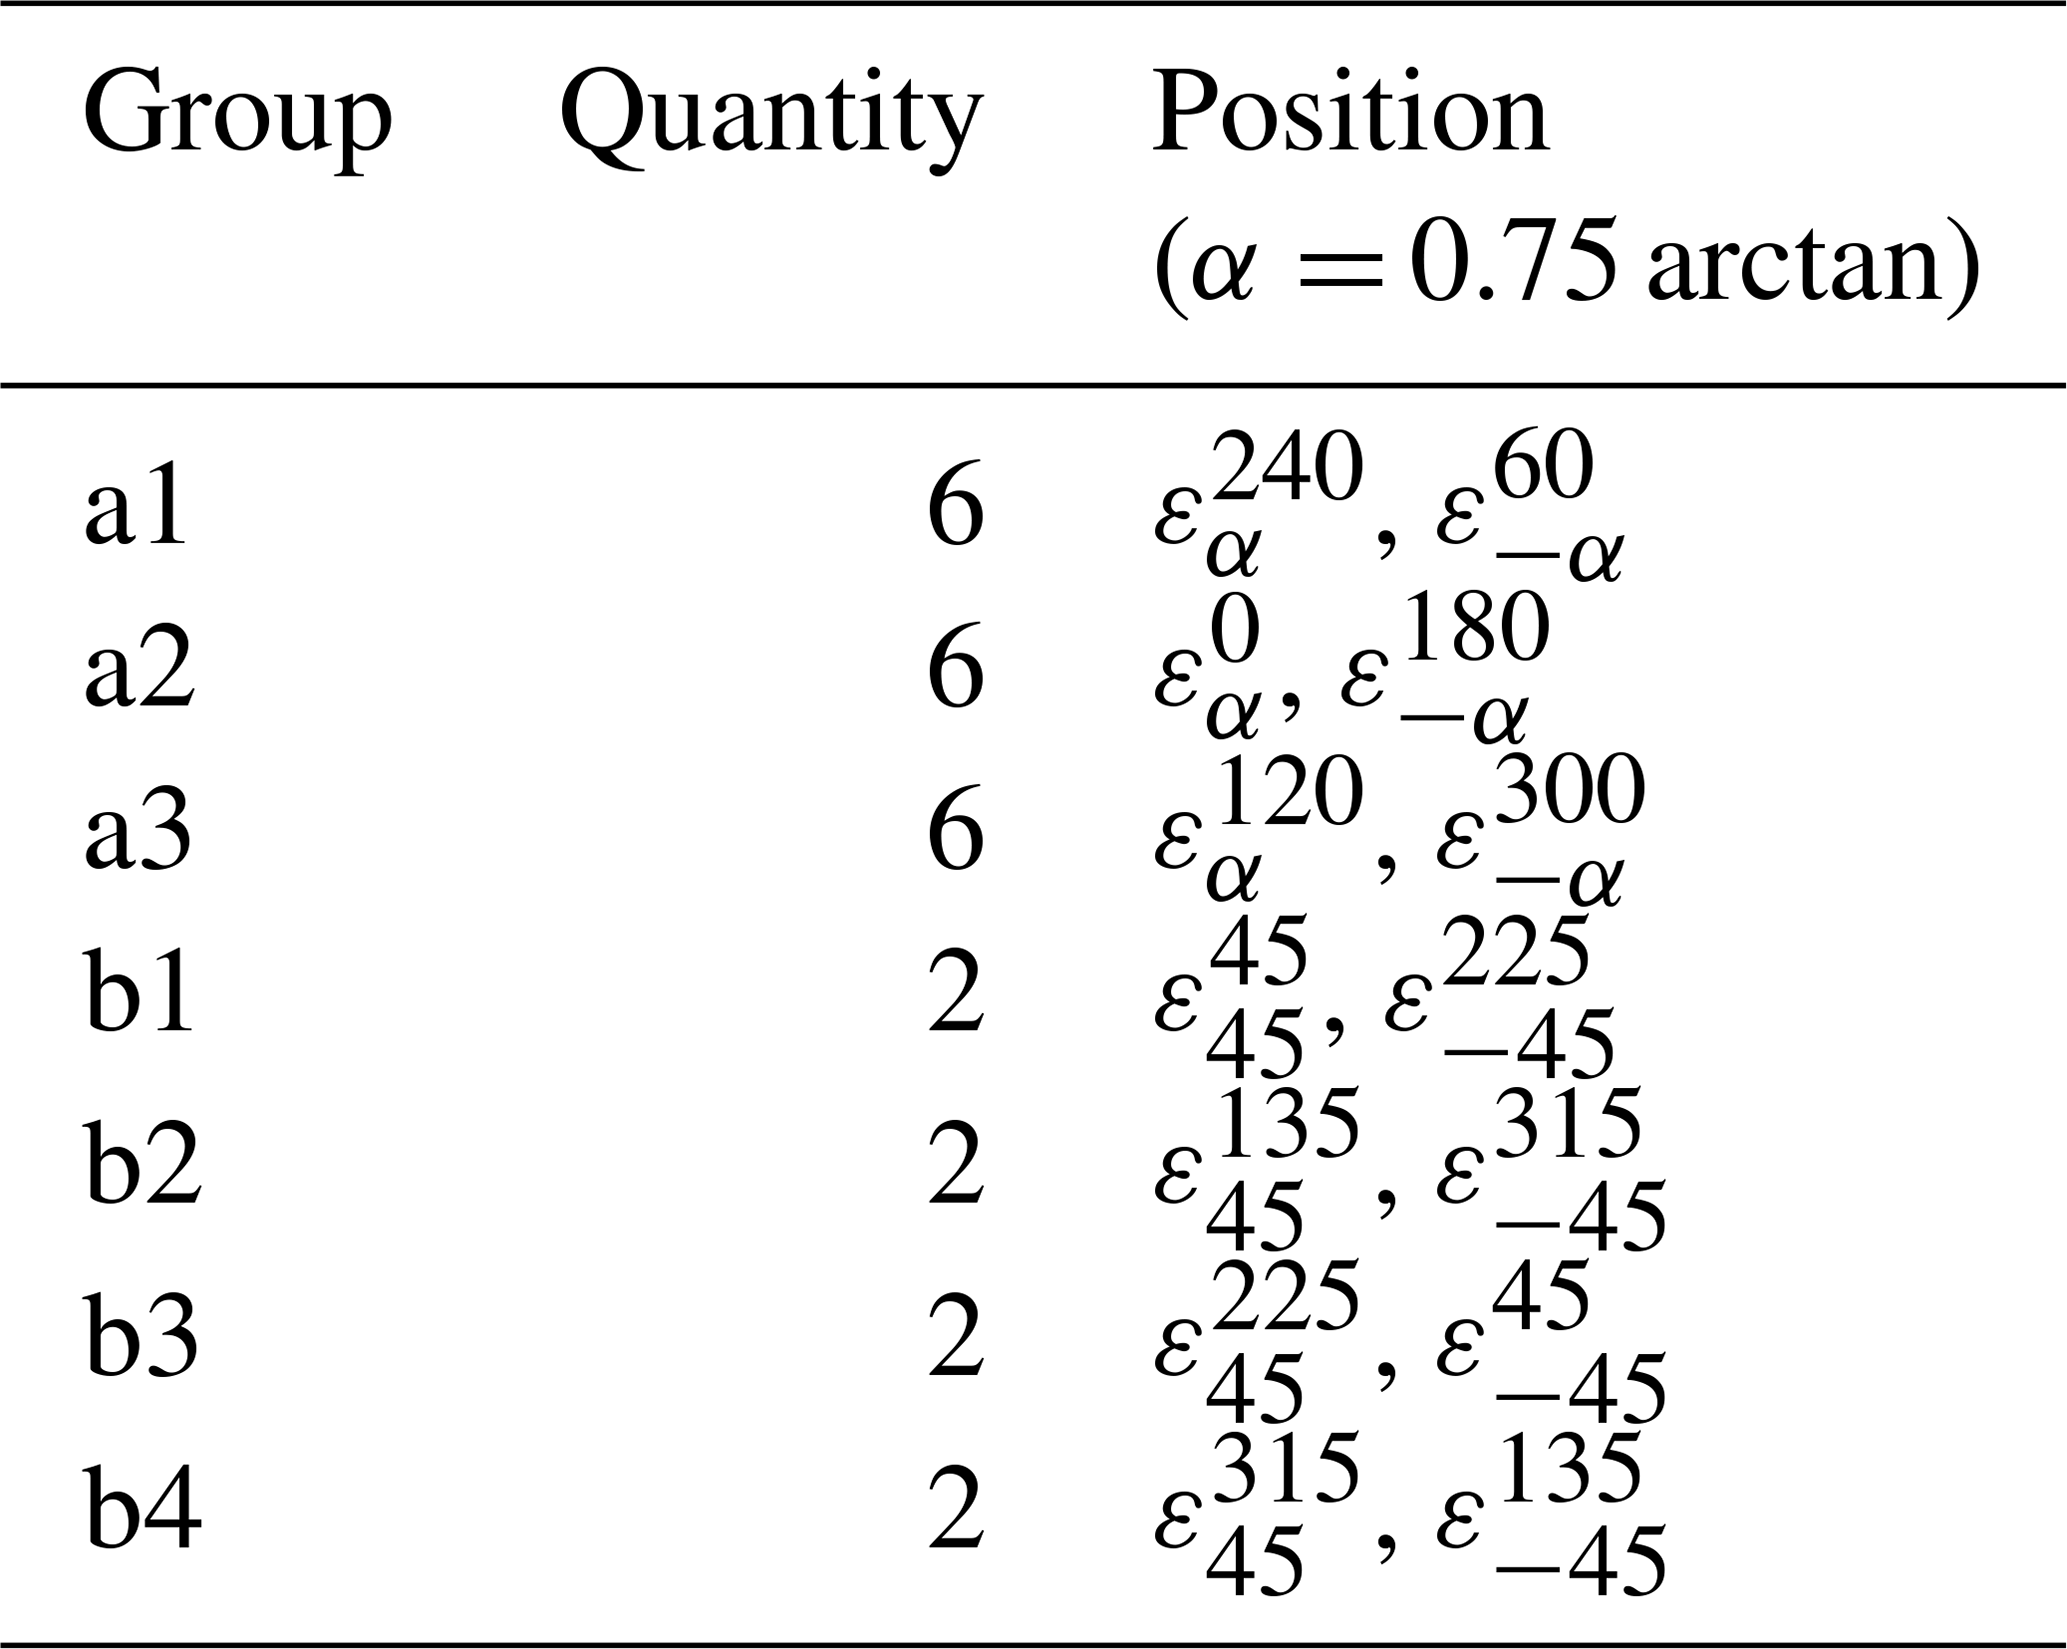
Table 1The corresponding spatial orientation of each sensor group.
2.2 Design and layout of FBG sensor group
The FBG strain sensor group adopts the installation mode of multi-group distributed winding, and 26 FBG sensing elements are arranged on the surface of the deformed tube by using six optical fibers. The layout position of the sensor group is shown in Fig. 5. The rectangle is the expanded deformed pipe wall surface, which is divided into two areas: A and B. The matching colors represent the FBG sensor being arranged on the same fiber.
There are 18 FBG sensors in area A, and the axial angle between the sensor and the tube is α (α= 0.75 arctan), arranged in circumferential directions of 0, 60, 120, 180, 240, and 300∘ in relation to the tube. There are eight FBG sensors in area B, and the axial angle between the sensor and the tube is ± 45∘, arranged in circumferential of directions 45, 135, 225 and 315∘ in relation to the tube. The sensors in areas A and B are distributed symmetrically. According to the principle of using the same FBGs with the same measurement direction and symmetrical position, 26 sensors are divided into seven groups, corresponding to (A1–B4) as shown in Fig. 6.
The corresponding spatial orientation of each sensor group is shown in Table 1.
The strain vectors corresponding to different groups of strain sensors are not correlated with each other. According to the stress inversion calculation of the hole wall strain method and the in situ stress calculation principle of hollow inclusion cell (Leeman, 1964; Cai, 2000), any six strain measurement data from different groups can be used to calculate the three-dimensional stress tensor. The FBG sensor group designed in this paper has seven different spatial orientations, and thus the three-dimensional stress tensor can be solved theoretically.
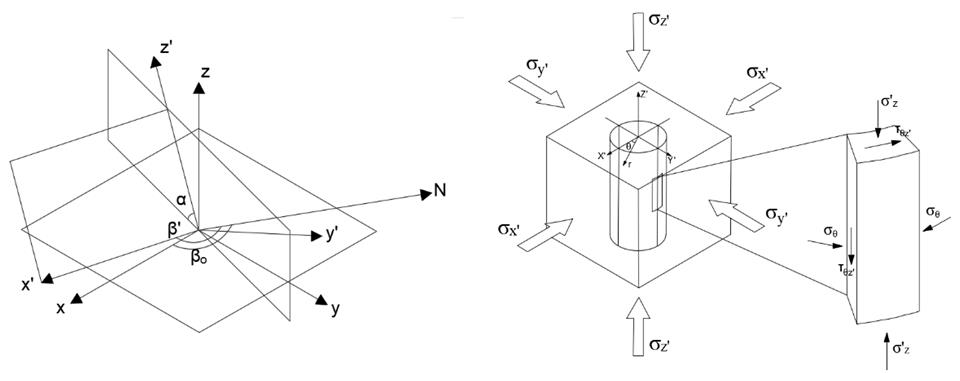
The stress inversion of FBG strain sensor group can be approximately regarded as the stress and strain problems on and around the borehole surface under the action of the three-dimensional stress field. According to the elastic theory, the stress inside the borehole can be calculated from the strain of hole wall, and following this the original rock stress state can be obtained (Cai, 2000). This specific calculation involves the transformation of stress components in the geodetic coordinate system O-xyz, the rectangular drilling coordinate system O-, and the cylindrical drilling coordinate system O-z′ρθ. Firstly, the stress transformation relationship between the cylindrical coordinate system and the rectangular drilling coordinate system is established. The relationship equation between the FBG strain and the stress component in the rectangular drilling coordinate system is obtained according to Hooke's theorem and the azimuth angle of the FBG sensor. Following this, the stress component in the geodetic coordinate system is used to represent the strain equation in the drilling coordinate system through the coordinate transformation equation. To solve this equation, the least-squares solution is the stress component used in the geodetic coordinate system. A diagram of the spatial relationship of the coordinate system is shown in the left-hand side of Fig. 7.
3.1 Relation equation of the strain component of hole wall
The micro-element is taken at the position of the hole wall, and the hole wall can be regarded as a plane on a small scale; the stress state of the hole-wall in the plane is shown in the right-hand side of Fig. 7. According to Hooke's law, the two-dimensional stress–strain relationship of the hole wall under the drilling column coordinate system is as follows:
where σθ represents the stress in the direction of θ axis, and are the shear stress and shear strain on plane , respectively, εφ represents the hole wall strain in the φ direction, E and G are elastic modulus and shear modulus of surrounding rock, respectively, and ν is Poisson's ratio of surrounding rock. Let r=a (at the hole wall). The equations transformed the stress component at (r, θ, z′) in cylindrical borehole coordinate system into the stress in the rectangular coordinate system as follows:
Using the two-dimensional strain component of the hole wall in the cylindrical coordinate system, the linear strain εθφ at any point and in any direction of the hole wall can be expressed, where θ is the azimuth of the line strain measurement point.
3.2 Stress inversion equation based on FBG arrangement
The θ and φ values of seven equivalent orientations are brought into Eq. (7) following the layout scheme of FBG strain sensor group, and the relationship equation between the strain measurement value and each stress component in the rectangular drilling coordinate system is obtained as follows:
where ε is the strain measurement value of a single sensor array, N is the stress–strain relation matrix, and σ is the stress component in the geodetic coordinate system. According to the orientation of the sensor, there is . The stress–strain relationship matrix is shown in Eq. (9), and K1, K2, K3, and K4 are correction factors of the epoxy resin influence effect. The correction factors K1, K2, K3, and K4 are mainly affected by the elastic modulus and Poisson's ratio of the surrounding rock and the epoxy resin (material of the hollow inclusion), the shape of the hollow inclusion, and the borehole size (Cai, 2000). Therefore, these K factors are variable and need to be recalculated according to different working conditions before each overcoring test. Therefore, the influence of strain transfer effect can be greatly reduced as a result of the elastic properties of different media, such as the surrounding rock and epoxy resin.
In the above equation, , , , , , , , , , and (Fama and Pender, 1980).
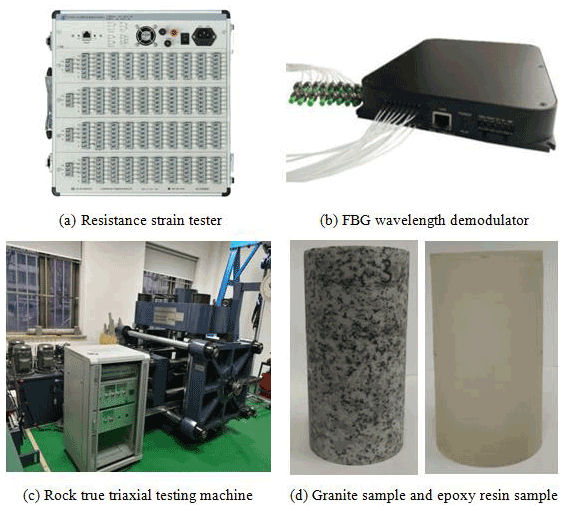
Figure 8The experimental platform.
Since some FBG sensors are symmetrical in space, Eq. (8) is also applicable to other FBG sensors in space, such as . In order to obtain the three-dimensional stress state of rock mass in the geodetic coordinate system, it is necessary to transform the stress component in the borehole coordinate system; the transformation matrix is as follows:
In Eq. (10), is the stress component in the borehole coordinate system. is the cosine of each axis angle between the borehole coordinate system and the geodetic coordinate system. Taking them into Eq. (8), the solution equation of each rock stress component in geodetic coordinate system is obtained.
The transformation matrix of coordinate is shown in Eq. (12).
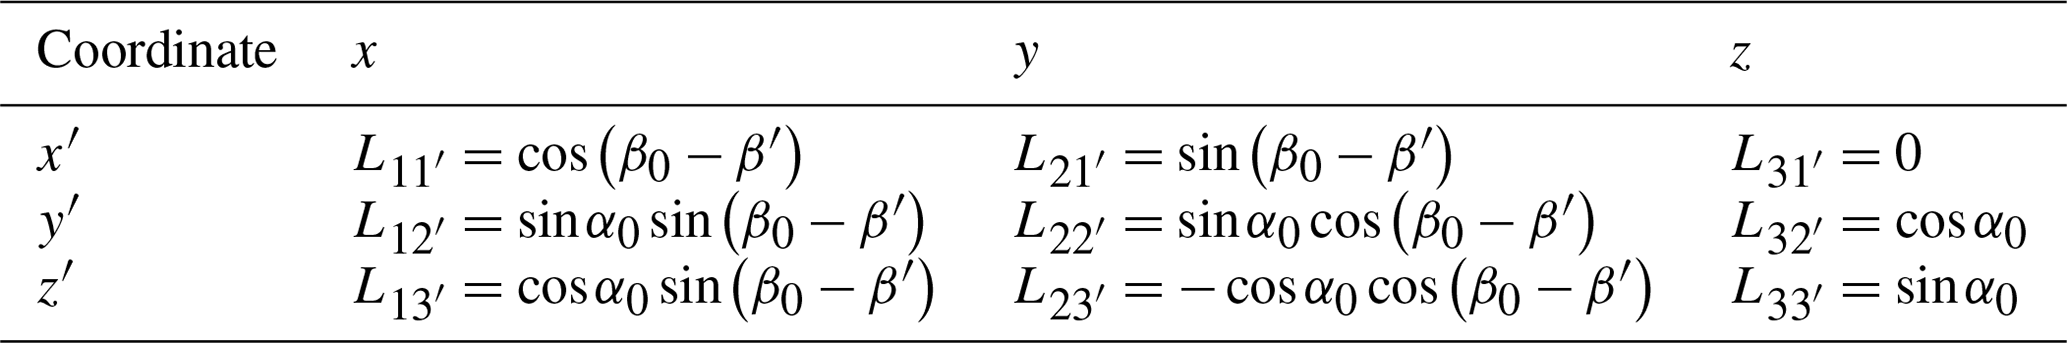
is shown in Table 2, and β0, β', and α0 are shown in Fig. 9.
Table 2Direction cosine of the local coordinate system O- relative to the global coordinate system O-xyz.
Inserting between the wavelength variation of FBG and the measured strain in Eq. (11), the stress inversion equations are obtained as follows:
where kλ is the vector composed of the wavelength shift ratio of FBG at each position, λε is the wavelength value under strain state, and λB is the initial wavelength value under no strain state. The elasto-optic coefficient Pa is obtained using the calibration experiment.
The calibration experiment is divided into two parts: the measurement of material mechanical parameters and the calibration experiment of uniaxial compression. Firstly, the elastic modulus and Poisson's ratio of the rock sample and epoxy resin sample are measured by a uniaxial static load test. Following this, the rock sample is pasted to resistance strain gauge, and the FBG strain sensor is subjected to uniaxial compression. The FBG strain sensor is calibrated by measuring the strain with resistance strain gauge, and the elasto-optic coefficient of FBG sensor is calculated.
4.1 Construction of experimental platform
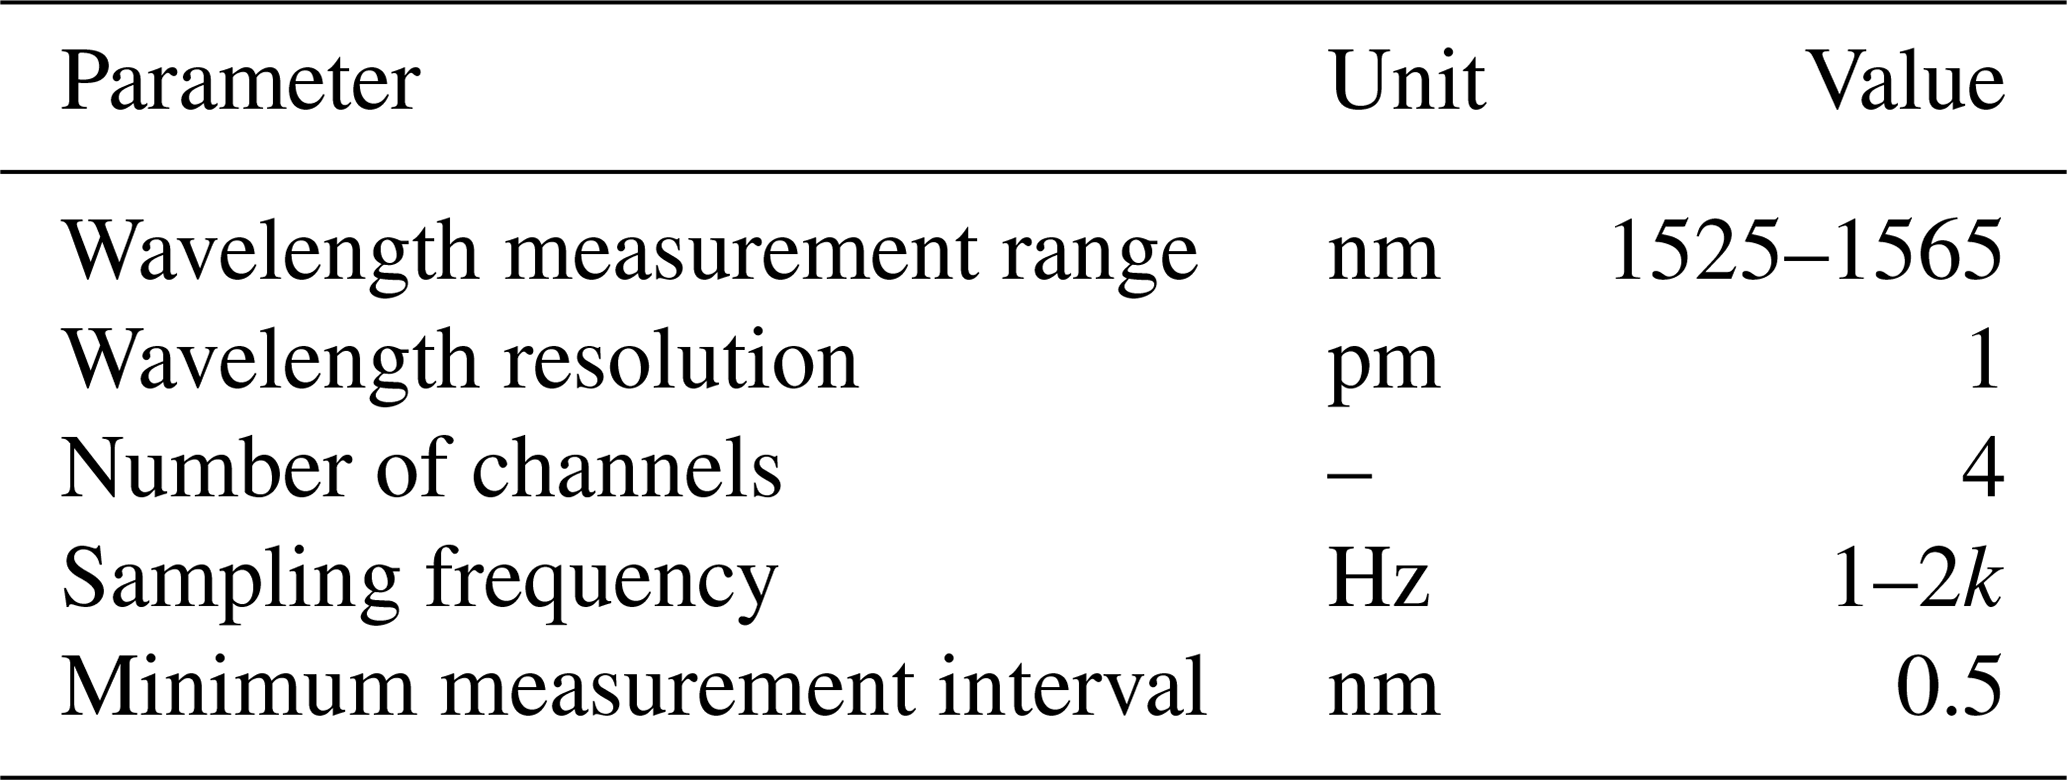
The experimental platform includes a true triaxial rock testing machine, resistance strain tester, FBG wavelength demodulator, granite cylinder sample, and epoxy resin cylinder sample. The FBG wavelength demodulator is used to measure the wavelength shift of FBG sensors, and its sampling frequency is set to 20 Hz. Photos of the experimental platform are shown in Fig. 8, and the main parameters of the FBG wavelength demodulator are shown in Table 3.
In the mechanical parameter experiment, three granite cylinders and one epoxy resin cylinder are selected as test samples. The center diameter of each sample is measured in three different directions, and the average value is taken as the effective value.
4.2 Determination of mechanical parameters of materials
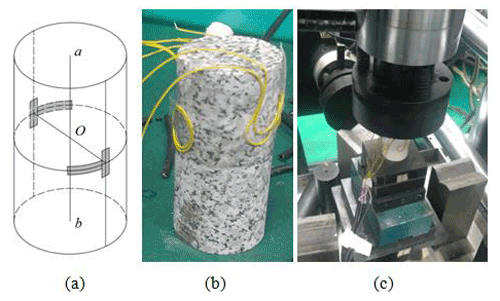
The elastic modulus and Poisson's ratio were calculated by uniaxial compression test. First, UV glue was used to paste the resistance strain gauge at a specific position on the surface of the granite sample. A 120Ω, 10 mm resistance strain gauge is selected as the strain measurement unit. Four strain gauges are pasted on the surface of each specimen, two of which are in a group. Two strain gauges in each group were arranged along the axial direction and perpendicular to the axial direction, respectively. The longitudinal strain and transverse strain of the samples were measured during uniaxial compression. The layout diagram and photos of the strain gauge are shown in Fig. 9.

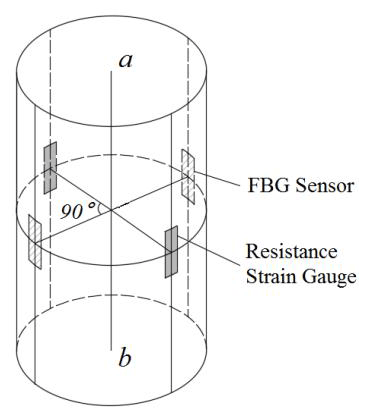
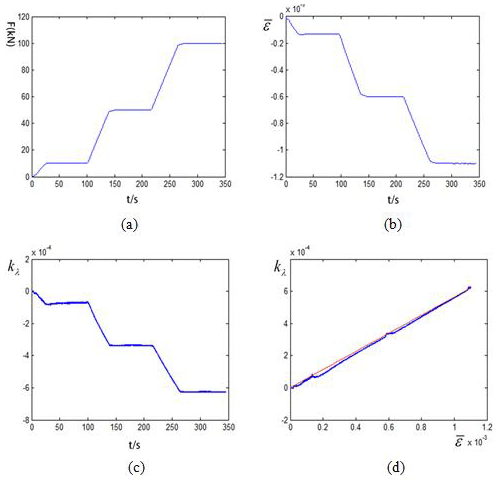
Figure 13Schematic diagram of the data processing performed during the stress-loading process.
The sample is placed in the center of the hydraulic z axis of the true triaxial testing machine, as shown in Fig. 9c. Following this, the axial load is applied to the sample, and the loading speed is set to be 1 kN/s. When the axial force reaches 200 kN, the loading stops (the loading speed of the epoxy resin sample is 0.5 kN/s, and the loading stops when the force reaches 100 kN), and the data file collected by the strain gauge is saved.
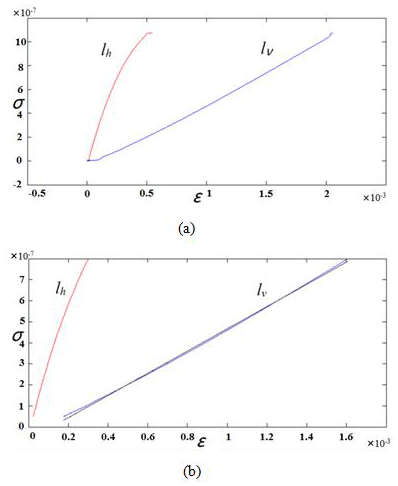
The stress–strain curve was drawn by MATLAB 2012a software, and the mechanical parameters of materials were calculated. Taking granite sample no. 1 as an example, Fig. 10a shows the stress–strain curve with the red line lh representing the relationship between stress σ and transverse strain εh and the blue curve lν representing the relationship between stress σ and longitudinal strain εν. The part of the two curves that is approximately a straight line (the red line segment and the blue line segment in Fig. 10b) is intercepted. The curve Lν is thus fitted linearly (the black line segment in Fig. 10b), and its slope is extracted as the elastic modulus (E) of the sample.
As shown in Fig. 11, the ratio of transverse strain εh to longitudinal strain εν is calculated, and its average value is taken as Poisson's ratio ν of the sample.
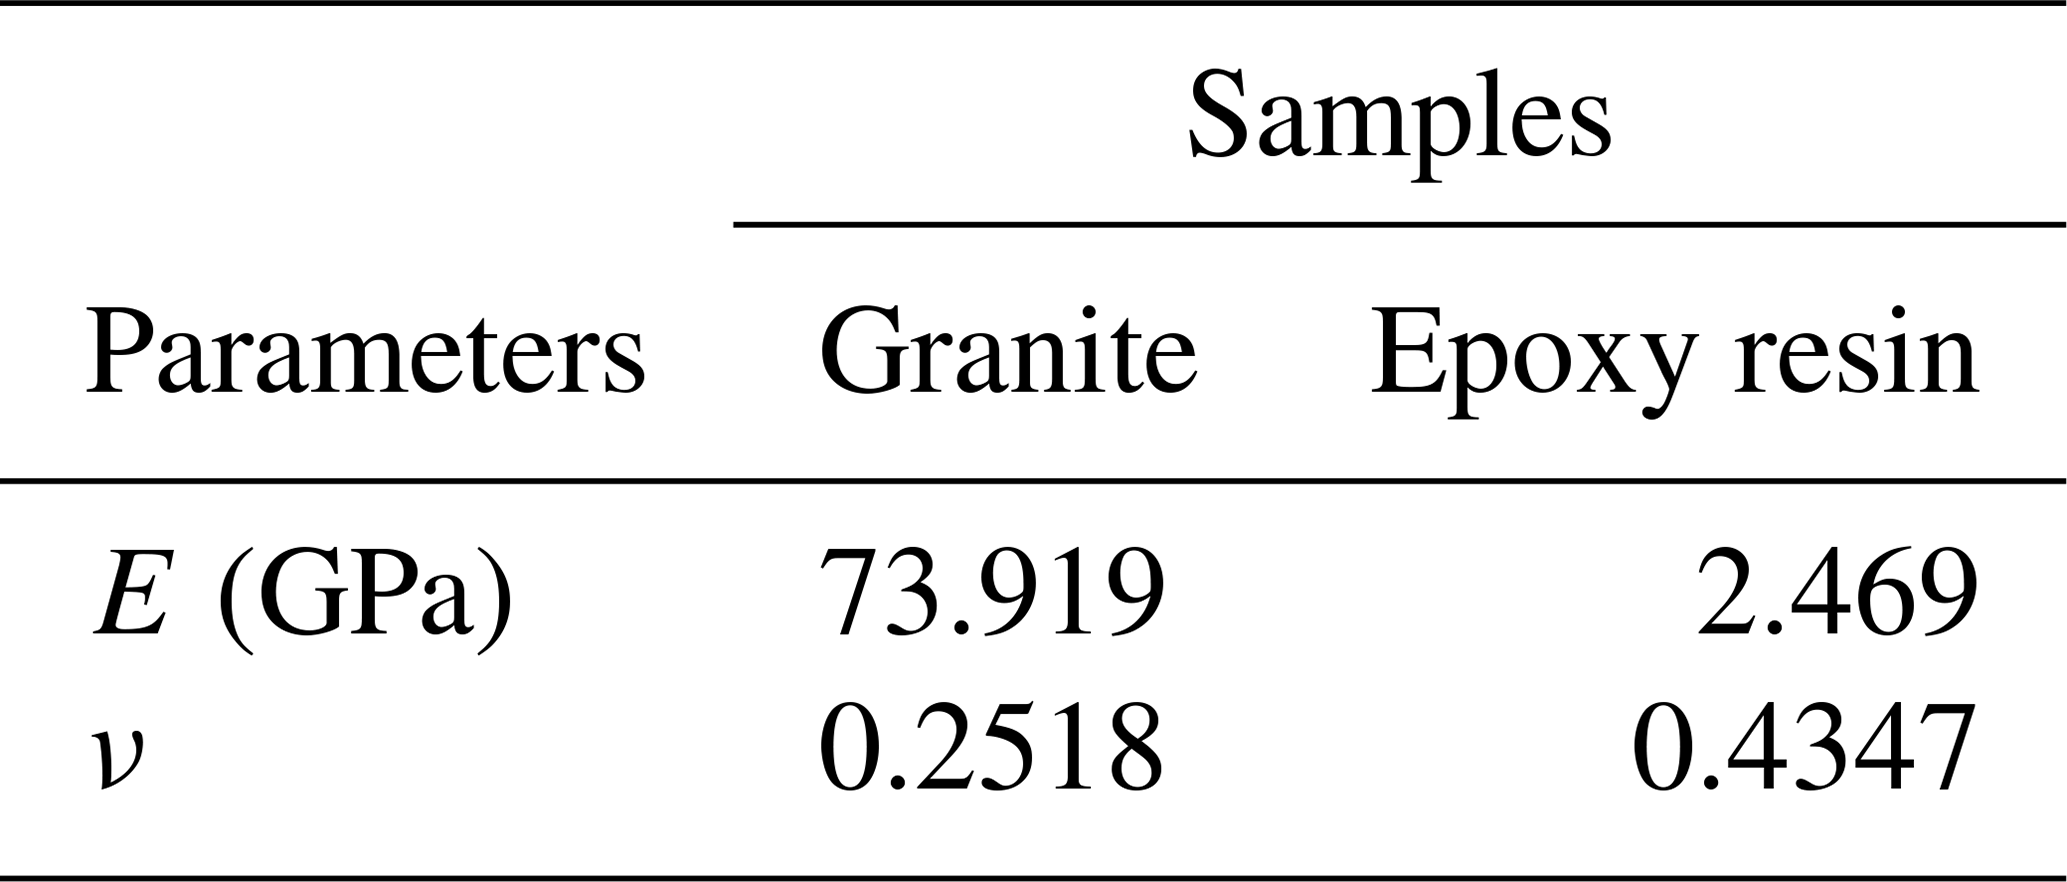
The arithmetic mean values of elastic modulus and Poisson's ratio of granite samples and epoxy resin samples are calculated through several uniaxial compression tests, as shown in Table 4.
4.3 FBG sensor calibration
The FBG sensor and resistance strain gauge are used to measure the longitudinal strain of the cylindrical specimen under uniaxial compression; the strain measured by the resistance strain gauge is regarded as the actual strain of the sample, which is proportional to the wavelength shift ratio kλ of the FBG. The linear correlation between them was analyzed, and the elastic optical coefficient Pα was calculated.
As shown in Fig. 12, two FBG sensors and two resistance strain gauges are pasted onto the surface of the granite samples. The pasting point is located on the circumference of the section perpendicular to the axis passing through the center point O of the cylinder, and the pasting direction is parallel to the axial direction. The two strain gauges are symmetrically distributed around the center of the axis, and the FBG pasting point is located at the interval of 90∘. The symmetrical FBG can eliminate the influence of eccentric load.
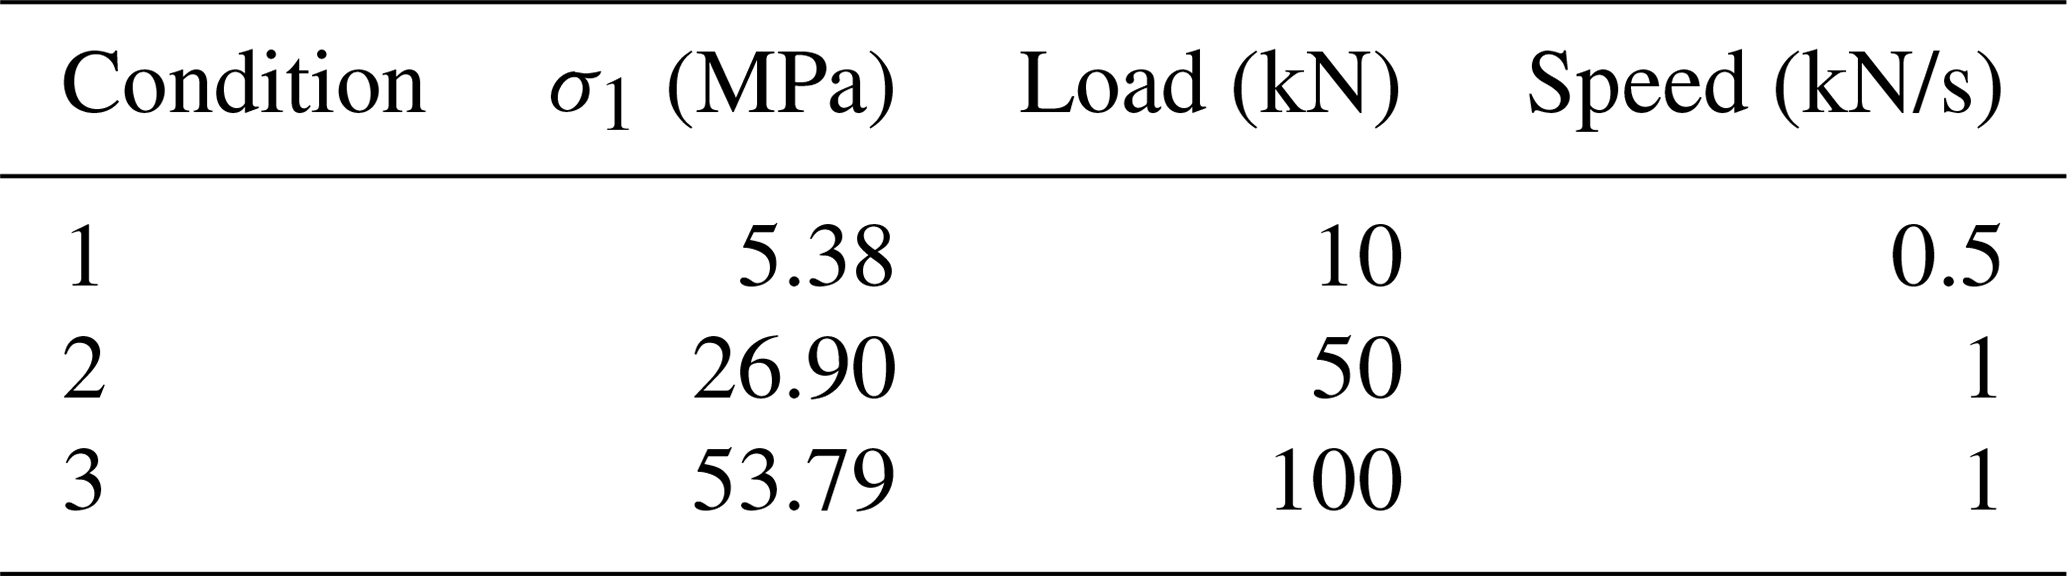
The calibration test adopts a multi-stage loading scheme, and the specific loading conditions are shown in Table 5.
The average value of the two strain gauges is regarded as the actual value of the axial strain, and the average value kλ of the wavelength shift ratio of the two FBG sensors is taken by the demodulator. After uniaxial loading, MATLAB is used to process the test data, as shown in Fig. 13.
Figure 13a shows the trend of axial load changing with time in the loading process, Fig. 13b shows the relationship curve of strain variable of resistance strain gauge changing with time, and Fig. 13c shows the relationship curve of FBG wavelength shift changing with time. These three parameters have obvious correlation. Figure 13d shows the relationship between the strain of the strain gauge and wavelength shift kλ (blue curve). It shows that and kλ have a good linear relationship. When the strain range is less than 1000 µε, the FBG strain sensor has good reliability.
The data group is fitted linearly, and then the slope of the red line in Fig. 14 is taken as the linear relationship coefficient between wavelength drift and actual strain. The elastic optical coefficient of FBG is then calculated, and Pa=0.4369.
The Abaqus finite element software is used to simulate the in situ stress measurement process. The linear strain in each FBG measurement direction is extracted according to the layout design. The stress is inverted by the stress inversion equation in Sect. 3 and compared with the applied load, which proves the theoretical validity and feasibility of the sensor assembly layout design and the stress inversion equation. It provides theoretical and data-based support for the trial production and application of the FBG hole wall strain gauge.
The finite element numerical simulation process is divided into three stages: pre-processing, solution, and post-processing. The pre-processing stage mainly includes model establishment, including meshing, defining material properties, assembling, determining the interaction relationship, and defining the boundary conditions. The Abaqus displacement method is used to solve the finite element problem in the solution stage. The relationship between force and displacement (unknown quantity) is established, and the stiffness matrix of the element is derived. The post-processing stage is mainly to display, export, and analyze the results based on the second step.
5.1 Establishment of calculation model
5.1.1 Model of each part
The CAE (Computer Aided Engineering) module of the Abaqus software is used to build the three-dimensional model of the external rock mass, epoxy resin, hollow inclusion shell, and piston guide, and the contact relationship between peripheral rock mass, epoxy resin, and strain gauge is considered. A 3D model of each part is shown in Fig. 14.
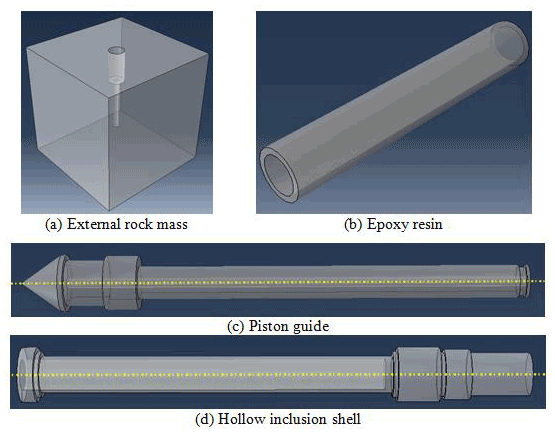
5.1.2 Definition of material properties
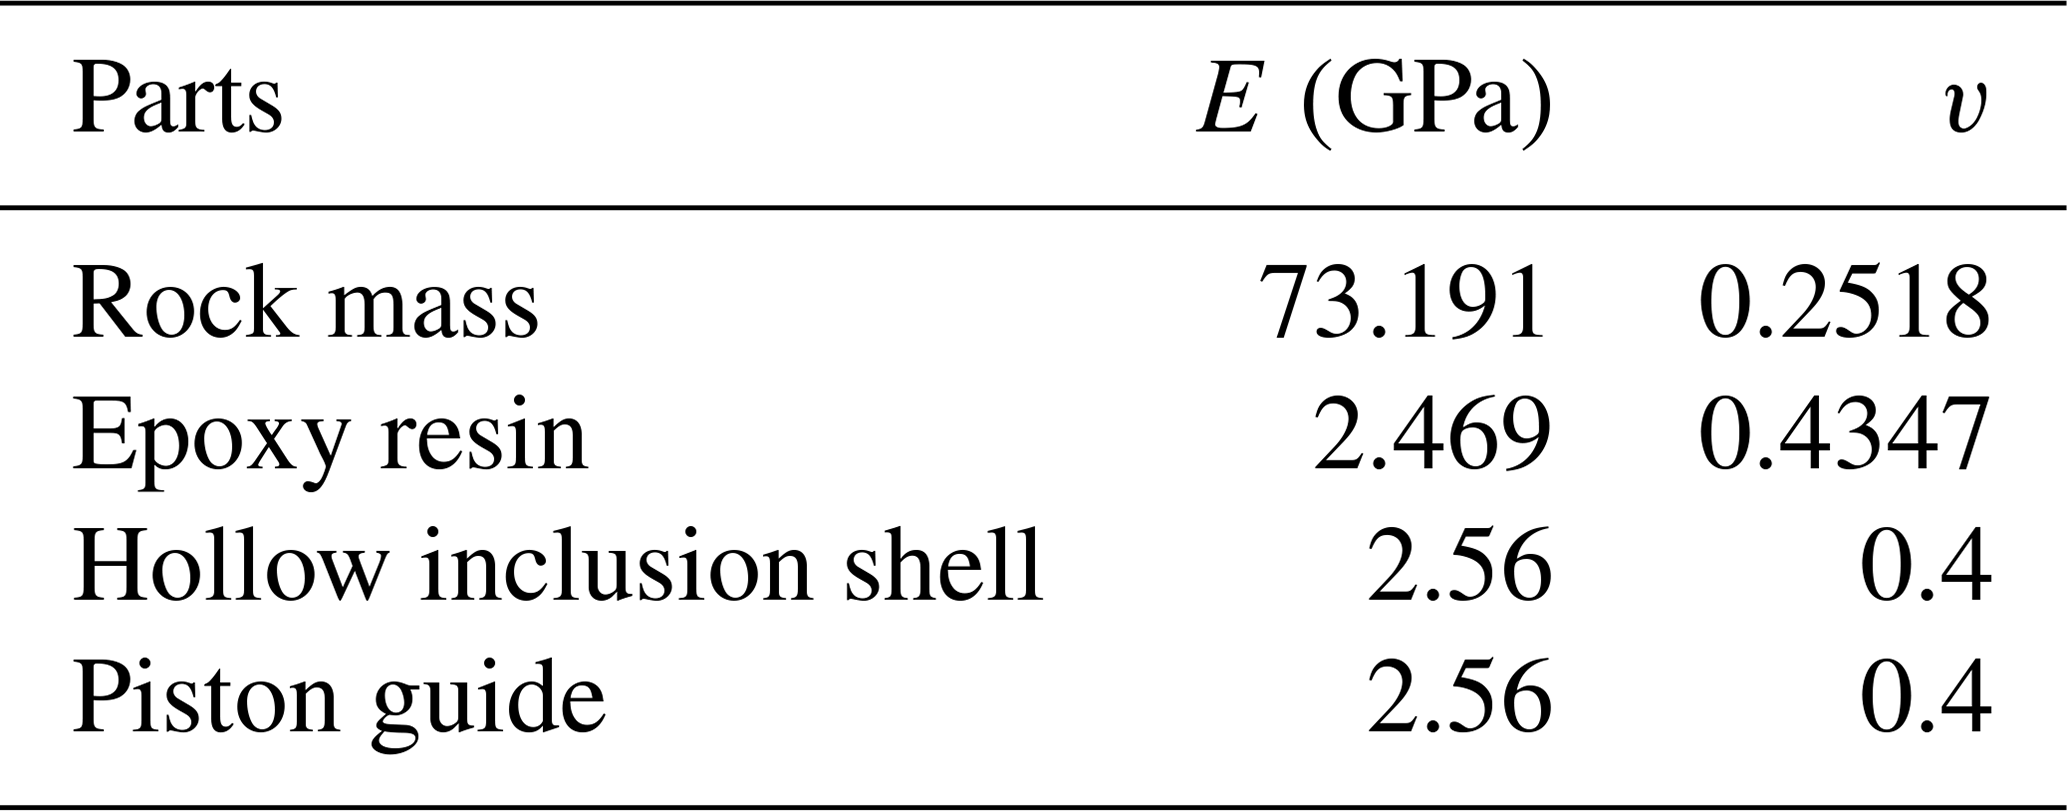
In the stress measurement of the overcoring method, rock mass and hollow inclusion are usually in the elastic deformation stage (Cai, 2000). Therefore, the four parts shown in Fig. 14 are defined as isotropic and homogeneous linear materials in the simulation. The mechanical parameters of granite and epoxy resin measured in the uniaxial compression test (Sect. 4.2) are adopted. The specific mechanical parameters of each component are shown in Table 6.
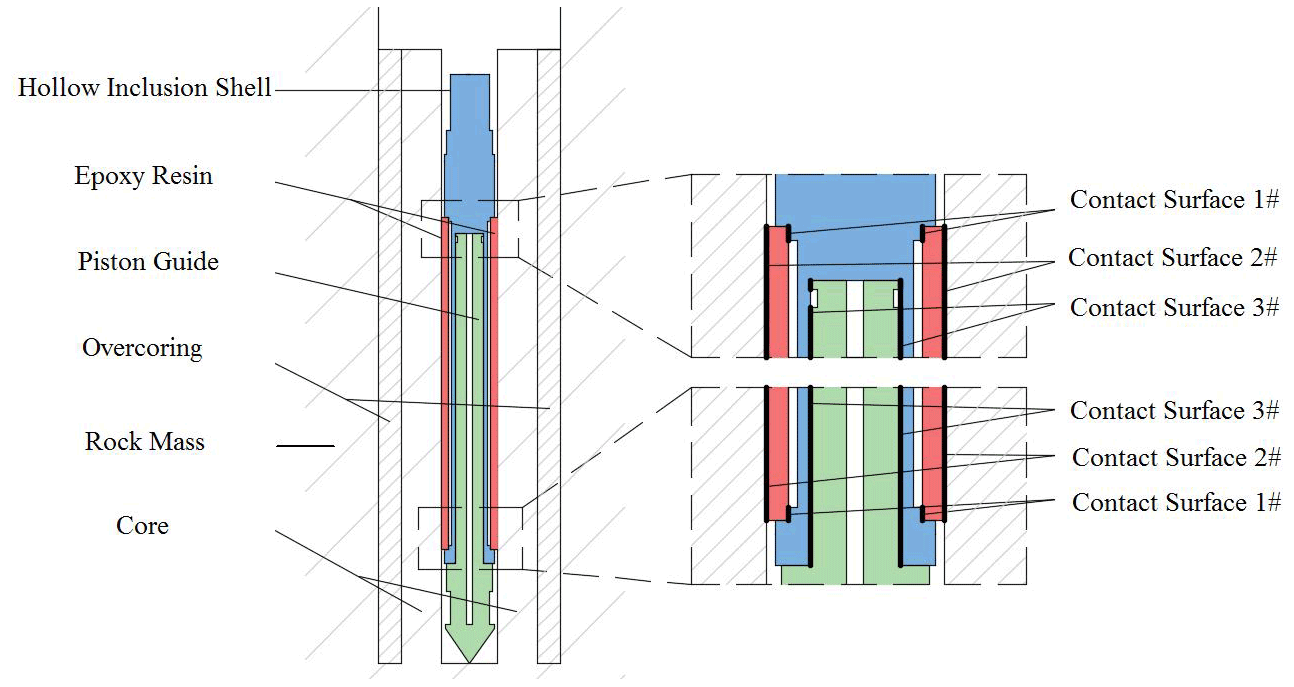
5.1.3 Defining contact surface and meshing
The four parts are assembled as shown in Fig. 15. There are three kinds of contact between the components: the contact between the epoxy resin and the hole wall (contact 2), the contact between the epoxy resin layer and the hollow inclusion shell (contact 1), and the contact between the inner wall of the hollow inclusion shell and the piston guide (contact 3). In the simulation, tie constraint is applied to the outer wall of the epoxy resin layer and the hole wall to bind the contact nodes on the two surfaces so that the contact nodes will not produce relative displacement and play the role of transferring the deformation of the hole wall.
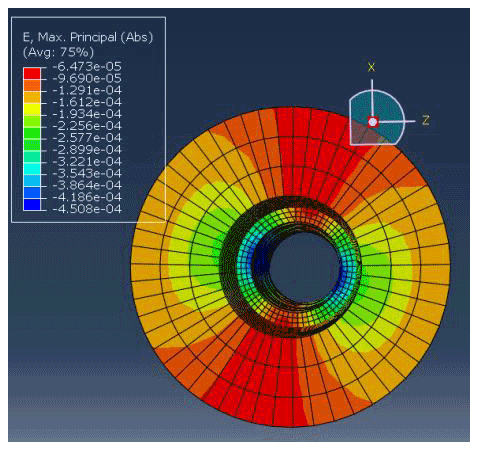
When meshing the epoxy resin layer, there should be intersection FBG position nodes at the points of FBG arrangement on the inner side of epoxy resin in order to guide the software to establish reference points at the nodes generated by FBG position. As shown in Fig. 16, the epoxy resin layer, as a direct part of strain measurement, increases the mesh density of the stressed part in order to improve the simulation accuracy.

5.2 Result analysis
Because the FBG sensor group is arranged between the hollow inclusion shell and the epoxy resin layer, the strain effect of the core and the epoxy resin layer before and after casing is analyzed and compared. Figure 17 shows the absolute maximum principal-strain nephogram of the core and epoxy resin before overcoring. The stress distribution of the two parts is similar, there is no obvious change in the vertical strain of the two components, and the boundary effect is not obvious. It can be seen from the strain distribution in Fig. 18 that the deformation coupling between the epoxy resin layer and the hole wall is satisfactory and that the epoxy resin layer can better transfer the deformation of the hole wall under the simulated in situ stress.

Figure 17The absolute maximum principal-strain nephogram of the core and epoxy resin before overcoring.
As shown in Fig. 19, the strain in most areas of the core and epoxy resin disappears after the overcoring. The stress in the strain measurement section is relieved successfully, and there is a large strain at the connection between the lower end of the core and the rock mass.
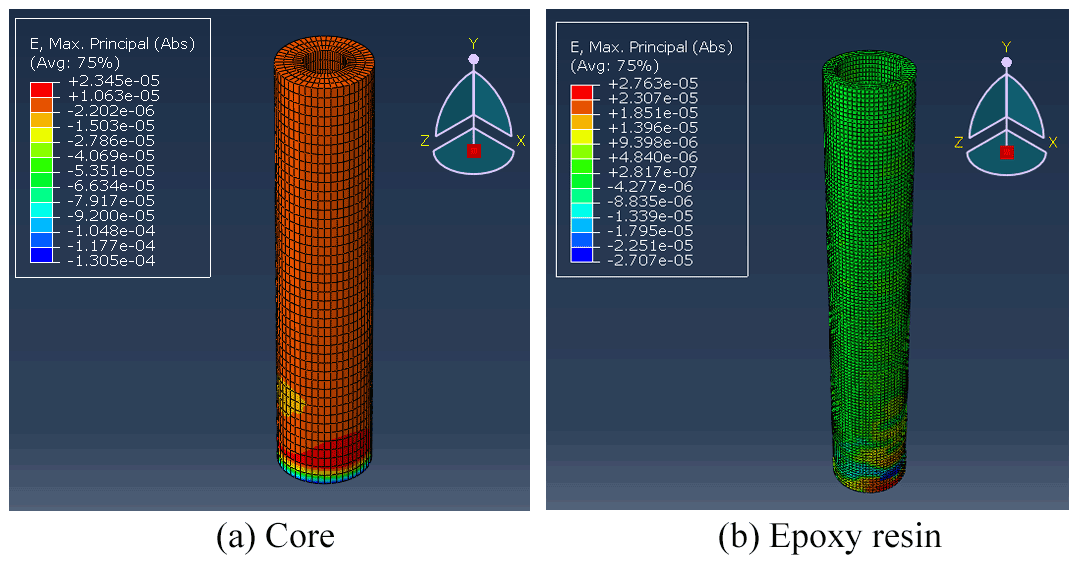
Figure 19The absolute maximum principal-strain nephogram of the core and epoxy resin after overcoring.
As shown in Fig. 20, there is a fixed interval and small strain fringe area at the bottom of the outer wall of the epoxy resin. There is no large strain in the hole wall area corresponding to the strain fringe of the epoxy resin layer, and the strain fringe is located on the plane of the core grid node. It is determined that the strain fringe is caused by the different grid densities of the core grid and the epoxy resin layer. The strain fringes may partially affect the results of stress inversion in the simulation.

Figure 20Strain nephogram in the y–z direction of the borehole and the bottom area of the epoxy resin layer.
5.3 Inversion of in situ stress
The linear strain of FBG in the measurement direction before and after the overcoring is extracted, the difference (i.e., the strain generated in the process of stress release) is brought into the in situ stress inversion algorithm of FBG sensor assembly to simulate the in situ stress conditions, and the theoretical validity of the FBG sensor assembly design scheme is verified by comparing it with the applied load.
5.3.1 Linear strain of the FBG sensor
According to the spatial symmetry of the sensor group, the 26 sensors are divided into seven equivalent orientations (see Sect. 2.2), the strain components before and after the overcoring are extracted, and the stress inversion is carried out by taking the difference between the strain variables before and after the overcoring as the strain data. The simulated strain values of each FBG sensor are shown in Table 7.
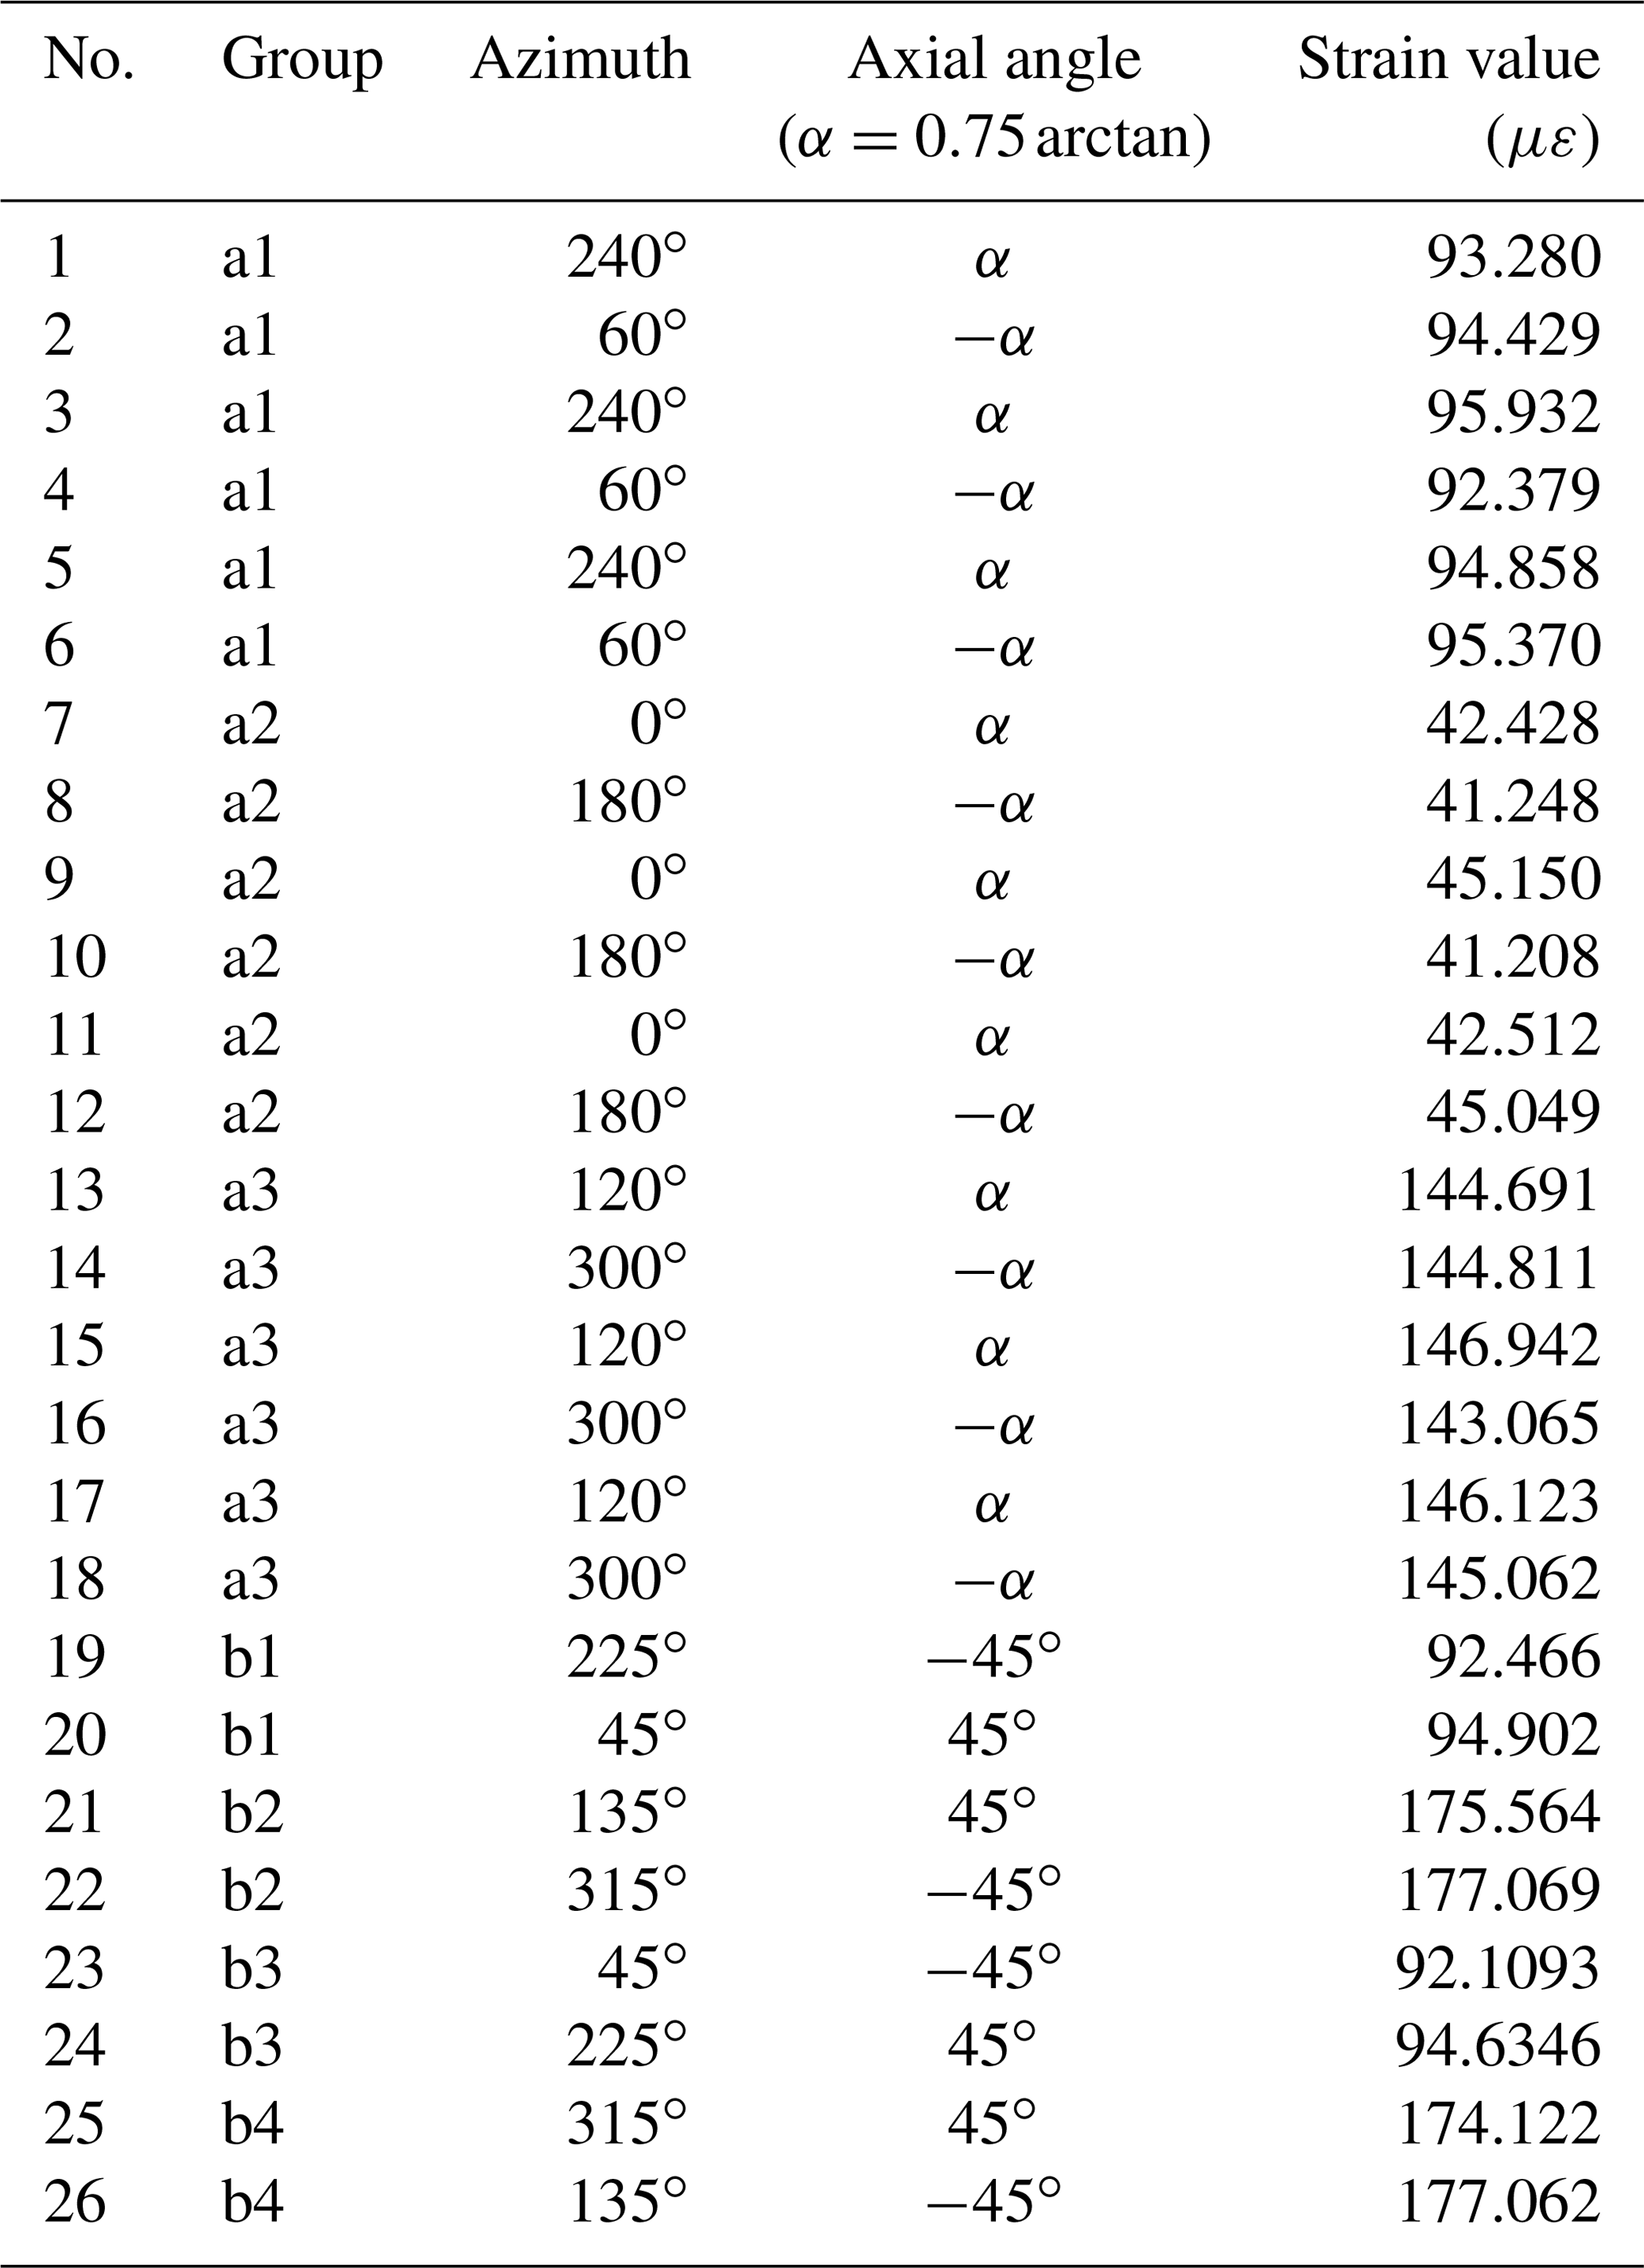
5.3.2 Calculation of in situ stress inversion
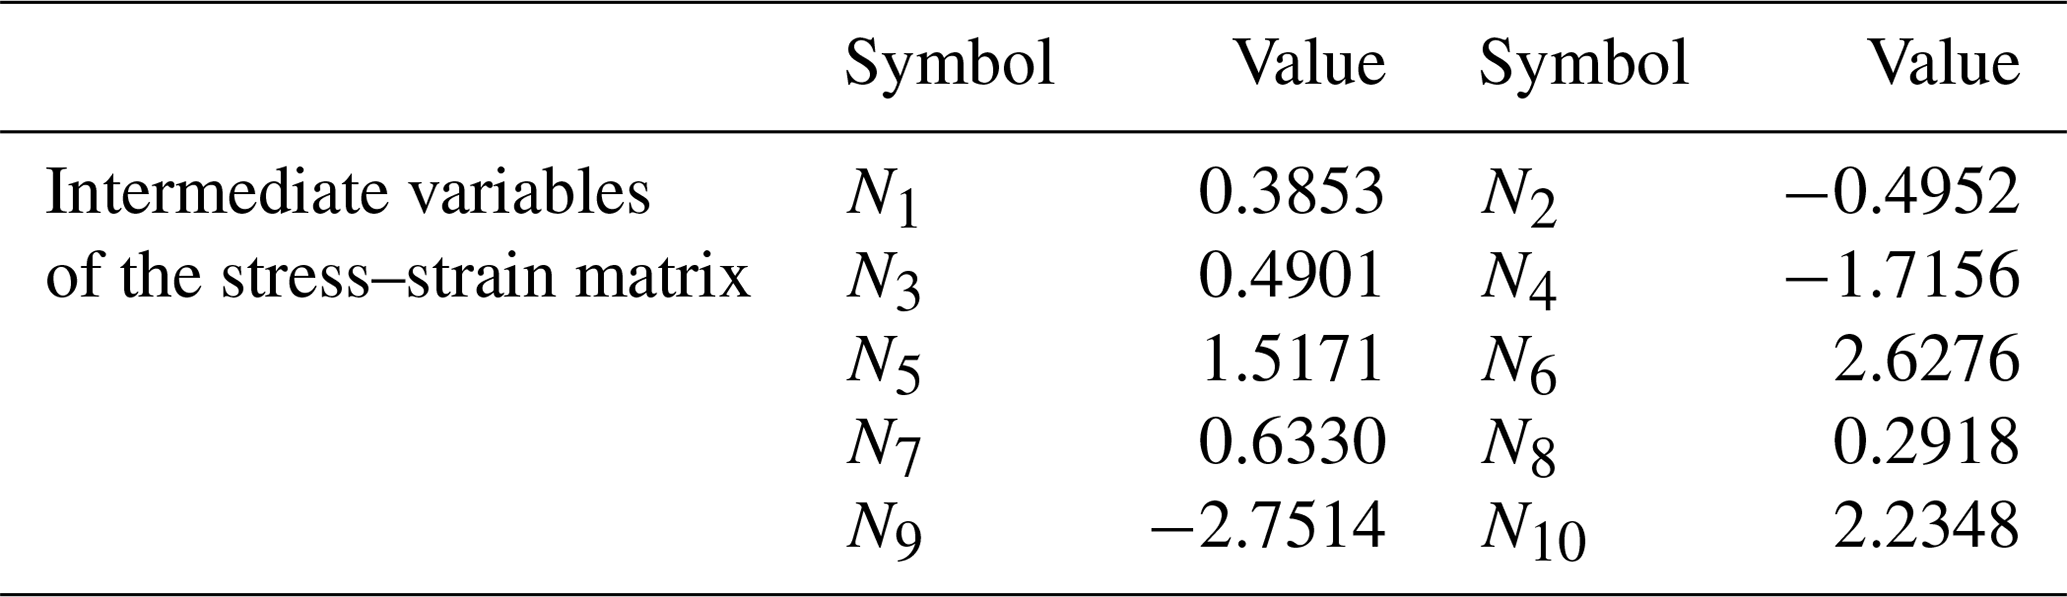
Since the simulated working condition is a vertical hole and does not involve coordinate system transformation, the values of parameters in Table 8 and the measured values of strain in Table 8 are substituted into the stress inversion equation (Eq. 8 in Sect. 3.2), and MATLAB 2012a is used for stress inversion analysis. Table 9 shows some intermediate variables in stress inversion calculation, and the results of in situ stress inversion calculation are shown in Table 10.
Table 8Stress inversion parameter table and correction factors of epoxy resin.
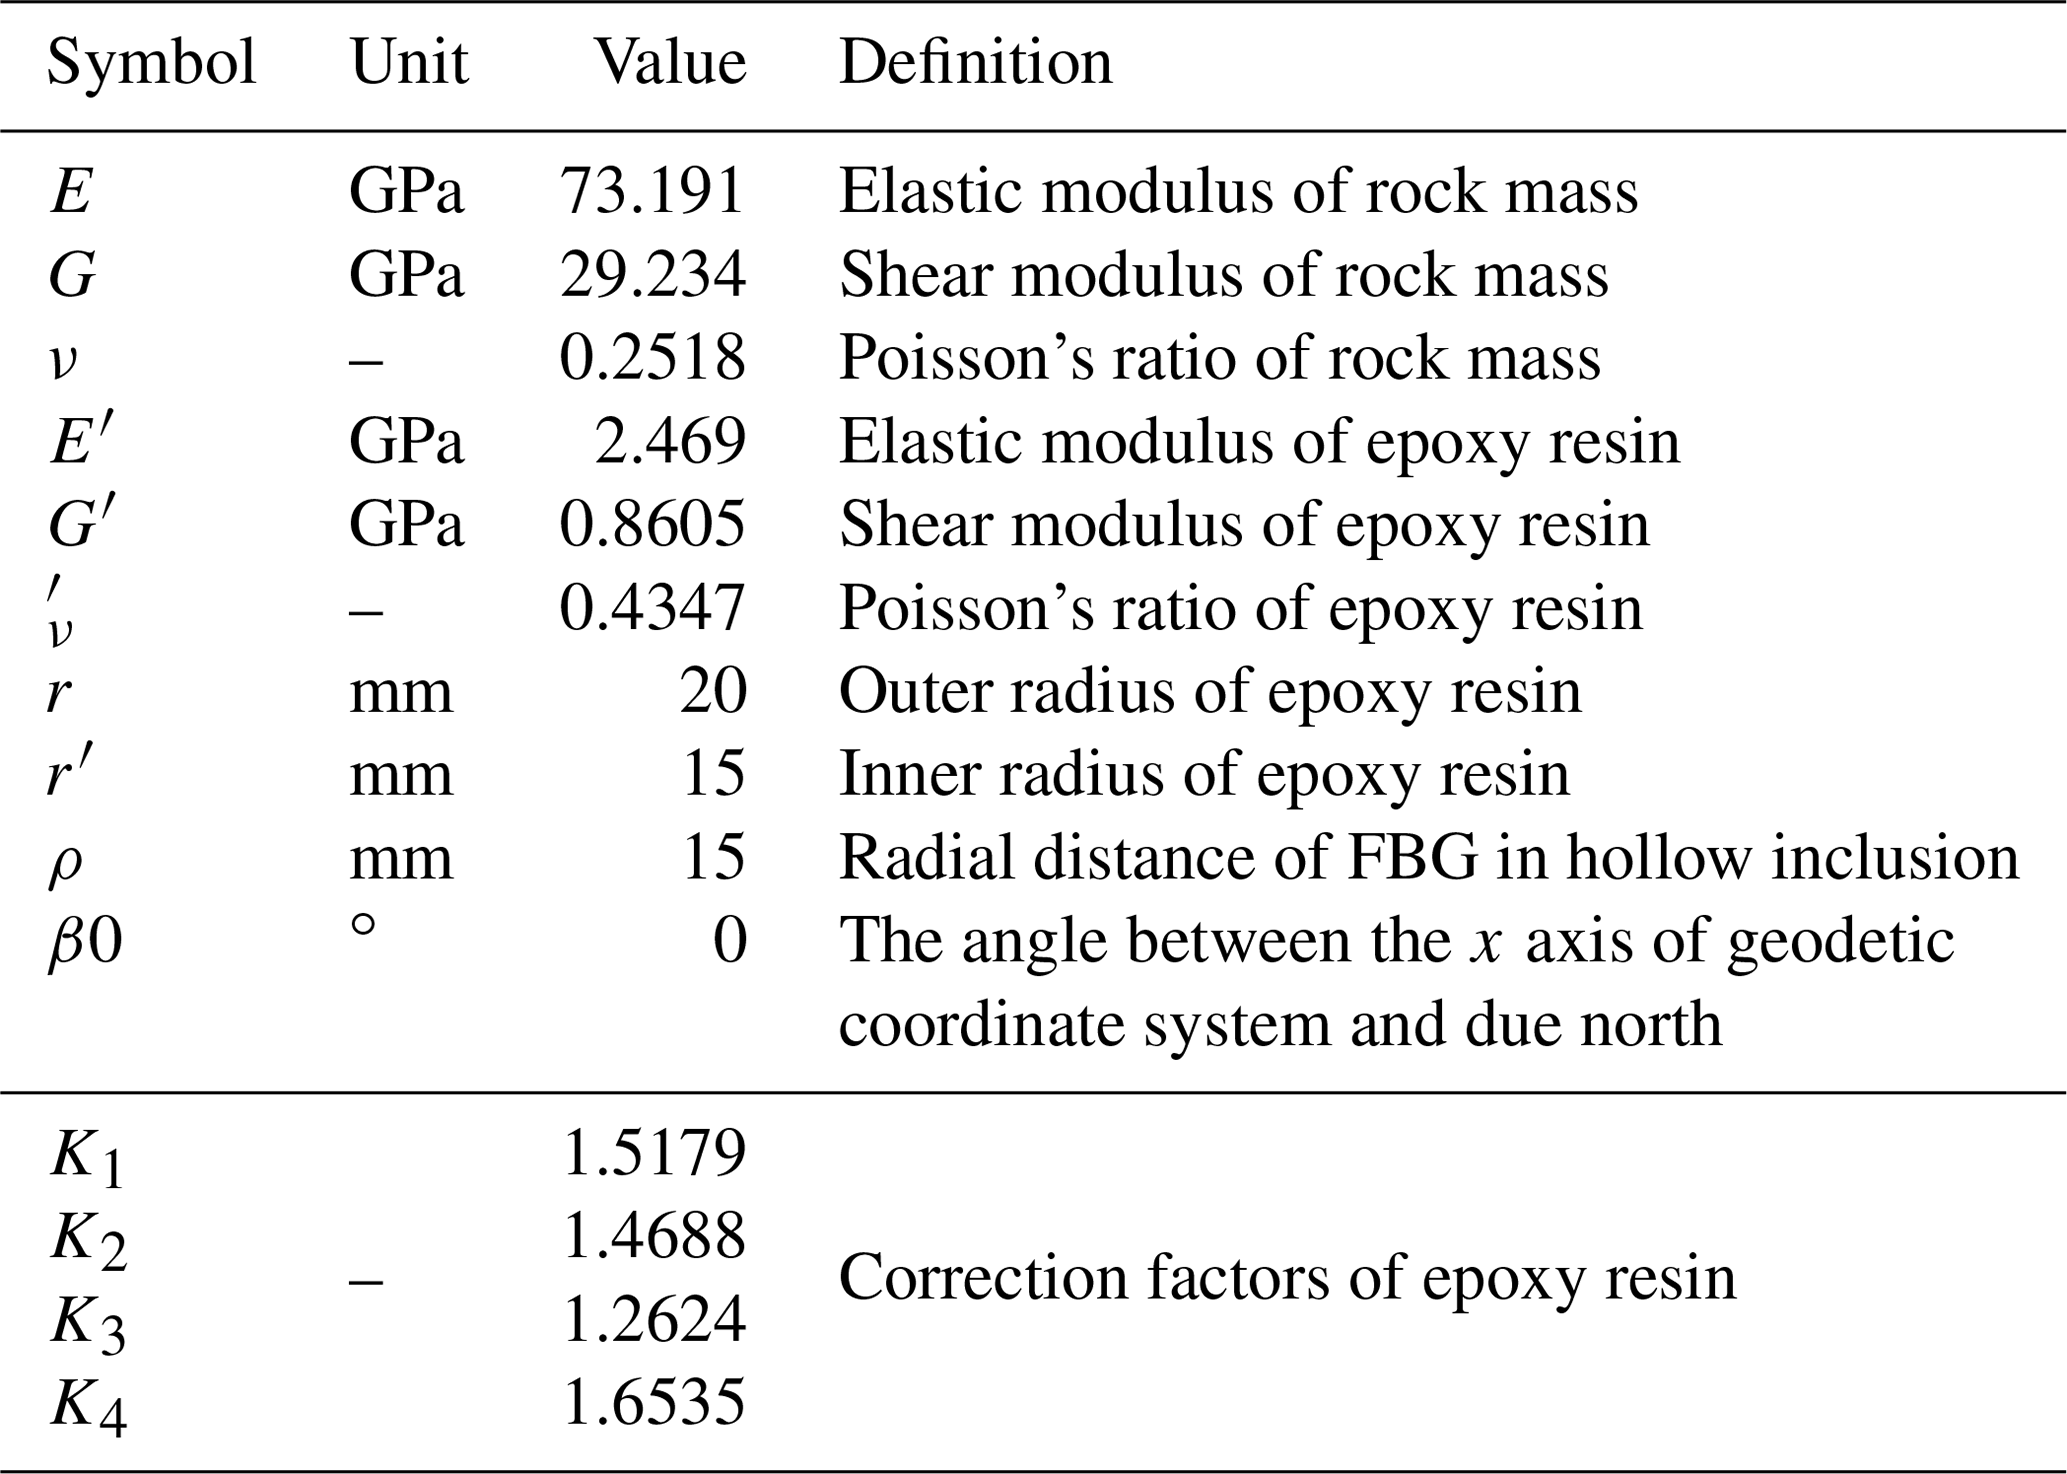
Table 9Intermediate variables in stress inversion calculation.
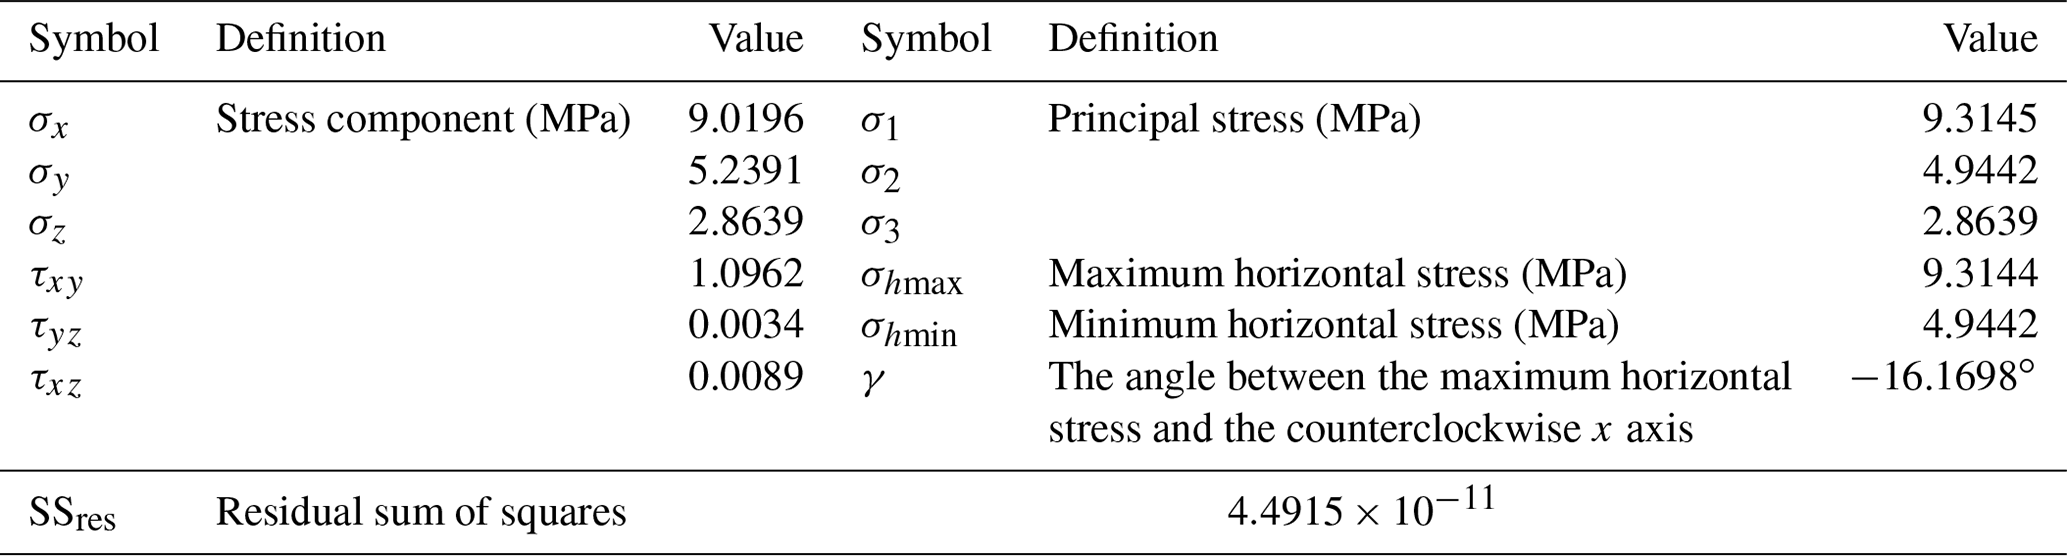
It can be seen from Table 9 that the FBG sensor assembly is used to simulate strain measurement and inversion of in situ stress. Compared with the applied stress as the actual value of in situ stress, the measurement errors of the three principal stresses σ1, σ2, σ3 and maximum horizontal stress angle γare less than 10 %, i.e., are 6.86 %, 1.12 %, 4.54 %, and 7.80 % respectively.

In the actual measurement of in situ stress based on the hollow inclusion method, there are often a few sensors with large errors, and thus it is judged as the abnormal value of strain. The traditional hole wall strain gauge based on resistance strain generally only has 12 strain sensors with six different equivalent measuring directions, and thus the abnormal values can not be easily removed in the process of solving the in situ stress. The least-squares method is very sensitive to outliers, and the existence of outliers will have a great impact on the solution results, resulting in large errors in inversion stress.
The FBG strain sensor module designed in this paper distributes 26 sensors in seven equivalent positions, in which each equivalent position corresponds to six sensors, and each equivalent position of group B corresponds to two strain values. A total of 26 strain values can be obtained in theory, and thus the fault tolerance rate of data and the reliability of stress inversion results are greatly improved. However, if we want to make full use of a large amount of strain data, give full play to the advantages of having a large amount of quasi-distributed measurement data, and get more real and reliable stress inversion results, we still need to study reasonable data-processing methods.
In this section, the boxplot method is used to eliminate the measurement data with abnormal residual absolute values in the least-squares solution. By running the elimination operation twice, the overall reliability of the data can be effectively improved, and the stress data, such as the stress tensor, the size and direction of the principal stress and the maximum horizontal stress, can be calculated. In order to meet the necessary conditions for solving the stress inversion equation (Eq. 8), it is necessary to judge whether the following two elimination cond1itions are satisfied: first, the abnormal strain values are eliminated in order of absolute residual value (from large to small). Second, at least one strain measurement value is kept in the different equivalent measurement directions.
Taking the strain measurement data of numerical simulation in Sect. 5 as an example, SSres is the sum of squares of strain residuals, which is used to measure the fitting degree of the stress data in the stress–strain equation obtained by the least-squares method in the calculation. The larger the value of SSres, the lower the fitting degree of the least-squares solution. SSres is calculated as follows:
where n is the number of strain variables and ri is the residual error of the ith strain. Figure 21a shows the distribution of the absolute value of the residual error of the original strain data. The ordinate represents the label of the FBG corresponding to the residual error, the abscissa is the label of the corresponding FBG, and the absolute value of the residual error is small (less than ) and is evenly distributed. There is no abnormal value in the boxplot diagram (Fig. 21b), and the sum of squared residuals SSres is very small, on the order of 10−11, which proves that the stress inversion results are ideal and reliable.
Combining the traditional in situ stress measurement method with FBG sensing technology, this paper designs an FBG strain sensor group with the function of three-dimensional in situ stress measurement and then provides a direct and accurate observation method for the measurement of hole wall strain by developing an FBG strain sensor group, which can make up for the shortcomings of the existing hole wall strain gauge based on a resistance strain gauge, which will be of great theoretical and practical value for the development of in situ stress measurement technology.
The highlights of this paper are as follows.
-
Based on the layout of FBG strain sensor group, a new in situ stress inversion algorithm is derived. The 26 FBG strain sensors connected in series with six optical fibers are divided into seven groups of equivalent measurement position, and the strain sensor group is installed by using the double-area quasi-distributed winding method. The correction coefficients of epoxy resin are added to optimize the inversion equation of hole wall strain and in situ stress to reduce the influence of the coupling effect of the hole wall on the stress inversion results.
-
The process of in situ stress measurement has been simulated to verify measurement feasibility and data reliability of the FBG strain sensor group. Compared with using applied stress as the actual value of in situ stress, the measurement errors of three principal stresses σ1, σ2, σ3 and maximum horizontal stress angle γare less than 10 %, i.e., 6.86 %, 1.12 %, 4.54 %, and 7.80 %, respectively. Through data processing methods and error analyses, we have proven that the FBG strain sensor array is feasible and reliable for in situ stress measurement based on the overcoring method.
The data used to support the findings of this study are available from the corresponding author upon request.
All authors contributed to this article, with the order of the authors' names reflecting the size of their contribution. YL, ZH, and HZ discussed and wrote the original draft preparation. YL and LY designed the structure. ZH, HZ, and YL built the calculation model. PUW and LY calculated and analyzed the data. PEW, GG, and HZ drew the figures.
The contact author has declared that neither they nor their co-authors have any competing interests.
Publisher's note: Copernicus Publications remains neutral with regard to jurisdictional claims in published maps and institutional affiliations.
This research has been supported by the National Natural Science Foundation of China (grant no. 41804089) and the China Postdoctoral Science Foundation (grant no. 2019M650782).
This paper was edited by Alessandro Fedeli and reviewed by two anonymous referees.
Amadei, B. and Stephansson, O.: Rock stress and its measurement, London, Chapman and Hall, https://doi.org/10.1201/9780203746813-2, 1997.
Cai, M., Qiao, L., Yu, B., and Wang, S.: Stress Measurement with an Improved Hollow Inclusion Technique In Jinchuan Nickel Mine, Int. J. Mineral. Metal., 7, 157–160, https://doi.org/10.1016/S0022-5096(99)00079-4, 2000 (in Chinese with English abstract).
Dewolf, S., Wyatt, F. K., Zumberge, M. A., and Hatfield, W.: Improved vertical optical fiber borehole strainmeter design for measuring Earth strain, Rev. Entif. Instrum., 86, 1942–605, https://doi.org/10.1063/1.4935923, 2015.
Fama, M. and Pender, M. J.: Analysis of the hollow inclusion technique for measuring In Situ rock stress, Int. J. Rock Mech. Min. Sci. Geom. Abstr., 17, 137–146, https://doi.org/10.1016/0148-9062(80)91360-1, 1980.
Fuhr, P. L., Spammer, S. J., Jung, C. C., and Udd, E.: Fiber optic sensors in the Waterbury bridge, Proc. SPIE, 3489, 124–129, https://doi.org/10.1117/12.323424, 1998.
Hast, N.: The measurement of rock pressure in mines, Årsbok, Sveriges Geologiska Undersökning, Series C, 52, 1–183, 1958.
Hill, R. E., Peterson, R. E., Warpinski, N R, Teufel, L. W., and Aslakson, J. K.: Techniques for determining subsurface stress direction andassessing hydraulic fracture Azimuth, SPE 29192-CEastern Regional Conference and Exhibition held in Charleston, WV, USA, 8–10, https://doi.org/10.2523/29192-MS, 1994.
Hill, K. O. and Meltz, G.: Fiber Bragg grating technology fundamentals and overview, J. Lightwave Technol., 15, 1263–1276, https://doi.org/10.1109/50.618320, 1997.
Iabichino, G., Isaia, M., and Barbero, M.: Development of a software for the interpretation of data obtained by CSIRO cell, Geoingegneria ambientale e mineraria, 142, 55–59, 2014.
Leeman, E. R.: The measurement of stress in rock: Part II: Borehole rock stress measuring instruments, J. S. Afr. I. Min. Metall., 65, 254–284, 1964.
Leeman, E. R.: The CSIR Doorstopper and triaxial rock stress measuring instrument, Rock Mech., 3, 25–50, https://doi.org/10.1007/BF01243550, 1971.
Liu, Y., Yin, J., and Liu, Y.: Measuring techniques for hollow inclusion triaxial strain cells, Chinese J. Geotech. Eng., 33, 291–296, 2011 (in Chinese with English abstract).
Maccioni, E., Giacomelli, U., Carbone, D., and Gambino, S.: Shallow bore-hole three-axial fiber Bragg grating strain sensor for Etna volcano monitoring, Rev. Sci. Instrum., 90, 094501, https://doi.org/10.1063/1.5086516, 2019.
Ou, J.: Reseach and practice of smart sensor networks and health monitoring systems for civil infrastructures in mainland China, Bulletin of National Natural Science Foundation of China, 19, 8–12, https://doi.org/10.1117/12.634044, 2005 (in Chinese with English abstract).
Sjöberg, J. and Klasson, H.: Stress measurements in deep boreholesusing the Borre(SSPB) probe, Int. J. Rock Mech. Min., 40, 1205–1223, https://doi.org/10.1016/S1365-1609(03)00115-1, 2003.
Ulusay, R.: The ISRM Suggested Methods for Rock Characterization, Testing and Monitoring: 2007–2014, Springer International Publishing, 15, 47–48, https://doi.org/10.1007/978-3-319-07713-0. 2014.
Worotnicki, G. and Walton, R.: Virgin rock stress measurements at the Warrego Mine, CSIRO Tech. Rept. No. 93, Melboune, CSIRO Division of Geomechanics, 1979.
Zhong, Z., Chen, Y., and Luo, C.: Technique of geostress measurement in deep borehole by hellow inclusion triaxial strain gauge, Chinese Rock Mechanics and Engineering Institute Seventh Academic Conference Proceedings, 713–715, 2002.
Zhong, Z., Zhao, B., Lin, J., and Liu, Y.: Three dimensional in-situ stress sensor based on optical fiber sensing technology, Optical and Precision Engineering, 26, 325–335, https://doi.org/10.3788/OPE.20182602.0325, 2018 (in Chinese with English abstract).
- Abstract
- Introduction
- The structural design
- In situ stress inversion algorithm
- Calibration experiment
- Finite element simulation of in situ stress measurement
- Data processing method
- Conclusions
- Data availability
- Author contributions
- Competing interests
- Disclaimer
- Financial support
- Review statement
- References