the Creative Commons Attribution 4.0 License.
the Creative Commons Attribution 4.0 License.
 | 10 Jan 2023
Design and construction of an automated and programmable resistivity meter for shallow subsurface investigation
Antenor Oliveira Cruz Júnior
Cosme Ferreira da Ponte-Neto
André Wiermann
Geoelectrical resistivity is an excellent method to investigate the structural composition of shallow subsurfaces. However, existing commercial equipment is typically expensive and often requires proprietary accessories and software to provide full system functionality. The objective of this study was to develop a multichannel, modular, automated, and programmable geo-resistivity meter capable of user customization and programming. To this end, a conceptual prototype was built based on free software and open hardware technologies as a low-cost alternative to commercial equipment while maintaining the accuracy and quality of the data at the same level. The prototype was based on electrode multiplexing to make the switching process more efficient by reducing cabling complexity, whereas synchronous demodulation for signal detection was employed, providing strong rejection of spurious electrical noise, typical of urban areas where such equipment is frequently used. The results demonstrate the feasibility of this project and an important academic contribution to open-source instrumental research.
- Article
(3206 KB) - Full-text XML
- BibTeX
- EndNote


The use of geophysical methods for geotechnical investigation has become increasingly necessary to map large areas in the subsurface, resulting in significant gains in time and cost compared with traditional direct investigations, such as drilling and excavations (Santos et al., 2021; Augusto Filho and Virgili, 2016; Silva, 2016). This indirect investigation involves performing measurements on or near the surface, which are influenced by the internal distribution of the physical properties of the minerals and rocks that constitute the surface (Kearey et al., 2009). Several authors (Parkhomenko, 2012; Keller, 1966; Zonge, 1972) have studied this theory through experiments relating the mineralogical composition, texture, and arrangement of rocks imputed to their electrical properties, specifically their resistivity, magnetic permeability, and dielectric constant. From there, a geological section is defined as a medium whose existing materials exhibit different properties under the stimulus of electric charges (Braga, 2016). In this sense, geoelectric investigations have become capable of producing measurements resulting in images of lithological sections, in addition to their geometric parameters, such as thickness, depth, and direction in different soil conditions and with different electrode arrangements, which are influenced only by the stratigraphic distribution of the soil or by structures immersed in the subsurface (Kearey et al., 2009; Telford et al., 1990). Research over the last few decades has led to the development of resistivity meters known commercially as georesistivimeters. This equipment is fundamental for geoelectric exploration campaigns; however, companies that manufacture such instruments are very concerned with the quality of their measurements as well as their robustness for fieldwork (Clement et al., 2020; Pasquali et al., 2017; Toll, 1999), making this instrument sophisticated and expensive.
In this regard, it is worth mentioning the work of Hassan (2014) and Clement et al. (2020), who developed automated georesistivimeters for low-cost investigations to disseminate the method from a robust and flexible tool for small-scale experiments, using basic benchtop electronic equipment for testing and feasibility in the conceptual development of the instrument. In this work, the preliminary results obtained with the application of electroresistivity are reported, with the construction of a prototype of a modular professional resistivimeter, automated and programmable, aiming to prove its viability in the form of a proof of concept. Several aspects of design and construction have been applied to minimize the cost of construction and optimize the operation of the instrument in geophysical surveys, based on some deficit aspects of commercial equipment (Silva, 2016). A fully programmable and automated resistivimeter can be used for continuous measurements, allowing time-lapse resistivity data to be obtained. Time-lapse resistivity tomography has recently evolved as an important tool for mining and oil waste assessments (Dimech et al., 2022; Nazifi et al., 2022).
The electroresistivity method is based on the fact that different materials, whether geological or non-geological, present different electrical resistivity values (ρ) intrinsic to their constitution and proportion. This electrical conduction phenomenon depends on the mineralogical composition of the rocks as well as other factors that influence the final resistivity value, such as permeability, porosity, pressure, temperature, and the nature of the fluid in the pore. In this context, knowledge of the physical laws related to the electrical properties of geological materials is indispensable, considering that their propagation occurs in a three-dimensional medium (Orellana, 1972). The literature indicates that the conduction of electric current in the subsurface can occur in three distinct ways: electronically in substances with free electrons, by dielectrics in poor conductors or insulators, and by ions (ionic or electrolytic conduction), which is undoubtedly the conduction process of the greatest importance and interest in prospecting by electroresistivity (Menezes, 2013; Luiz and Silva, 1995; Feitosa et al., 2008). The working principle of the DC (direct current) resistivity method and operation is mostly performed using a quadrupole device (Fig. 1), where electric current is injected into the soil through insulated cables connected to an electric generator equipped with an ammeter to electrodes A and B, and likewise, cables are attached to a voltmeter or potentiometer capable of simultaneously measuring the potential difference between electrodes M and N (Dong et al., 2021; Menezes, 2013).
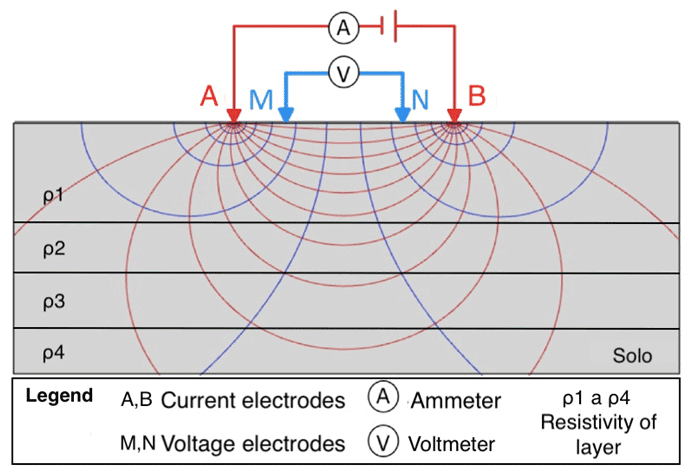
Figure 1Quadrupole electrode configuration through direct ground contact made by metallic or porous electrodes.
If we carry out measurements in the field and obtain the data, we will observe that in practice the flow of current in a subsurface geological structure does not behave as in a homogeneous medium, which will result in a dummy resistivity ρa which commonly will not be equal to ρ1 or ρ2 but will depend on ρ1, ρ2, ρ3, and ρ4 and the distances separating the electrodes. This resistivity cannot be equal to the average or weighted average of the four resistivities present and may even be greater or less than all of them.
This fictitious resistivity ρ, known as apparent resistivity (Eq. 1), represents the equivalent electrical resistivity in a homogeneous medium which, replacing the original heterogeneous medium, would produce the same electrical reactions under the same geometric conditions of the electrodes (Sato, 2002; Keller and Frischknecht, 1966).
where k is the geometric factor that depends on the quadrupole arrangement described in Eq. (2), as follows:
The basic concept of this electronic project is to develop equipment capable of performing all the necessary functions for the analysis and interpretation of physical parameters using the electroresistivity method. The instrument structure block diagram (Fig. 2), composed of a platform with modular hardware (composed of three modules), is aimed at the implementation of independent technologies, facilitating the acquisition, maintenance, and customization of the instrument to maximize its performance while staying within the constraints of cost, power consumption, and component availability. Descriptions of the modules and their functionality are as follows.

Figure 2Architecture and organization of the internal structure of the electrical resistivity instrument.
3.1 Computational unit
This unit is responsible for all operationalizations and configurations of the prototype. It consists of a single-board computer (SBC), among which we highlight the system initialization, human–machine interface (HMI), safety check, visualization, I/O (input–output) mechanisms, integration with sensors, serial communication, and preprocessing of geoelectric signals. To perform many activities, the SBC has an operating system based on the Linux Kernel, uses a BCM2711 ARM cortex A72 quad-core 1.5 GHz microprocessor, and has a 5 V DC (3A) power supply. One of the most powerful features of the SBC is its input/output GPIO bus, which allows communication between electronic devices connected to the board such as LCDs, various sensors, automation, and peripherals. As shown in Fig. 3, the prototype features a 7 in. TFT LCD with 800×480 pixel resolution. Another promising aspect of this prototype is its HMI or user interface, which directs the input and output of information in the system. This HMI enables the user to configure the system and visualize the data without the need for an auxiliary computer. This powerful SBC allows the configuration of new electrode arrangements in a programmable and automated manner for use in research on new methodologies for geoelectrical surveys. Conventional arrangements with four electrodes are very practical for the interpretation of results, but the possibility of making many combinations of all electrodes in multichannel equipment allows the acquisition of a very large amount of linearly independent data, allowing the study of new methods of data inversion and interpretation. In addition, owing to the high processing power available, a preliminary interpretation of the data with graphical representation is possible, allowing verification of the sanity of the raw data in the field and eliminating or at least minimizing the capture of compromised data, which often occurs because of failures in the electrode connections to the ground.
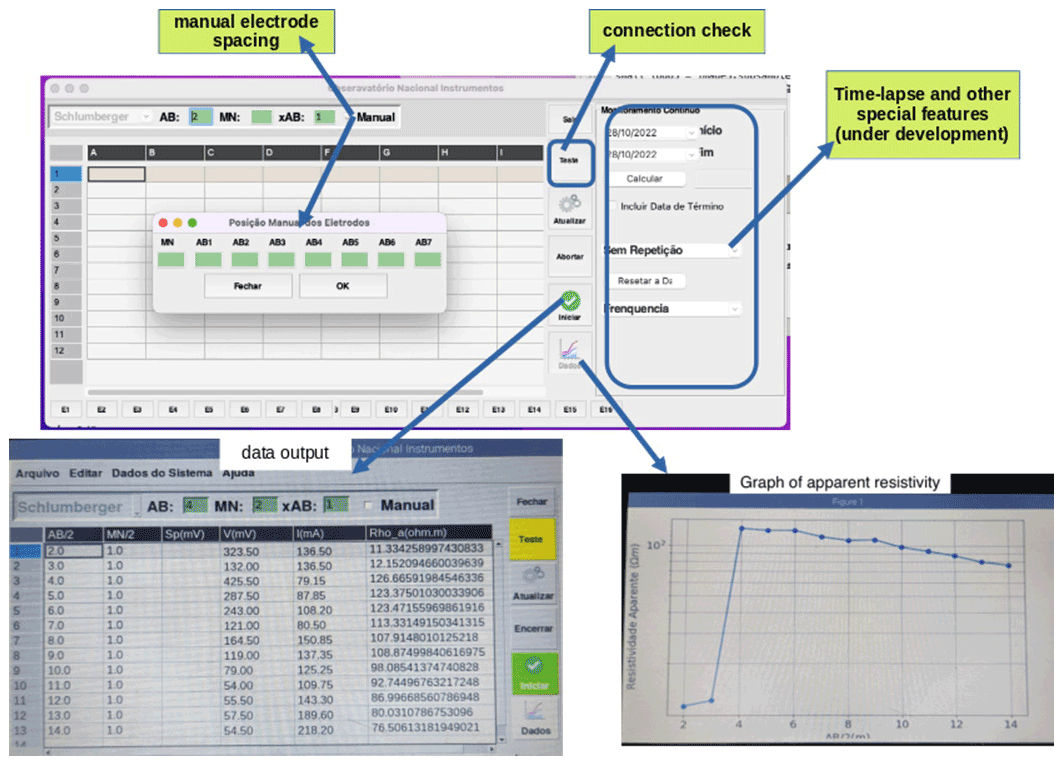
Figure 3Geo-resistivity meter human–machine interface. All functions are directly available on the main screen, providing an easy-to-operate experience. A connection quality self-test was included, allowing for a quick and simple check of probe deployment status. This quality check is based on selected sampling and current injections to confirm electrode contact with the ground. After selecting the arrangements and spacing settings, a single button takes the user through the measurement process and automatically saves the resulting spreadsheet. An apparent resistivity graph is also available, showing a preliminary result for the survey.
3.2 Process automation unit
This module is responsible for automating the platform. This unit has a microcontroller-based circuit that gathers a processor core, volatile and non-volatile memories, programmable serial communication, an I2C SPI interface and a six-channel 22 bit resolution A/D converter (Fig. 4). The firmware is designed to control all low-level functions such as the capture and temporary storage of geoelectrical signals, including power and electrode switching, depending on the selected arrangement.
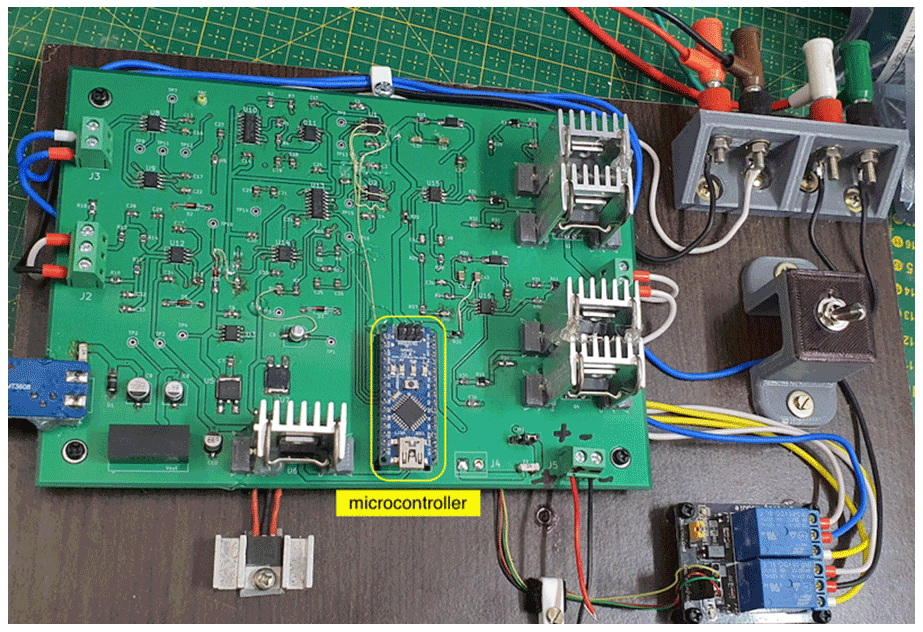
Figure 4Microcontroller coupling via a female pin bar to the electronic circuitry to facilitate board replacement.
3.3 Electronic circuitry
The electronic block diagram (Fig. 5) shows all the main functions of the prototype. The voltage and current signals received from the front-end circuit (electrodes, differential buffers, and current sensors, Fig. 5c) were fed into a two-channel synchronous demodulation circuit that rectifies and delivers DC levels to a pair of analog-to-digital converters (Fig. 5b).
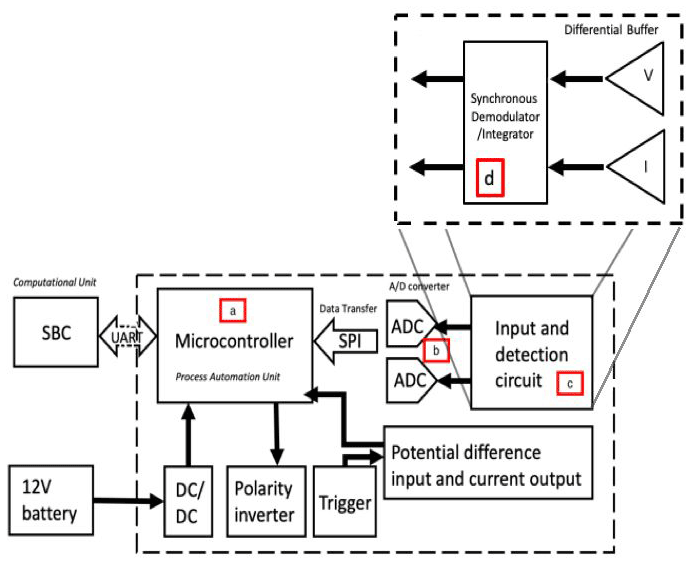
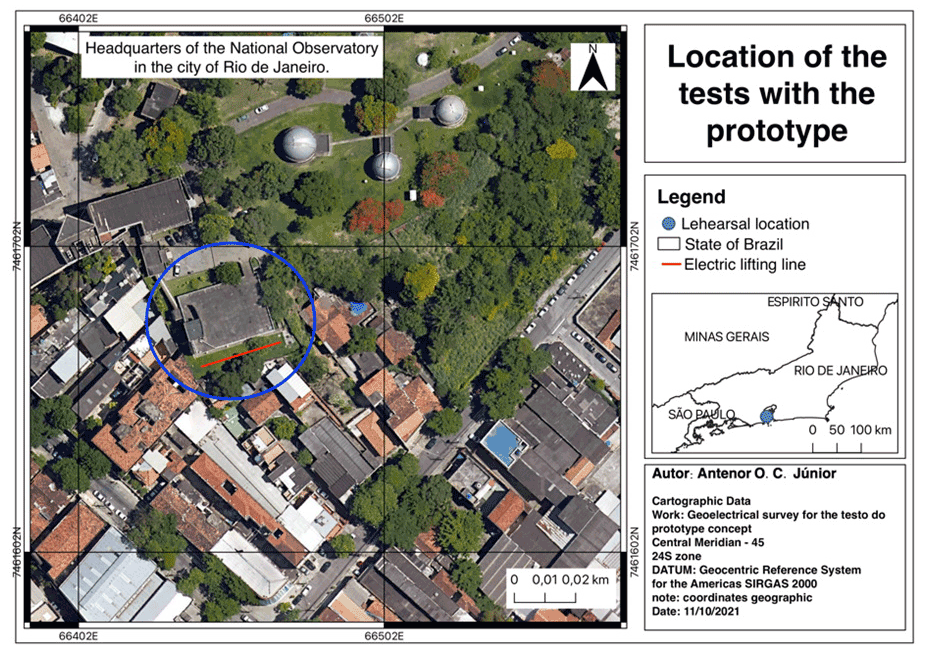
Figure 6Tests with the prototype were conducted at the headquarters of the National Observatory located in the city of Rio de Janeiro-RJ. (© Google Earth, 2021.)
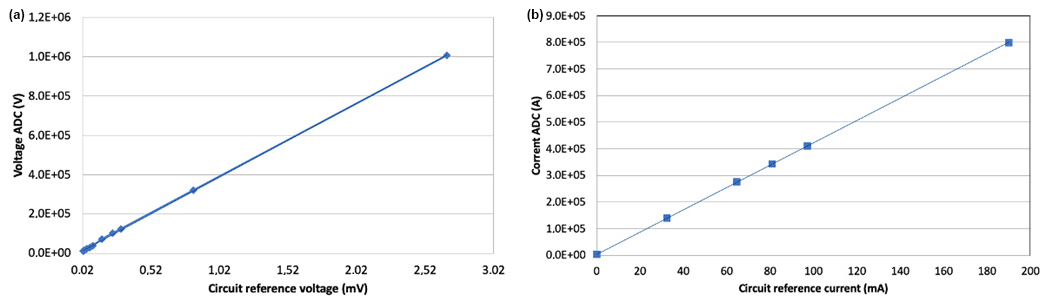
Figure 7Linear correlation graph showing the field test results comparing the voltage (a) and current (b) measured by the prototype against those obtained by a basic benchtop circuit for current and potential difference measurement through a qualitative survey conducted in the laboratory.
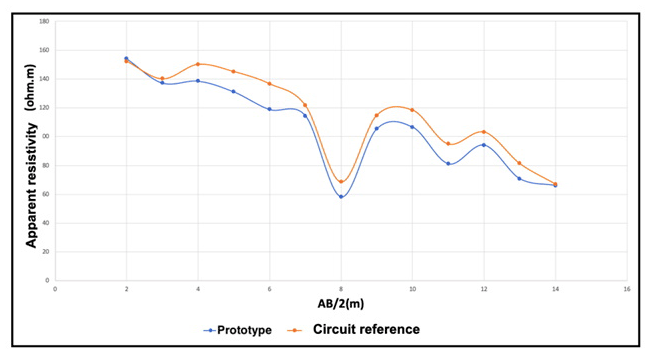
Figure 8Apparent resistivity test results obtained for a vertical electrical survey on a Schlumberger arrangement. Comparison of prototype data with resistivity measurement by bench instruments.
At the differential voltage input, the geoelectric voltage from the receiving electrodes is buffered and applied to a radiofrequency filter to mitigate high-frequency interference. To accurately measure small differential voltages, an INA149 differential amplifier was placed in this circuit, which tolerates common-mode signals in the range of ±275 V. The inputs are protected from momentary common mode or differential overloads of up to 500 V. The measurement of the current injected into the ground was initially performed using an ACS712 transducer chip. However, owing to its low sensitivity, the bench tests reproduced strong noise at very low currents. Instead, we opted for a pair of LTS 9-NP closed-loop multi-range transducers that use Hall effect technology for the electronic measurement of currents (DC, AC, pulsed, and mixed) over a wide frequency range with full galvanic isolation between the primary and secondary circuits. This transducer uses a unipolar voltage source from 0 to 5 V. Two transducers were placed in a differential configuration, doubling the overall sensitivity and creating a pseudo-differential signal with a 2.5 V common level. The analog-to-digital converters (Fig. 5b) have a 22 bit resolution in the delta–sigma architecture and a 15 Hz sampling rate, and they communicate via a serial SPI interface to the microcontroller (Fig. 5a). Because the geoelectric method is a process of successive electrical current injections followed by voltage registration, these signals are acquired and temporarily stored in the memory of the microcontroller for posterior transmission to the main CPU (SBC). The platform uses a 12 V vehicle battery as a source, which allows it to supply all the voltages necessary for the operation of the system. From this battery, a DC–DC converter circuit under the microcontroller command generates several different voltages and frequencies to drive soil current excitation. The use of AC excitation and synchronous demodulation is essential to eliminate electrolytic bias and spurious noise that commonly affect geoelectric signals. An electromechanical switching array, also under the microcontroller command, enables the operation of any category of electrical probing technique in a linear quadrupole system.
To test the accuracy of the measurements, a basic bench circuit was used to compare the measured currents and potentials of the electrodes. In these field tests, vertical electric sounding (SEV) was used with a Schlumberger arrangement and 24 electrodes arranged in a line, working at a voltage of 100 V. This field test with a traditional bench circuit made it possible to obtain a calibration curve (Fig. 7) and current and voltage measurements that could be compared with those obtained with the prototype in tests at the same site (Fig. 6). The site chosen for testing was located within the National Observatory premises in Rio de Janeiro. Studies carried out at this site through boreholes indicate the presence of a shallow subsurface landform followed by a sandy-silt horizon, fine to medium, interpreted as residual soil.
Table 1Main features of this project, showing relevant aspects derived from its original concepts.
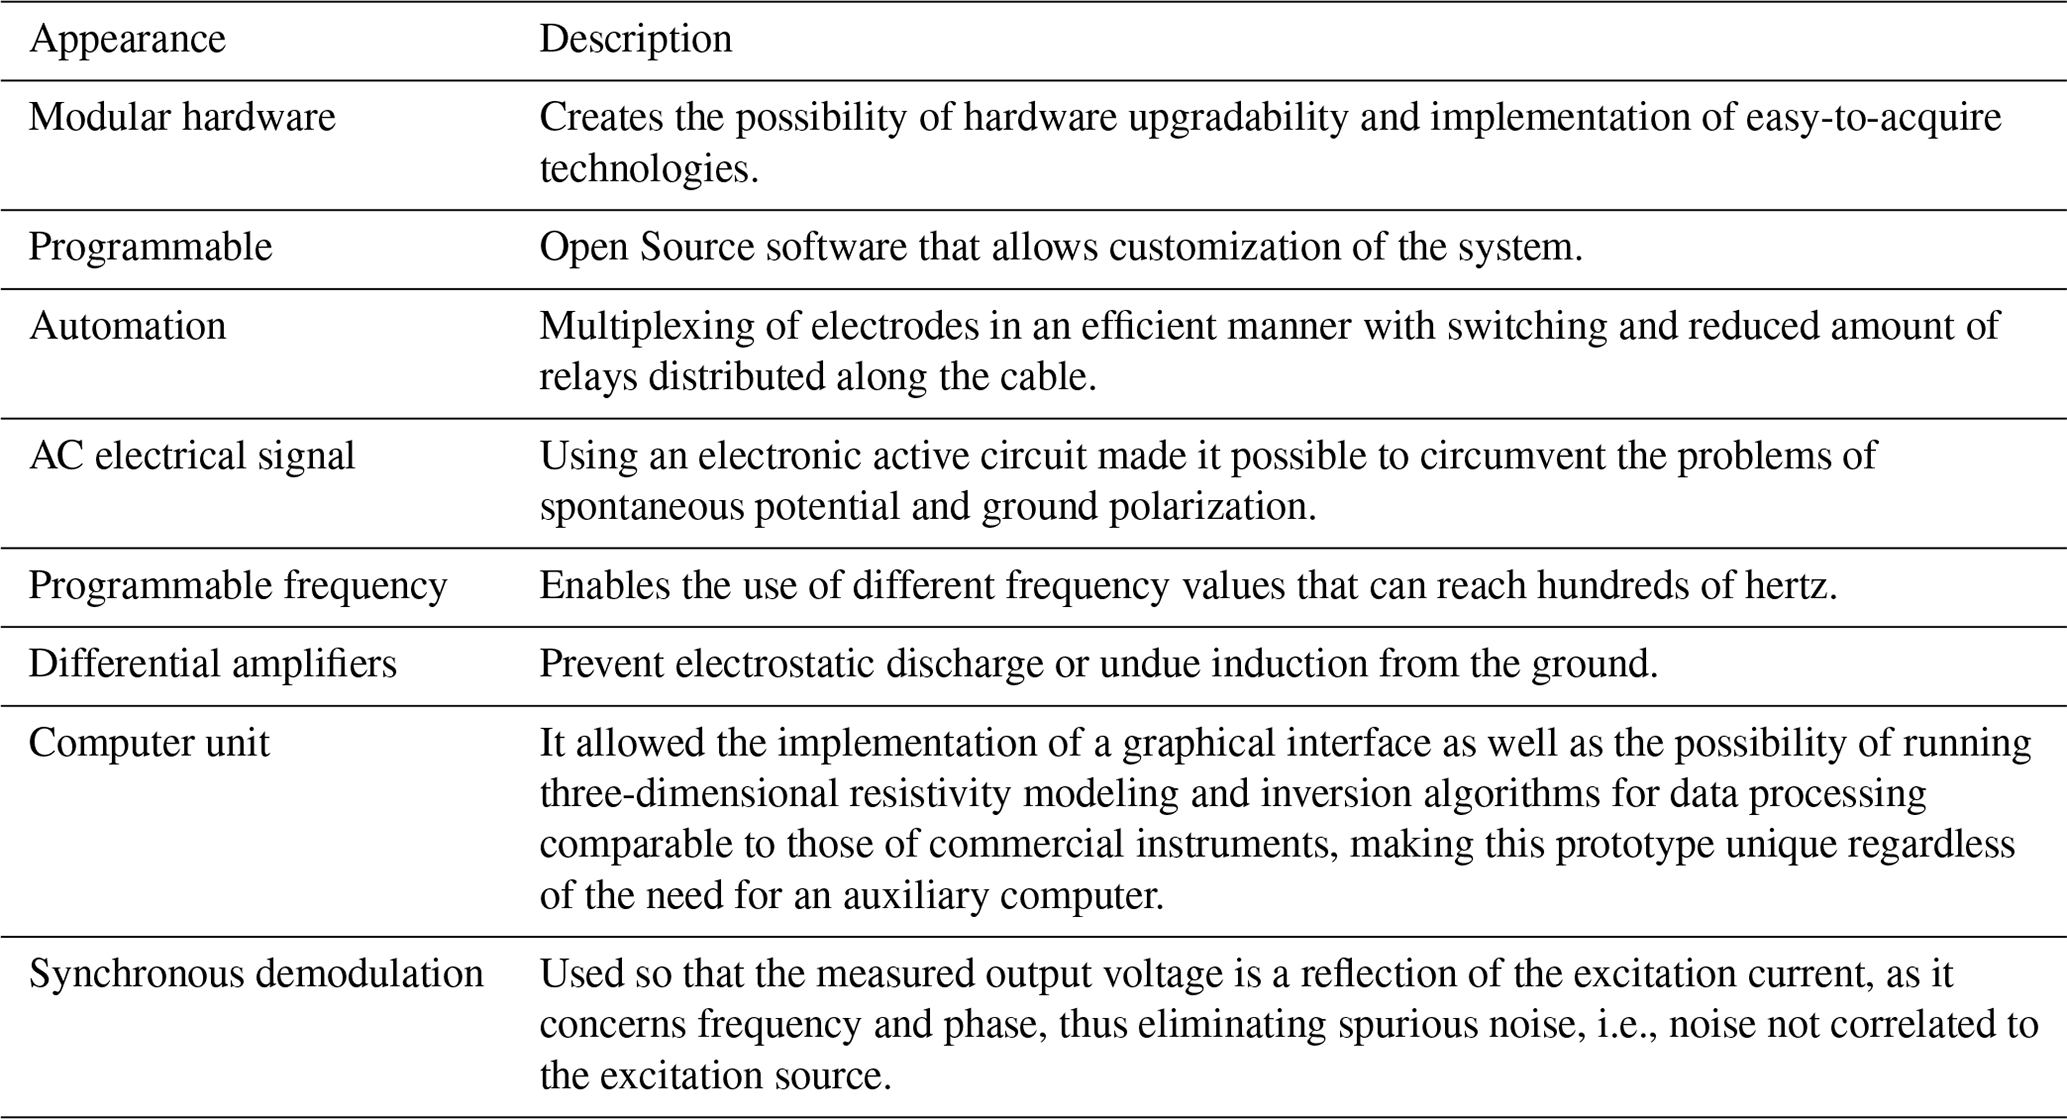
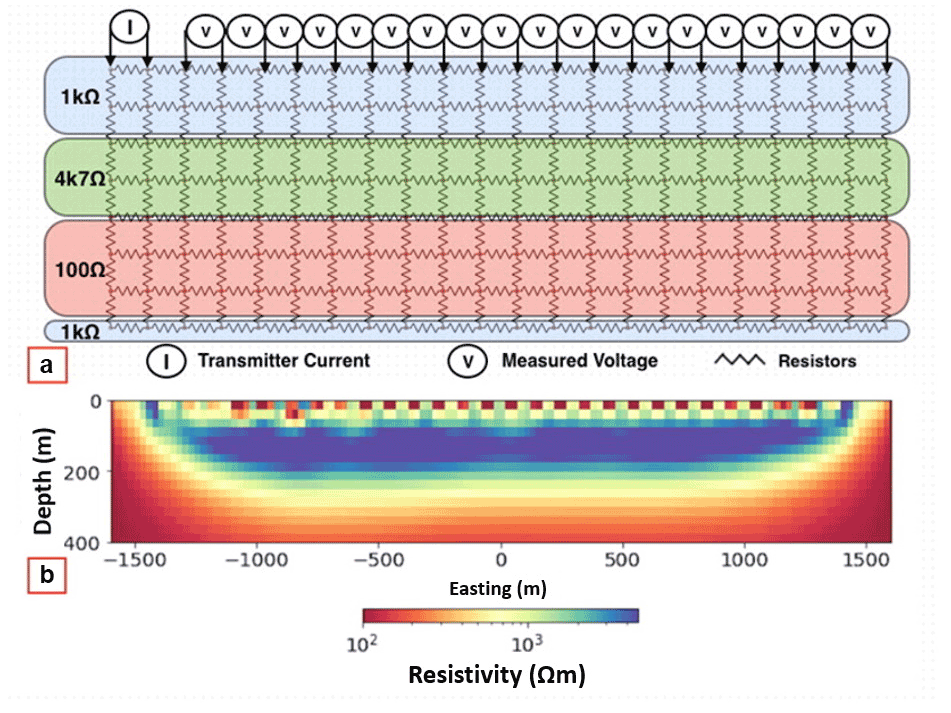
Figure 9Simulated inversion for a dipole–dipole arrangement in resistive layer model format (a) shows that the implementation of the measurement treatment can be performed by the equipment in loco with good performance, even though no configurations or adjustments were made to improve the results used for testing the programming and automation processes. In this validation test, we considered only three horizontal layers of the mesh of resistors with values of 1000, 4700, and 100 Ωm. It is possible to identify clear features such as the separation of layers (b), vertical discontinuity, and order of magnitude of the resistivity, which are compatible with the values used in the test.
The measurements obtained in the field were, for the most part, consistent with the objectives proposed in this work, qualitatively and quantitatively evidencing the good functioning of the developed low-cost prototype for obtaining in situ resistivity parameters at small depths. From this perspective, the tests involving the voltage and current presented good performance and accuracy based on the observed results, showing a linear correlation obtained by the ADCs (analog-to-digital converters) of the prototype compared with the measurements of electronic equipment to measure these electrical quantities with high accuracy (Table 1).
The regression analysis correlated the current and R2=0.9998, where y is the measurement obtained by the prototype and x is the measurement obtained with an ammeter (Fig. 7a), whereas the voltage measurements had an equal regression and R2=0.9998 (Fig. 7b). Differential mode measurements and synchronous demodulation were appropriate choices to ensure reasonably linear and reliable measurements. By analyzing the same measurements, we observed that the average percentage variation between the two pieces of equipment was 9.4 % (Fig. 8). Generally, the resistivity distributions along the section are comparable, even with some visible passive variations to be attributed to environmental effects due to the rainy season of the period in which this test was conducted. This is despite the fact that voltages of several millivolts, coming from 60 Hz in the surroundings of the test area, were not detected in the measurements made by the prototype, only affecting the estimations of the apparent resistivity of the soil.
The equipment proved to be easy to handle, given that all the functions are well described in its control interface, and amenable to improvements owing to its open code which allows customization of the entire operational process of the equipment by the user. Another important aspect is in its current configuration that, for this prototype, allows it to deliver higher tension, thus enabling deeper soundings.
In this study, we constructed a functional prototype with the objective of achieving the performance of a professional instrument, as an open-source hardware and software solution, based on easily accessible components and modules, with the aim of providing a piece of equipment capable of being used in teaching and geophysical research.
The field survey experience confirmed the feasibility of using multi-electrode systems and automated acquisition, owing to the implementation of customized code through the programming of new electrode arrangements for this type of survey. The use of an AC electrical signal assisted by a synchronous demodulation circuit allowed us to circumvent the problems of spontaneous potential, earth polarization, and electrical induction from the power grid. Some initiatives exist for the production of prototypes of geoelectric instruments, but they are usually limited to didactic demonstrations or proof of concept without significant instrumental performance. Our modular hardware prototype brought a robust computational capacity to the proposed equipment, including a graphical interface that brings the possibility of implementing new functions and sensors, in addition to executing modeling algorithms in the Python language (Cockett et al., 2015), that made it possible to produce the treatment of synthetic test data, as shown in Fig. 9. All the circuits and software developed in this study are available to the scientific community in a repository, allowing their free use and possible contributions to the project.
All hardware and software related to the instrument presented in this study can be accessed under the following DOI: https://doi.org/10.5281/zenodo.7411844 (Wiermann et al., 2022).
AW and CFdPN initiated research planning. AW, AOCJ, and CFdPN planned how the prototype development should be carried out. AW, AOCJ, and CFdPN planned and performed calibration measurements during the field test. All authors discussed the results and contributed to this article.
The contact author has declared that none of the authors has any competing interests.
Publisher's note: Copernicus Publications remains neutral with regard to jurisdictional claims in published maps and institutional affiliations.
This paper was edited by Lev Eppelbaum and reviewed by two anonymous referees.
Augusto Filho, O. and Virgili, J. C.: Estabilidade de taludes, Geologia de Engenharia, ABGE, São Paulo, https://revista.unisal.br/lo/index.php/revistajornada/article/view/484/214 (last access: 24 October 2020), 2016.
Braga, A. C. O.: Geofísica aplicada: métodos geoelétricos em hidrogeologia, Oficina de textos, ISBN 978-85-7975-191-2, 2016.
Clement, R., Fargier, Y., Dubois, V., Gance, J., Gros, E., and Forquet, N.: OhmPi: An open source data logger for dedicated applications of electrical resistivity imaging at the small and laboratory scale, Elsevier, https://doi.org/10.1016/j.ohx.2020.e00122, 2020.
Cockett, R., Kang, S., and Heagy, L. J., SimPEG: An open source framework for simulation and gradient based parameter estimation in geophysical applications, Comput. Geosci., https://doi.org/10.1016/j.cageo.2015.09.015, 2015.
Dimech, A., Cheng, L., Chouteau, M., Chambers, J., Uhlemann, S., Wilkinson, P., Meldrum, P., Benjamin, M., Fabien-Ouellet, G., and Isabelle, A.: A Review on Applications of Time-Lapse Electrical Resistivity Tomography Over the Last 30 Years: Perspectives for Mining Waste Monitoring, Surv. Geophys., 43, 1699–1759, 2022.
Dong, X., Luo, W., Wang, H., Ge, J., Liu, H., and Dong, H.: A distributed high-density resistivity meter working on a two-wire cable, J. Phys.: Conf. Ser., 1754, 012021, https://doi.org/10.1088/1742-6596/1754/1/012021, 2021.
Feitosa, F. A. C., Manoel Filho, J., Feitosa, E. C., and Demetrio, J. G. A.: Hidrogeologia: conceitos e aplicações, CPRM, Rio de Janeiro, ISBN 978-85-7499-061-3, 2008.
Hassan, A.: Electrical resistivity method for water content characterisation of unsaturated clay soil Doctoral dissertation, Durham University, http://etheses.dur.ac.uk/10806/1/Asem_HASSAN_thesis.pdf?DDD10+ (last access: 5 October 2021), 2014.
Kearey, P., Brooks, M., and Hill, I.: Geofísica de exploração, Oficina de textos, ISBN 978-85-86238-91-8, 2009.
Keller, G. V.: Electrical properties of rocks and minerals, Geological Society of America, Boulder, Colorado, ISBN 9780203712115, 1966.
Keller, G. V. and Frischknecht, F. C.: Electrical methods in geophysical prospecting, Pergamon Press, UK, ISBN 13 9780080115252, 1966.
Luiz, J. G. and Silva, L. M. C.: Geofísica de prospecção, UFPA – Editora Universitária, ISBN 85-247-0118-8, 1995.
Menezes, P. T. L.: Fundamentos do Método Magnetotelúrico na Exploração de Hidrocarbonetos, SBGF – Sociedade Brasileira de Geofísica, Rio de Janeiro/RJ, ISBN 978-85-88690-20-2, 2013.
Nazifi, H. M., Gülen, L., Gürbüz, E., Pekşen, E. Time-lapse electrical resistivity tomography (ERT) monitoring of used engine oil contamination in laboratory setting, J. Appl. Geophys., 197, 104531, https://doi.org/10.1016/j.jappgeo.2022.104531, 2022.
Orellana, E.: Prospección Geoeléctrica en Corriente Continua, Editorial Paraninfo, Madrid, Spain, ISBN 84-283-1153-6, 1972.
Parkhomenko, E. I.: Electrical properties of rocks, Springer Science & Business Media, ISBN 978-1-4615-8609-8, 2012.
Pasquali, V., D'Alessandro, G., Gualtieri, R., and Leccese, F.: A new data logger based on Raspberry-Pi for Arctic Notostraca locomotion investigations, Measurement, 110, 249–256, https://doi.org/10.1016/j.measurement.2017.07.004, 2017.
Santos, I. R. M., Alves, R. C. R., Franco, L. M., Oliveira, G. M., and La Terra, E. F.: Eletrorresistividade e georadar aplicados à Geotecnia para a construção de prédio anexo no campus do Observatório Nacional, SBGF, https://drive.google.com/file/d/1aZx2cbrzQAXG-to5tDTs0MiAjIgSmFea/view?usp=share_link, last access: 20 August 2021.
Sato, H. K.: Notas de aula, Centro de Pesquisa em Geofísica e Geologia, Instituto de Geociências, http://www.cpgg.ufba.br/sato/cursos/metodos-eletricos/notas-aula.pdf (last access: 25 March 2021), 2002.
Silva, L. M. A.: Resistividade elétrica superficial do concreto: influência da cura, Universidade Federal de Goiás, http://repositorio.bc.ufg.br/handle/ri/11303 (last access: 1 February 2020), 2016.
Telford, W. M., Geldart, L. P., and Sheriff, R. E.: Applied Geophysics, Cambridge University Press, ISBN 0-521-32693-1, ISBN 0-521-33938-3, 1990.
Toll, D. G.: A data acquisition and control system for geotechnical testing, in: Computing developments in civil and structural engineering, Civil-Comp Press, Edinburgh, https://doi.org/10.4203/ccp.63.7.3, 1999.
Wiermann, A., Junior, A., and Ponte-Neto, C.: Geo-Resistivity-meter: Hardware and software repository for a geophysical instrument, Zenodo [data set], https://doi.org/10.5281/zenodo.7411844, 2022.
Zonge, K. L.: Electrical properties of rocks as applied to geophysical prospecting, The University of Arizona, https://repository.arizona.edu/handle/10150/287835 (last access: 21 May 2021), 1972.