the Creative Commons Attribution 4.0 License.
the Creative Commons Attribution 4.0 License.
 | 05 Jun 2024
Copper permalloys for fluxgate magnetometer sensors
B. Barry Narod
David M. Miles
Fluxgate magnetometers are commonly used to provide high-fidelity vector magnetic field measurements. The magnetic noise of the measurement is typically dominated by that intrinsic to a ferromagnetic core used to modulate (gate) the local field as part of the fluxgate sensing mechanism. A polycrystalline molybdenum–nickel–iron alloy (6.0–81.3 Mo permalloy) has been used in fluxgates since the 1970s for its low magnetic noise. Guided by previous investigations of high-permeability copper–nickel–iron alloys, we investigate alternative materials for fluxgate sensing by examining the magnetic properties and fluxgate performance of that permalloy regime in the range 28 %–45 % Cu by weight. Optimizing the alloy constituents within this regime enables us to create fluxgate cores with both lower noise and lower power consumption than equivalent cores based on the traditional molybdenum alloy. Racetrack geometry cores using six layers of ∼30 mm long foil washers consistently yield magnetic noise around 4–5 pT at 1 Hz and 6–7 pT at 0.1 Hz, meeting the 2012 1 s INTERMAGNET standard of less than 10 pT noise at 0.1 Hz.
- Article
(21426 KB) - Full-text XML
- BibTeX
- EndNote


In December 2007, one of us (Narod) rediscovered a paper by von Auwers and Neumann (1935), titled On Iron–Nickel–Copper Alloys of High Initial Permeability in English, and this eventually set into motion our examination of copper permalloys as potentially useful materials for fluxgate magnetometer sensors. Specifically, we are interested in copper permalloy's potential to simultaneously provide low magnetic noise and low power consumption in a fluxgate sensing application. With the assistance of colleagues at Zentralanstalt für Meteorologie und Geodynamik (ZAMG, now incorporated into GeoSphere Austria), we had located a loose paper copy in a box of collected papers situated in the library of the Austrian Academy of Sciences in Vienna, a collection which, conveniently for us, had been catalogued by their librarians. This paper was last cited in 1961 (Puzei, 1961) and had disappeared from living memory. A single citation of it in Bozorth (1951) had caused us to spend several years searching for it. The collection of copper permalloy data included in von Auwers and Neumann (1935), extraordinary in both quantity and quality, is reproduced in translation in the Appendix.
Prior to our present efforts, 6.0 % molybdenum (6 % Mo; all percent compositions are given in weight–percent compositions) permalloy was the state-of-the art sensor material for the best performing fluxgate sensors for geophysics and space physics (Gordon et al., 1968). However, the markets for such materials are small, and in 1996, our community's ready access to such material ceased. Since that moment, we and others have undertaken investigations of 6% Mo permalloy procurement and processing to create new supplies (Müller et al., 1998; Narod, 2014; Miles et al., 2022).
We have now arrived at a place where we are able to melt any permalloy in small quantities, roll it, draw it, heat treat it, and machine it to any desired shape in any sequence of process steps. We began by fabricating 6 % Mo permalloy (Narod, 2014; Miles et al., 2016, 2022; Greene et al., 2022) and from it a variety of novel fluxgate sensors.
1.1 The case for copper permalloys
Miles et al. (2022) presented, along with 6 % Mo permalloy, our first trial of a copper permalloy. This alloy consisted of 28 % copper and 62 % nickel and balance iron, which we designate 28Cu62Ni. The case for 28Cu62Ni went as follows.
We knew that 6 % Mo permalloy has several properties that are thought advantageous for fluxgate sensor materials. These are (1) minimum magnetocrystalline anisotropy, K1; (2) minimum bulk magnetoelastic anisotropy (magnetostriction) λs; (3) minimum saturation magnetization Bs of all such materials satisfying (1) and (2); and (4) a requirement for slow cooling during heat treatment to minimize residual stress (Pfeifer, 1966; English and Chin, 1967; Pfeifer and Boll, 1969; Musmann and Afanassiev, 2010). Pfeifer (1966) and the subsequent papers all placed the zero crossings satisfying (1) and (2) over a range of compositions, including 4 %–6 % molybdenum. But from their figures, 6 % Mo uniquely also satisfied both (3) and (4), and the figures of these papers ultimately drove the choice to use 6 % Mo in a new generation of fluxgate magnetometers (Mario Acuña, personal communication, 1981).
We then sought a copper alloy composition that satisfied four equivalent conditions, a choice which was enabled by data presented in the von Auwers and Neumann (1935) paper. Their Figs. 8, 11, and 13, included here in the Appendix, respectively plot contours of initial permeability, magnetostriction, and saturation magnetization for a collection of measurements from 130 copper permalloys, with all specimens having undergone the authors' “1100 treatment”, which is a slow-cooled heat treatment.
We consider the 1100 treatment to be functionally equivalent to that of the slow cooling of Pfeifer (1966). We have also taken the highest initial permeability to be a proxy for minimum total anisotropy (both magnetocrystalline and magnetoelastic).
For their “permalloy treatment”, essentially quenching, we noted in their Fig. 6 that the maximum initial permeability locates at a composition including 14 % Cu, while for 1100 treatment, the maximum locates at a composition including 28 % Cu. The saturation magnetizations, Bs, for the two cases were, respectively, 750 and 550 mT. Our condition (3) then led us to use 28Cu62Ni as our first copper test alloy, which conveniently would share the same heat treatment as 6 % Mo permalloy.
Our first trial with a fluxgate sensor made from 28Cu62Ni (Miles et al., 2022) produced performance results comparable to a nominally identical sensor made from 6 % Mo permalloy, and for some parameters, such as power consumption, the 28Cu62Ni alloy sensor outperformed. The success of our initial copper alloy trial encouraged us to expand our investigations of copper permalloys, seeking more resolution in composition and extending our fluxgate sensor builds to alloys with much higher copper contents. It is well known that lower Bs leads to improved noise performance (Musmann and Afanassiev, 2010), and in Appendix B, Fig. B13 shows clearly that higher copper content reduces Bs, but higher copper content also worsens initial permeability, which is our proxy for anisotropy. With respect to the noise the theory, Narod (2014, Eq. 8) suggests that the effect of lower Bs could dominate over lower permeability.
The choices for our alloy compositions were again guided by Figs. 8, 11, and 13, of von Auwers and Neumann (1935). For the copper contents, we selected the range 28 % Cu–45 % Cu. For our minimum copper content alloys, we chose 28 % Cu, with about 60 % Ni. This coincided with the maximum initial permeability measured by von Auwers and Neumann (1935). For our maximum copper content alloy, we chose 45 % Cu, 50 % Ni, and 5 % Fe which has a saturation induction of about 200 mT. We were concerned we might be running into a Curie temperature limitation; however, this has now been determined not to be the case. For the nickel contents we selected a range of 5 % Ni content centred on the zero magnetostriction contour. On the copper and nickel axes, our specimen spacings were typically 2 % and 1 %, respectively. This collection included 52 specimens, with the composition range plotted in Fig. 1.
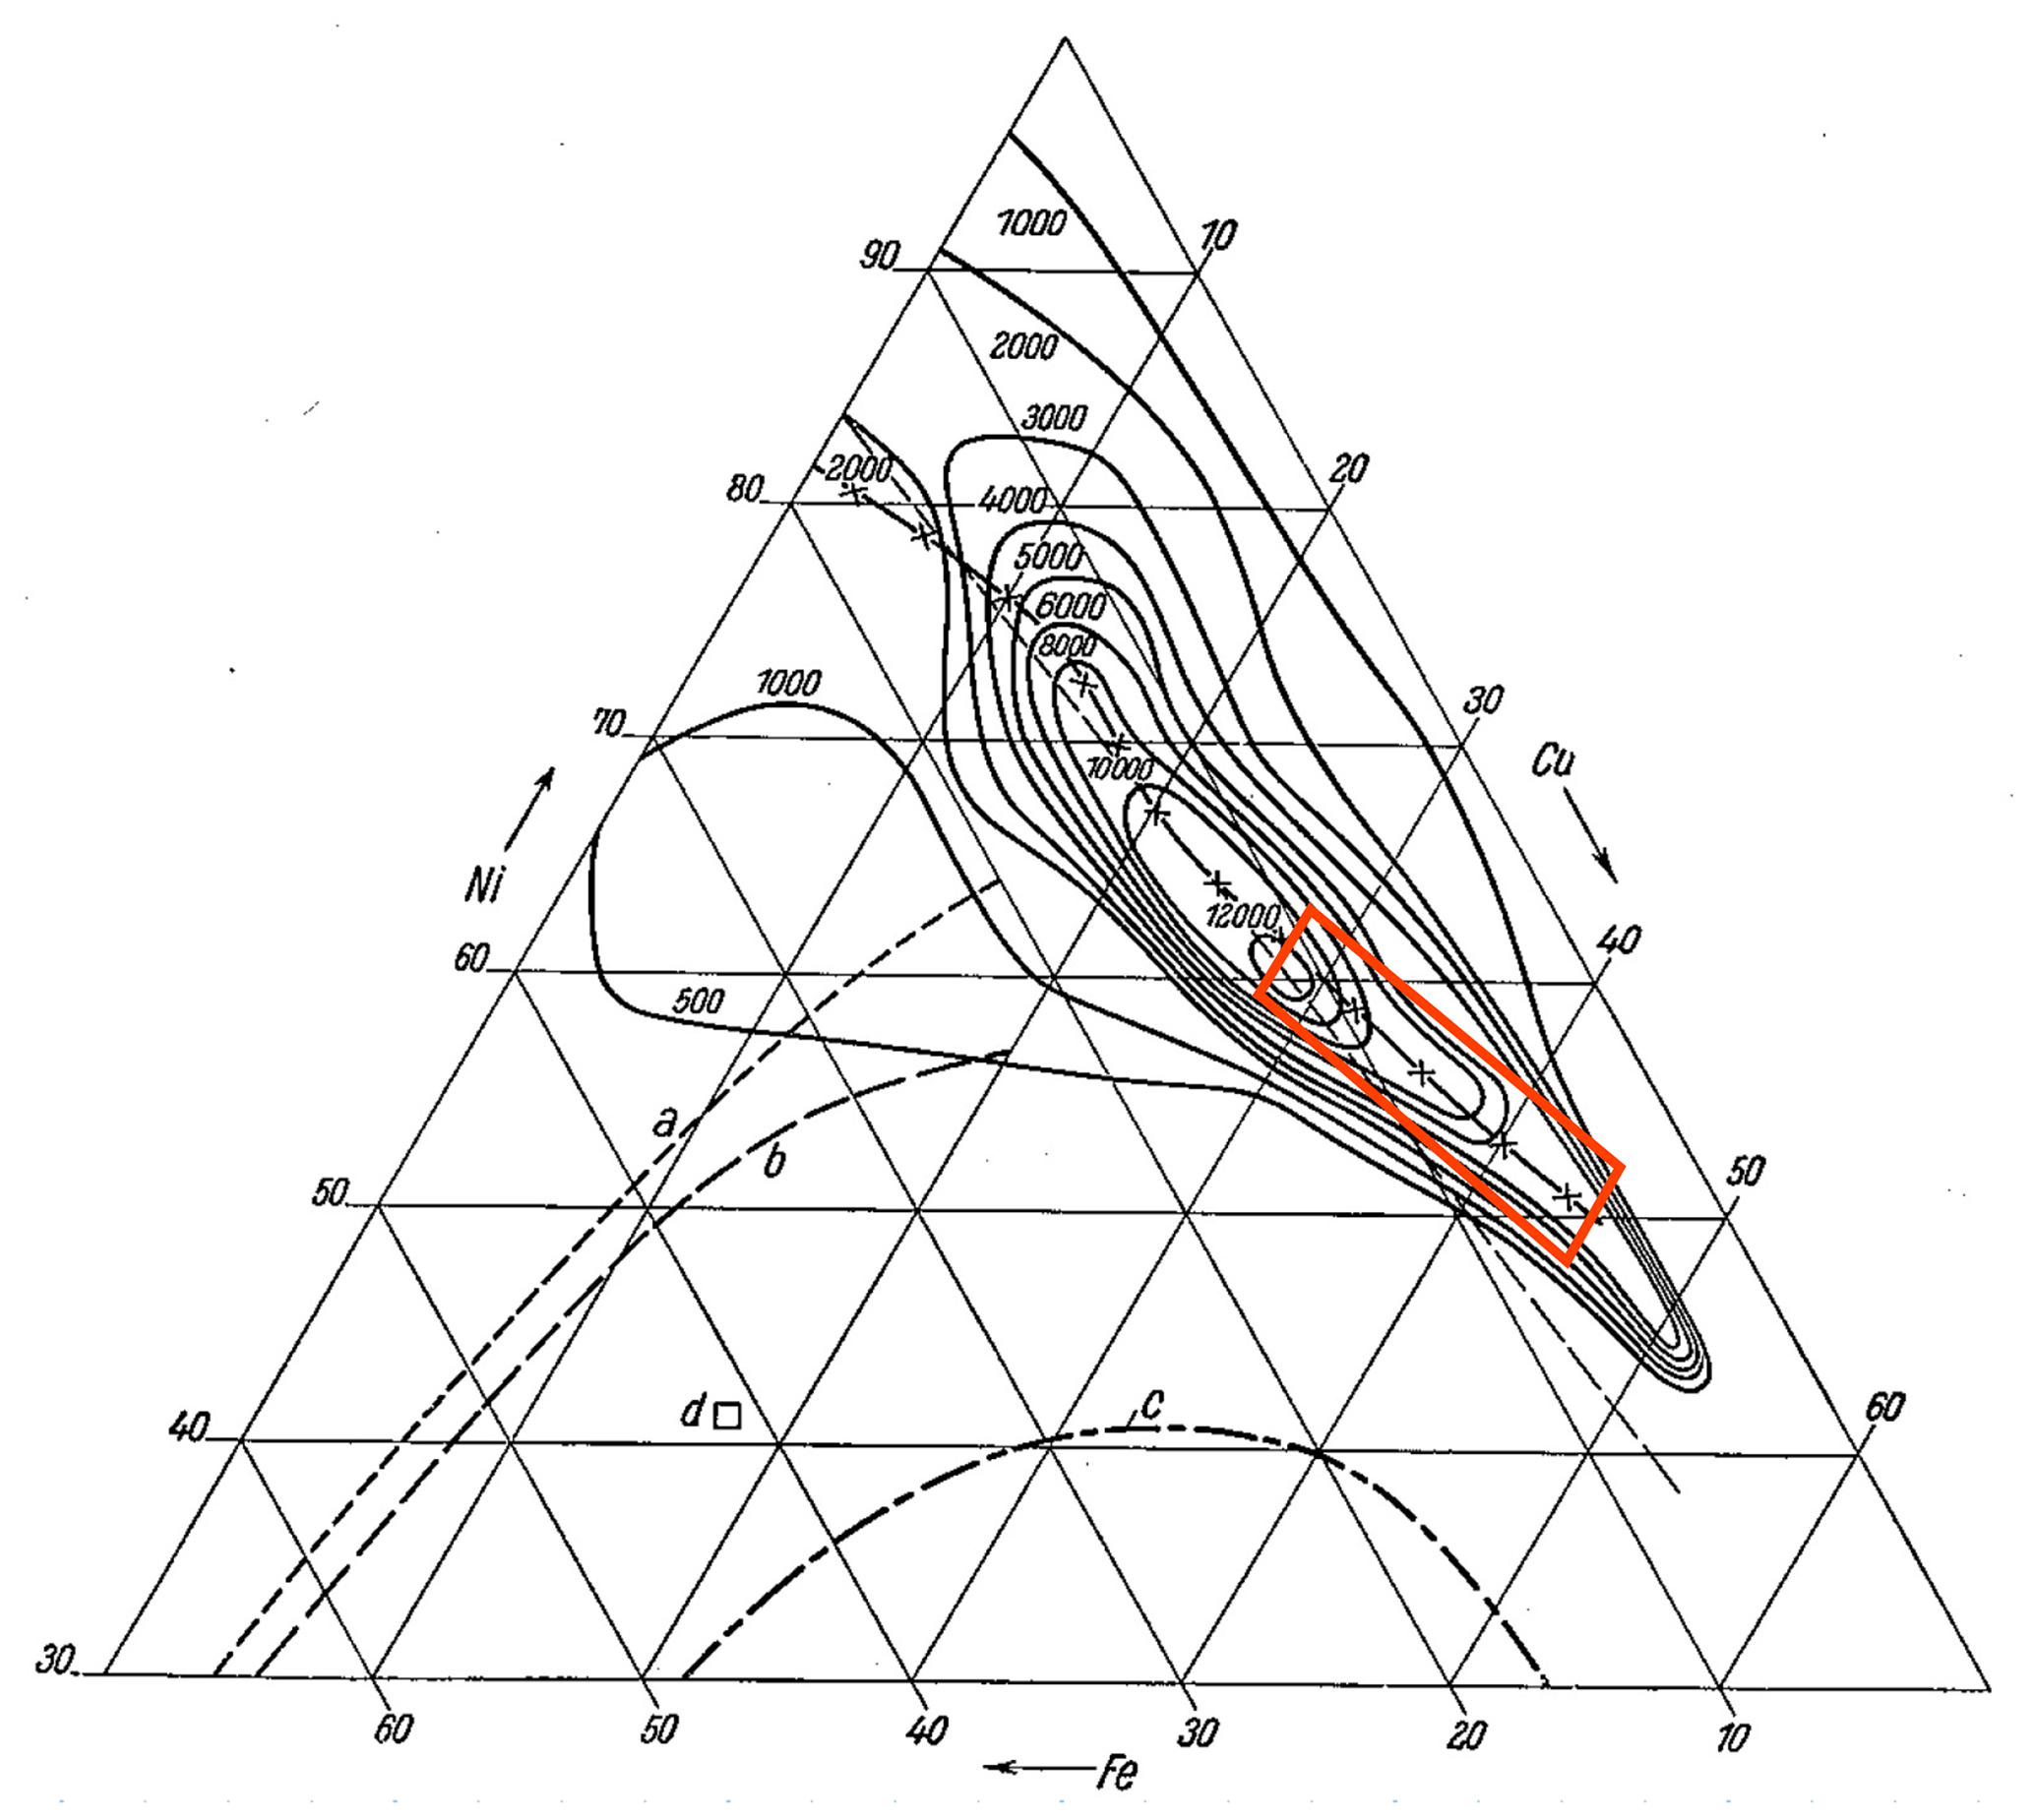
Figure 1The range of copper permalloy compositions in our study, outlined in red and superimposed on Fig. 8 of von Auwers and Neumann (1935), with their contour plot of initial permeabilities after their 1100 treatment.
The organization of the remainder of this paper is as follows. We first offer a look at the history of permalloy development, beginning in the 1920s, with our attempt to answer a question: how is it possible that copper permalloys for use in fluxgate magnetometers was missed for most of a century? We then continue with descriptions of our experimental work, including sample preparation and data acquisition, and the presentation of our data. We conclude with our interpretation of our data.
1.2 History of permalloys as soft magnetic materials
We have asked ourselves how it was possible for high-copper-content permalloys to have remained undiscovered for nearly a century for their use as suitable sensor materials for low noise, low power fluxgate magnetometer sensors. Here we examine the history of permalloy development and attempt to consider this question. We loosely use the word permalloy to mean a low loss, low coercivity alloy of more than 35 % nickel with some iron content (Nature, 1948). Other alloying elements may include chromium, molybdenum, or copper.
Our earliest period of interest began in 1921, with Gustav W. Elmen filing U.S. patent 1,586,884 while employed by the Western Electric Co. of New York (Elmen, 1926), which later became Bell Telephone Laboratories. This period concluded in 1947 with the development of “Supermalloy” (Boothby and Bozorth, 1947), also at Bell Telephone Laboratories. This interval features the invention of the fluxgate magnetometer by Aschenbrenner and Goubau (1936) and the development of the Gulf magnetometer in 1941 (Vacquier, 1946a, b; Wyckoff, 1948). The interval also included the development for the Telegraph Construction and Maintenance Co. Ltd. in the United Kingdom by Willoughby Statham Smith and Henry Joseph Garnett of early copper permalloys (Smith and Garnett, 1925, 1926, 1927), with both investigating developments for the magnetic loading of communications cables. In the 1930s, Otto von Auwers and Hans Neumann, both at Siemens & Halske in Berlin, investigated a range of ternary iron–nickel–copper alloys for both inductive and permanent magnet properties (von Auwers and Neumann, 1935; Neumann, 1934; Neumann et al., 1937). We shall now look more closely at the American, British, and German efforts.
1.2.1 USA
Elmen's 1921 patent filing claimed an alloy comprising 78.5 % nickel and 21.5 % iron, the first higher-permeability nickel–iron alloy. Elmen noted within the patent text the inverse relation between minimum hysteresis losses and maximum permeability in the vicinity of the target composition, the presence of a resistivity maximum at mid-range compositions above the Invar transition, and the presence of the “well known maximum … that precedes the attainment of the critical temperature”, attributable to Hopkinson (1889). In 1926, Elmen filed his second permalloy patent application (U.S. patent 1,768,443; Elmen, 1930), claiming a lower loss, lower coercivity alloy of about 78.5 % nickel, 16 %–18.5 % iron, and 3 %–4 % molybdenum. The motivation for Elmen's efforts was the creation of low loss magnetic materials for the magnetic loading of central conductor transocean communications cables, with the intent of increasing their signalling speed (Foster et al., 1929). Elmen noted in the 1930 patent that 3.7 % molybdenum content developed, for that time, the highest initial permeability of any known magnetic material. The importance of the alloy's heat treatment was to some extent understood by Elmen. Typical heat treatment features a reducing atmosphere, a period held at a higher temperature, e.g., 1100 °C (the soak), and a controlled cooling from 600 °C to room temperature. Extrema to the cooling could be a quench where a 600 °C work piece was removed from heat and placed on a copper slab or a furnace cool when a furnace was allowed to slow cool to room temperature, taking perhaps 15 h to complete. Elmen tested both types, referring to them as “A – slow cooling” and “B – rapid cooling”.
Boothby and Bozorth (1947) reported on their lab's highest yet initial permeability in a 5 % molybdenum permalloy 20 years later, which they named Supermalloy. Unlike prior materials, their new alloy benefited from “a definite cooling rate to be used below the temperature at which atomic ordering begins”, without disclosing the rate, which likely was in the vicinity of 200 °C h−1 (Carpenter Technology, 1991). Their hypothesis was that the addition of only molybdenum to the binary nickel–iron alloy, together with a particular cooling rate, caused magnetoelastic anisotropy (magnetostriction) and magnetocrystalline anisotropy to “disappear at the same time”.
In subsequent years, both Elmen and Bozorth participated in investigations at the magnetics laboratory of the U.S. Naval Ordnance Laboratory. It appears at all times that these efforts in the USA to develop permalloy materials concentrated on only ternary molybdenum permalloys.
1.2.2 United Kingdom
Smith and Garnett obtained three patents with respect to copper permalloys for use in communications cables (Smith and Garnett, 1925, 1926, 1927). Their development of 5 % copper permalloy enabled them to circumvent the molybdenum patents of Elmen. The first two patents could be considered together as a single publication, as they have identical filing dates and almost identical content. There are differences between their claims. The 1925 patent claims compositions including 15 %–25 % copper. The 1926 patent claims compositions including 5 %–6 % copper. In the claims of both patents, the iron content is never less than 17 %. The 1927 patent refers primarily to the heat treatment of magnetically loaded wires and makes no claims with respect to compositions. That said, this patent does refer to one composition with 76 % nickel, 16.5 % iron, 5 % copper, 2.0 % chromium, and 0.5 % manganese, which became the historical composition of “Mumetal”. Smith and Garnett do not describe a role for the copper content in these patents, but they very clearly ascribe a role to a fourth element, typically a transition metal, such as vanadium through to chromium or molybdenum, with that role being to increase the resistivity of the alloy.
The USA investigators and the United Kingdom investigators thus had very different understandings regarding the role of molybdenum in ternary or quaternary permalloys. What follows now should demonstrate that in Germany the Siemens & Halske investigators were thinking in line with the United Kingdom investigators.
1.2.3 Germany
Similar investigations were undertaken in the 1930s in Berlin at Siemens & Halske Wernerwerkes. These efforts led to the development of their commercial alloy “1040”, also known as “M-1040” (Pfeifer and Boll, 1969). The 1040 composition is 72 % nickel, 11 % iron, 14 % copper, and 3 % molybdenum (Neumann, 1934). Neumann specifically states its resistivity as being “0.56” (presumably 56 µΩ cm−1), which is competitive with modern molybdenum permalloy resistivities, and significantly higher than our own measurements of 28 % copper permalloy resistivity near 31 µΩ cm−1.
Comparing magnetic values for 1040 with those for ternary 14 % copper permalloy (von Auwers and Neumann, 1935), the addition of 3 % molybdenum reduced the saturation magnetization from about 800 to 600 mT, which is a significant reduction and similar to that for a modern molybdenum permalloy with a saturation magnetization typically about 0.75 T. Whether the Siemens & Halske investigators understood the full role of molybdenum content in permalloy is unclear. They certainly appreciated its role in reducing conductance losses and would have noted its effect on saturation magnetization. Our own investigations replicating 1040 found one more issue. Our 1040 specimen developed significant chemical segregation when cooled slowly, presumably due to its quaternary composition. Enoch and Murrell (1969) also conjectured such segregation in quaternary permalloys. Thus like 14 % ternary copper permalloy, 1040 likely developed its best magnetic properties when it underwent permalloy handling, that is, air-quenching from 625 °C (von Auwers and Neumann, 1935).
Like Elmen, the 1935 broad-based study of von Auwers and Neumann regarding 130 ternary iron–nickel–copper alloys also considered two distinct heat treatments, namely one rapid and one slow. As noted above, a 14 % copper permalloy achieved its best performance for the rapid cool, with respect to initial permeability. For their furnace-cooled specimens, their highest initial permeability was achieved at 28 % copper, which is the composition also used for our first copper permalloy test (Miles et al., 2022).
In this period, Georg Keinath (Merz, 1960) was the head of Siemens & Halske's entire development department of the Wernerwerkes for measuring technology. In 1937 he and his Jewish wife emigrated to the USA. Keinath's departure from Berlin coincided with Siemens & Halske's diminution or cessation of permalloy research in general and of copper permalloy research in particular.
1.2.4 Chromium and molybdenum
Keinath (1932) presented a study of the effects of chromium and molybdenum in ternary permalloys. He looked particularly at their effects on resistivity, Curie temperature, and saturation moment. Measured by weight percentage, chromium produced the larger effect, affecting resistivity by about 10 % in excess of molybdenum's effect and, for the saturation moment, almost doubling that of molybdenum. For 3.7 % chromium content, the saturation moment compared to binary permalloy was reduced from 1.0 T to below 800 mT. Curie temperature went from 580 °C for binary permalloy to 450 °C for 3.7 % Mo permalloy and 230 °C for 10 % Mo permalloy to −20 °C for 15 % Mo permalloy.
The data of Farcas (1937), plotted by Bozorth (1951) (their Figs. 10 and 11), show a strong dilution effect of chromium upon cobalt. From a variety of data sources, Narod (2014) found that one molybdenum atom was able to cancel those effects from almost eight nickel atoms, or two iron atoms, which is a result broadly in agreement with the approaches of Enoch and Fudge (1966) and Enoch and Murrell (1969).
Considering atomic percentages as contrasted with weight percentages, the effects of chromium and molybdenum on saturation moment on a per atom basis are nearly identical. With respect to resistivity on a per atom basis, the effect of molybdenum is noticeably larger than that of chromium. Today, molybdenum dominates within the ternary permalloys. Chromium may also have fallen out of favour, in part due to its volatility at high temperatures in the presence of hydrogen, which is a trait we have observed directly.
1.2.5 The second interval (1953–1969)
In the 1960s, another look was taken at these alloys, with regard to better understanding magnetic anisotropies, and also specifically looking for improved magnetic materials for fluxgate magnetometer sensors (Bozorth, 1953; Puzei and Molotitov, 1958; Puzei, 1961, 1962; Odani, 1964; Lykens, 1966; Scanlon, 1966; Pfeifer, 1966; Odani and Sunazawa, 1967; Cohen, 1967; Scholefield et al., 1967; Snee, 1967; Gordon et al., 1968; English and Chin, 1969; Pfeifer and Boll, 1969). This activity covered the planet, from Nippon Telegraph and Telephone in Japan, Telcon Metals Ltd. in the United Kingdom, Vacuumschmelze in Germany, and the Central Research Institute of Ferrous Metallurgy in the former Soviet Union to the Bell Telephone Laboratories, Carpenter Steel Co., Allegheny Ludlum Steel Corp., Magnetics Inc., and the U.S. Naval Ordnance Laboratory in the USA.
With respect to fluxgate sensors, this led to the well-known Gordon et al. (1968) 6.0 % molybdenum permalloy, which is a slow-cooled material. The alloy, 14 % copper permalloy, was still in human memory at this time (Pfeifer and Boll, 1969), but it appears that the slow-cooled 28 % copper permalloy had been ignored or forgotten, including in the 1951 book Ferromagnetism (Bozorth, 1951).
The role of molybdenum was described in detail by Pfeifer (1966), after data from Puzei (1962) and Puzei and Molotilov (1958). His Fig. 5 presents contours of zero magnetostriction (λs=0, λ111=0, and λ100=0) and zero magnetocrystalline anisotropy (K1=0) for various cooling rates, including oil quenching and very slow cooling, and notes that the two coincided for rapid cooling at about 4 % Mo, and for very slow cooling at a little over 6 % Mo.
1.2.6 1969–present
For the purpose of producing improved fluxgate magnetometers in quantity, in 1969 the U.S. Naval Ordnance Laboratory commissioned an ingot of the 6.0 % Mo, 81.3 % Ni, and Fe balance alloy (6Mo81Ni) and had it rolled to 12.5 µm foil (Mario Acuña, personal communication, 1981). The ingot and foil were processed by the Hamilton Watch Company and their (then) metallurgical division, which was later spun-off as Hamilton Precision Metals (John Scarzello, personal communication, 2023). Eventually, this material went to Infinetics Inc, previously a producer of ring cores, where they created their S1000 6–81 ring core, which from 1979 to 1996 were provided to fluxgate magnetometer developers and ended production owing to a lack of alloy foil. In the 1990s, Müller et al. (1998) in Germany also investigated 6 % Mo permalloys but with significantly different results and lower yields (Hans-Ulrich Auster, personal communication, 12 June 2008), possibly due to significant constraints on their available heat treatments (Karl-Heinz Fornacon, personal communication, 2017). Ring cores were produced with noise levels “less than 2 pT/rtHz in the frequency band between 0.1 and 64 Hz” (Fornacon et al., 1999). The ring cores developed at that time were a cooperative effort of Karl Heinz Fornacon (Technische Universität Braunschweig), Manfred Müller (Zentralinstitut für Werkstoffforschung, Technische Universität Dresden), and Yuri V. Afanasiev (Russian Academy of Sciences, Moscow, and elsewhere). This work was also undertaken in part by Halbzeugwerk Auerhammer, now Auerhammer Metallwerk (Karl-Heinz Fornacon, personal communication, 2023).
The success of the Naval Ordnance Laboratory 6.0 % molybdenum permalloy as a fluxgate material (Gordon et al., 1968) effectively obviated the immediate need for seeking other novel materials. Then, as now, 4 %–5 % molybdenum permalloys are also used for fluxgate sensors. It was not until the introduction of amorphous alloys to fluxgates (Shirae, 1984; Narod et al., 1985) that any newer materials were added to the fluxgate sensor roster. These authors noted strong correlations between fluxgate noise with, respectively, Curie temperature and saturation moment, Bs. Musmann and Afanassiev (2010) have more recently pointed out that this relationship has become common knowledge.
More recent permalloy studies have looked at crystallographic influences on performance rather than chemistries; for example, Major and Martin (1970), Couderchon et al. (1989), Herzer (1990, 1993), and Müller et al. (1998). All authors have found that grain alignment or size have significant effects on magnetic properties. Anticipating this direction, Odani (1964; Odani and Sunazawa, 1967) was one of the earlier investigators who considered recrystallization, both primary and secondary, to have a role in determining magnetic material performance, which is in parallel with the effect of alloy compositions.
None of these relatively recent studies considered copper as being suitable content for permalloy. The alloy, 14 % Cu permalloy, was likely abandoned due to its lower resistivity, which would lower its usable bandwidth (Chaston, 1936). In total, 28 % Cu permalloy was never considered to be suitable for anything. The alloy, 6 % Mo permalloy, never entered the mainstream for magnetic materials due to its higher material cost, lower saturation moment, and awkward optimal heat treatment (slow cooled).
Puzei (1961) was the last investigator to look at soft ternary copper permalloys. Qader et al. (2017) have investigated sputtered thin film copper permalloys for cryogenic applications. While having higher iron content specimens, their resistivity and Curie temperature data agree well with our data. A copy of the only publication with extensive copper permalloy soft magnetic data (von Auwers and Neumann, 1935) proved very difficult to locate, its only citations being in Chaston (1936), Bozorth (1951) and Puzei (1961). To address this shortfall, we offer an English language translation of it in Appendices A and B.
Part of our acquired data were intended to fill in measured parameters presented in von Auwers and Neumann (1935). These include room temperature saturation magnetization, initial permeability, coercivity, and magnetostriction. Our additional measures include DC resistivity, and for four selected compositions, we acquired curves across a range of temperatures up to their Curie temperatures. We also used these same four compositions in fluxgate sensor builds. Here we describe in detail the production of our specimens.
2.1 Alloy manufacturing
For our investigations, we have planned to produce up to 70 individual Cu–Ni–Fe alloy specimens, with copper weight contents from 28 % to 50 %. Here we report our initial phase in which we have produced 52 and tested 50 alloys with copper contents from 28 % to 45 %. The alloys were produced as batches of 15 30 g circular ingots, melted at 1550 °C from high-purity powders, each in a covered ceramic crucible. Two ingots failed during cold rolling. The full procedure is described in Miles et al. (2022).
We then made three experimental specimens from each alloy, with one each for magnetostriction, DC resistivity, and explorations. After metal fabrication, all specimens received a common heat treatment featuring a 4 h soak at 1125 °C and a slow cool (35 °C h−1) from 600 °C to room temperature. Details regarding the heat treatment are also available in Miles et al. (2022). (For comparison, the 1935 Siemens study used 7 kg melts; von Auwers and Neumann, 1935).
2.2 Magnetostriction specimens
Magnetostriction specimens were the first to be produced from the alloys. We cold-rolled each ingot to a thickness of 1.00 mm and then cut a rectangular specimen 8.0 mm × 50.0 mm. Each specimen received a stamped four-digit numerical code to reflect its identity, a marking that would survive the heat treatment. We polished one surface of each specimen to better reveal the grain structure after heat treatment. Each specimen received a MgO-dipped coating for isolation during the heat treatment. After heat treatment, each specimen received a 12 mm × 3 mm strain gauge that was attached using cyanoacrylate adhesive. Magnetostriction measurements have now been left for a future investigation. (For comparison, the 1935 Siemens study used strips 0.35 mm thickness, 10 mm width, 100 mm length, and with less than half the cross section of our present specimens.)
2.3 Resistivity specimens
The resistivity and specimens both utilized permalloy strips of a nominal 0.100 mm × 3.20 mm cross section. The 2 g remnants from the 1 mm sheets were further cold-rolled to a thickness of 0.100 mm and then slit to 3.2 mm strips. We selected one such strip each for the resistivity and specimens.
We again polished part of the first strip surface, stamped a two-digit identity mark into the strip, and coated it with a MgO dip. Moreover, 80 mm was the minimum length used for the resistivity measurement. We measured strip thicknesses, widths, lengths, and masses prior to the heat treatments. Together, these data provide some redundancy, which we used for estimating errors. We estimate the dimensional and mass root mean square (rms) error for resistivity at 0.2 %. Curiously, von Auwers and Neumann (1935) did not include DC resistivity measurements, although it was well known in their time that copper alloy resistivities could be undesirably low (Smith and Garrett, 1925, 1926; Neumann, 1934).
2.4 specimens
For each specimen, we produced a bobbin machined from a Sch80 (20 mm) pipe (nominal outer diameter 26.67 mm), grooved to receive the permalloy strip, with a groove diameter of about 23.5 mm. The bobbin material chosen for a good thermal match was 70 % cupronickel (UNS C71500). Bobbins were stamped with two-digit identity codes to match those for the resistivity specimens. Again, dimensions and masses were measured for each bobbin assembly to reduce errors introduced by such inaccuracies, and again, we estimate such errors at 0.2 % rms. In all cases, mass measurements were rationalized with dimensional measurements, using alloy densities estimated by elemental mixing. We estimated magnetic path length from the mass and cross section area data.
After heat treatment each ring received 20 turn, colour-coded bifilar windings. Foil overlaps for spot welding likely produced the largest uncertainties, which we estimate created typical errors of about 1 % in all magnetic measurements. (For comparison, the 1935 Siemens study used punched circular rings in groups of 10, with 0.35 mm thickness, 45 mm inside diameter, and 60 mm outside diameter.)
2.5 Curie temperature specimens
Of the 50 alloys we tested, 14 were selected for possible magnetic property studies at elevated temperatures, up to their respective Curie temperatures. These rings received windings of AWG26 (400 µm) single-strand bare-copper insulated with colour-coded FBGS series braided-fibreglass sleeving (Omega Sensing Solutions, 2022). This insulation has a rating of 616 °C for short durations.
2.6 Vibrating sample magnetometer (VSM) specimens
A few alloys received further cold-rolling to 0.050 mm thickness. We have cut 3 mm discs from these and flattened them prior to heat treatment. Our plan is to subject these to a more careful examinations via VSM and X-ray diffraction examinations seeking recrystallization fabrics, such as those found by Major and Martin (1970).
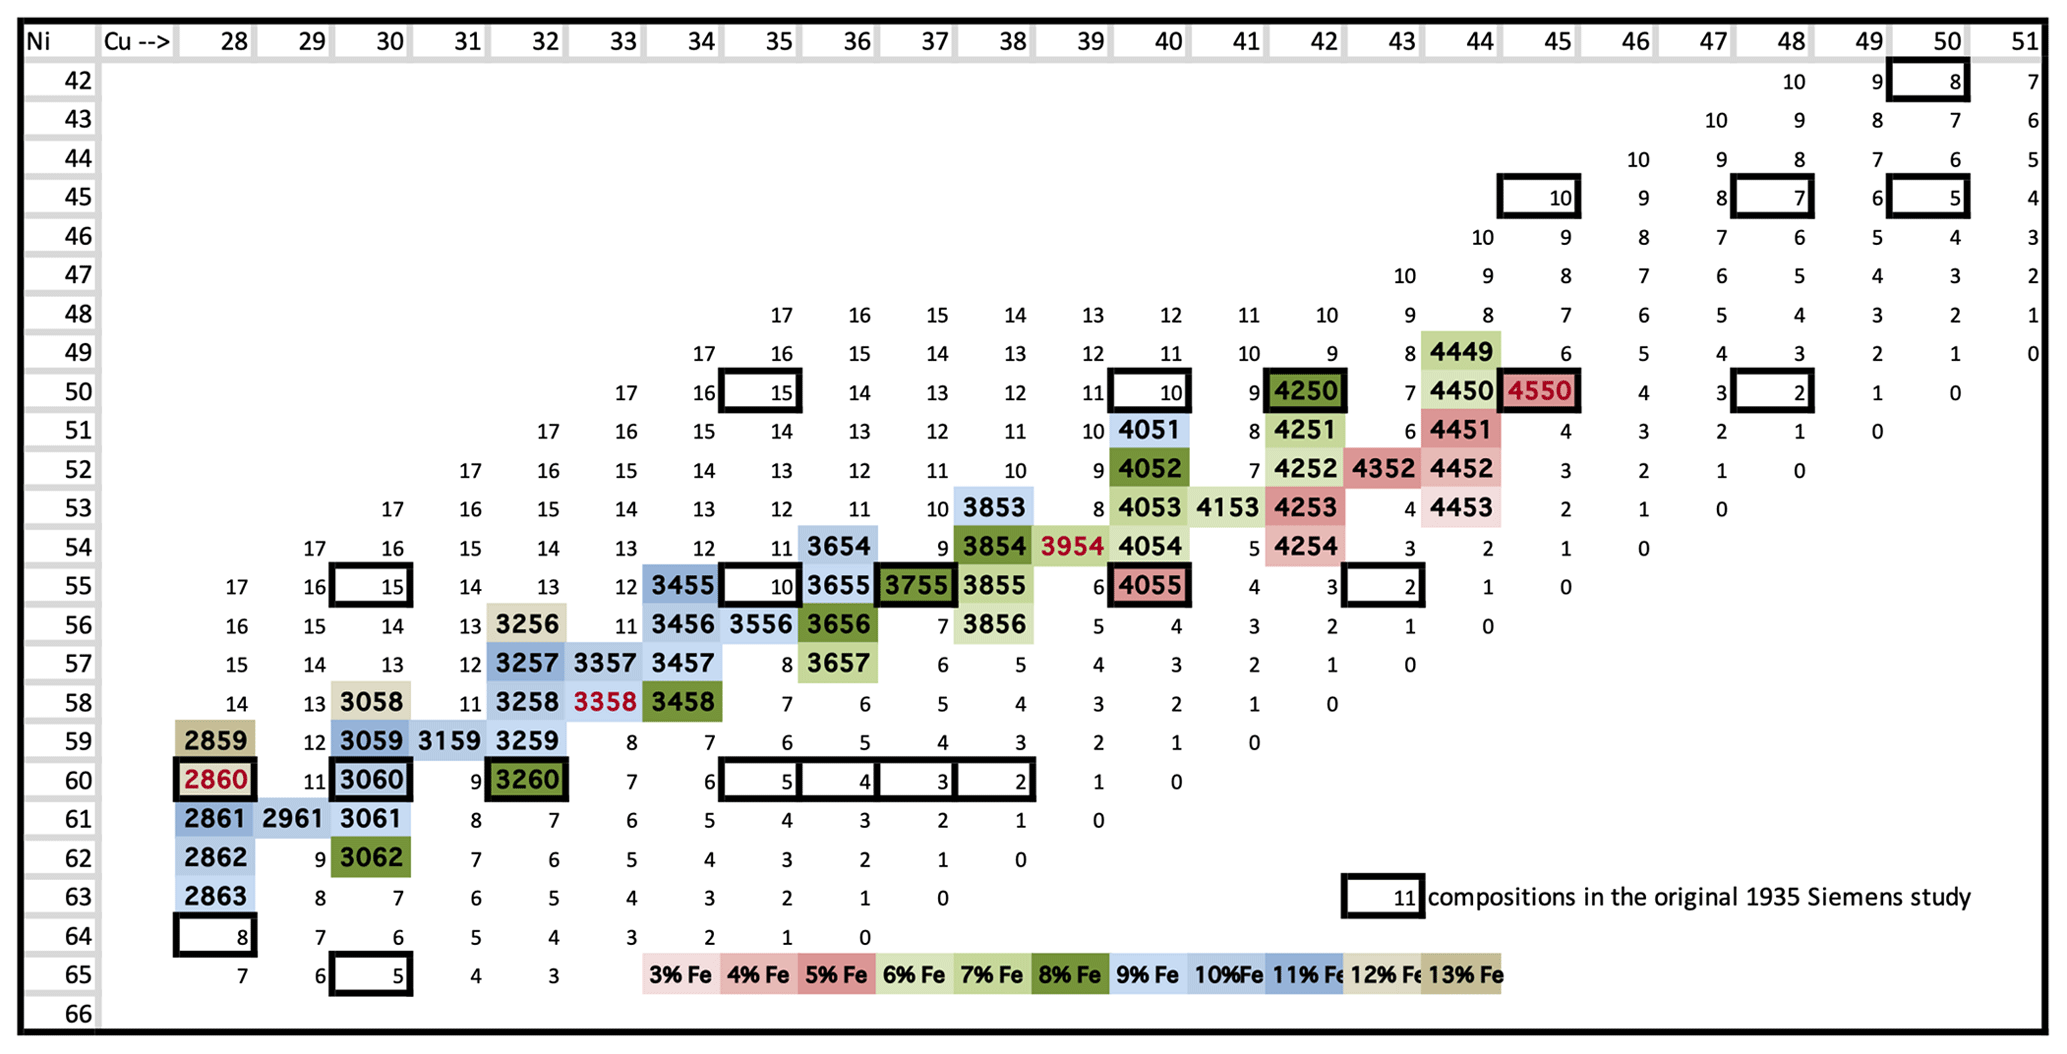
We collected resistivity and data for all specimens. We summarize all our test data on composition-based grids, laid out as shown in Fig. 2.
Here copper content is plotted in 1 % increments, increasing to the right. Nickel content is also plotted in 1 % increments, increasing down. Our physical specimens' cells are all marked in colour. Each cell composition then has a four-digit code indicating the alloy content, with the first two digits stating copper content, and the last two digits indicating nickel content. Iron content is the remainder, indicated in the unused cells in Fig. 2. Here, the colour code indicates iron content with low-iron content in red shades (located to the right) and high-iron content in blue shades (located to the left). Cells with black outlines are compositions included in the von Auwers and Neumann (1935) study.
Four cells are presented with red lettered codes: 2860, 3358, 3954, and 4550 are our specimens which are also used in Curie temperature tests and in fluxgate sensor builds.
3.1 Resistivity
To measure resistivity, each strip specimen was driven with a 2.00 A DC current, and pin probes with either 80 or 100 mm separation completed a four-contact resistance measurement. Resistivity data are presented in Fig. 3. Highest values occur for the highest copper contents, where nickel contents are similar. This is a well-known effect associated with such alloy mixing. Higher resistivities are also associated with higher nickel contents for similar copper contents. Both effects are to our advantage and will be discussed further.
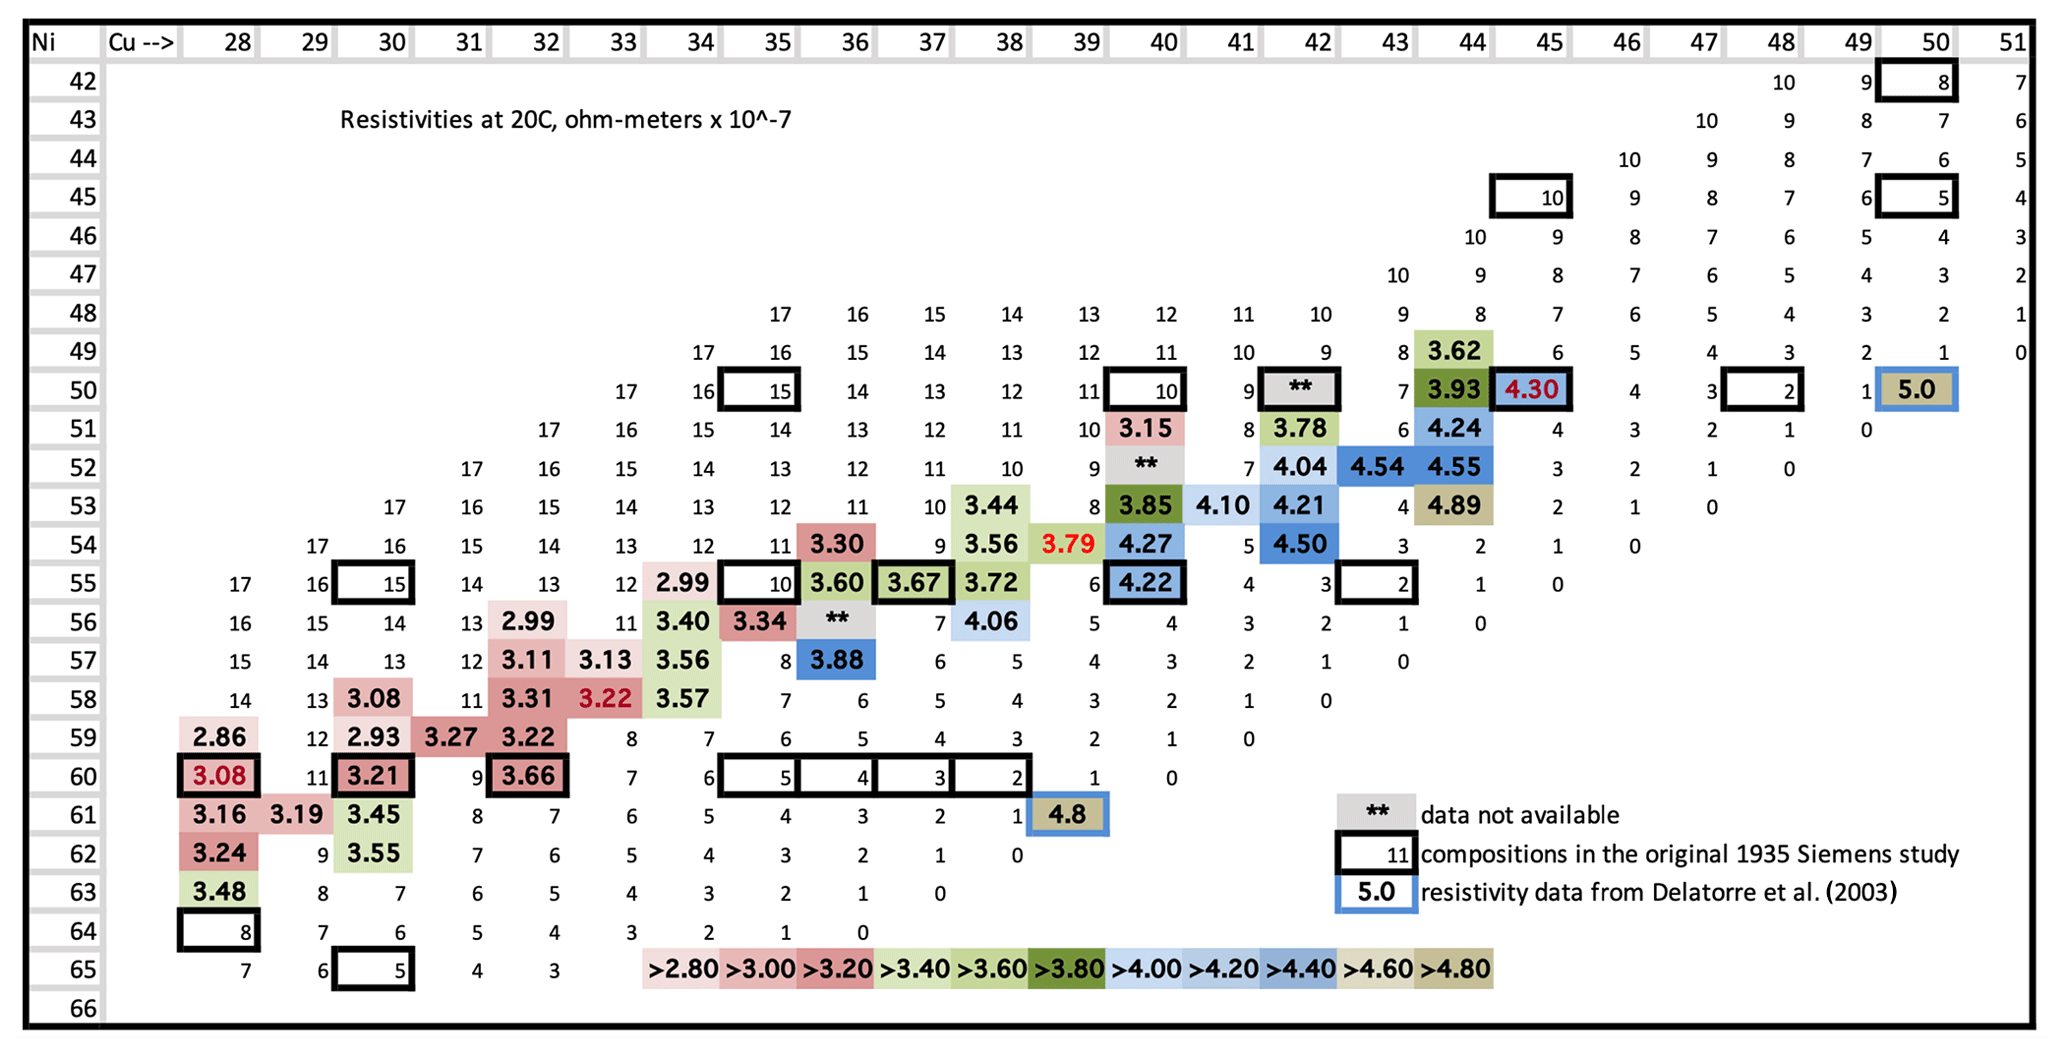
Figure 3Resistivity data (in units of ohm metres × 10−7). Colour coding indicates lowest resistivities in red shades (to the left) and highest resistivities in blue shades (to the right). Resistivity data from Delatorre et al. (2003) is shown using light blue cell borders.
3.2 Saturation induction
Saturation induction values range from 600 mT for a 28Cu60Ni specimen down to below 200 mT for the highest copper content specimens. Our values are consistent with those presented in von Auwers and Neumann (1935). Subject to error limits, saturation induction consistently decreases with either increasing Ni or increasing Cu content. One high-copper-content, high-nickel-content specimen, namely 4453, is paramagnetic at room temperature. Data are presented in Fig. 4.
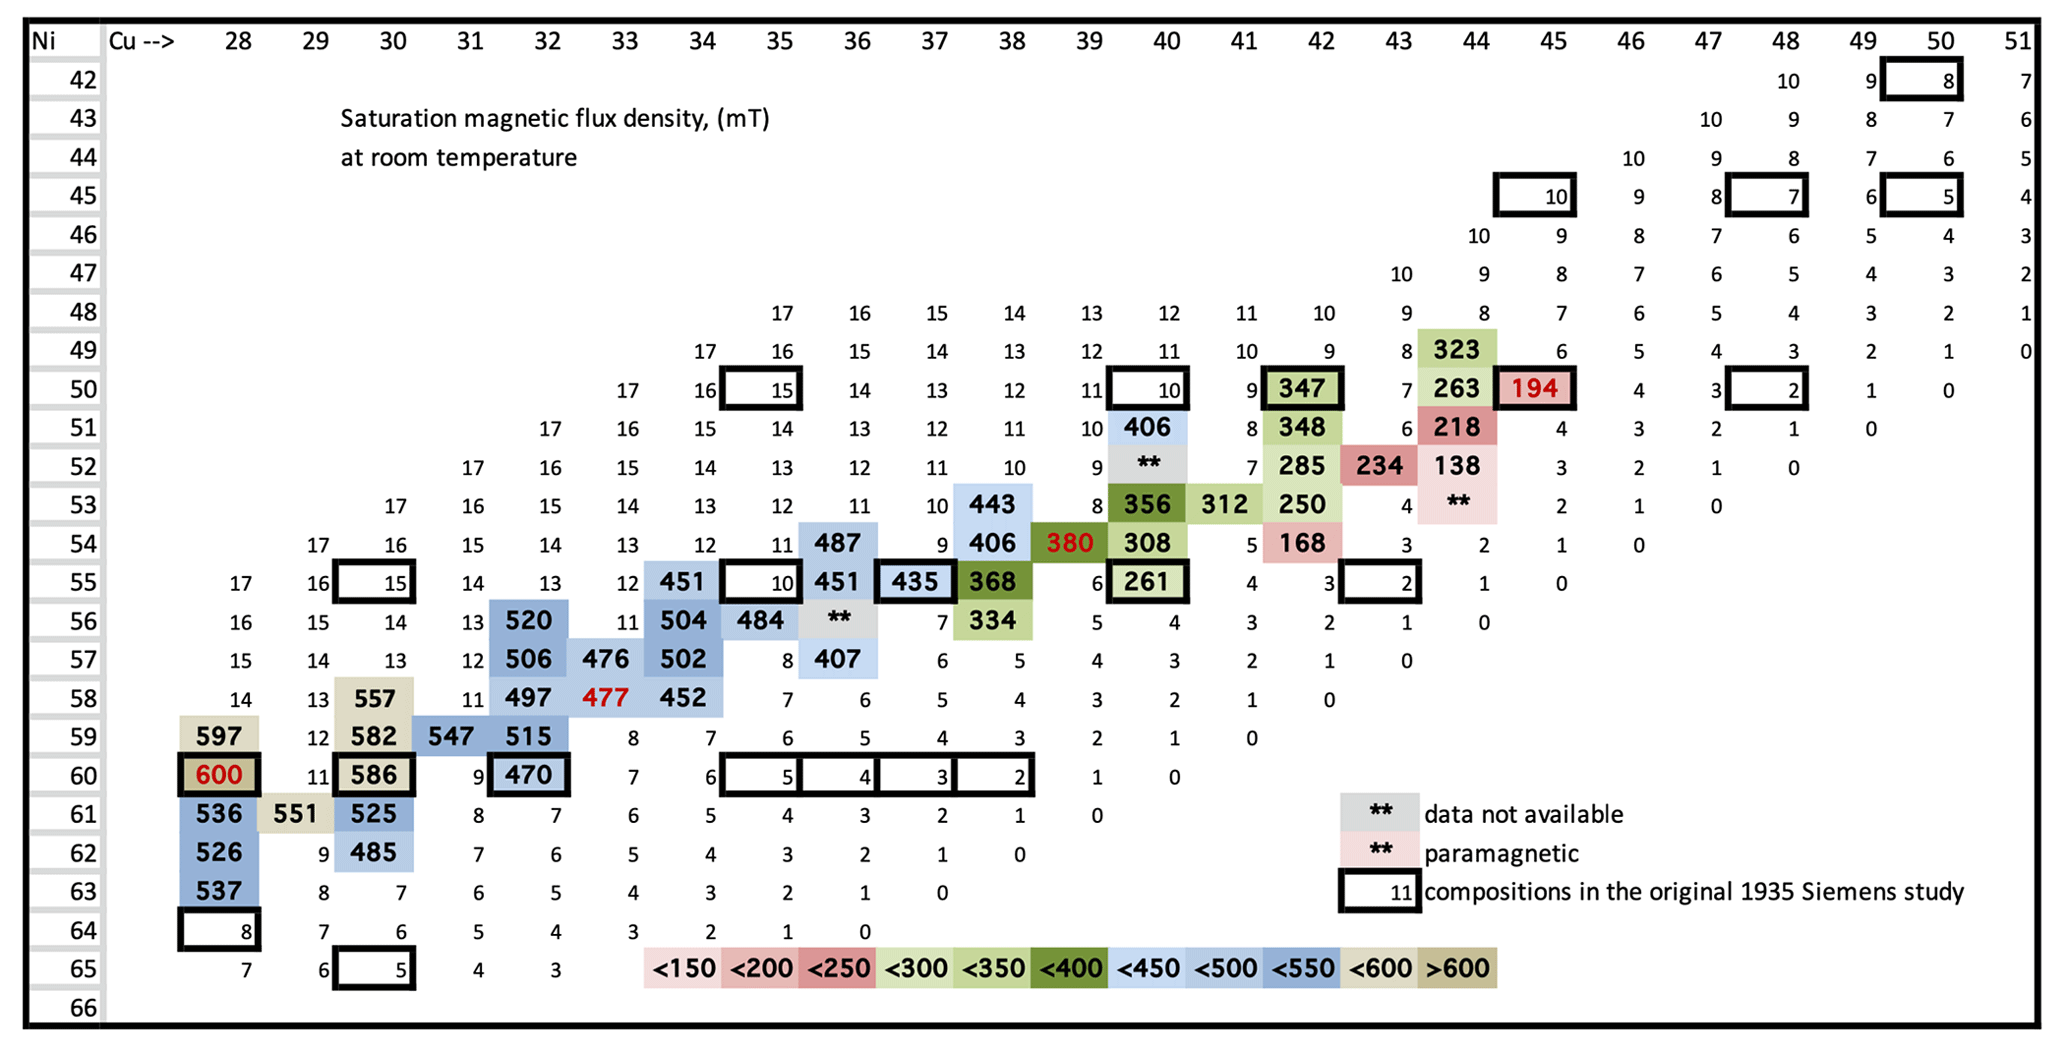
Figure 4Saturation induction, Bs (in mT). Highest values are presented in blue shades (to the left) and lowest values in red shades (to the right).
Test conditions for saturation inductions were magnetic field amplitude ±1000 A m−1, with triangle field waveform at 24 Hz. These fields were generated using a generic signal generator, one of the 20 turn windings and an Accel Instruments TS250-0 waveform amplifier. Data were acquired from the second 20 turn winding, using an operational amplifier integrator and a 12 bit PicoScope as our digitizer.
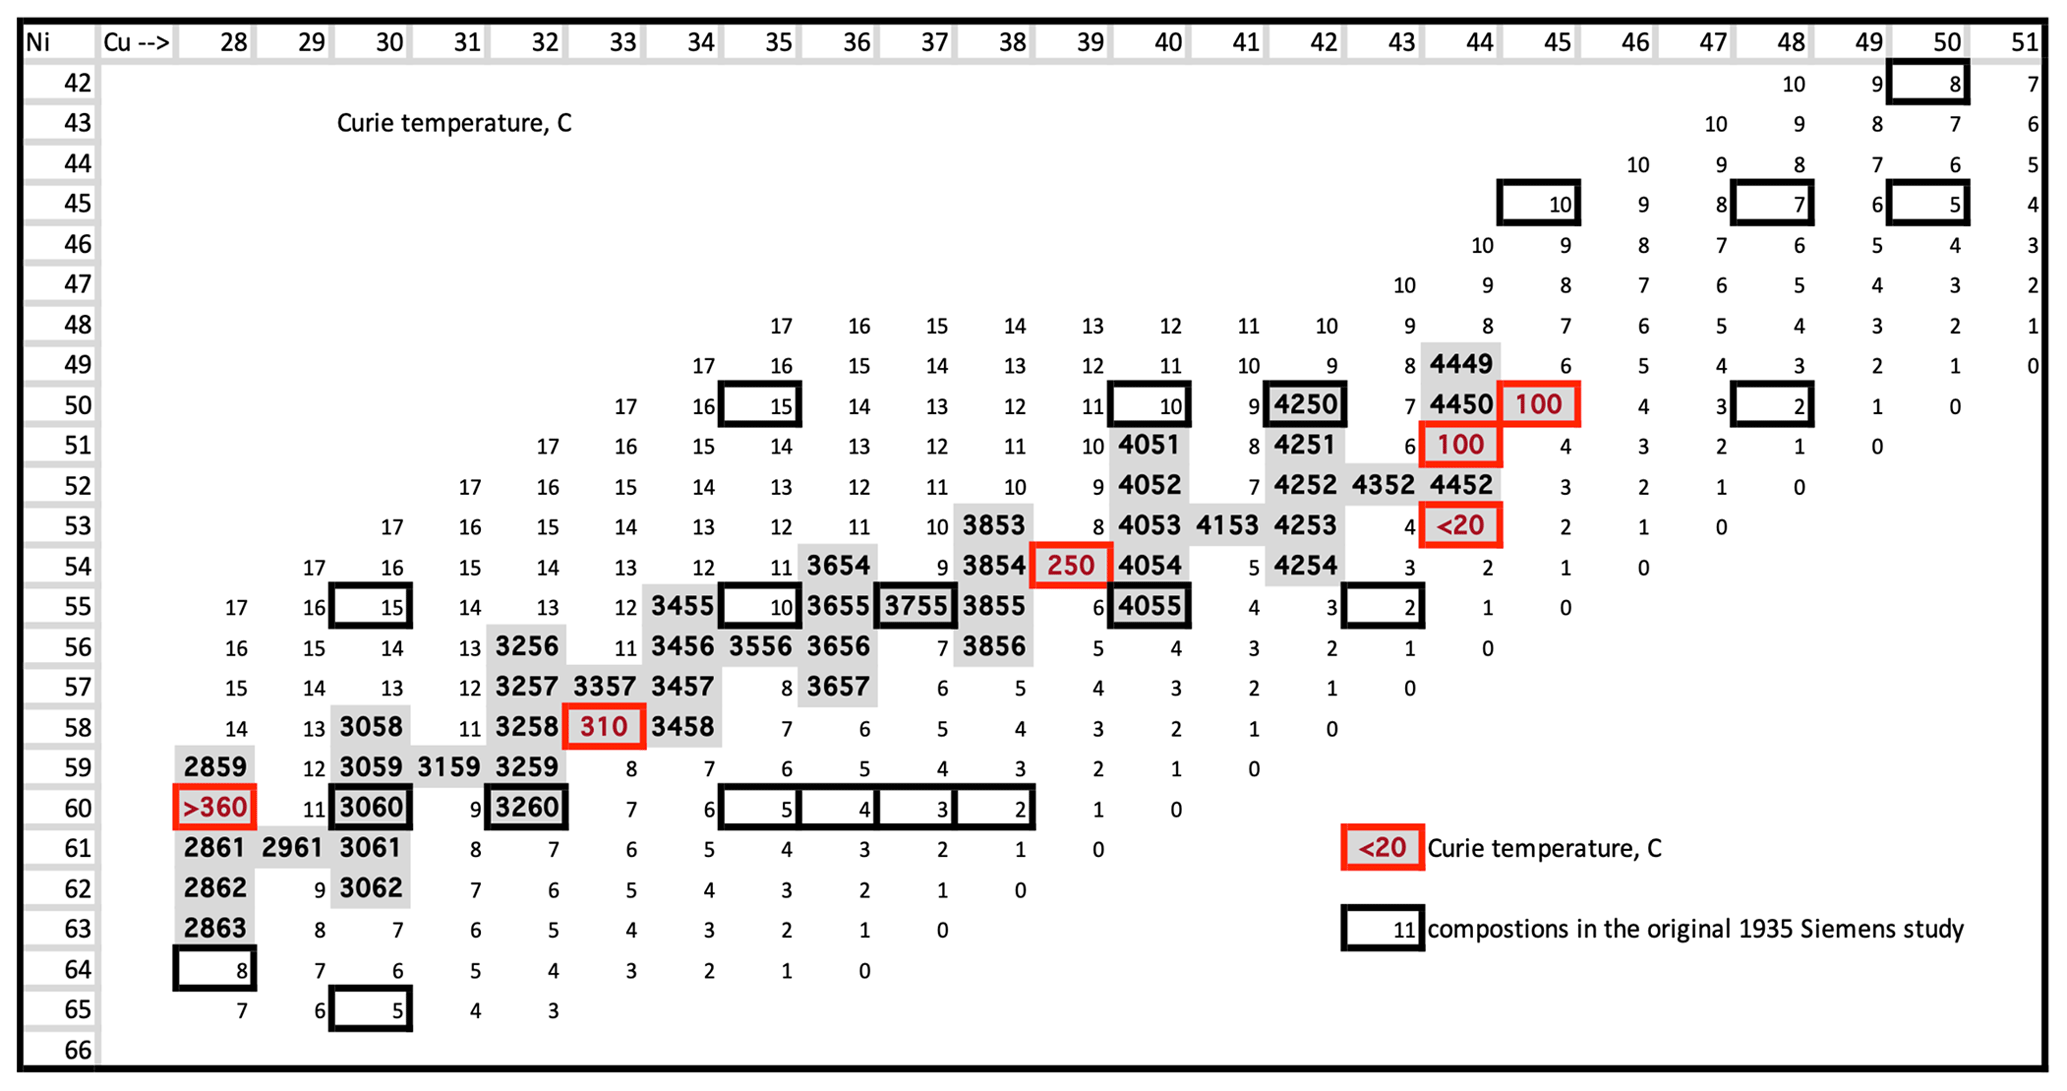
Figure 5Curie temperatures. We have six specimens with Curie temperature estimates. These specimens are indicated as red-outlined cells, with Curie temperature Celsius estimates marked with red lettering therein.
3.3 Curie temperatures
We estimated Curie temperatures (Tc) for our selected specimens by raising their temperature and estimating when saturation induction went to zero. All specimens were contained within an airtight quartz glass cylinder with suitable electrical feedthroughs. We heated the specimens under argon gas up to 360 °C, so as not to risk affecting their magnetic properties. Data are presented in Fig. 5.
As expected, alloy 28Cu60Ni had the highest Tc, over 360 °C, which is somewhat higher than that we measured for molybdenum permalloy at 6–81 (360 °C). Alloys 45Cu50Ni and 44Cu51Ni both measured at about 100 °C, making them potentially useful in magnetometers. Alloy 44Cu53Ni being paramagnetic received a Tc estimate of <20 °C.
3.4 Initial permeability (relative)
Test conditions for initial permeabilities were magnetic field amplitude ±0.4 A m−1, with triangle waveform at 240 Hz. Our results are presented in Fig. 6.
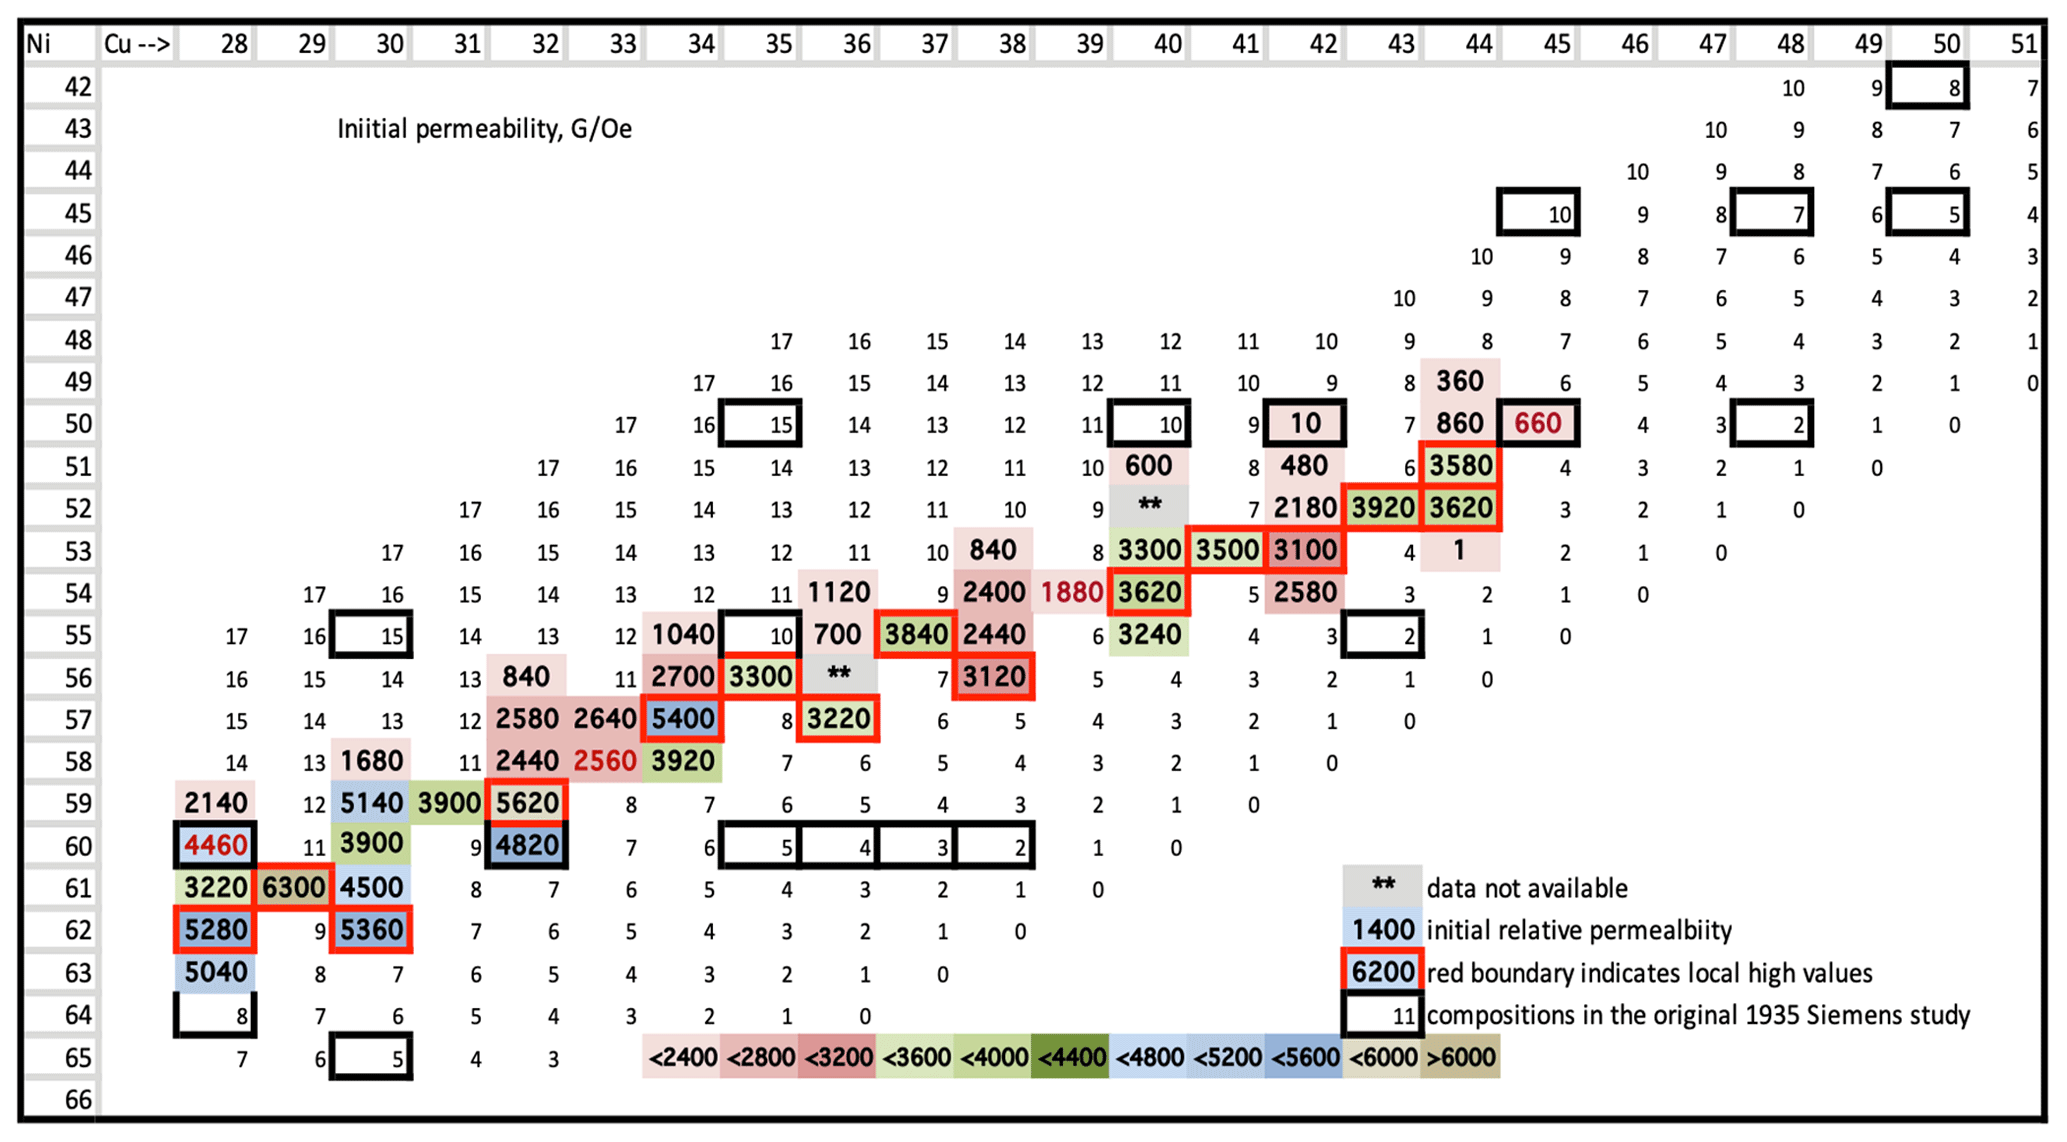
Figure 6Initial permeabilities. Highest permeabilities are colour-coded as blues and browns. In total, 15 cells have been outlined in red, with which we are indicating local high values for initial permeabilities.
In Fig. 6 we have selected 15 cells to highlight with red outlines. These are local high values and decrease to the right. This overall decline in permeability values with increasing copper content is slight and not as high as for saturation induction. For fluxgate magnetometers, this effect should be beneficial. With increasing copper content, while saturation induction is declining (beneficial), the other predicted key magnetic property, anisotropy, as reflected in permeability, is not degrading rapidly if at all. In the next section on coercivity, the same 15 red outlines are repeated in Fig. 7.
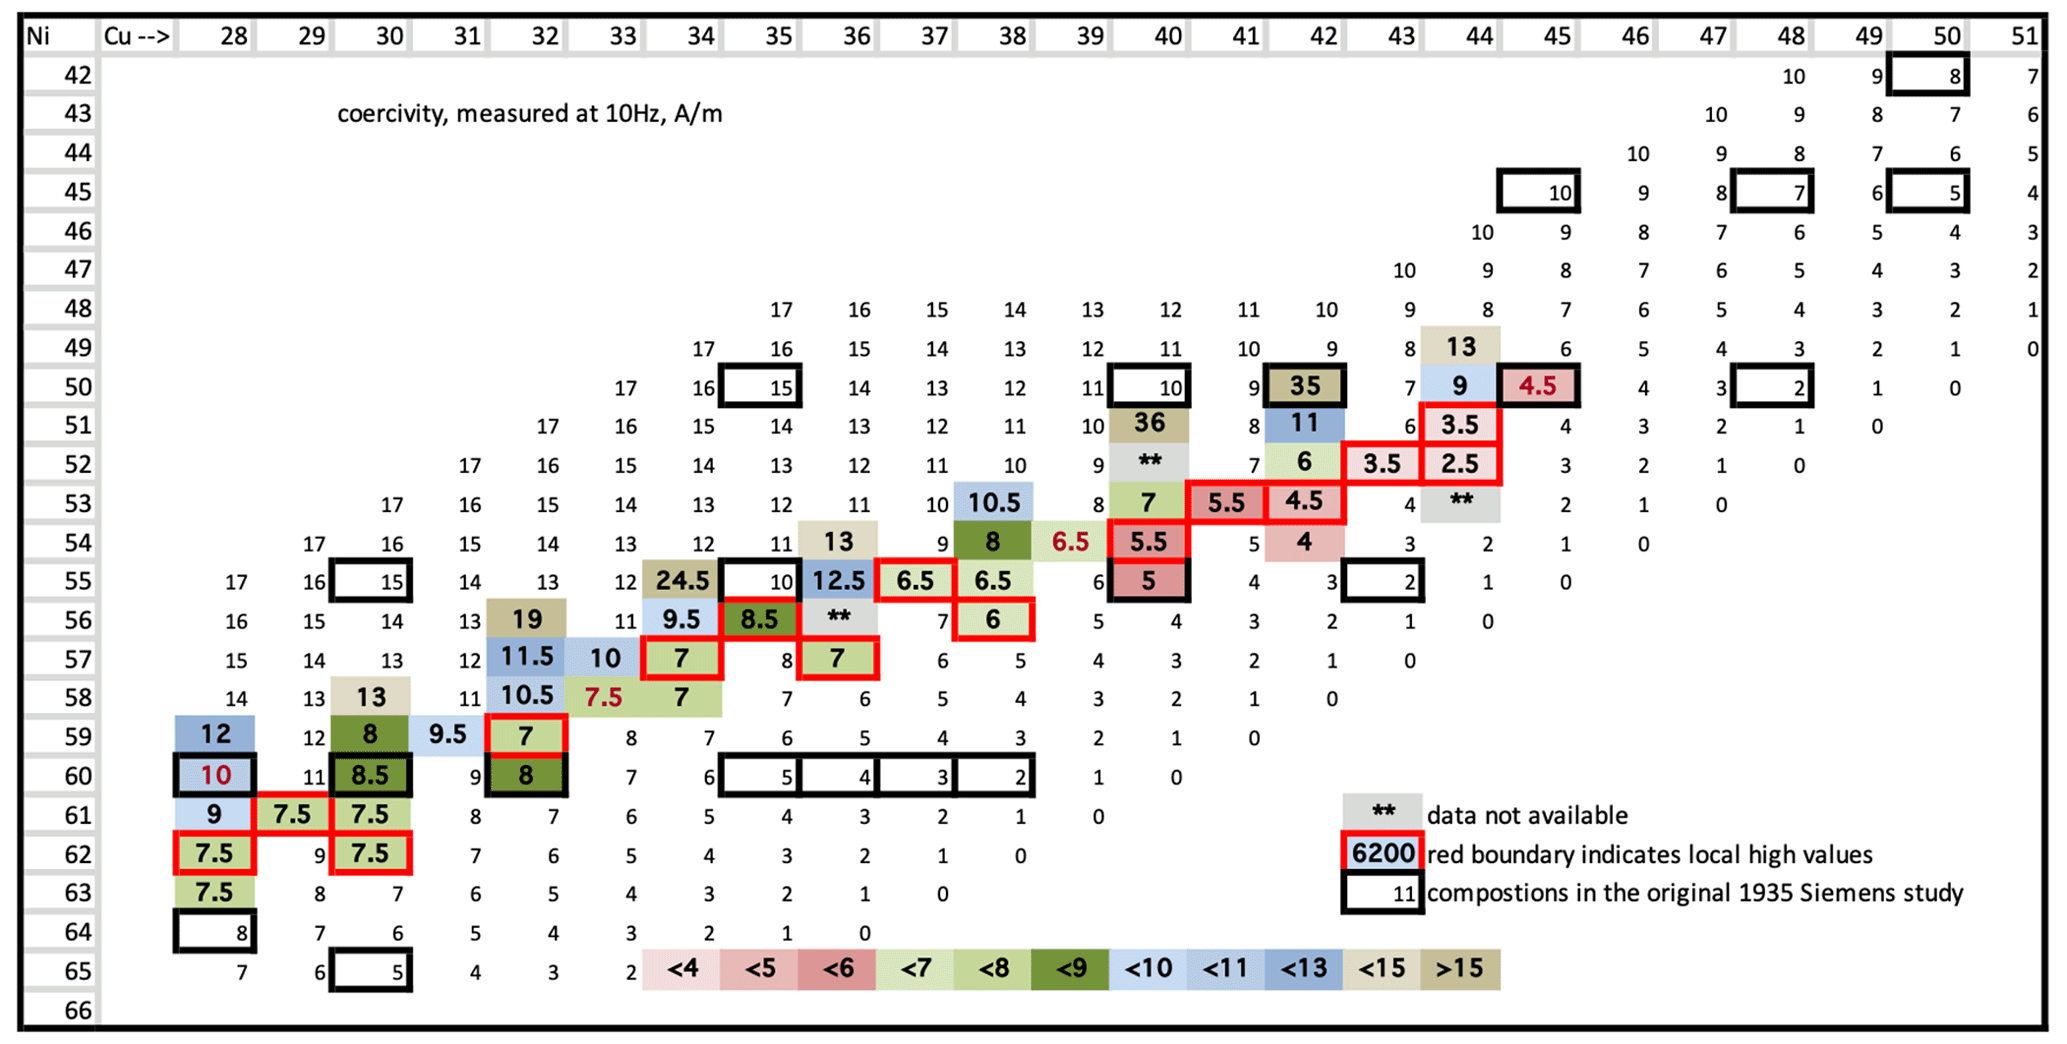
Figure 7Low-frequency coercivities. Highest coercivities are colour-coded as blues and browns. In total, 15 cells have been outlined in red, with which we are indicating local low values for coercivity (values are in units of A m−1).
3.5 Coercivity
The test conditions for coercivity were magnetic field amplitude ±50 A m−1, with triangle waveform at 10 Hz. We increased the sensing windings to 84 turns. Our results are presented in Fig. 7. For the 15 marked cells, coercivity ranges from a high of 7.5 A m−1 for the lowest-copper-content specimens, down to 2.5 A m−1 for the highest copper contents. These values are comparable to those of amorphous alloys favoured by fluxgate developers, e.g., VITROVAC 6025 (Sekels, 2019).
The 15 locally low-value coercivities correspond almost perfectly to the locally high permeability values in Fig. 6. We believe these two measurements are exploring the same phenomenon – magnetic anisotropy's influence on the domain wall motion. For permeability, the measurements examine the reversible domain wall motion. For coercivity, the measurements examine the endpoint of reversible domain wall motion and the entry into irreversible domain wall motion. In both cases, permeability and coercivity, higher-domain wall mobility improves our measurement results.
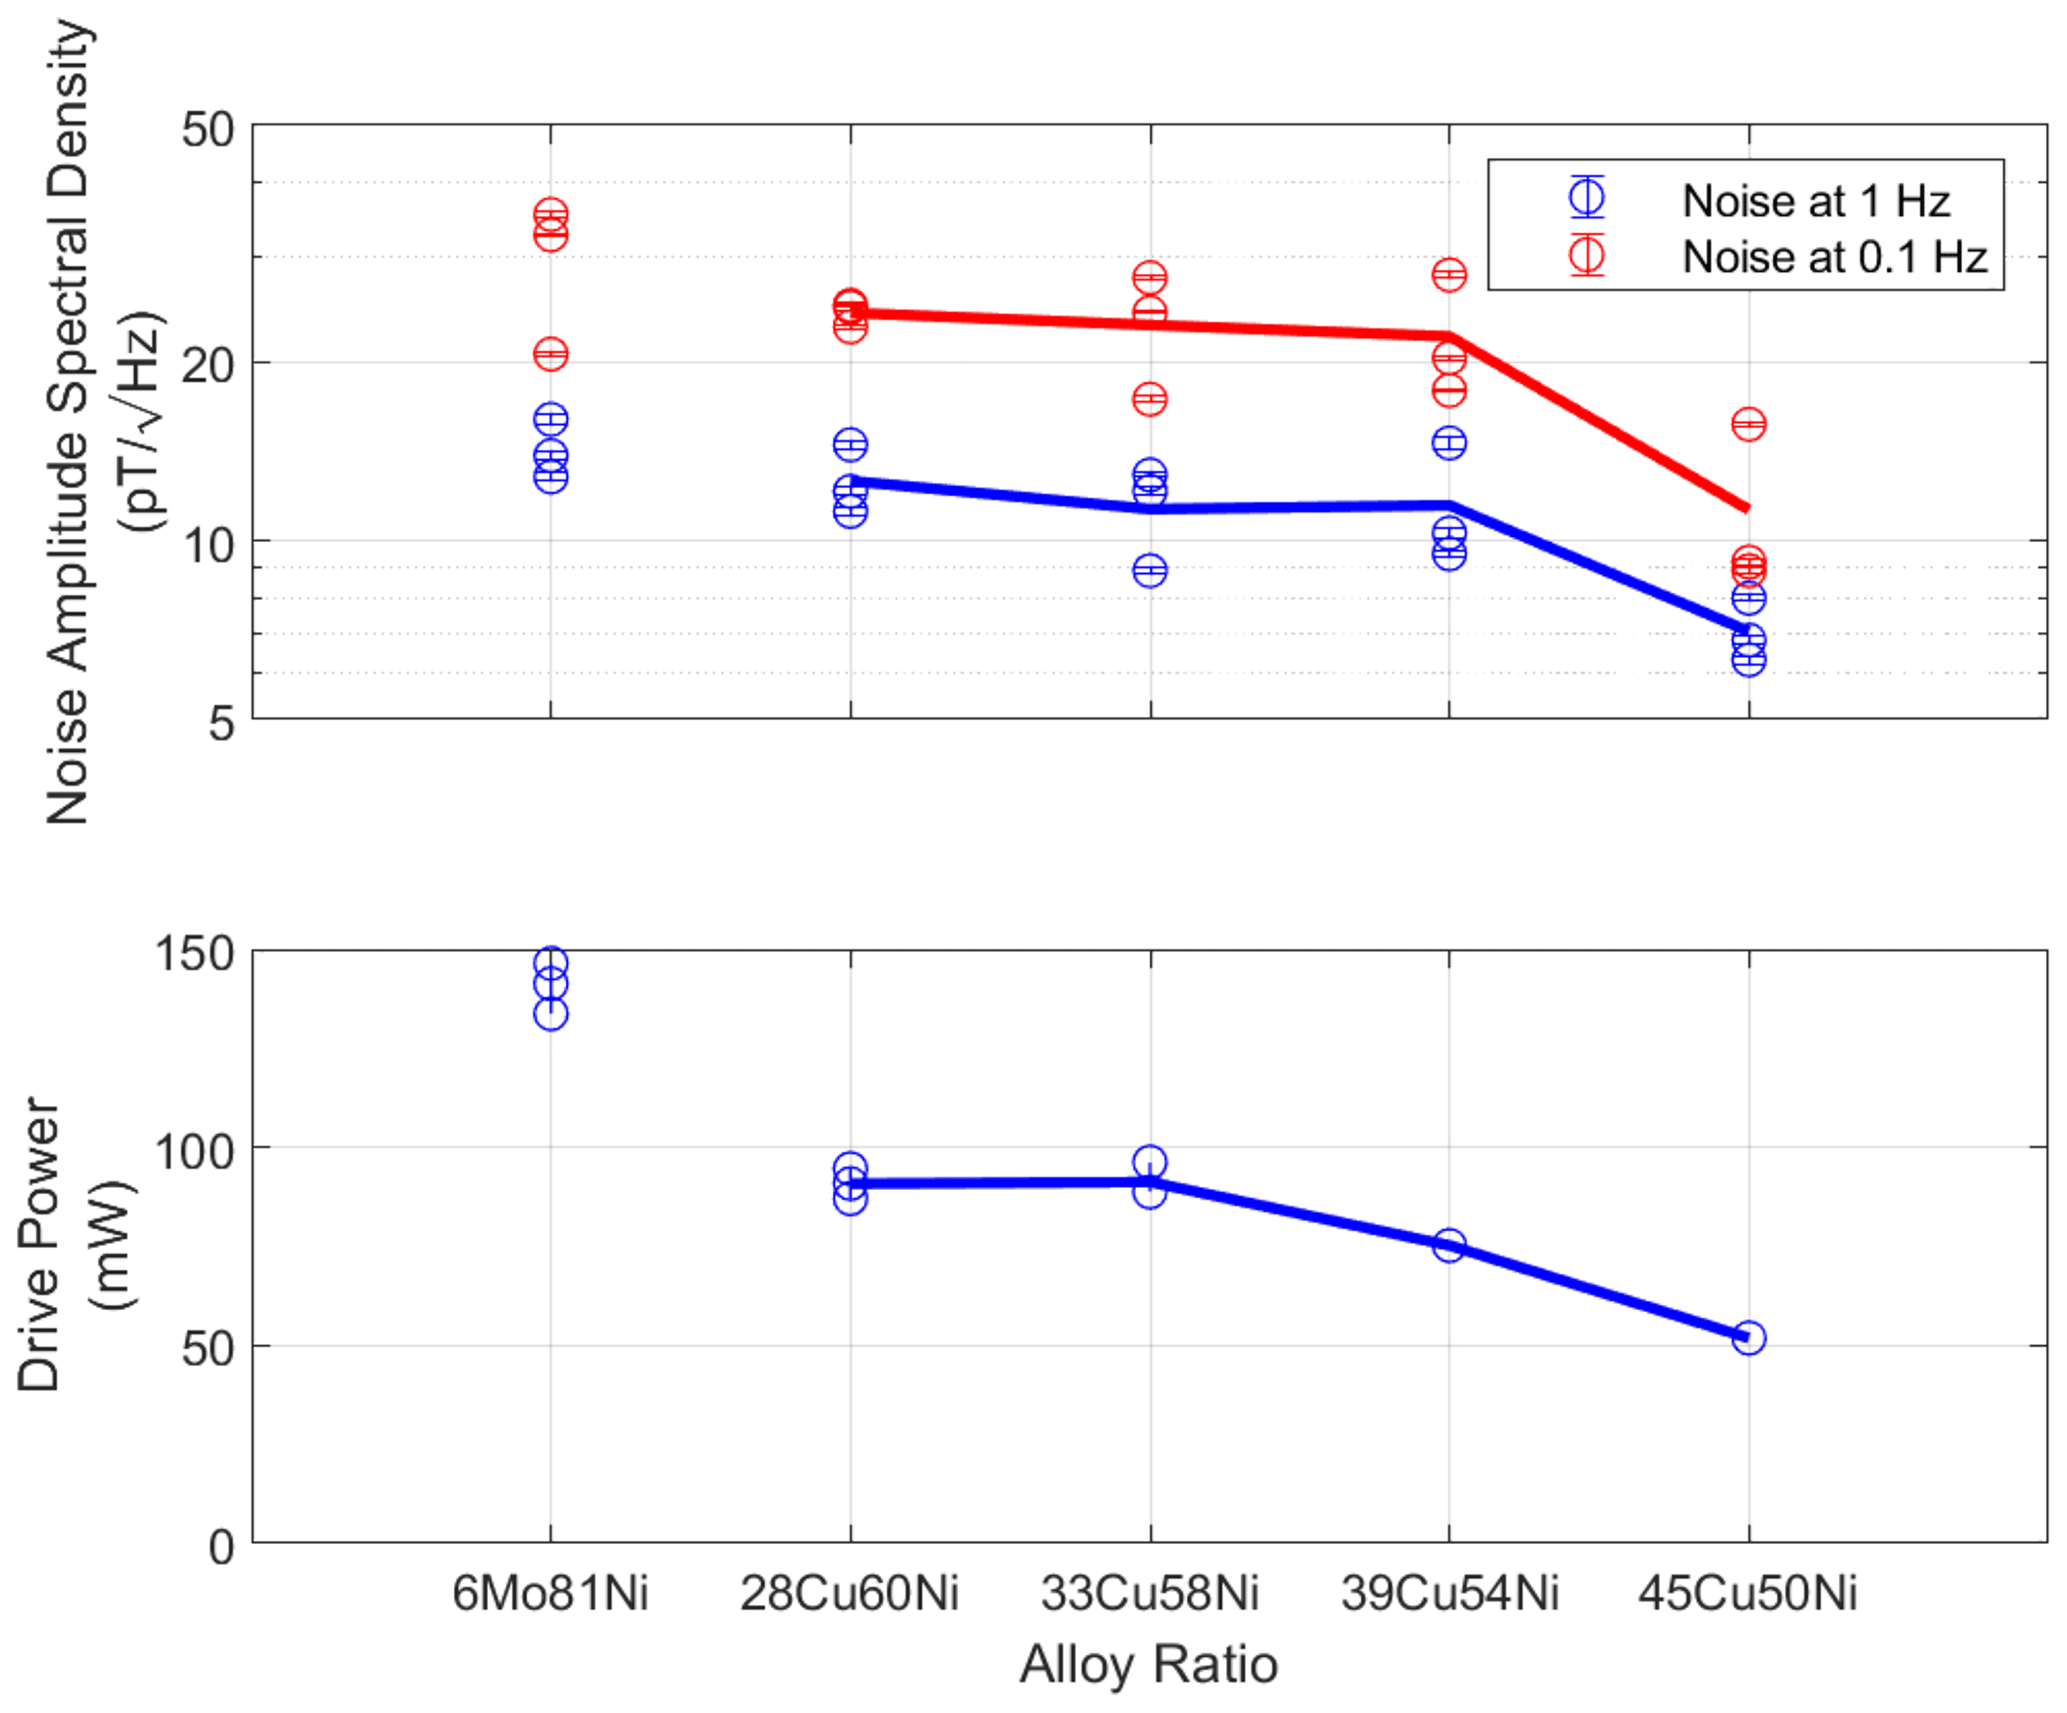
Figure 8Fluxgate noise power spectral densities (PSD) and power consumption for five alloys.
3.6 Fluxgate tests
Alloys 28Cu60Ni, 33Cu58Ni, 39Cu54Ni, and 45Cu50Ni were fabricated into racetrack fluxgate sensors of the same design as in Miles et al. (2022), with three sensor cores per alloy. We included sensors incorporating alloy, 6.0 % Mo and 81.3 % Ni (6Mo81Ni), for comparison. Each sensor core included three 50 µm racetrack foils.
Our fluxgate testing results for five alloys are presented in Fig. 8. For each of the 15 sensors, we have noise power spectral densities (PSD) at both 1.0 and 0.10 Hz and core drive power consumption. In all cases, power consumption for a copper alloy sensor from these cores is lower than power consumption for any 6–81 sensor of our own build. Generally, copper alloy sensors have lower noise PSD at both frequencies, and this is significantly so for 45Cu50Ni sensors, which have 1.0 Hz noise PSD values within the range 6–8 pT.
We further examined the performance of alloy 45Cu50Ni by producing 25 six-layer racetrack core sensors. Noise PSD results for these sensors are presented in Fig. 9.
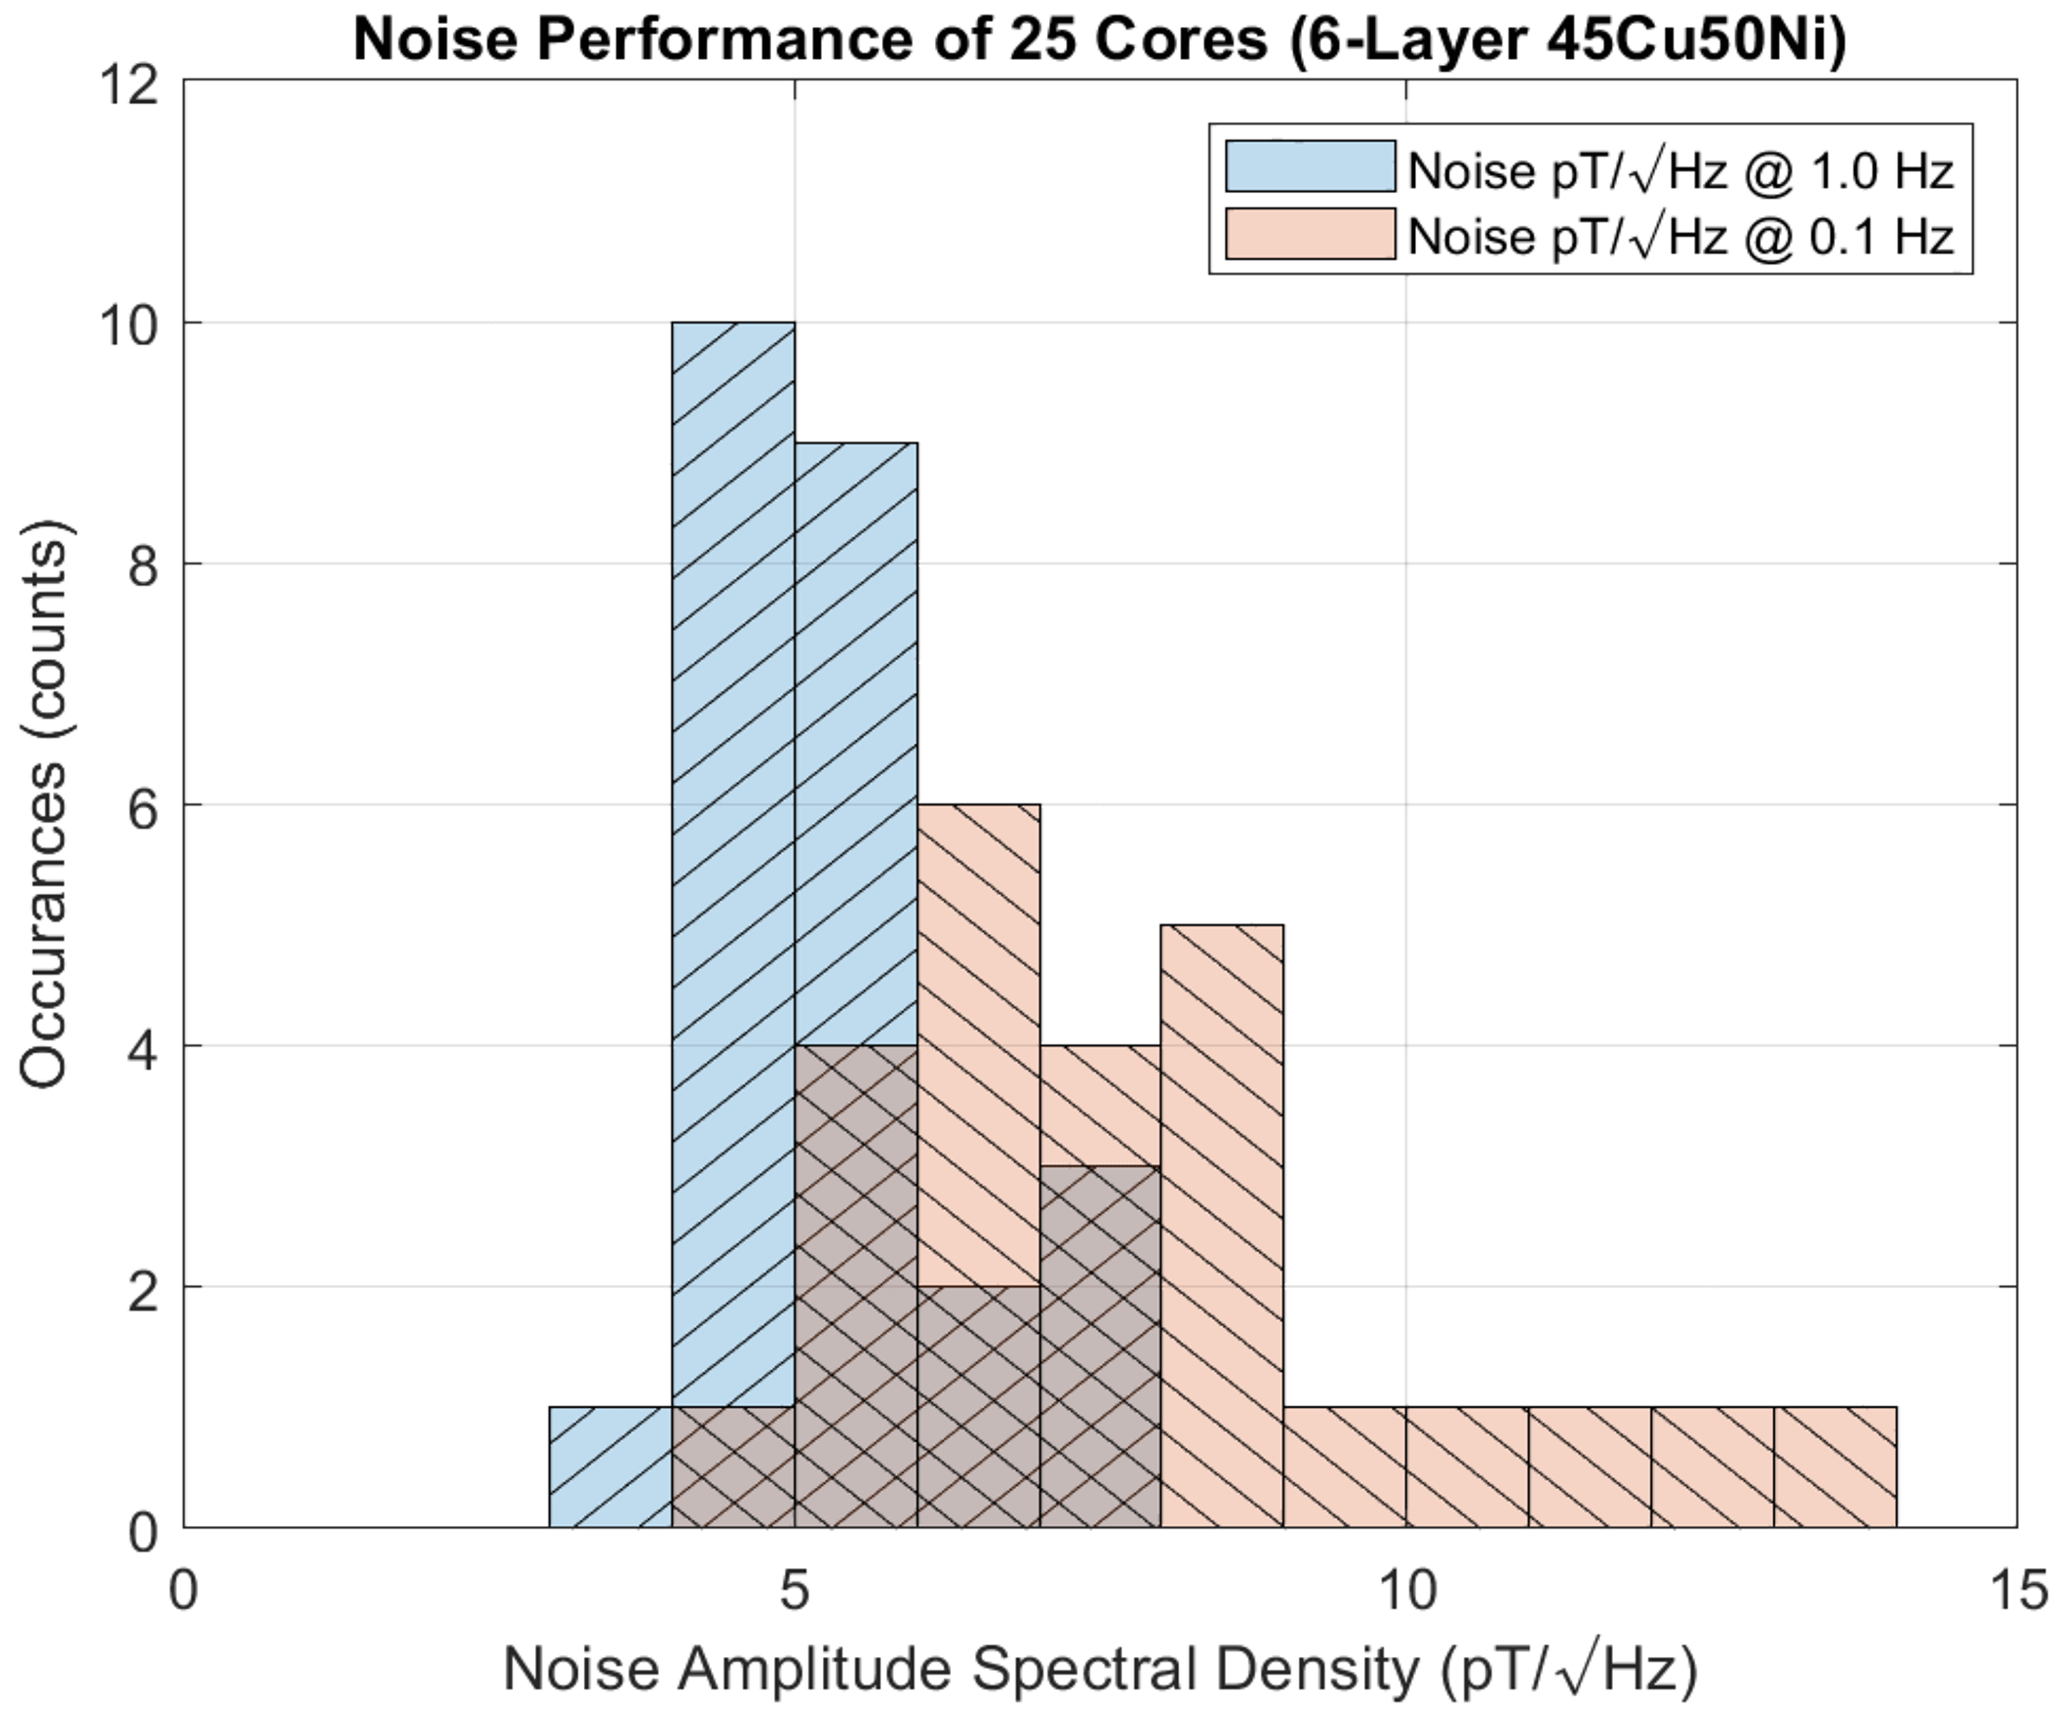
Figure 9The 1.0 and 0.10 Hz noise PSD probability density plot for 25 six-layer 45Cu50Ni racetrack sensor cores. Cross-hatched columns indicate sensor cores for both test frequencies.
Here we found 1.0 Hz noise PSDs in the range 3–8 pT and most likely in the range 4–5 pT. The 0.10 Hz noise PSDs are in the range 4–14 pT, peaking at 6–7 pT. Of the 25 cores, 21 have 0.10 Hz noise PSD below 10 pT, and that is the noise target for INTERMAGNET magnetic observatory variometers (Turbitt, 2014). These cores are intended for use in pairs in our TESSERACT sensors (Greene et al., 2022). No Infinetics S1000 ring core ever achieved these noise PSDs.
The concept for our investigation has been to fill in magnetic property data within the range of copper permalloys presented in Fig. 1 and to test fluxgate magnetometer performance for a small selection of compositions within that range.
Regarding the magnetic property data, we have replicated the results of von Auwers and Neumann (1935) and improved chemical content resolution. We discuss here our results in the order in which we have presented our data.
4.1 Resistivity
Resistivity has been investigated for binary copper–nickel alloys but has to our knowledge not been previously investigated for ternary iron–nickel–copper alloys. For copper–nickel, resistivity peaks at about 45 % Cu (Copper Development Association Inc., 2023). Our data broadly replicate those early results. From 28 % Cu to 45 % Cu, resistivity increases by about 2 % for every 1 % increase in copper. In addition, we see a roughly 8 % increase in resistivity for every 1 % increase in the nickel content. For our lowest noise-tested alloy, 45Cu50Ni, we measured resistivity Ωm of similar magnitude to Mo permalloys. From our measurements, we have concluded that resistivities for our alloys of interest are not a limitation.
4.2 Saturation induction
Our data closely replicate the results in von Auwers and Neumann (1935). Because saturation induction varies only slowly with alloy composition, our results have only filled in predictable details.
4.3 Curie temperatures (Tc)
Prior to going into our 50 alloy study, we knew that 28Cu60Ni would be a usable alloy for magnetic sensors. Von Auwers and Neumann (1935) had viable saturation data with as high as 50 % copper, but in order to determine what could be a usable range of alloys, we selected three additional alloys for Tc measurements. Alloy 45Cu50Ni has a 100 °C Tc and has been tested as a viable magnetometer sensor material. The other two, 33Cu58Ni and 39Cu54Ni, have Tc values, respectively, of 310 and 250 °C, while our 28 % copper alloy, 28Cu60Ni, has a Tc exceeding 360 °C. From the perspective of Curie temperature, almost our entire range under test is usable as magnetometer sensor material. Alloy 44Cu53Ni is paramagnetic and thus out of range.
4.4 Initial permeability and coercivity
Our results for these measurements are also consistent with the von Auwers and Neumann (1935) figures. Our choice of 1 % composition increments has enabled a closer look at the location of the ridge of highest permeability/lowest coercivity as noted by those authors. For 28 % Cu compositions 62 % Ni gives our highest permeability which could not have been resolved by the earlier data. For 33 % Cu and 39 % Cu alloys, their nickel contents may need to be slightly higher to achieve maximum permeability and hopefully lower magnetometer noise. Alloy 45Cu50Ni appears to be on target for maximum permeability/minimum coercivity for that copper content. However, by moving only 2 % in content to 43Cu52Ni values for both measures significantly improve, permeability increased a factor of 6 and coercivity declined a factor of 0.75. There may be a material optimum near that content.
Of particular interest is the very large changes in properties with only single-percent changes in the contents. Looking at the sequence 42Cu50Ni, 42Cu51Ni, 42Cu52Ni, 43Cu52Ni, 44Cu52Ni, and 44Cu53Ni, we note that 42Cu50Ni is a permanent magnet. Three alloys later, 43Cu52Ni is near a high permeability optimum, and two alloys after that, 44Cu53Ni is paramagnetic. Von Auwers and Neumann (1935) were aware of a permanent magnetization regime at higher iron contents within these ternary alloys but did not have a good location for it.
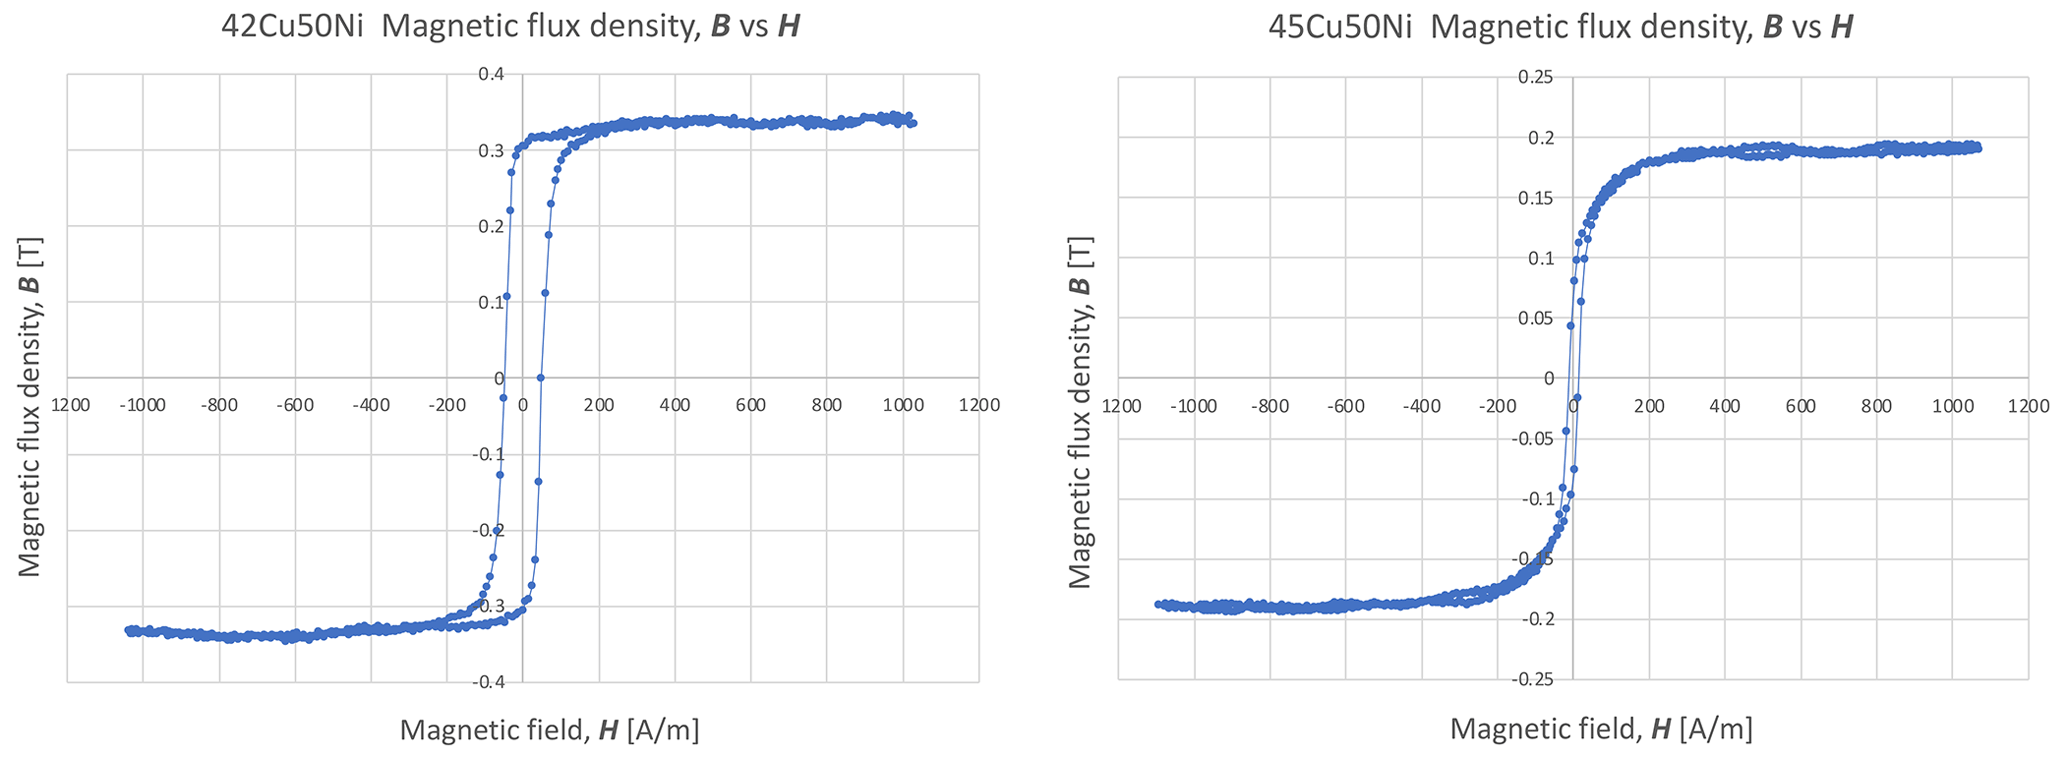
Figure 10 shows two plots for 42Cu50Ni and 45Cu50Ni, which are only 3 % apart. The first plot shows the squareness and large coercivity of a permanent magnet. The second shows the rounded, low-loss form of our lowest noise magnetometer material so far.
4.5 Fluxgate tests
We expected that, as we increased copper content, both power consumption and noise PSD would be reduced – the former from the lower-field strength needed for saturation and the latter due to the well-known relation between saturation and noise PSD. These relations were both confirmed. What we did not know in advance was how hypothetical poorer magnetic anisotropy levels might impact the measured magnetic properties and noise levels. Narod (2014) predicted that such impacts should vary only slowly with anisotropy, and our data confirm that. By far the biggest impact magnetic properties have on sensor noise performance is that of saturation induction.
Our investigation of the 28 %–45 % copper permalloy regime's magnetic properties has led us to alloys which have yielded fluxgate sensors with noise PSD and power consumption improvements over those of the legacy 6Mo81.3Ni permalloy composition. Racetrack sensors of our lowest noise and power alloy, 45Cu50Ni, have noise PSD levels well below 10 pT at both 1.0 and 0.10 Hz, easily satisfying the 1 s INTERMAGNET requirement (Turbitt, 2014).
We have now begun to refine our investigation, seeking additional improvements in noise PSD and/or power consumption. Our first alloy selected for further sensor testing, 43Cu52Ni, shares its 100 °C Tc with our lowest-noise alloy, 45Cu50Ni, but has much higher initial permeability. Many uses for low-noise magnetic sensors require long durations of data collection and sensor stability over both time and temperature (which is an issue). Our future investigations must address these properties.
Our present results have relied heavily on the existence of the data presented by von Auwers and Neumann (1935), but no such comprehensive examination of molybdenum permalloys has ever been undertaken (Chaston, 1936). There may yet be room for the improvement of molybdenum permalloys in fluxgate sensors, with molybdenum content higher than that of the legacy 6 % materials. In our future work, we plan to investigate these alloys.
The performance of these new alloys is expected to enable further miniaturization of the fluxgate sensor while preserving geophysically useful magnetic sensing performance.
A1 Preface to the translation
In this translation, my intent has been to replicate in English the style as it was composed in German. The reader of the English translation will find many of the sentences awkward and long, sometimes using questionable vocabulary. The inverted order of many sentences is as it appears in German, which is above and beyond the usual word order differences between English and German.
Much of this would be the writing style of that time, 1935, in both languages. My hope is that I have been able to provide the look and feel of writings of that time.
The references and citations have been altered to meet the European Geosciences Union's journal standards. Corrections have been made with respect to the original citations.
Translation notes are included in-line. I would like to acknowledge the helpful comments on the translation from Franz Harpain, and Tom O'Connor.
A2 About the authors
Otto von Auwers was born in Heidelberg on 1 July 1895, as the son of chemist Karl Friedrich von Auwers. He studied natural sciences at the universities in Heidelberg, Munich, and Marburg. He then worked as an assistant at the universities of Gdansk and Greifswald, where he also did his doctorate.
From 1924, he worked as a physicist in the laboratories of Siemens & Halske, where he mainly worked in research. In 1935, he was able to habilitate at the University of Berlin and was employed there in 1943 as an associate professor. After the war ended, von Auwers went to Clausthal in 1946 as a full professor, where he taught for 3 years. Von Auwers died on 4 November 1949, at the age of 54 (Wikipedia, Germany, https://de.wikipedia.org/wiki/Otto_von_Auwers, last access: 15 February 2024).
Hans Neumann worked at Siemens & Halske in Berlin. He is known for the invention of a diaphragm loudspeaker with a planar voice coil (U.S. patent US1987412A, 1935) and for the Siemens magnetic alloy, M1040, which from 1934 to 1941 held a record for maximum magnetic permeability (Bozorth, 1951, p. 120).
A3 Provenance
This paper was difficult to locate. This original reprint copy was provided by the Central Laboratory of Wernerwerkes of Siemens & Halske and made its way to Egon Ritter von Schweidler, a Vienna physicist. Von Schweidler was vice president (1939–1945) of the Austrian Academy of Sciences (AAS).
There is a gap between von Schweidler's death in 1948 and the locating of this photocopy. It was found in a box of loose materials in 2007, in the Austria Academy of Sciences Library in Vienna, scanned to a pdf file, and forwarded to colleagues at Zentralanstalt für Meteorologie und Geodynamik (ZAMG) in Vienna, now GeoSphere Austria.
I wish to acknowledge help of the AAS library's director and staff, who catalogued the loose material and found the photocopy, and Barbara Leichter and colleagues at ZAMG, who enabled the paper's arrival in my hands.
Section B1 and B3 are work of Hans Neumann (measurements joint with Hermann Reinboth), Sect. B2, O. v. Auwers.
B1 Magnetic properties of high permeability FeNiCu-alloys
Among magnetic materials with higher initial permeability (μ0) alloys comprise a special type. It is possible with alloys to obtain not only higher but also more uniform μ0-values than it is with pure metals, for which the variable content of impurities has much larger influence on the magnetic values than with the alloys. For 12 years the μ0-values of pure and of silicon iron stayed between 400 and 1000. It was therefore a huge step forward for them for the equally important areas of electrical measurement and telecommunications for materials with higher initial permeability and smaller coercive force (Hc), which was achieved in 1923 by Gustav Waldemar Elmen (Arnold and Elmen, 1923a, b, c), with the making of an FeNi-alloy (“Permalloy” with 78.5 % Ni and 21.5 % Fe),1 with a particular annealing showing 10-times higher μ0-values (4000 to 10 000). Because of the extensive technical applications found in the meantime for the FeNi-alloys, this was the territory of a large number of researchers who have gone in various investigative directions, usually with the technical goal to achieve higher μ0-values. This was finally made possible by the addition of specific metals to the FeNi-alloys; among these Cr, Mo and especially Cu have proven particularly suitable. A very well-known magnetic FeNiCu-alloy is Mu-Metal (Heraeus-Vakuumschmelze, 1931; Anonymous, 1927; Edgcumbe and Ockenden, 1927), an alloy with 76 % Ni, 17 % Fe, 5 % Cu, 2 % Cr, with μ0-values to 20 0002. Other magnetic alloys of the FeNiCu-system that have found uses in the electrical technologies are Thermalloy (Kinnard and Faus, 1925) by Isaac. F. Kinnard and Harold T. Faus, an alloy of about 70 % Ni, 30 % Cu with some Fe, and the very similar Monel-metal (Electr. Rev., 1921; Hund, 1922), a natural alloy with variable composition (about 67 % Ni, 29 % Cu, balance Fe and other metals). Because of their negative temperature coefficients both alloys were utilized to compensate the temperature coefficients of permanent magnets (as magnetic shunts in an air gap). Furthermore, should be mentioned those cold-rolled FeNiCu-alloys (namely, about 40 % Ni, 60 % Fe with Cu-additions to 15 %) alloys investigated by Dahl et al. (1933), Kersten (1934) and Preisach (1935), which because of their admittedly low, but very field-strength-independent permeability could win new interest for telecommunications.
A systematic investigation of the FeNiCu-system is so far still not accomplished. Already Vogel (1910; Roll, 1933) has detected that in the FeCu-system there exists a phase separation [“miscibility gap” in the original] region reaching far into the ternary zone (up to about 40 % Ni), gradually narrowing (Fig. B1, curve c); this limit applies however only for higher temperatures (about 1000 °C). Chevenard et al. (1929; Portevin and Chevenard, 1929), concluded from dilatometer measurements, that the phase separation region at room temperature extends into the Nickel corner in the ternary region (Fig. B1 curve b), and Dahl and Pfaffenberger (1934) could essentially confirm this limit by magnetic measurement. Their findings shift the course of the limit of the phase separation region (Fig. B1 curve a) towards still higher Ni content. Kussmann and Scharnow (1929b; Messkin und Kussmann, 1932) in contrast, with measurements of the coercive force on the line 50 % Ni, 50 % Fe (to the Cu-corner) put the limit on the phase separation region to about 17 % Cu, 42 % Ni (Fig. B1 point d). The FeCu and NiCu binary systems were as well metallurgically and magnetically investigated. For the first system we can name the works of Sahmen (1908), Müller (1927), Ruer (1927), Ruer and Goerens (1916), Albrecht Kussmann (Kussmann und Scharnow, 1929a), for the second case are those of Guertler and Tammann (1907) and Williams (1931), and others.
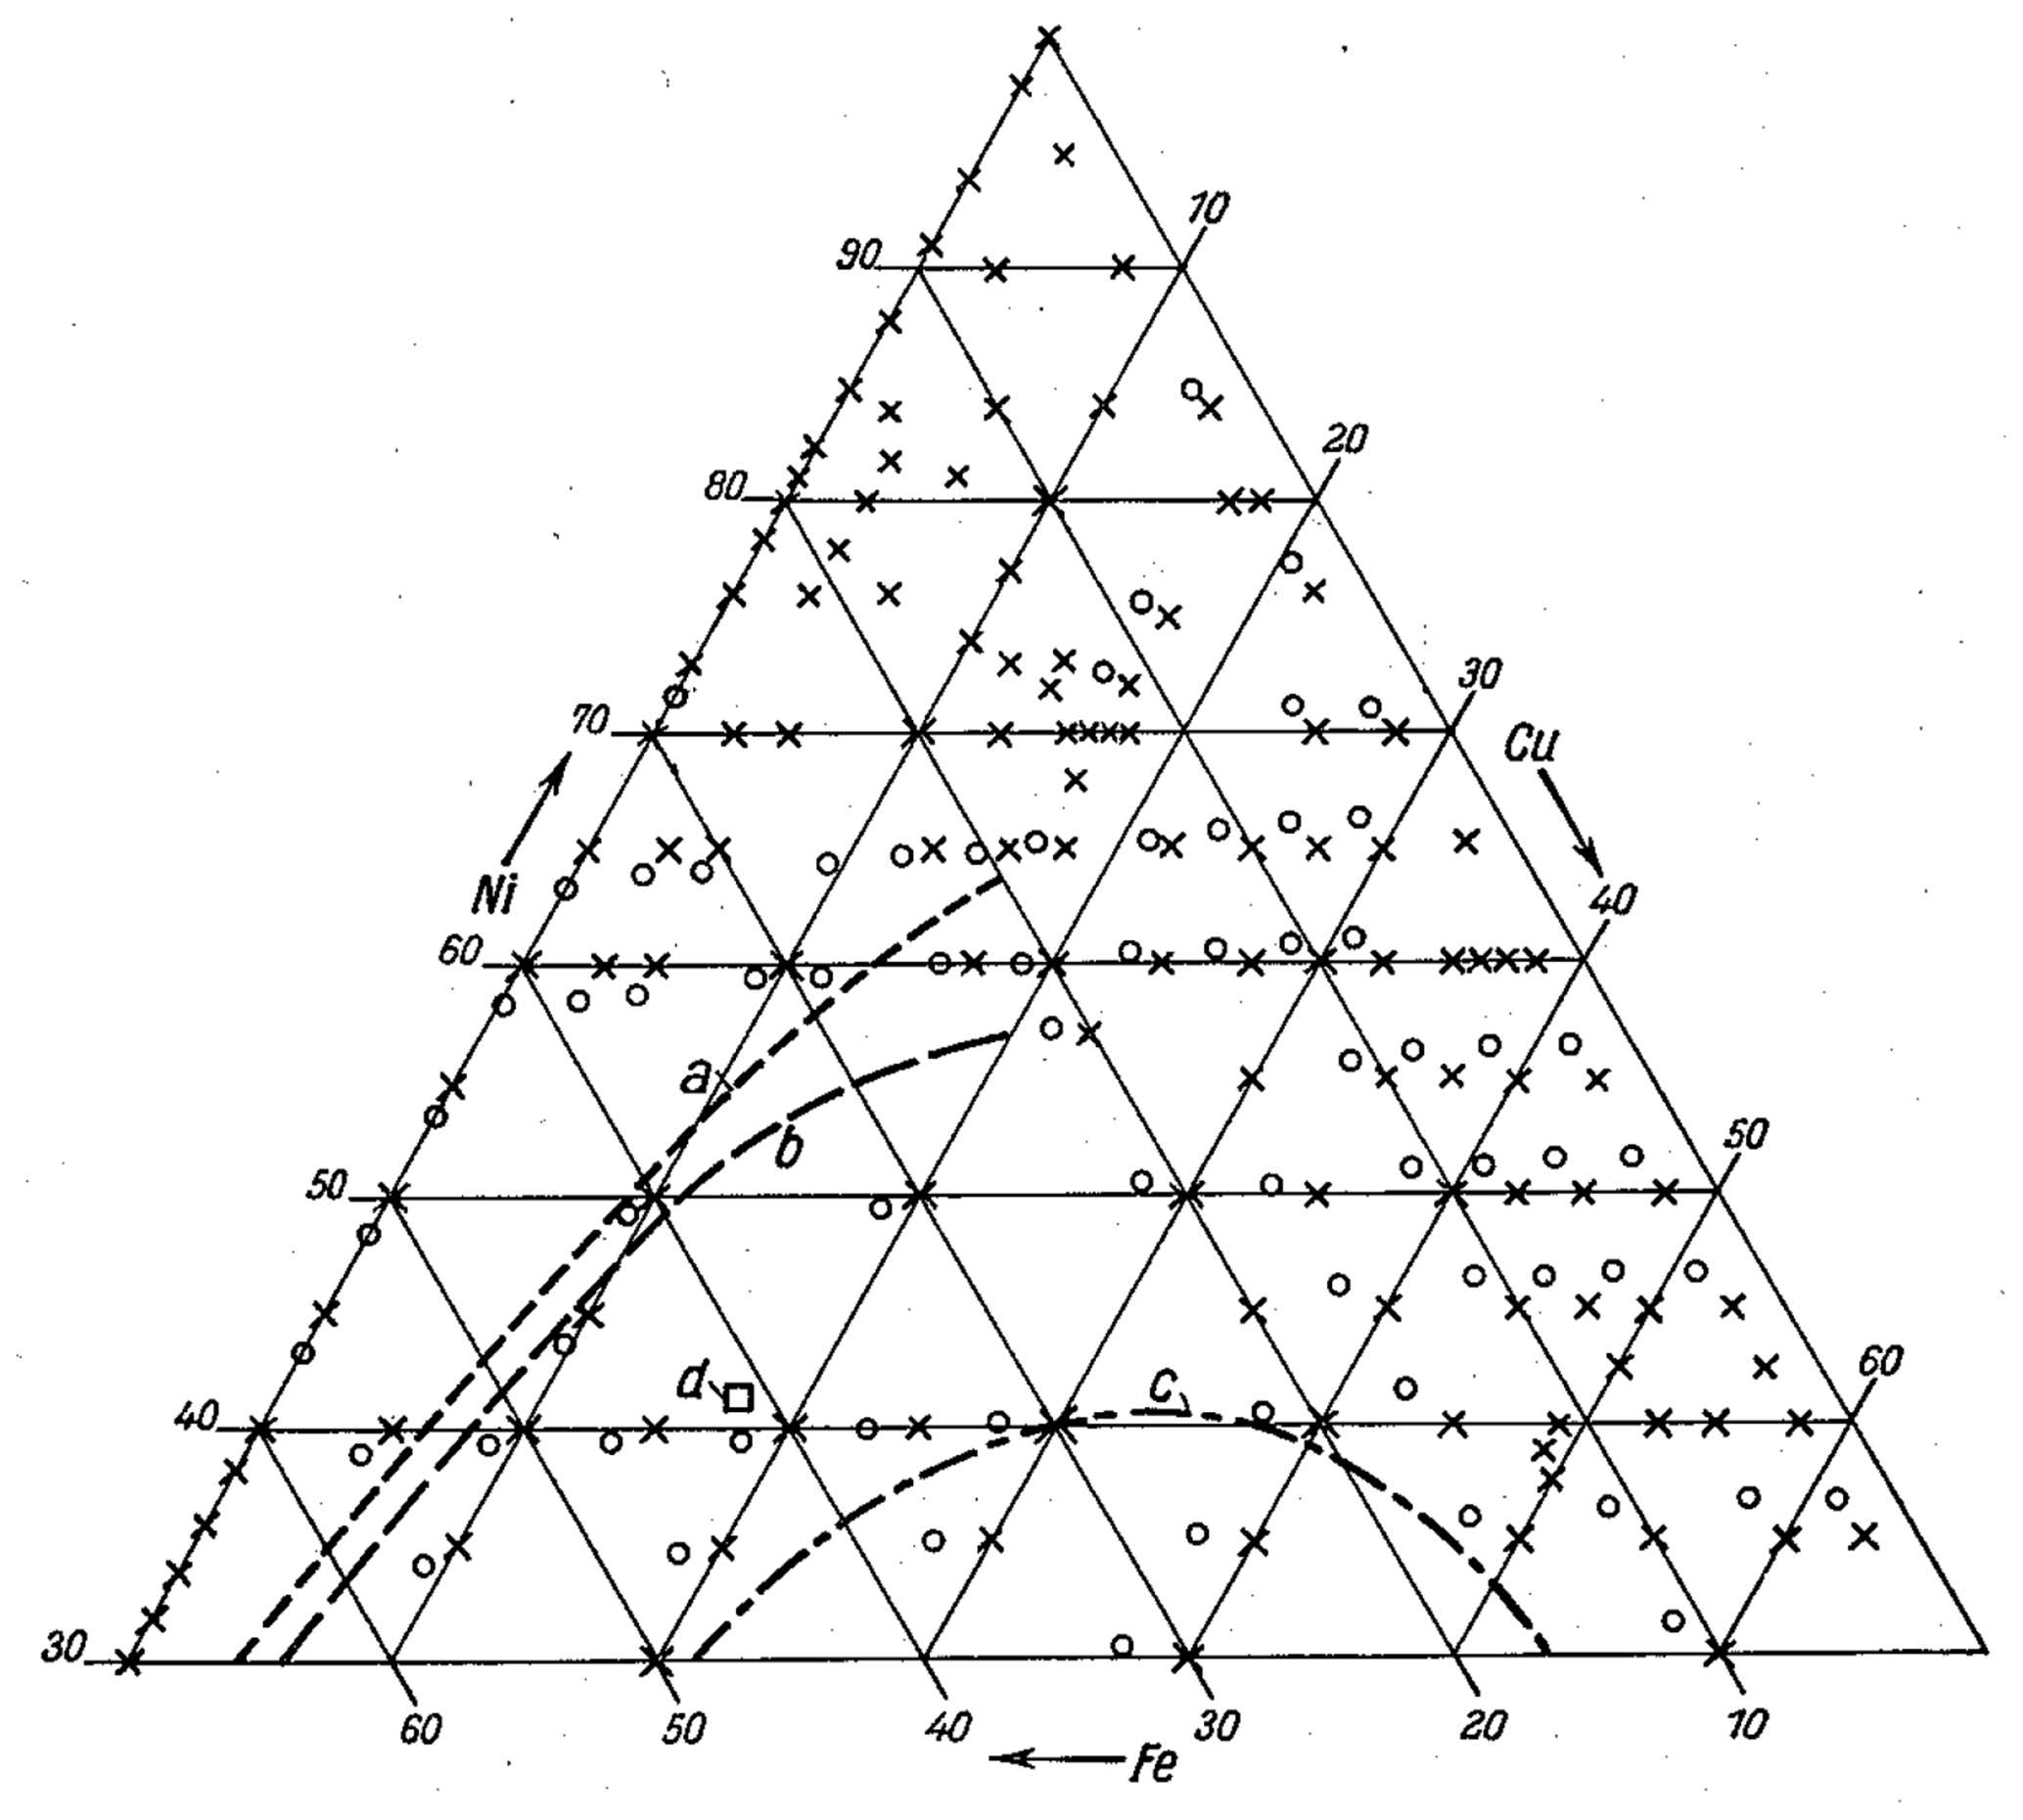
Figure B1Locations of alloys investigated in the FeNiCu-diagram in weight-percent (x) and in atomic-percent (o). Locations of phase separation region boundaries (a, b, c, d) taken from other authors.
From the above statements, because of the phase separation region, alloys in the FeNiCu-system in the neighbourhood of the FeCu-line are not expected to have high permeability; in the neighbourhood of the NiCu-line, particularly towards the Cu-corner, the Curie-points are too low, and on these grounds we cannot expect very high values of permeability; there remains a quite sizable phase separation zone, adjacent to the highly permeable FeNi-alloys, that few have investigated. The problem of the present investigation was then, to investigate and clarify the FeNiCu-system by measurements of the magnetic properties, and for various heat treatments to ascertain the extent and form of the highly permeable zones in the ternary system. A further sought verification was whether a connection existed between the height of initial permeability as compared with the coercive force and the magnetostriction.
B1.1 Making of the alloys
The alloys were cast as ingots from 7 kg melts made in a high-frequency-oven. The starting materials used were Mondnickel of 99.84 % purity, wood charcoal iron and electrolytic copper. Compositions were specified as values of the weights. The poured ingots were rolled out to plates of 0.35 mm, from which were punched rings of 60 mm outer- and 45 mm inner diameter. A final annealing process followed in dry hydrogen.
B1.2 Measurement methods
The measurement method was the usual ballistic ring method, in which about 10 rings were set in ring-formed ebonite casings to keep out mechanical stresses (when direct winding the cores) (Neumann, 1931); because of the mainly high μ0 values, the air-form correction was needed in only a few cases.
What was recorded: the magnetization curves and loops for a maximum magnetic field strength Hmax=10 Oe; this value sufficed, because of the high permeabilities for most alloys, for achieving the limiting values for coercive force (Hc) and remanence (Br), and in many cases even for the saturation. For the alloys with larger coercive forces (Hc>3 Oe) the field was increased to 100 Oe; for the magnetostriction measurements sheet metal strips were made, and for control were annealed together with some rings from the same alloy. For these rings the coercive force was measured ballistically, an Hc-measurement for the strips by the familiar ballistic method; An Hc measurement of the strips according to the known ballistic method (in which the sample during the determination of the apparent remanence is pulled from an induction coil), failed because of the too small sample cross section of 3.5 mm2 which would have necessitated a much too high winding number of the induction coil, of roughly 100 000 windings. The measurement was made with the astatic compensating magnetometer of Gerdien and Neumann (1932), and in spite of the small apparent remanences (of only 20 Gauss) and the small coercive forces (as low as 0.02 Oe) the strips still possessed sufficient sensitivity. In this instance the measurement was only possible by having the sample approach very closely to the moving coil magnetometer. For this reason, we did not use the normal two field coils in opposing circuits, rather utilized a long through-spool, the magnetic moment of which is cancelled in a compensating field in our operating moving-coil system (Gerdien und Neumann, 1932), upon which the second, astatic moving-coil worked.
B1.3 Locations of investigated alloys
There were about 130 alloys investigated, their locations are given in Fig. B1 with crosses (x). For a number of alloys, the location is also given in atomic-%. The locations of those with (O) indication points, in most cases did not significantly deviate from the locations of the cross. The coherence of the individual points is clear; for the alloys for which only the percents-by-weight are stated, the atomic-percentages are so close besides, that a draftsman-made diagram was not possible.
B1.4 Error sources
The magnetic values for the investigated alloys, to some degree scatter around naturally within a particular neighbourhood. Here the following influences are responsible: fluctuations in the alloy composition, particularly a varying influence from contamination, as well as inevitable fluctuations from rolling and annealing processes. For the analysis of the results also arise errors owing to the occasional inadequate density of the alloy-point locations. In contrast to these errors, the errors of the magnetic measurements of only about 2 % are very small. Because in general during repetition of the melting and heat treating it is possible to obtain a tolerance of only about 10 % to 20 %, for the quantitative reproducibility of the magnetic values therefore the above accuracy of 2 % is entirely satisfactory, in order to obtain with reasonable certainty in a sequence of alloys, for example, the optimum for the initial permeability of a composition. Thus because of the aforementioned scatter in the magnetic values it is difficult to decide if particular small irregularities in the plotted curves have a real underlying reason or not.
B1.5 Heat treatments
Since our investigations started with high nickel content, to wit the connection to Permalloys, we first of all retained even during variations of the copper content that heat treatment (“Permalloy treatment”, one-hour long heating at 900 °C with air quenching at 625 °C) which was designed by Gustav Waldemar Elmen to obtain for these alloys the best μ0 values. Comparative measurements with other heat treatments (for example one hour heating at 900 °C with air quenching or with slow cooling of the oven) did not yield significant deviations with respect to the location in the later described regions of highest initial permeability below 70 % Ni but did of course yield differences in the size of the magnetic values. As a second heat treatment with a principally different effect on the alloy was chosen a two-hour long heating at 1100 °C with slow oven cooling (“1100 °C treatment”). The following results thus cover in the main these two heat treatments.
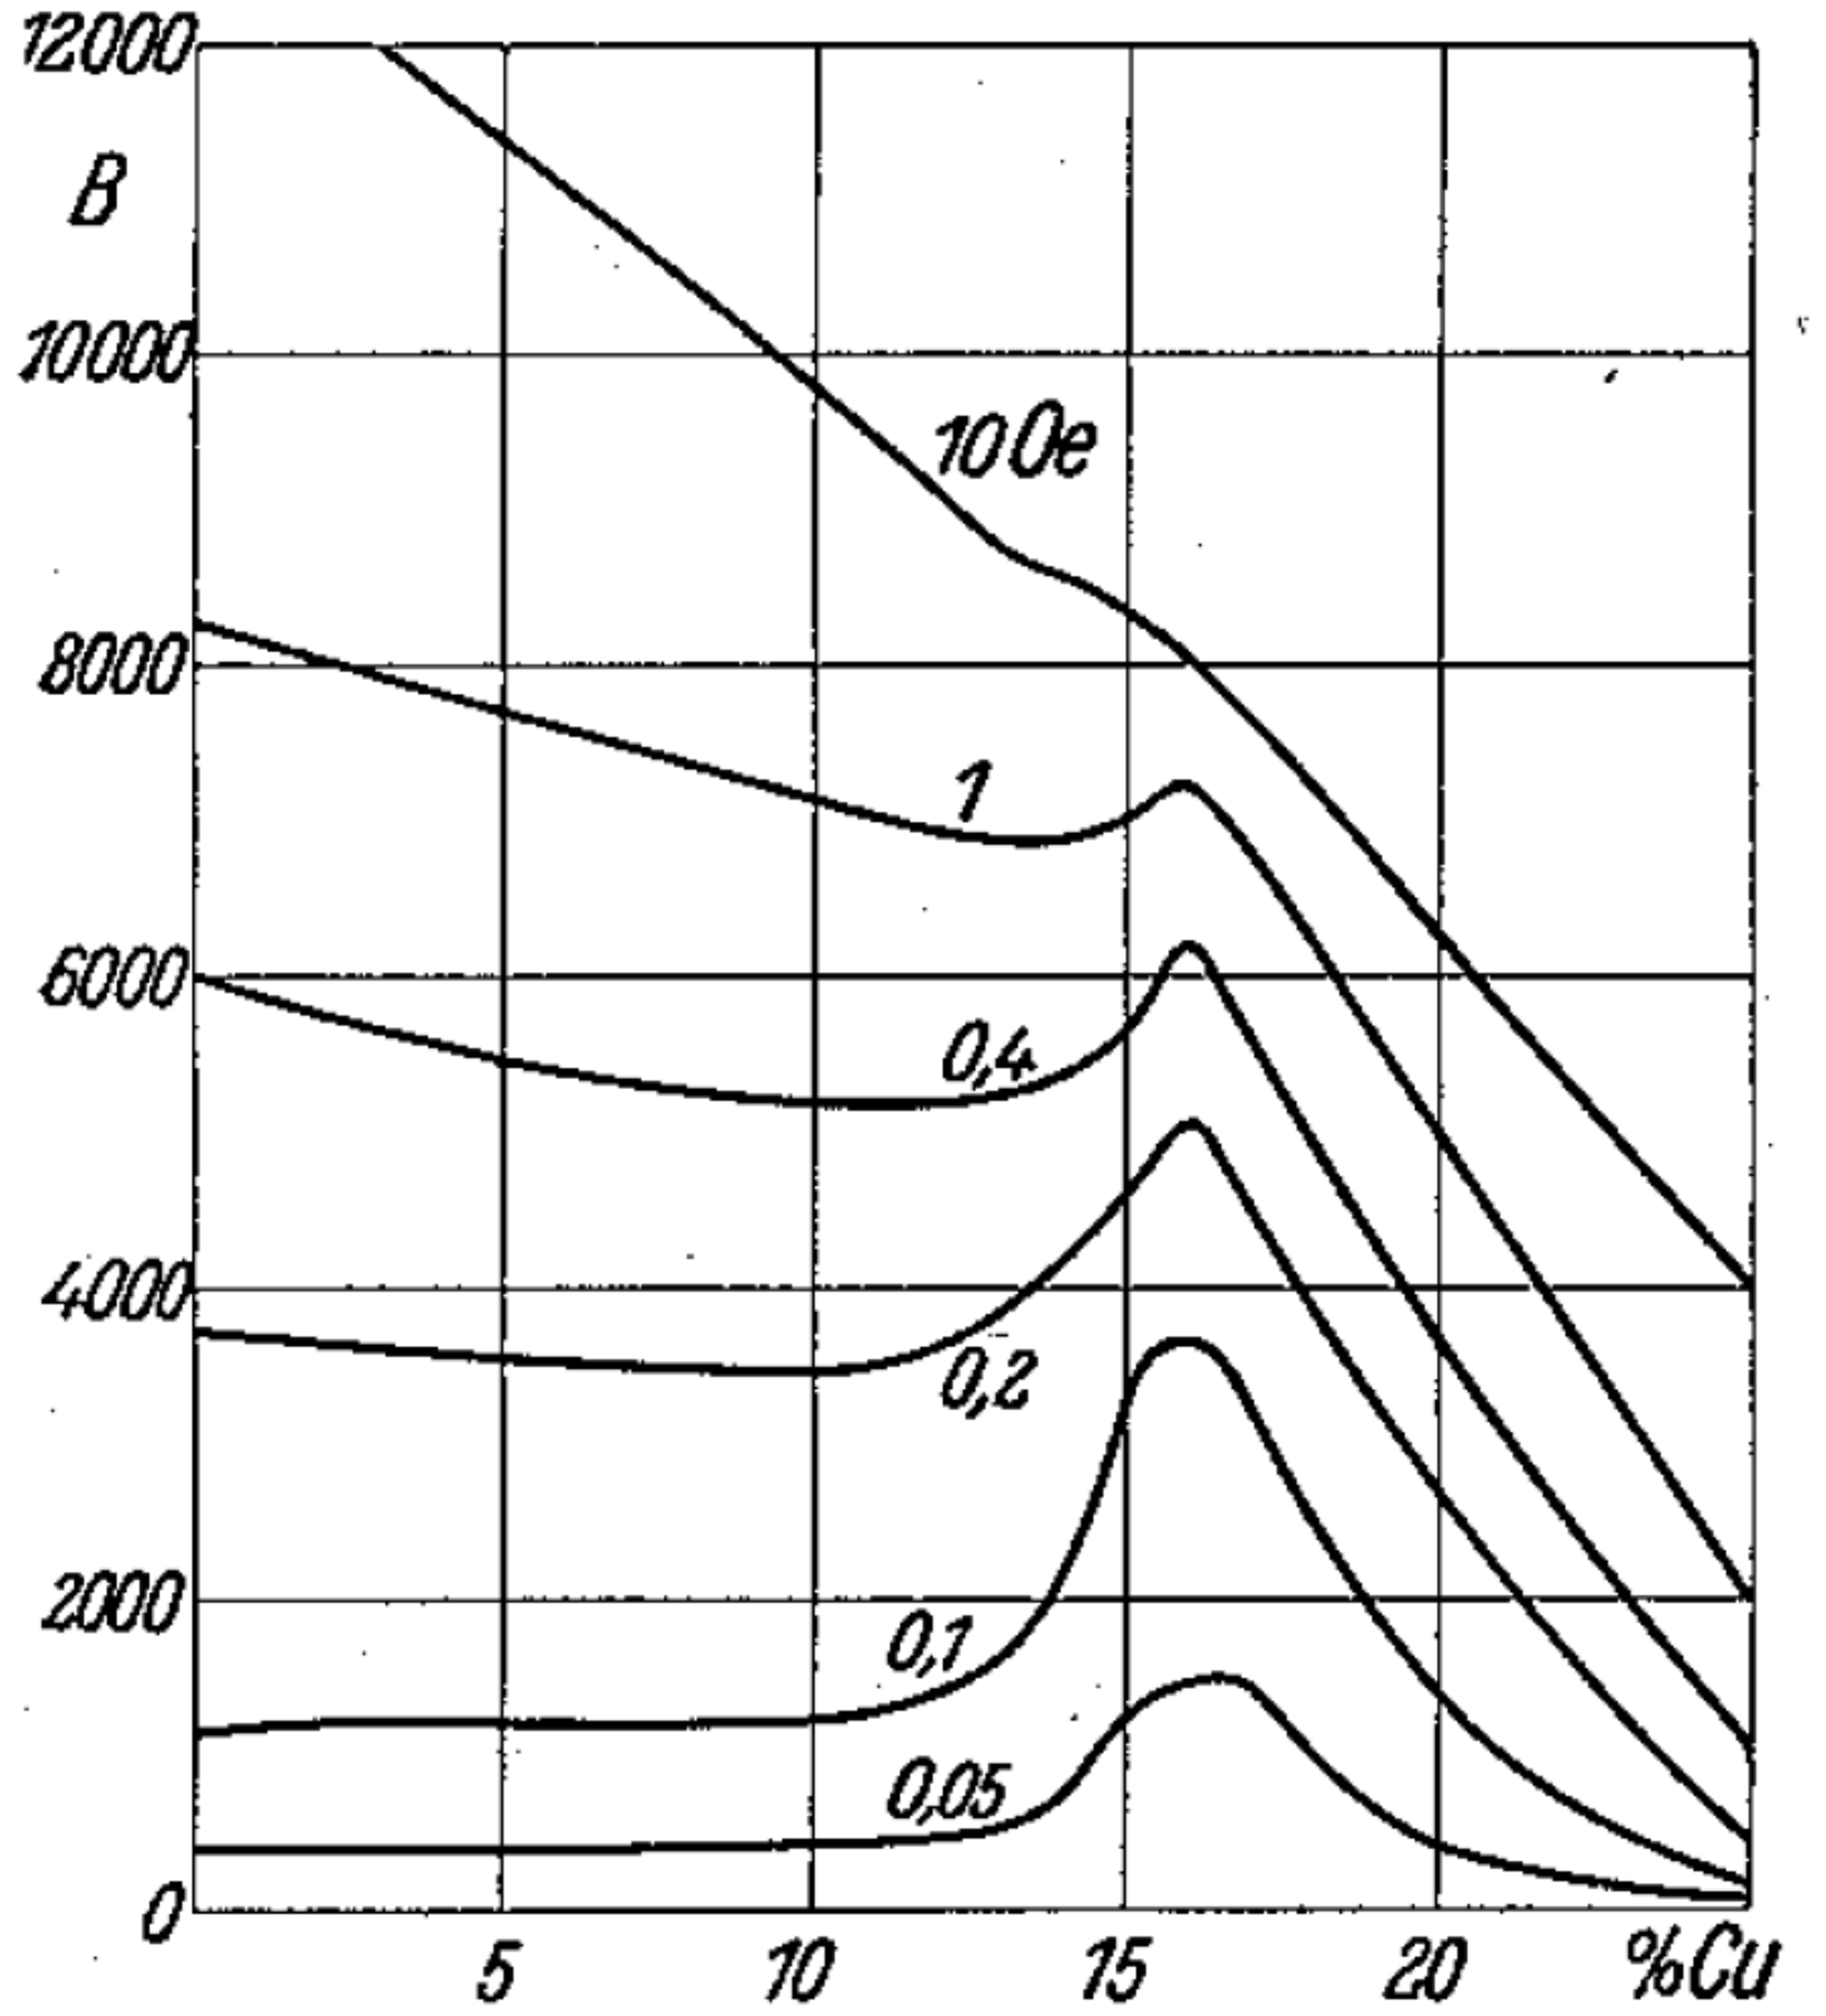
Figure B2Induction B as function of Cu-content for various field strengths; section for 70 % Ni; Permalloy-handing.
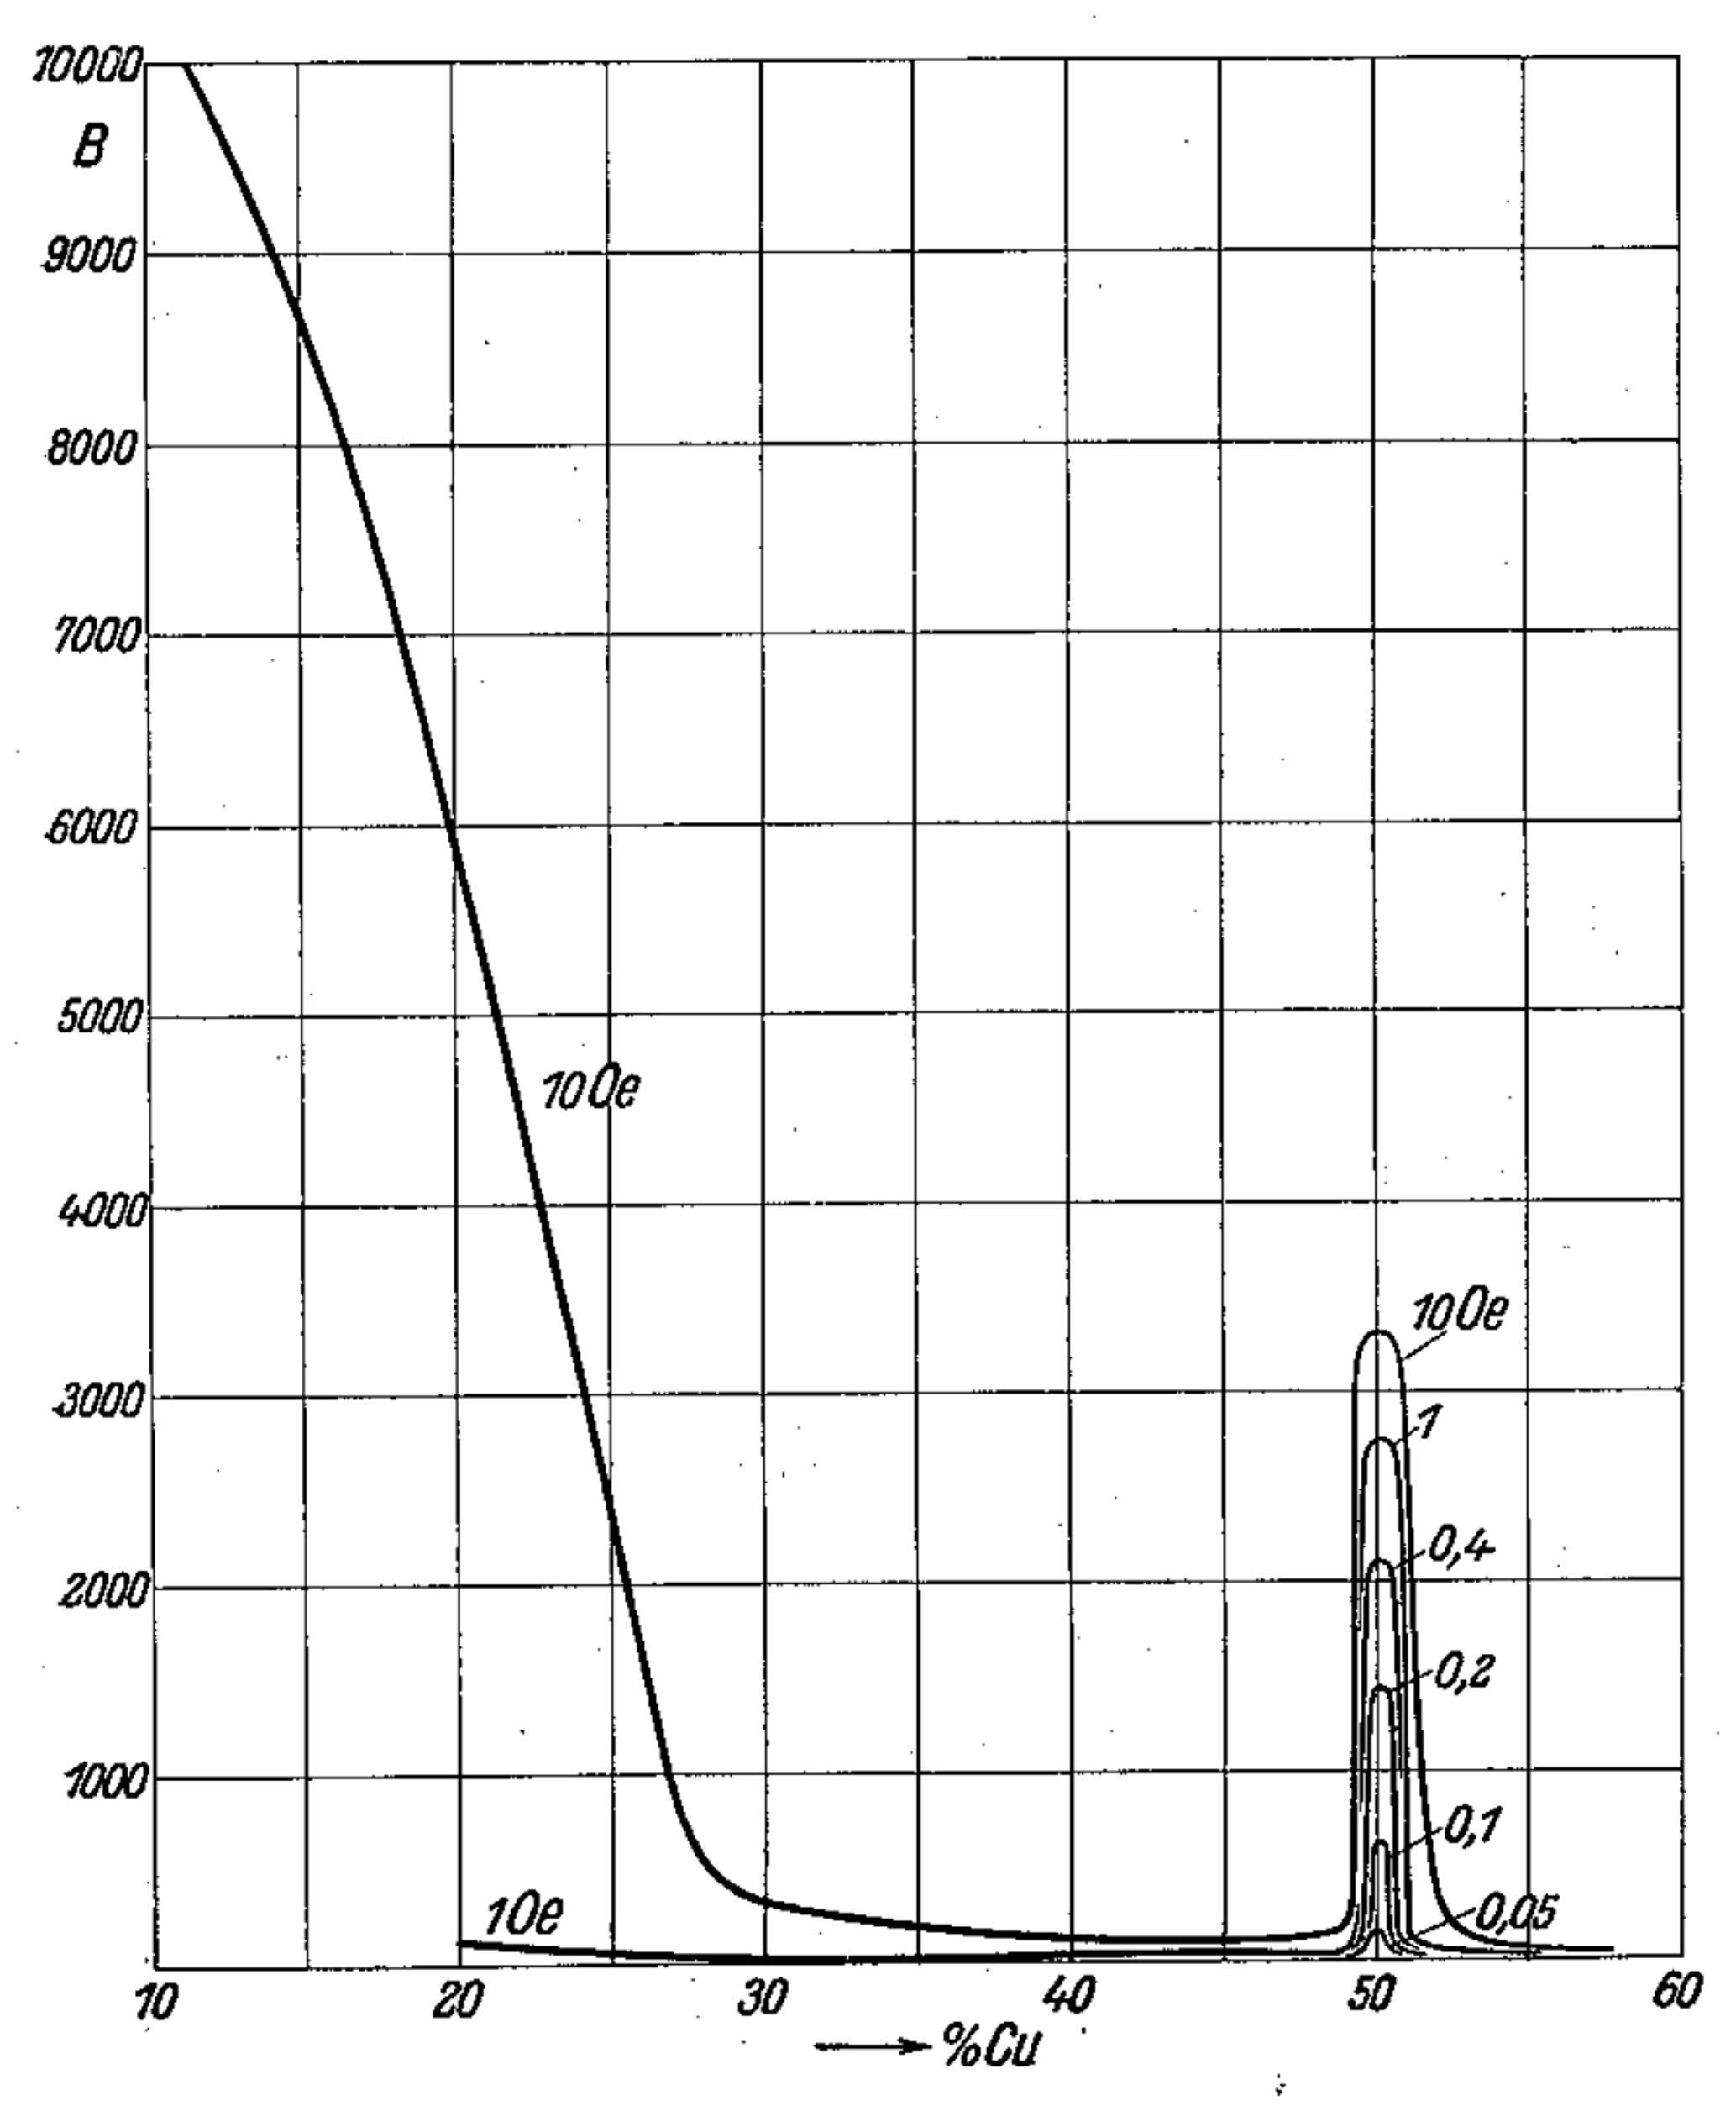
Figure B3Induction B as function of Cu-content for various field strengths; section for 40 % Ni; Permalloy-handling.
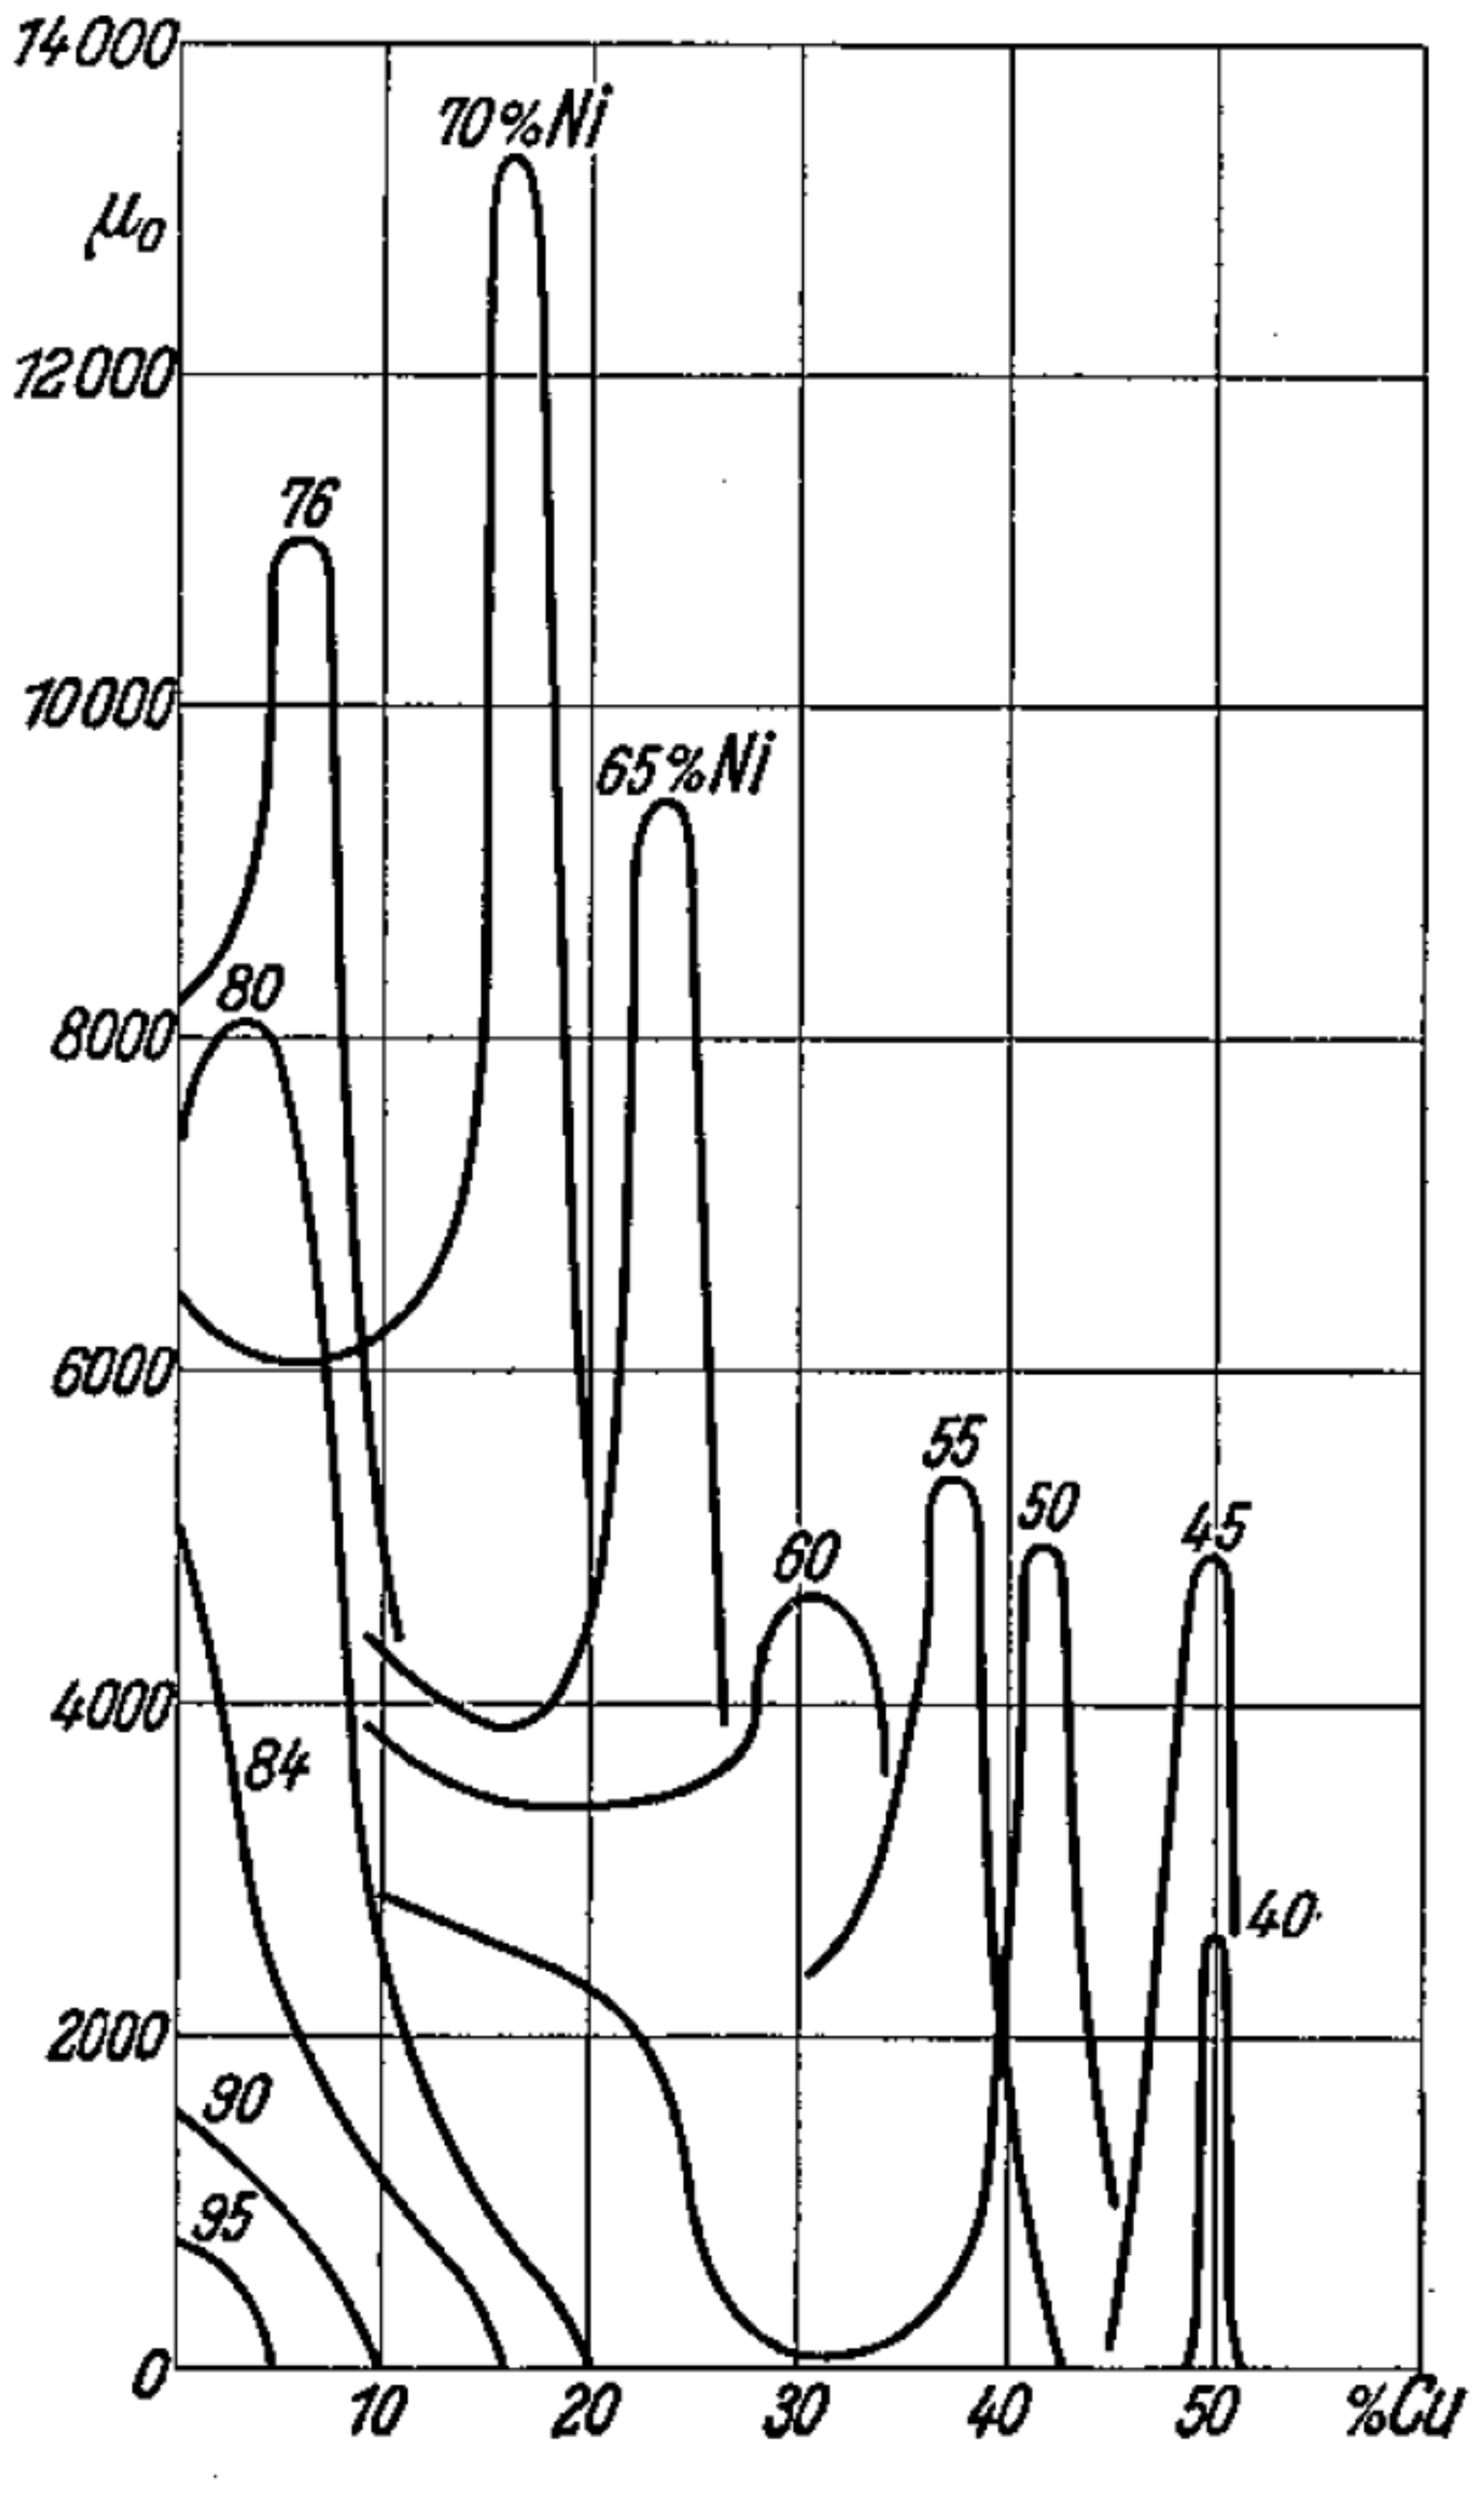
Figure B4Initial permeability μ0 as function of Cu-content; sections for various Ni-contents; Permalloy-handling.
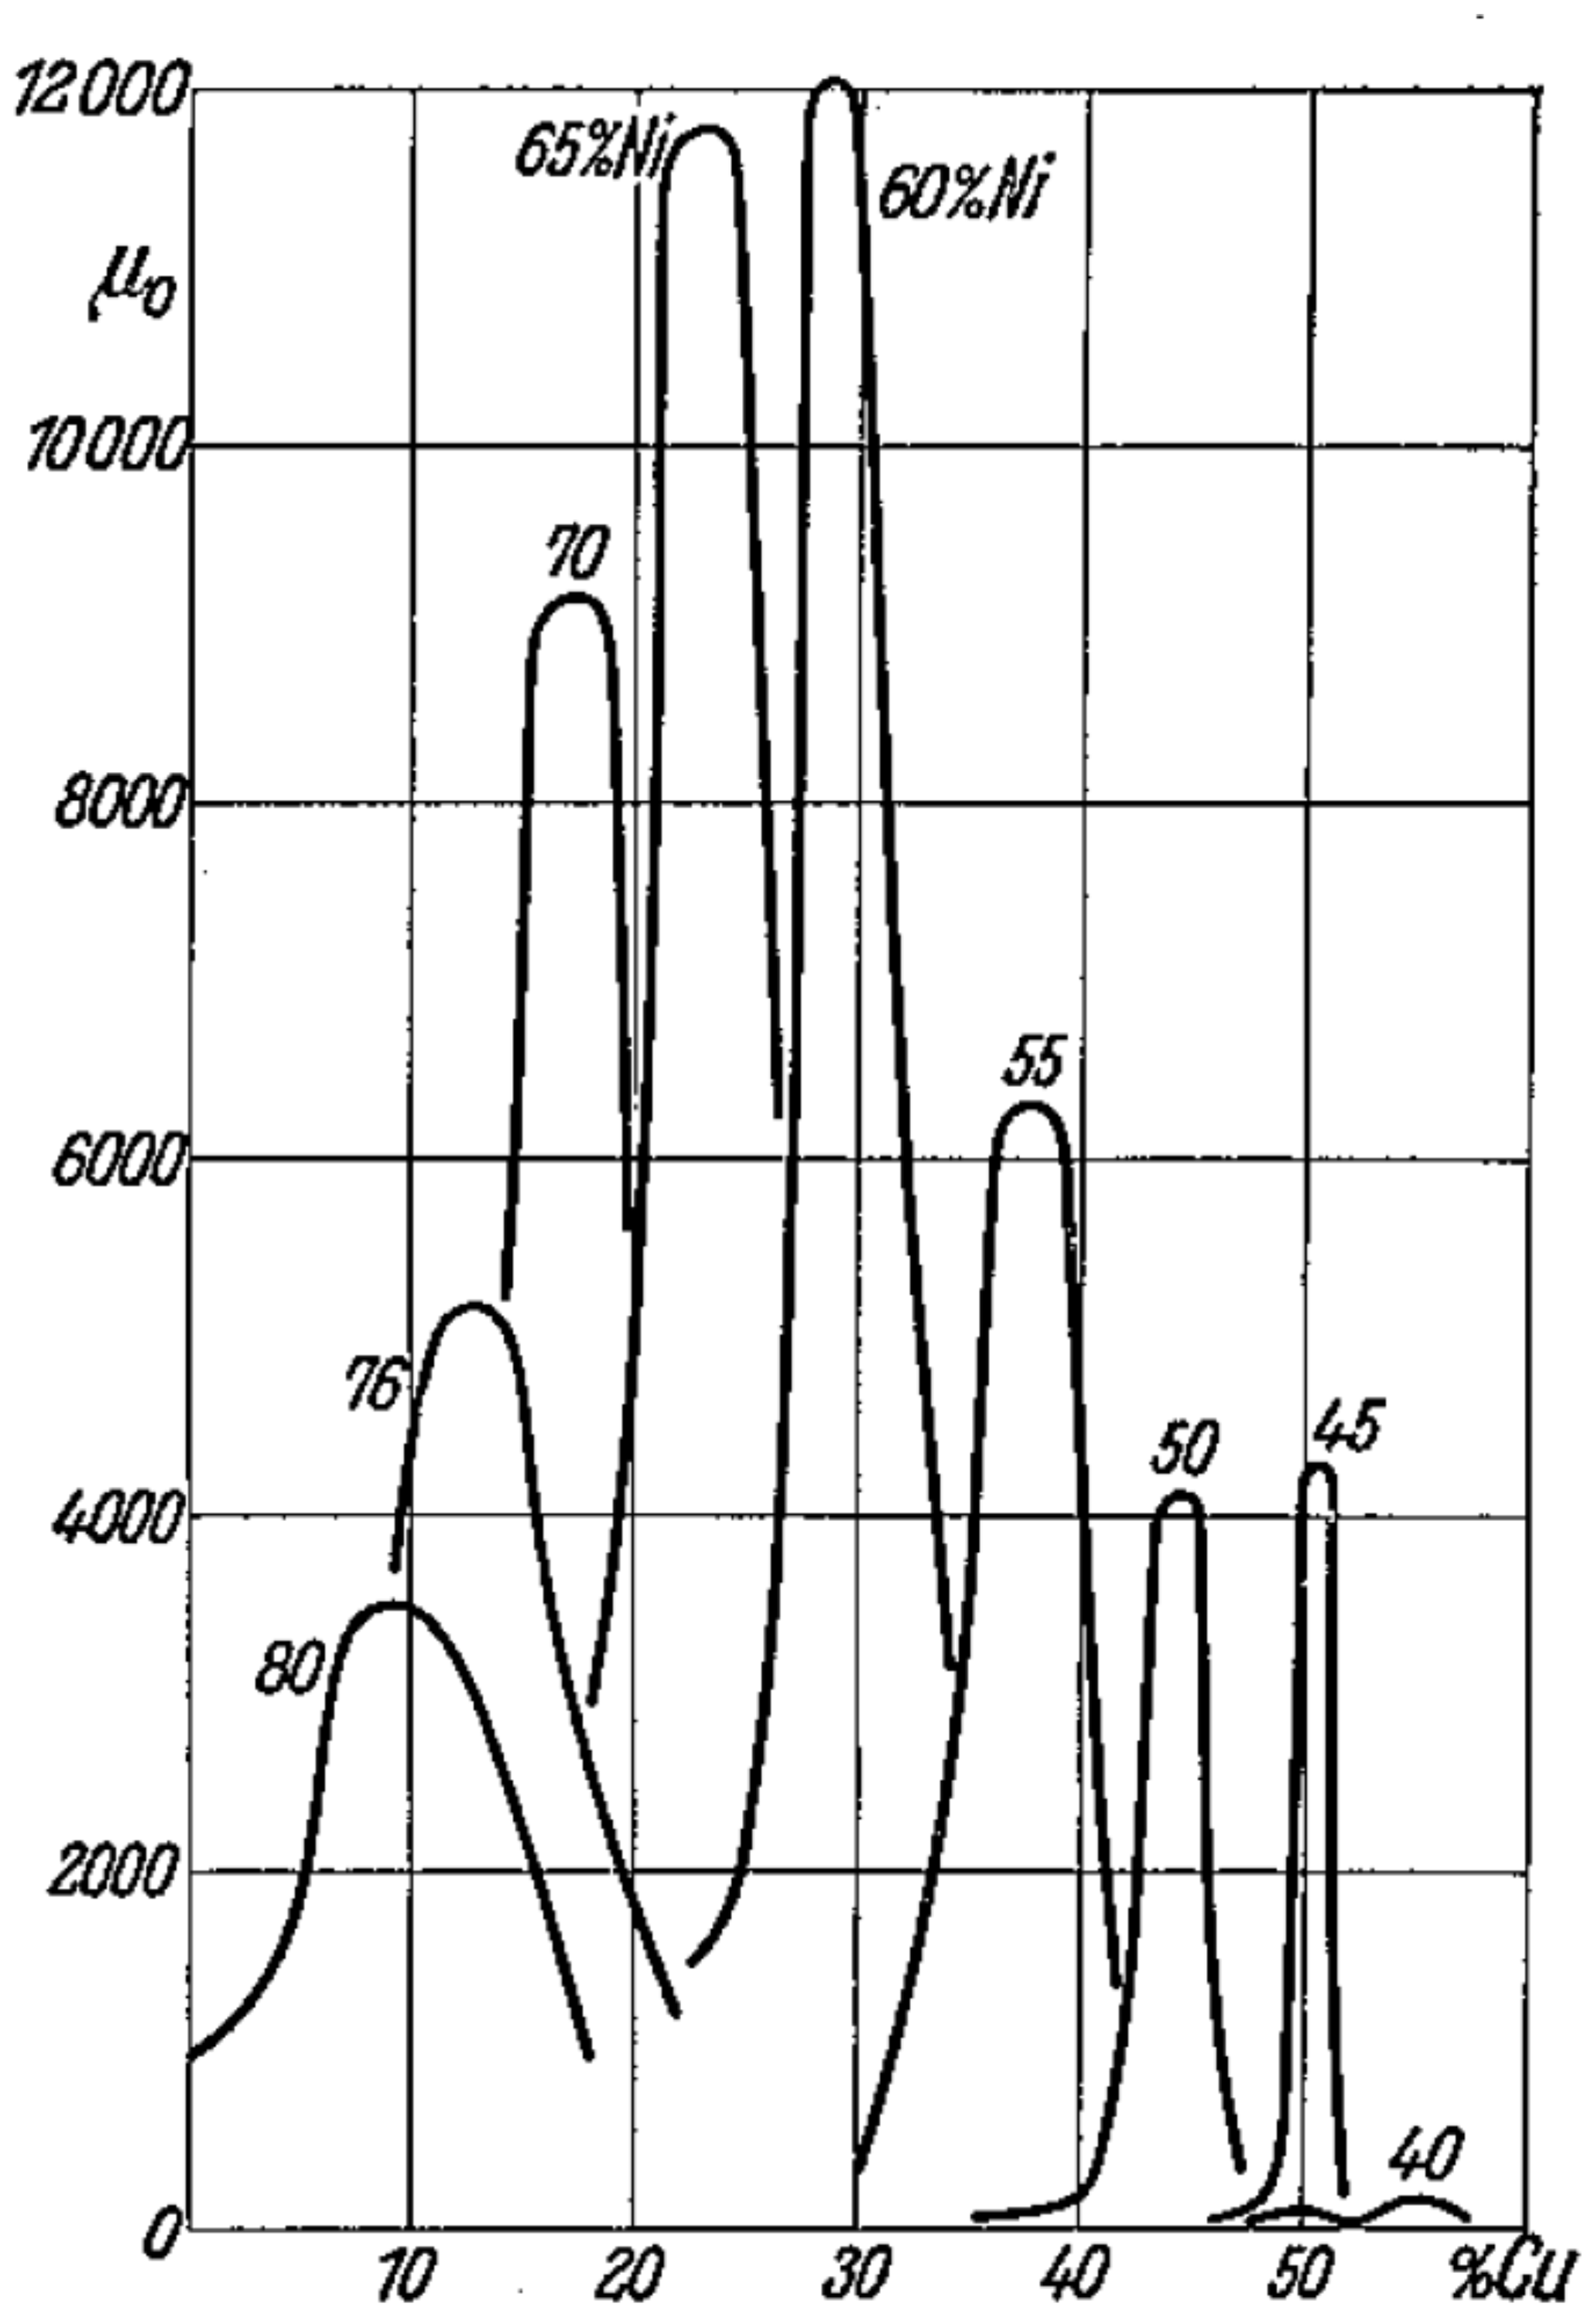
Figure B5Initial permeability μ0 as function of Cu-content; sections for various Ni-contents; 1100 °C-handling.
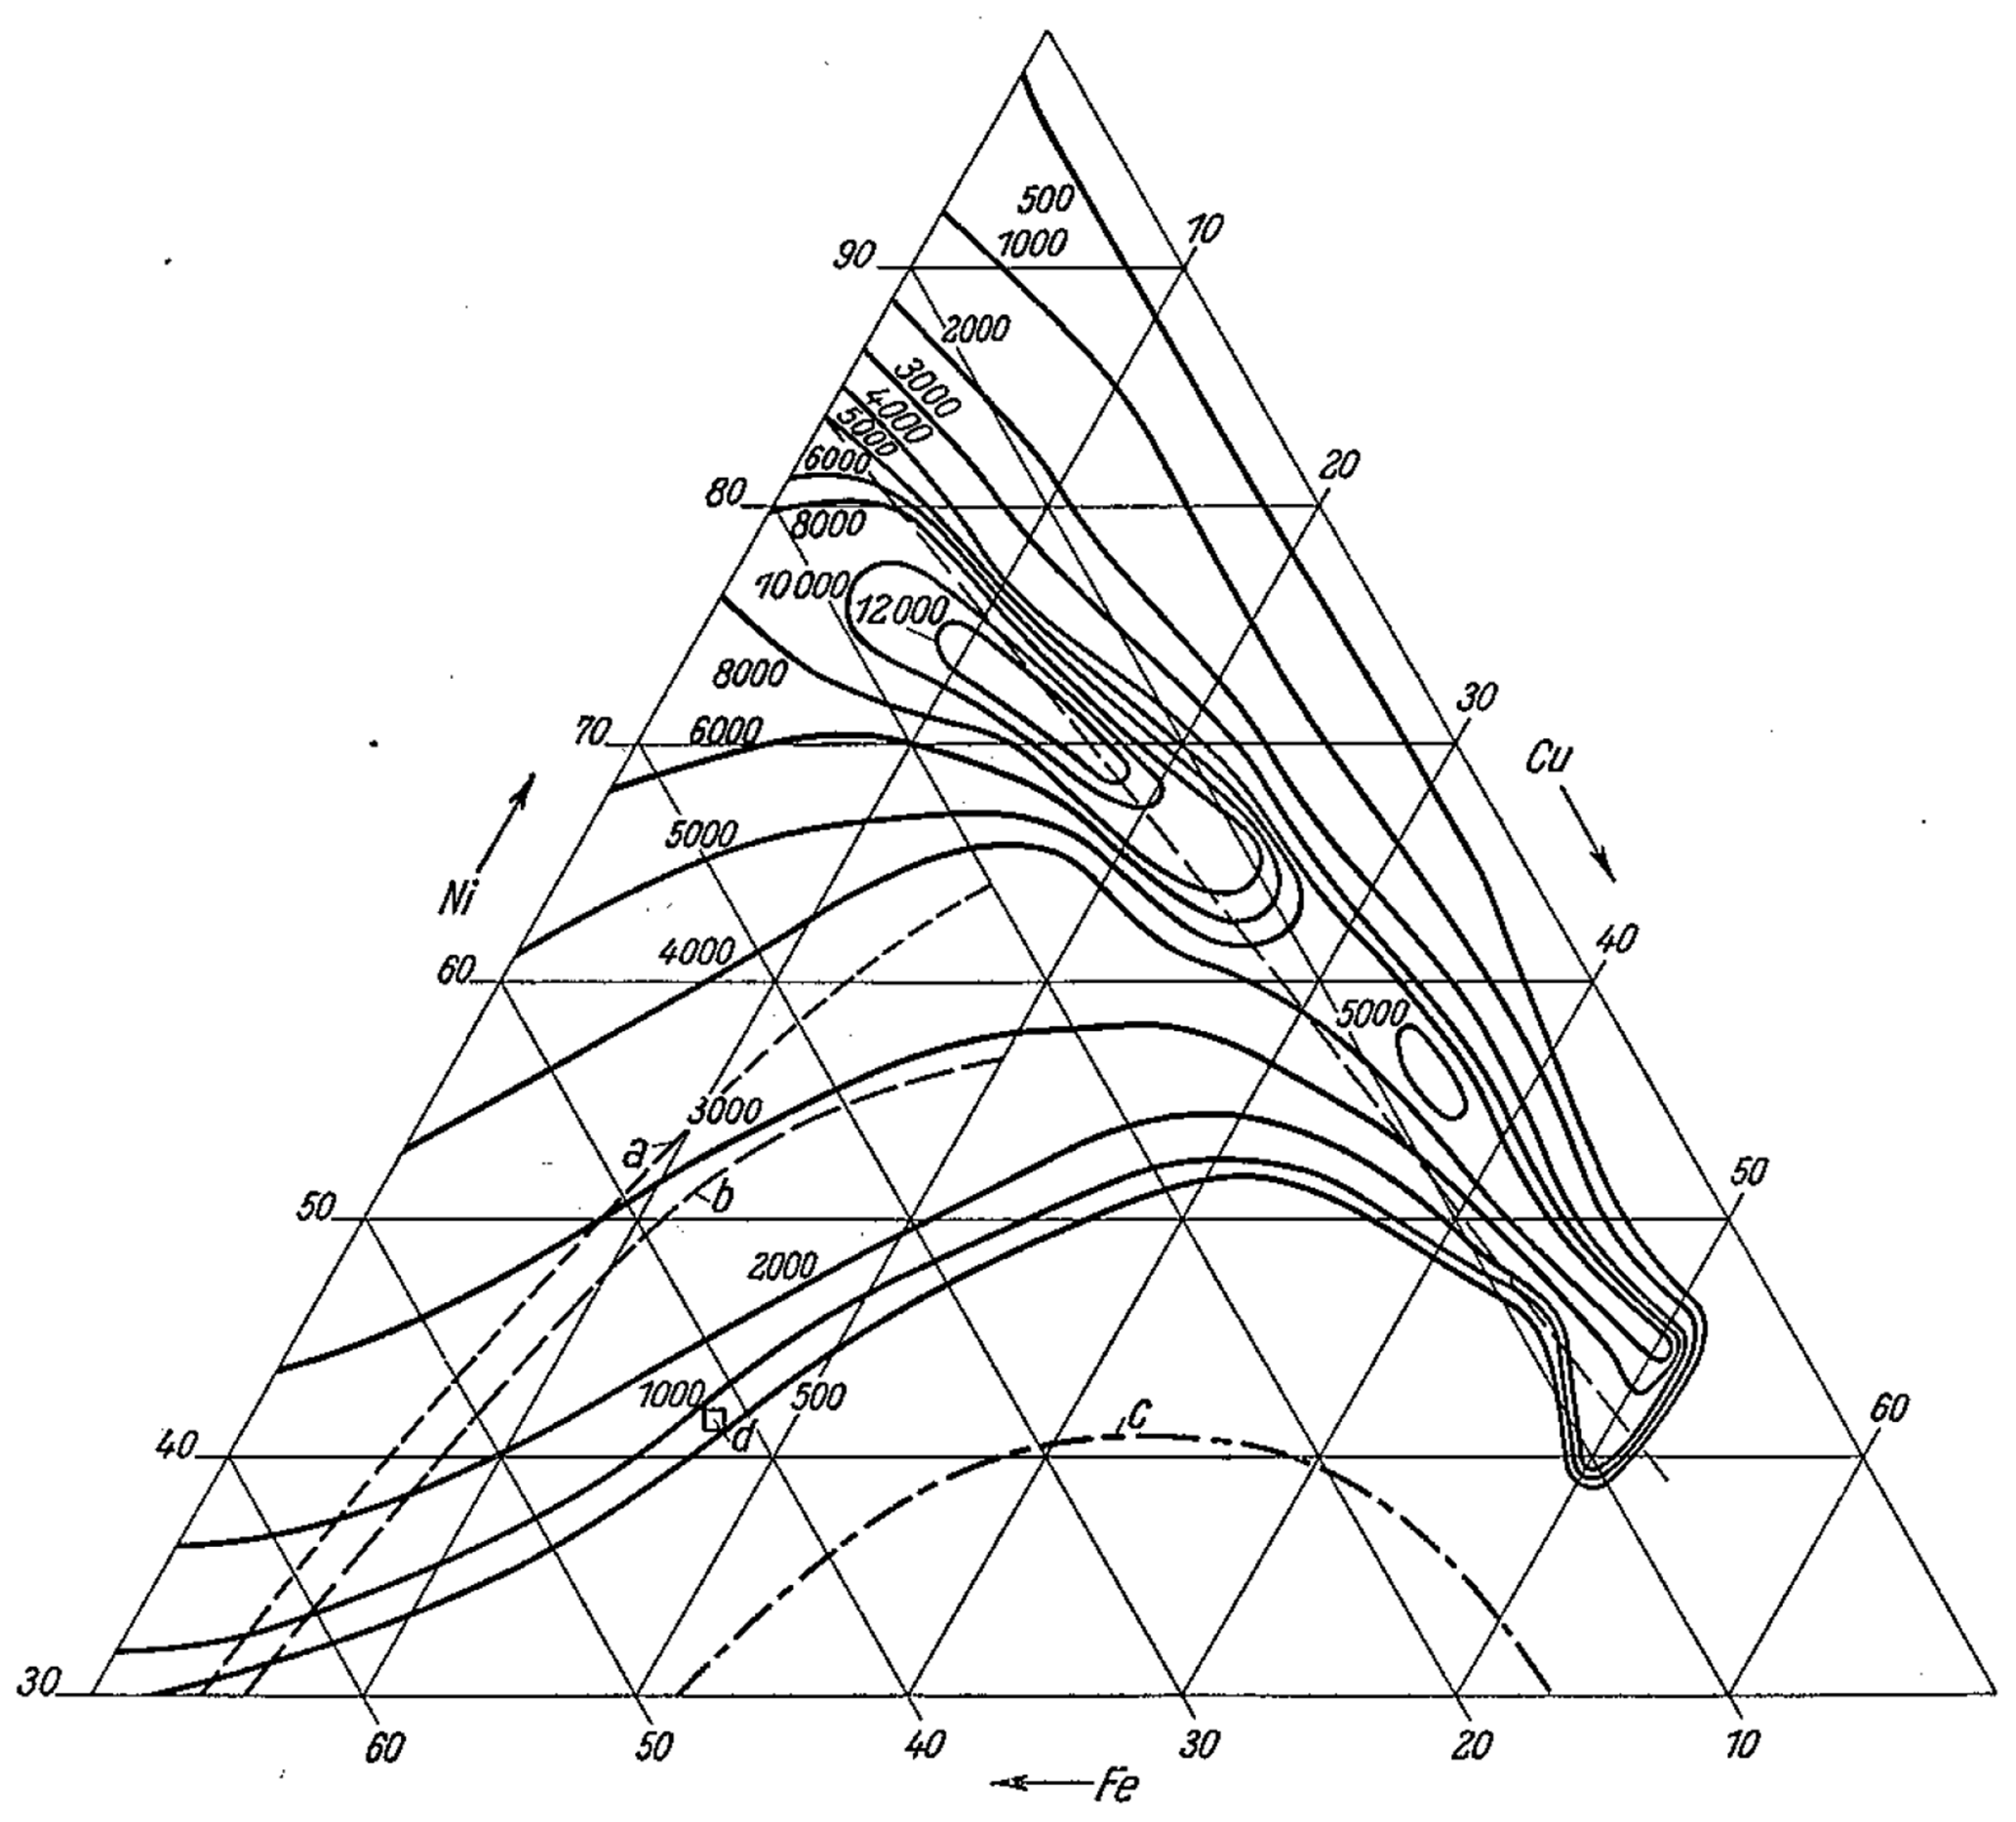
Figure B6Lines of constant initial permeability (–) in the FeNiCu system; Permalloy handling; Boundaries of phase separation region from other authors (a, b, c, d); Line of constant Ni:Fe ratio (–).
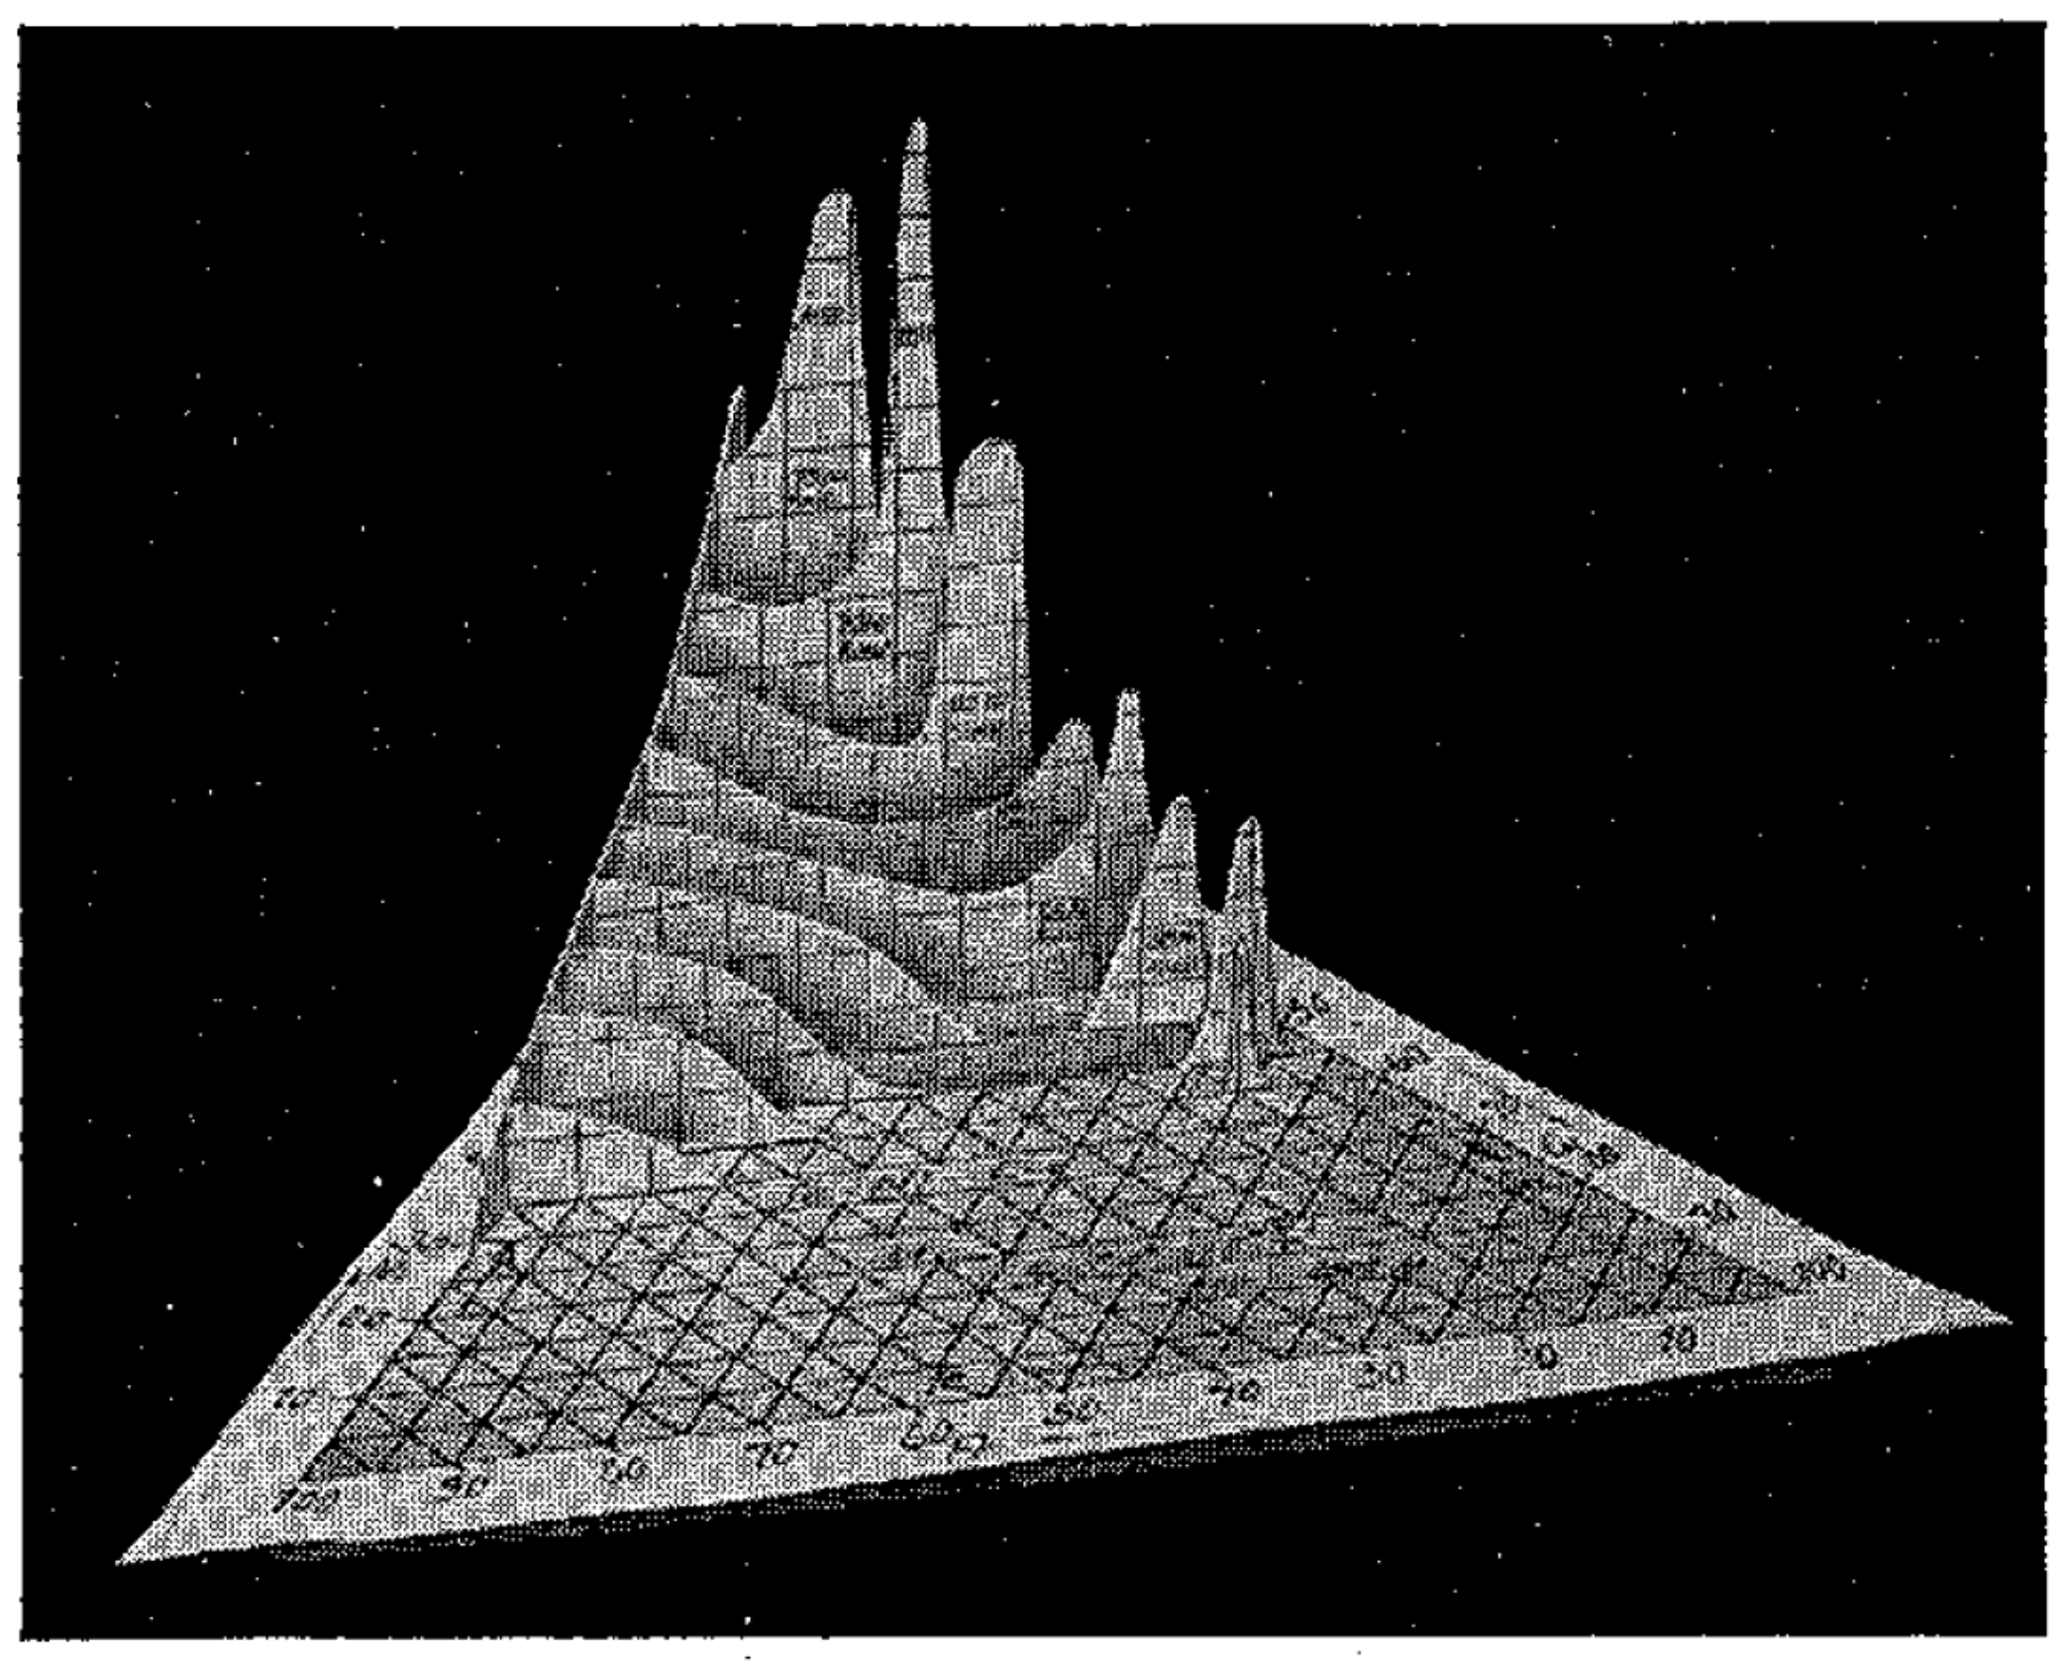
Figure B7Spatial drawing of Fig. 6; ordinate = initial permeability.
B1.6 Analysis of the measurement details
The results of the numerous (and unreported) individual measurements were evaluated in the following manner where sections for various Ni-contents (between 40 % Ni and 90 % Ni) were placed in the alloy triangle, and the magnetic properties, for all μ0, Hc and the induction Bs for H=10 Oe, were presented as functions of the Cu-contents. For example, Fig. B2 presents for a section of 70 % Ni the B-value as a function of the Cu-contents, for various field strengths. One recognizes an instability in the magnetic properties for about 16 % Cu, for small H-values (zone of initial permeability) is particularly prominent and which almost vanishes with increasing saturation. Figure B3 presents a similar typical section for 40 % Ni. Here is present a very pronounced maximum in magnetizability for 50 % Cu, which is separated from still higher magnetizable alloys with small Cu-content by a wide valley between 30 % Cu and 49 % Cu. This valley is due to the channelling through of the edge of the upper peak of the phase separation region, a zone of poor magnetizability. Similar curves result, when one selects the sections for constant Cu-content, whereas for constant Fe-content the differences were not so obvious. Since according to both of the last images the magnetization for small field strengths, that is, μ0, is not only of technical significance, but also constitutes a very characteristic property, therefore one could dispense with the presentation of the field dependence of induction; hence in Fig. B4 the μ0-values for the Permalloy-treatment are presented as functions of the Cu-contents, and the various Ni-contents presented as a parameter. One recognizes clearly that there is always a quite peaked maximum found in the initial permeability, for each of the various Cu-contents examined. Surprisingly furthermore is the fact, that even with lower Ni-contents (45 % Ni) and very high Cu contents (50 % Cu) high μ0-values (4000) were still found. There exists therefore a certainly narrow, but quite long zone of highest μ0-values in the FeNiCu-system between 40 % Ni and 80 % Ni, and within this narrow zone is a μ0-maximum definitely present at about 70%Ni. Figure B5 gives the same measurements for the 1100 °C-treatment; here also there is a narrow zone of higher initial permeability with a μ0 maximum present, only this [maximum] is shifted towards smaller Ni-contents (60 % Ni to 65 % Ni). The coercive forces yield, processed in the same manner, give the same plot, equally so for the maximum permeabilities. The location of the high permeability zone becomes more apparent if in “van't Hoffschen” triangles one puts in lines of constant magnetic properties; so in Figs. B6 through B13 are drawn the lines of constant values for μo, Hc and Bs for the two heat treatments. Figures B7 and B9 are photographs of spatial models of the initial permeability (μ0-values presented vertical) for the pair of heat treatments, which make these conditions very apparent. For the individual figures we observe the following: Figs. B6 and B7: for the Permalloy treatment the zone of highest initial permeability takes a narrow, band-form from the Permalloy-alloys with 78.5 % Ni () with steady rise of μ0-values to its top, peaking from 68 % Ni to 75 % Ni and 9 % Cu to 19 % Cu, a maximum with μ0=12 000 and then sloped relatively steeply (the saddle minimum for 60 % Ni is probably not real), sagging to 52 % Cu with μ0=500 to 1000, the values for technical iron. Also drawn in the diagram are the phase separation regions as reported by various authors; one sees that its impact is still noticeable up to the highest Ni-contents beneath the μ0-maximum for 70 % Ni, as a flaring of the lines of constant initial permeability. In the lower part of the highly permeable zone around 40 % Ni, 50 % Cu the band of higher permeability bends somewhat in the direction towards the alloy 50 % Fe, 50 % Cu. Figures B8 and B9 give similar ratios for the 1100C-handling. Here the location for the μ0-zone is the same, only the μ0-maximum within this zone has shifted to lower Ni- and higher Cu-contents. Whereas the direction the μ0-zones between μ0=4000 and μ0=12 000 is roughly the same as for the Permalloy-handling, for this heat treatment the highest initial permeability on the NiFe-line is for more than 78.5 % Ni, but less than 88 % Ni. The influence of the phase separation region on the form of lines of constant permeability is only indicated for alloys of more than 30 % Cu; the saddle minimum for 60 % Ni, 30 % Cu, 10 % Fe as well as the bent ends on the μ0-zones that went towards the FeCu-line are completely absent here. Also noteworthy is that the width of the μ0-comb has become noticeably smaller, as follows from the denser positioning of the contours' layers. This could be because the chosen higher treatment temperature and slow cooling effect a precipitation hardening itself much more noticeable than with the Permalloy-handling with the lower anneal temperature and the air quenching. Figures B10 and B11 show the Hc-values for the two heat treatments. The small Hc-zone developed quite similarly as that of the initial permeability, and this was true for both heat treatments. For the Permalloy-treatment the Hc-minimum moves towards the alloy 81 % Ni, the μ0-maximum towards 78.5 %, whereas for the 1100 °C-treatment the valley of coercive force bends towards 88 % Ni, much as in Fig. B8 the initial permeability does for the same heat treatment. The μ0- and Hc-zones thus develop similarly for each of the two heat treatments, but of course differently for the two heat treatments. Again, one notices a degree of influence of the phase separation region; it is worthy of mention here that the 1100 °C treatment produced a larger zone of smaller Hc-values (0.03) as compared to the Permalloy treatment in which the Hc-minimum is shifted towards smaller Ni and higher Cu-contents. There is nevertheless this fact to take into consideration, that because of the very small remanences in the neighbourhood of the NiCu-line the coercive force is difficult to determine there, this is in contrast to μ0, the measurement of which presents difficulties only as one approaches very small values. Therefore, one could think of circumstances that for 1100 °C treatment (Fig. B11) the site of the Hc-minima within the small zone is also the same as the site of the μ0-maxima in Fig. B8. With that having been shown, the 1100 °C-handling delivered an unambiguous, definite site for the optimum of both magnetic values (μ0 and Hc) for about 60 % Ni, 28 % Cu, whereas for the Permalloy-handling the main effect is exerted only on the initial permeability; while the locations of μ0-maxima have shifted in the direction of the Permalloy-alloys (for about 68 % Ni to 75 % Ni), probably the locations of Hc-minima have gone in the opposite direction, or otherwise expressed: For the 1100 °C-handling the sites of optimums for Hc and μ0 stayed the same, for the Permalloy-handling in comparison both optimum zones moved apart. To decide if this effect is a result of the differing anneal temperatures or of the cooling rate, a series of alloys was annealed one hour at the same temperature of 900 °C, in this series some alloys were again oven cooled, and some were quenched in air. The result was as follows: the location of μ0-maxima within the zone of high permeability alloys remained practically the same for both the 900 °C heat treatment and for the Permalloy treatment, so that the determining factor was not the size of the cooling rate but is credited to the height the anneal temperature. The difference between both heat treatments for 900C consists thusly, that the width of the μ0-ridges for slow cooling is smaller than for the air-cooled, particularly for low Ni- and high Cu- contents. The explanation for this might therefore again be sought in the differing actions of precipitation-hardening in the neighbourhood of the mixed phase zone, which for slow cooling must become stronger than for quenching in which the precipitation is suppressed; therefore, the zone of higher permeability, that is, smaller coercive force, must become constricted with increased precipitation-hardening.
Figures B12 and B13 give the lines of constant induction at H=10 Oe, for the two heat treatments (Permalloy and 1100 °C treatment). Here the locations for the μ0-contours shown for lower Ni-contents (about 40 % Ni) are only implied, which perhaps alloys might leave for the same magnitude of magnetic field strength of 10 Oe, the values for the higher permeability alloys (for higher Ni content) having gone to saturation, for alloys with smaller Ni contents having not. Possibly the proximity of the phase separation region is responsible for the shapes of the curves, which shapes are still not exactly known for room-temperature in this zone. Apart from this, the locations of the contour lines for the two heat treatments are nearly the same, as the height of the saturation values depends only a little on the heat treatment – irrespective of the formation of an ordered atomic distribution; in contrast it is known that the ease of the magnetization, that is the field strength for a specified induction (that is, the permeability), depends strongly on the heat treatment.
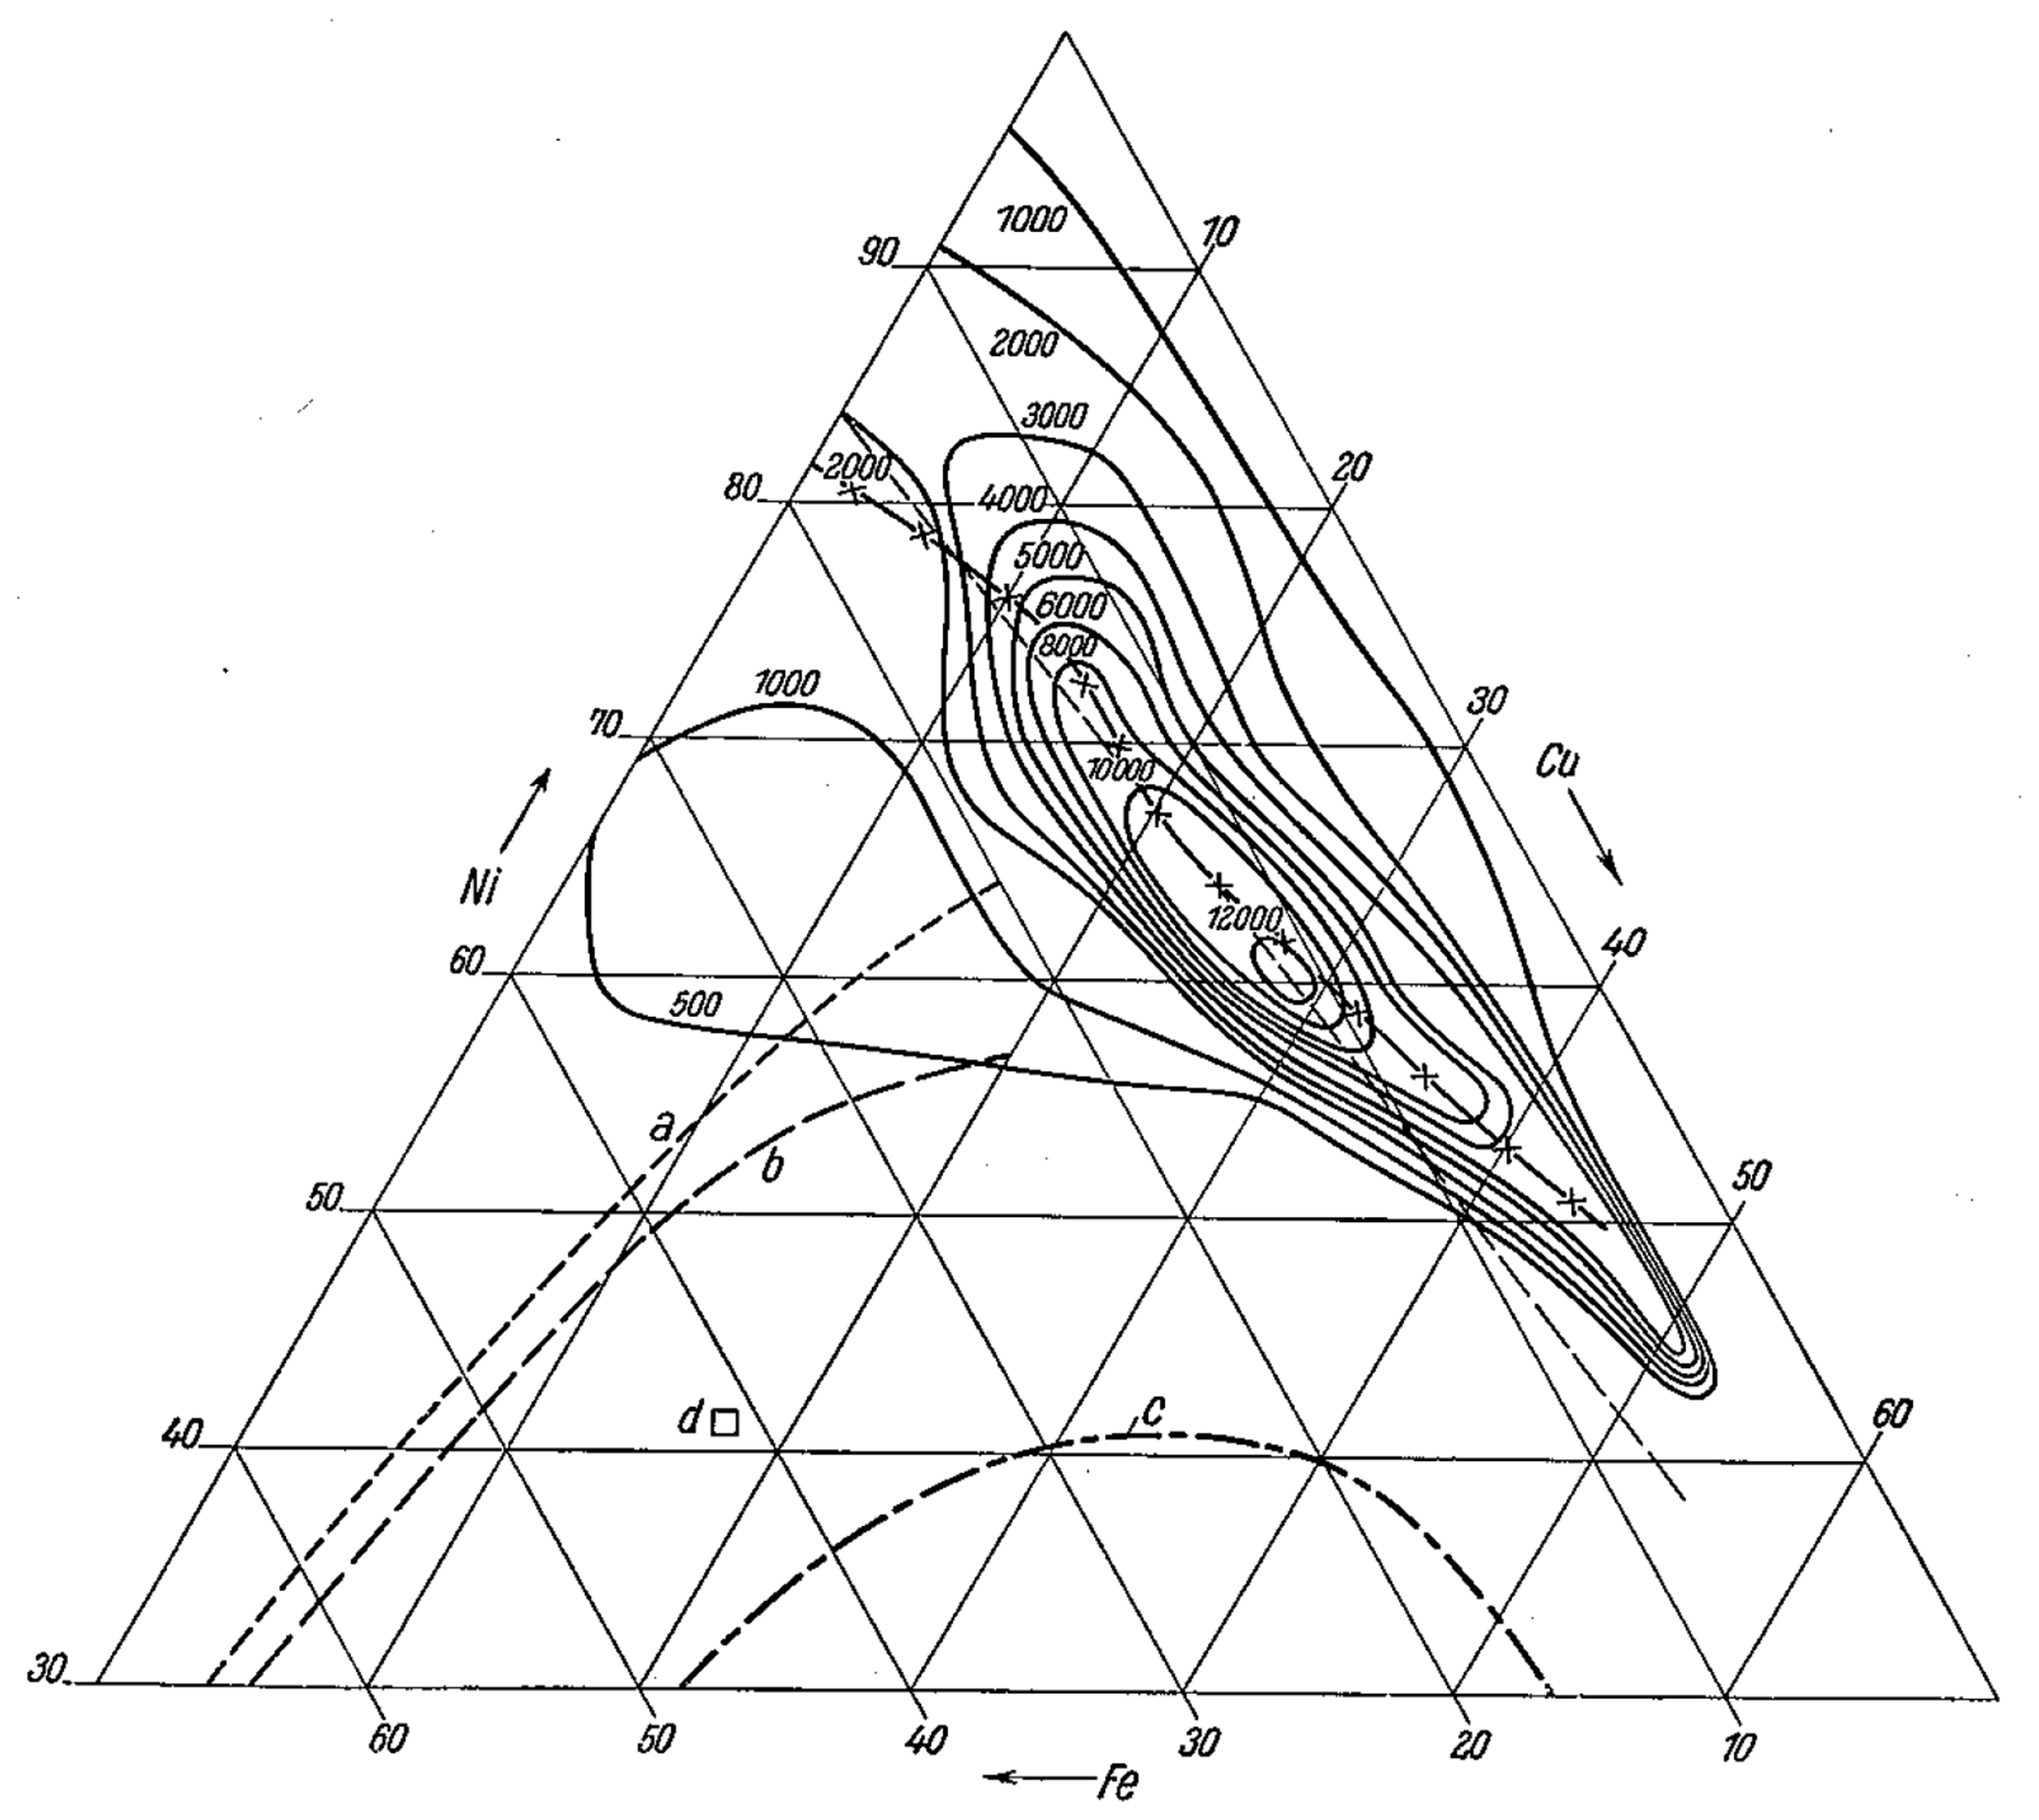
Figure B8Lines of constant initial permeability (–) and line for magnetostriction null in the FeNiCu system; (1100 °C-handling) (); Line of constant Ni:Fe ratio (–); Boundaries of phase separation region from other authors (a, b, c, d).
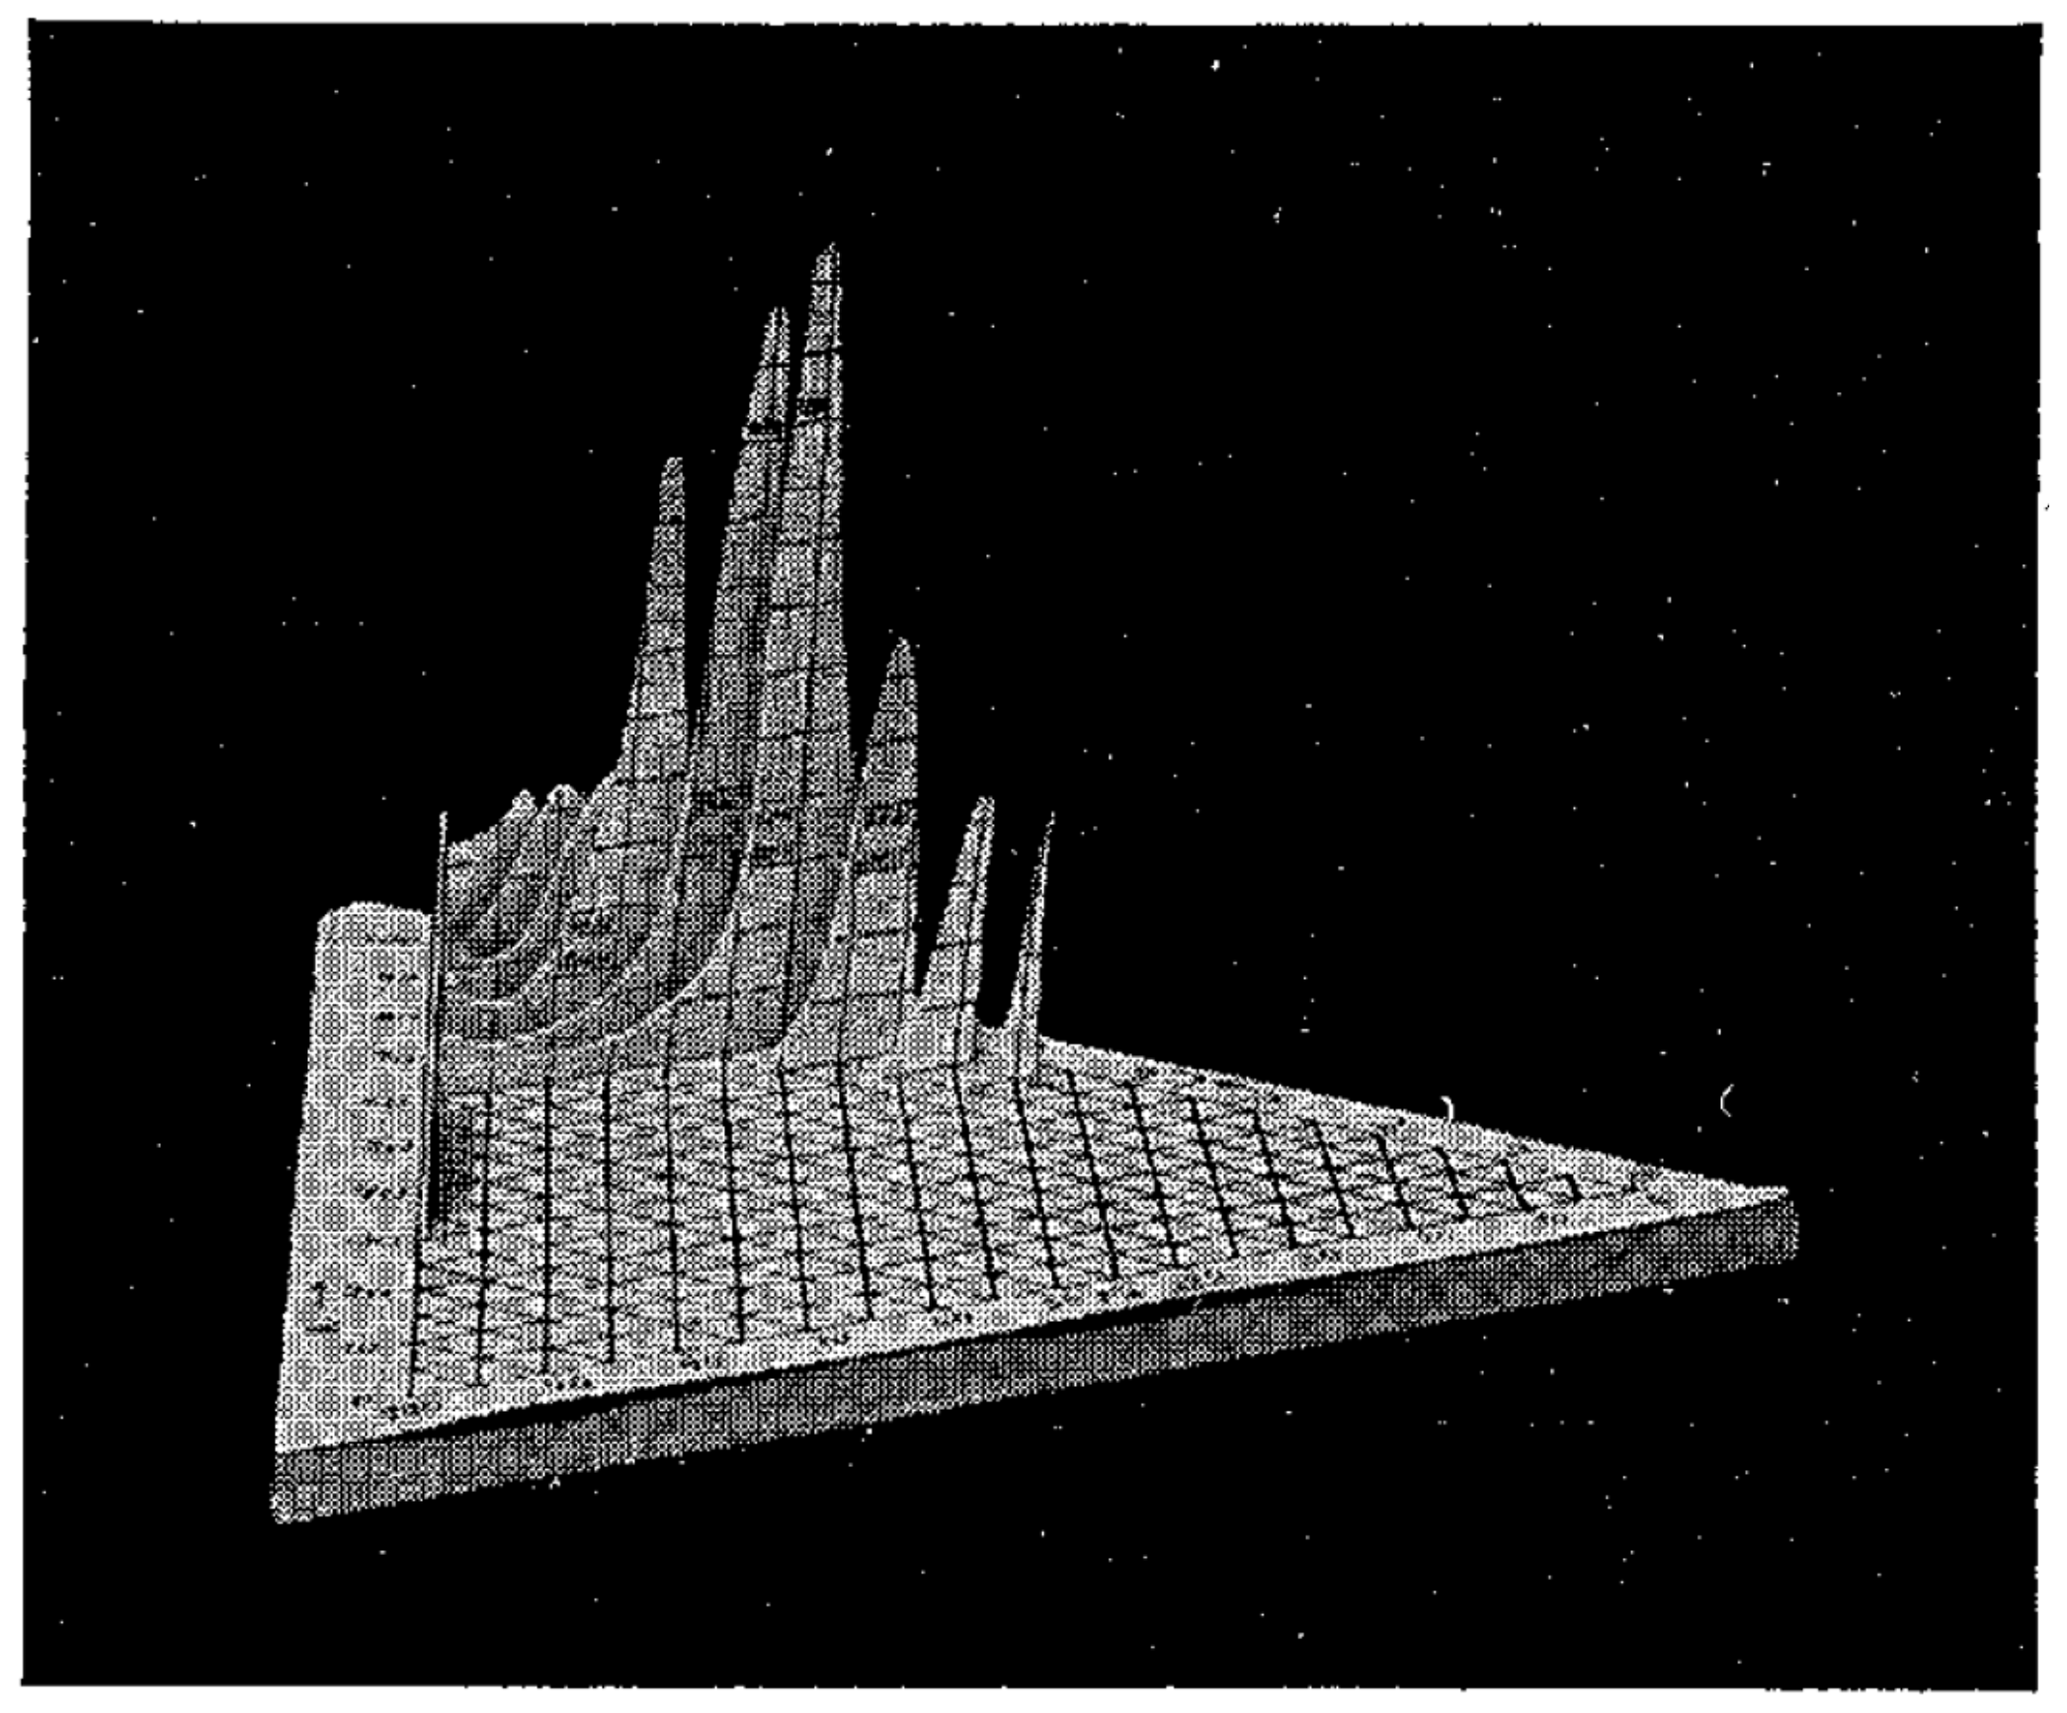
Figure B9Spatial drawing of Fig. B8; ordinate = initial permeability.
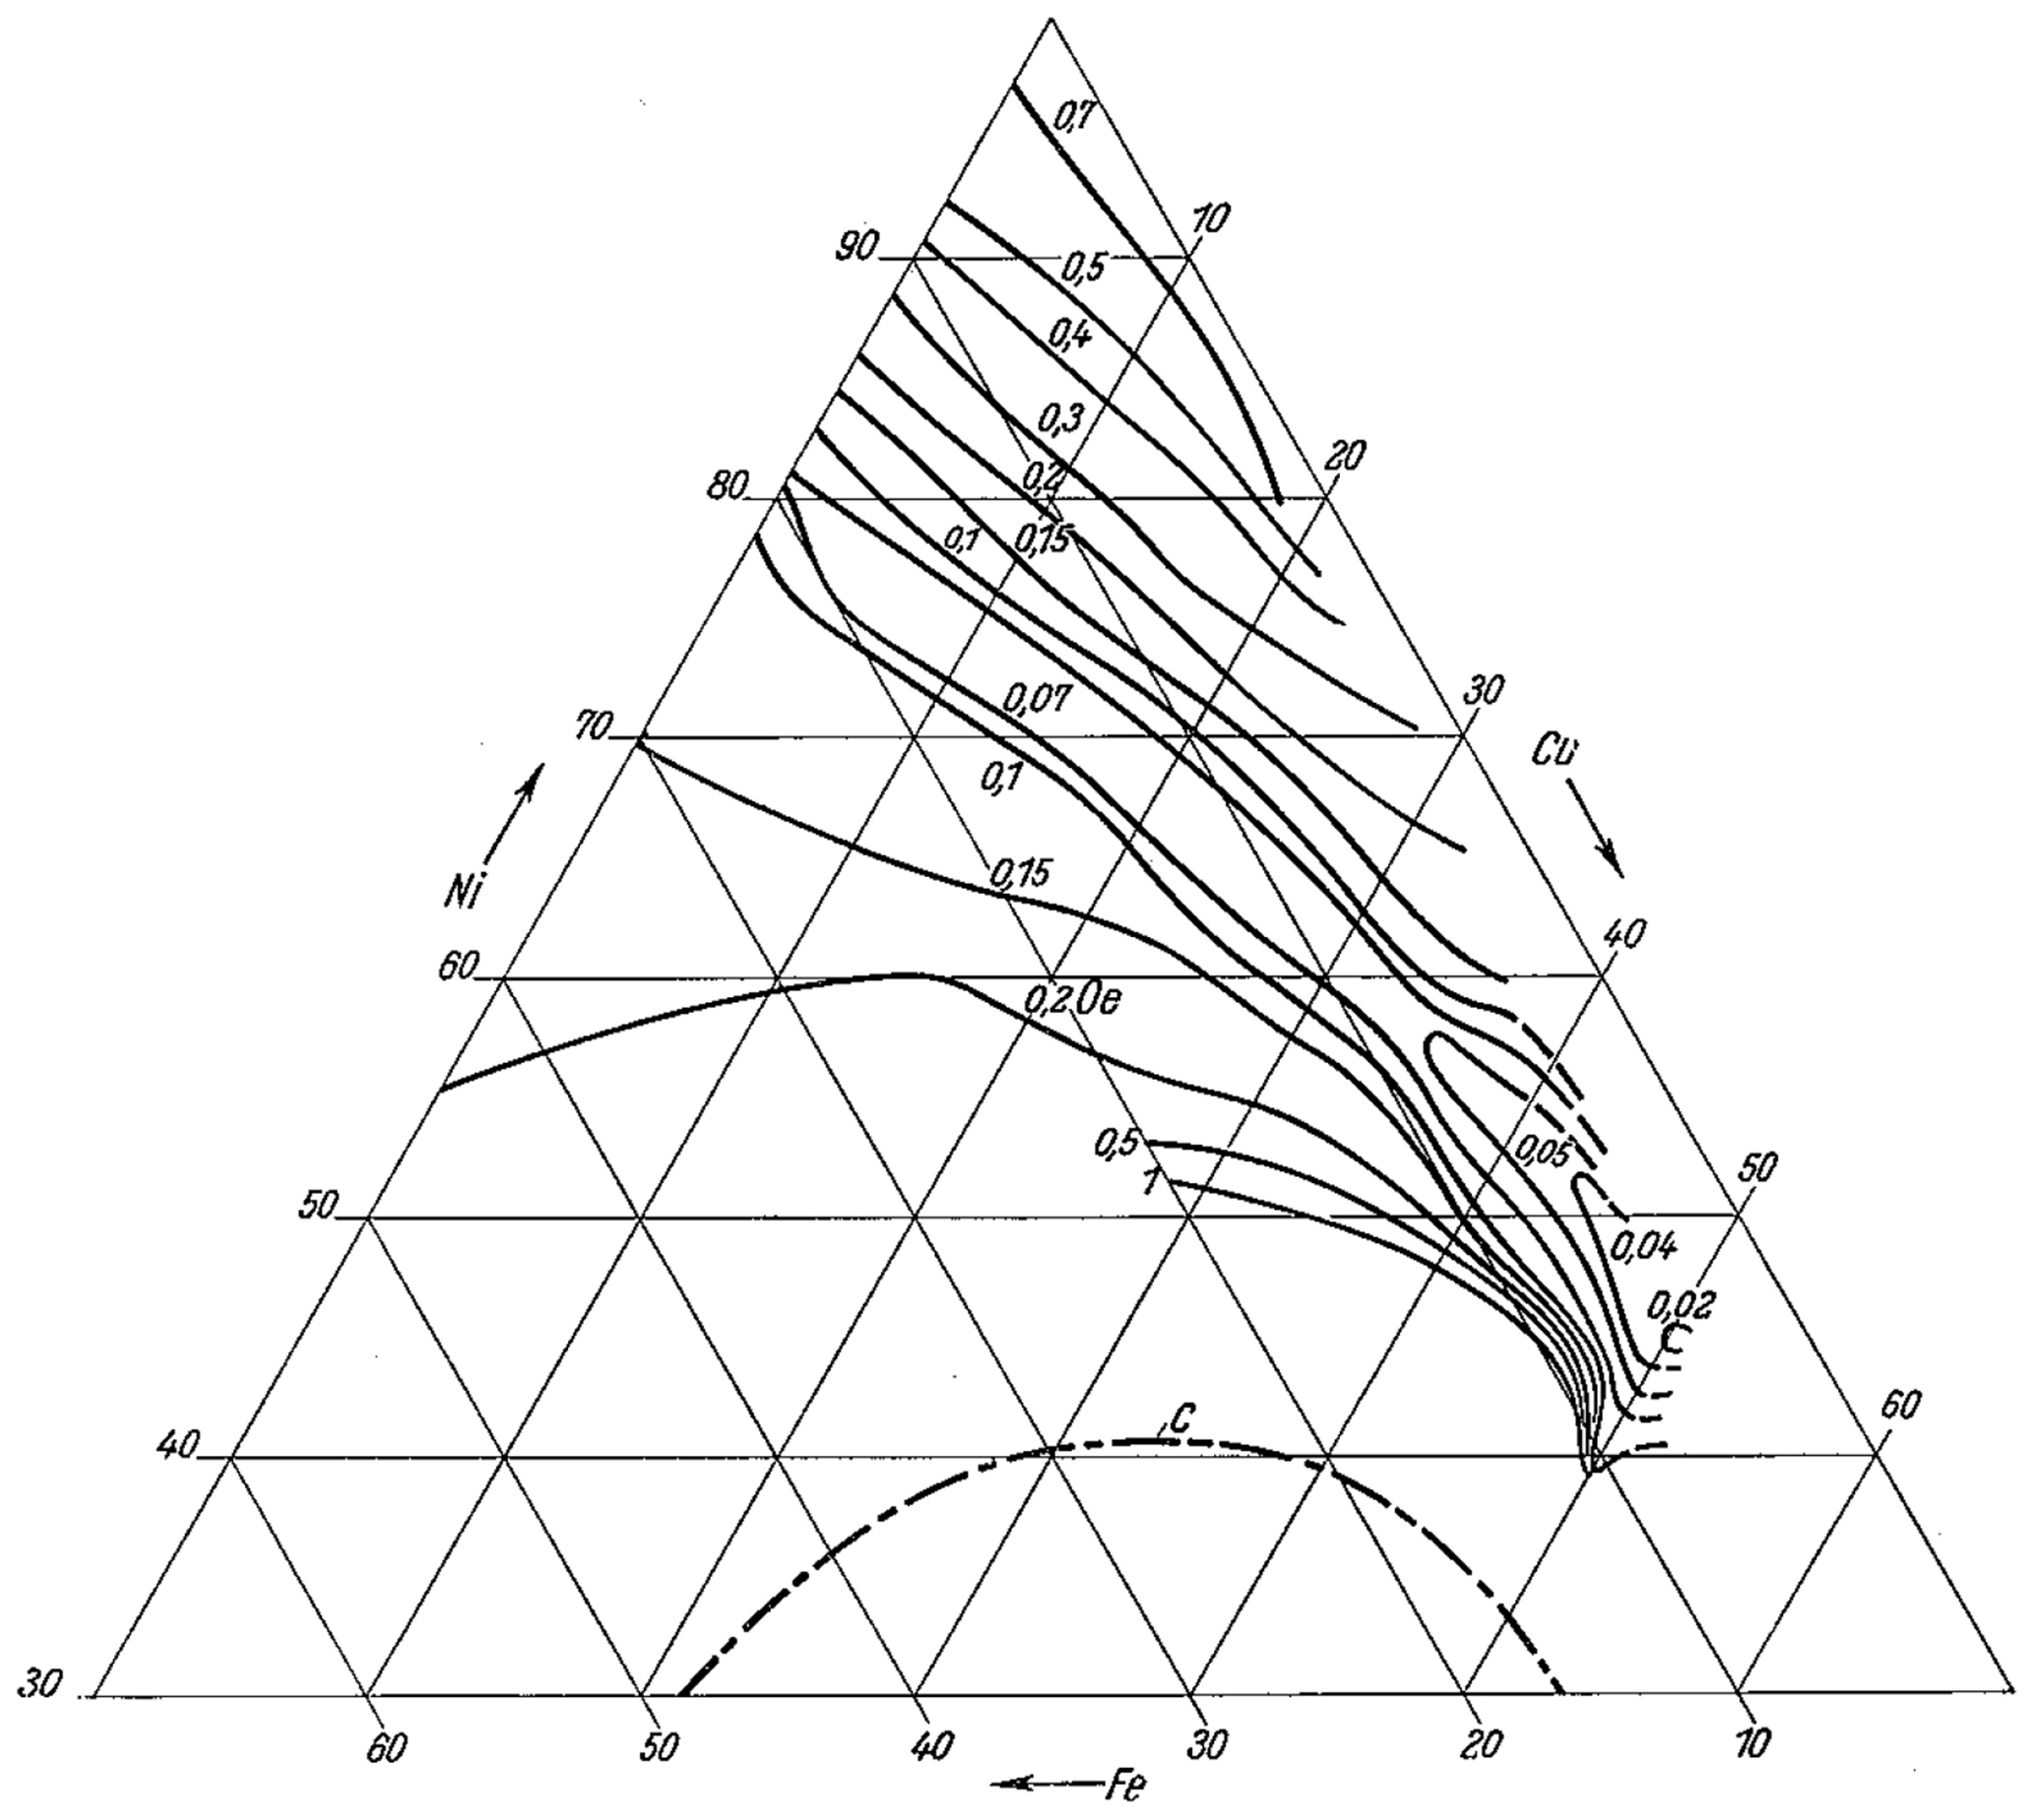
Figure B10Lines of constant coercivity (–) in the FeNiCu system; Permalloy-handling.
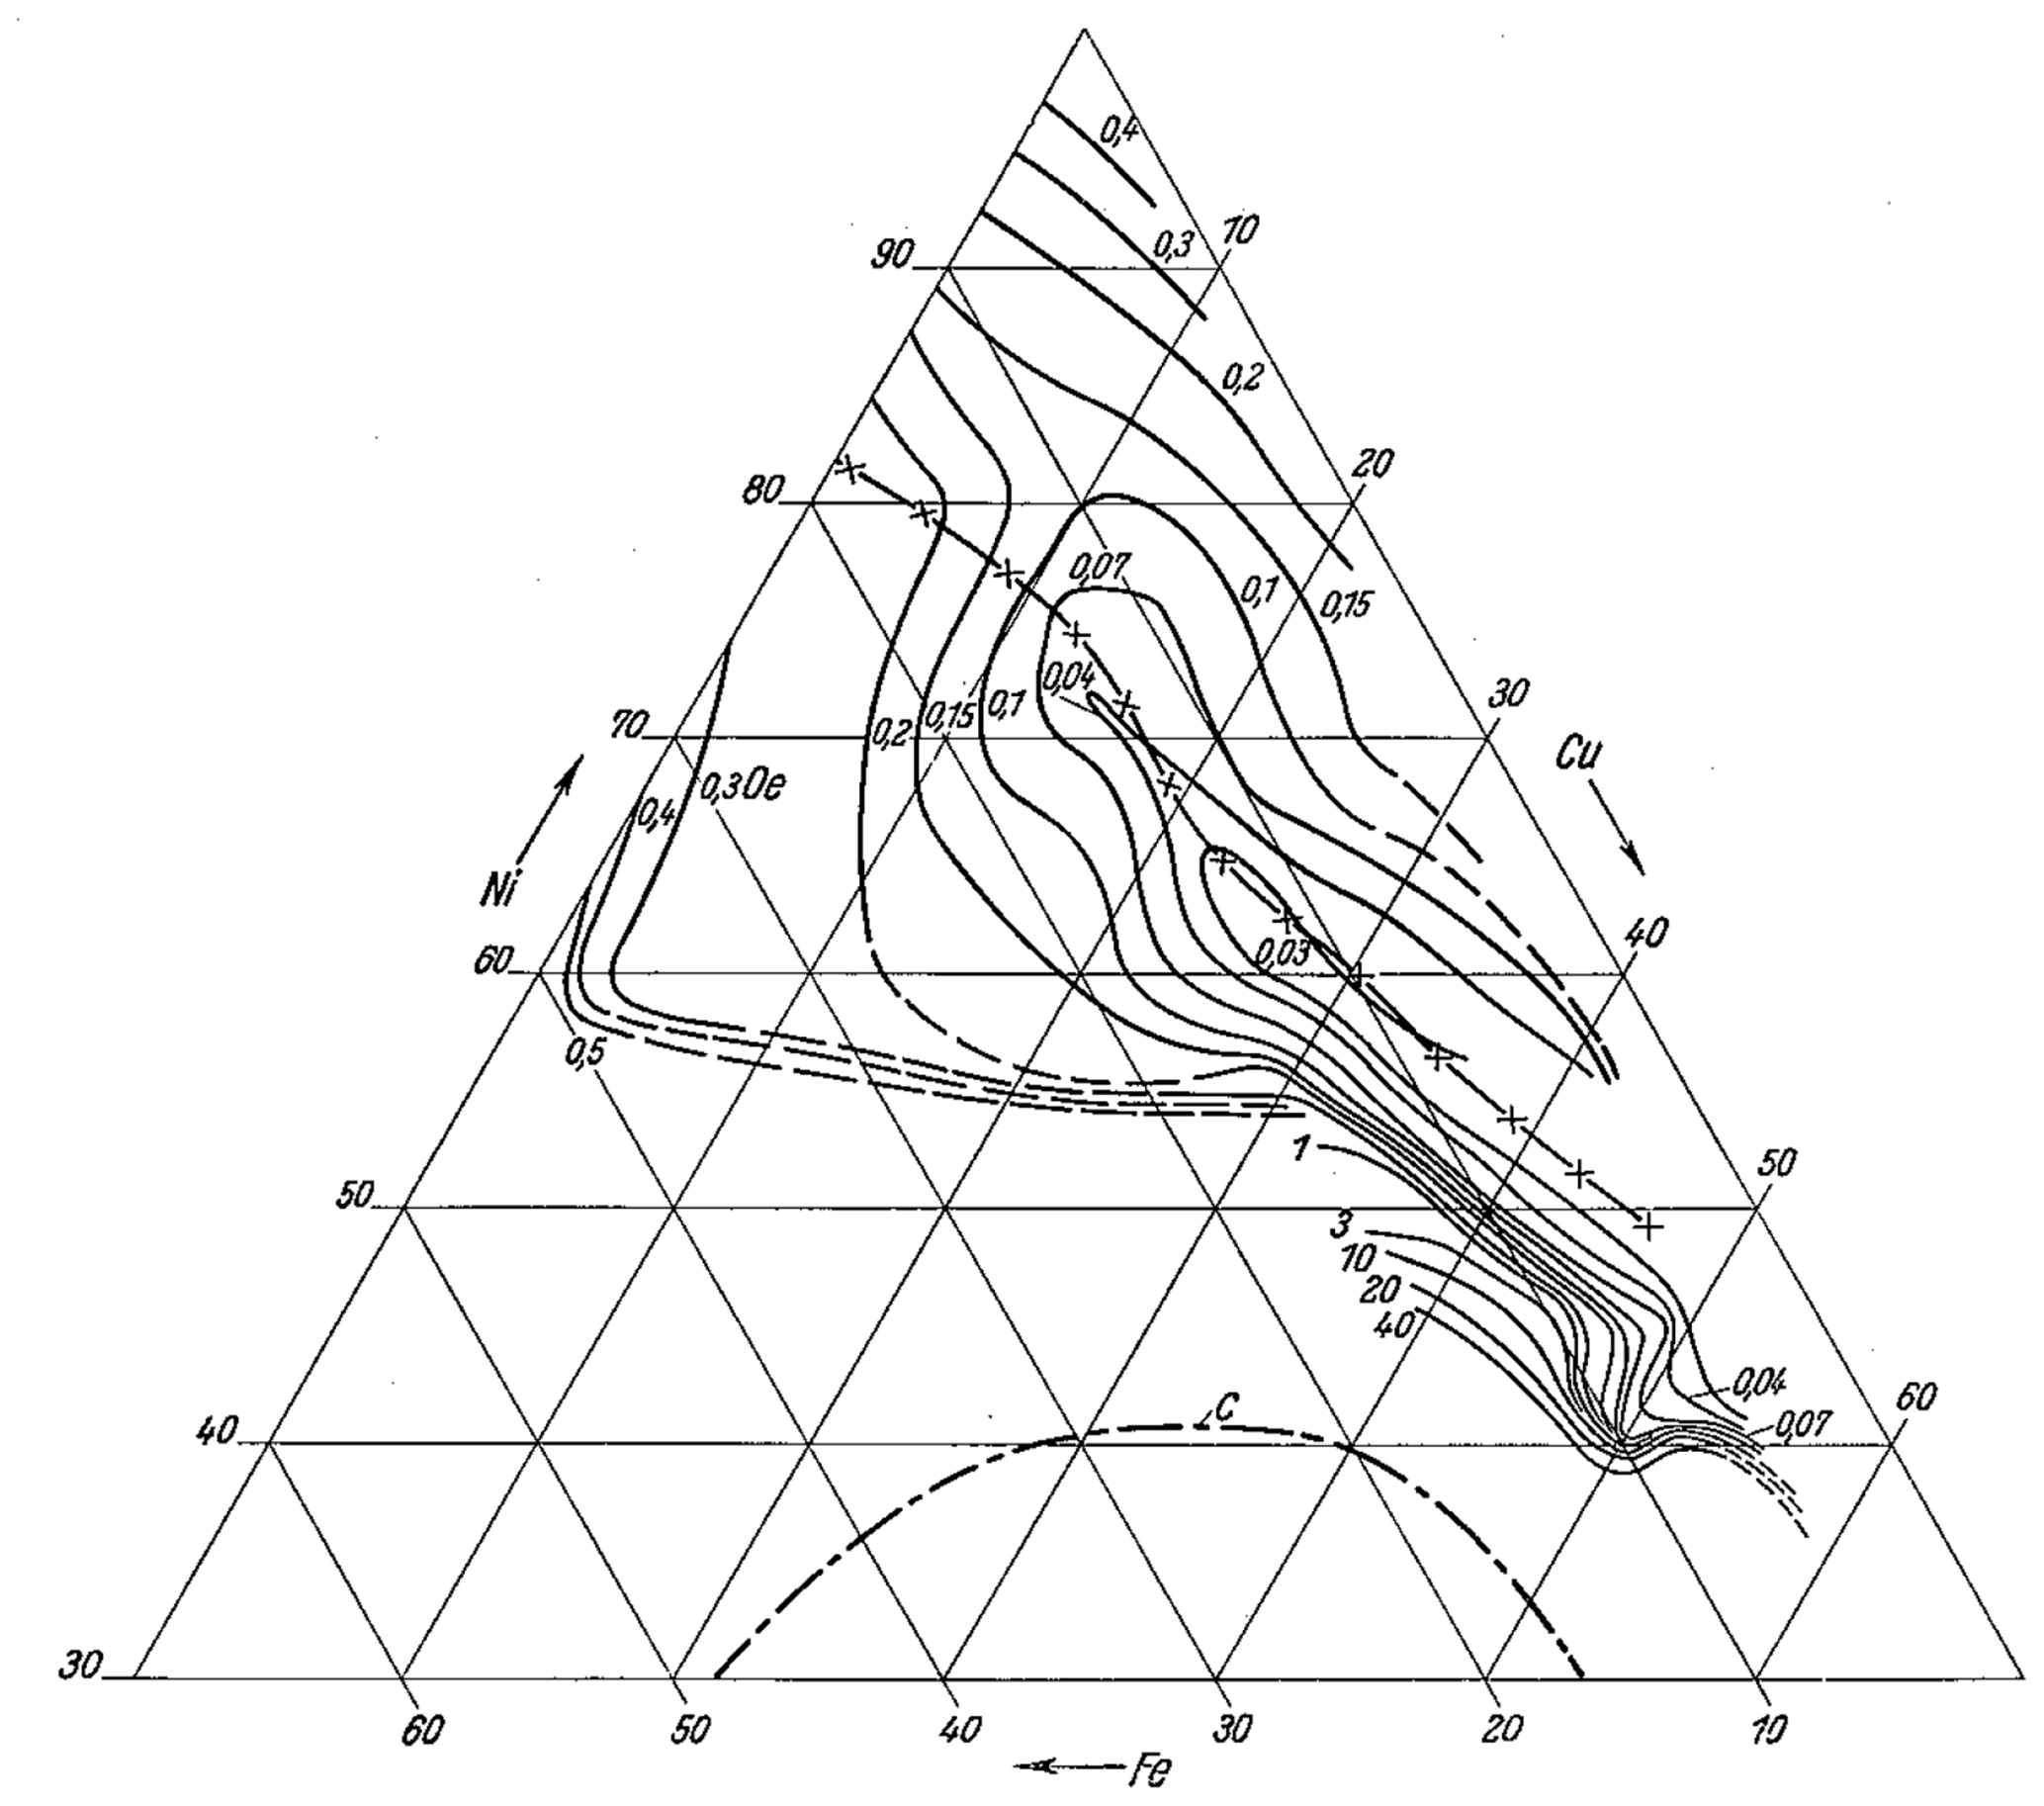
Figure B11Lines of constant coercivity (–) and line of zero magnetostriction in the FeNiCu system (); 1100 °C-handling.
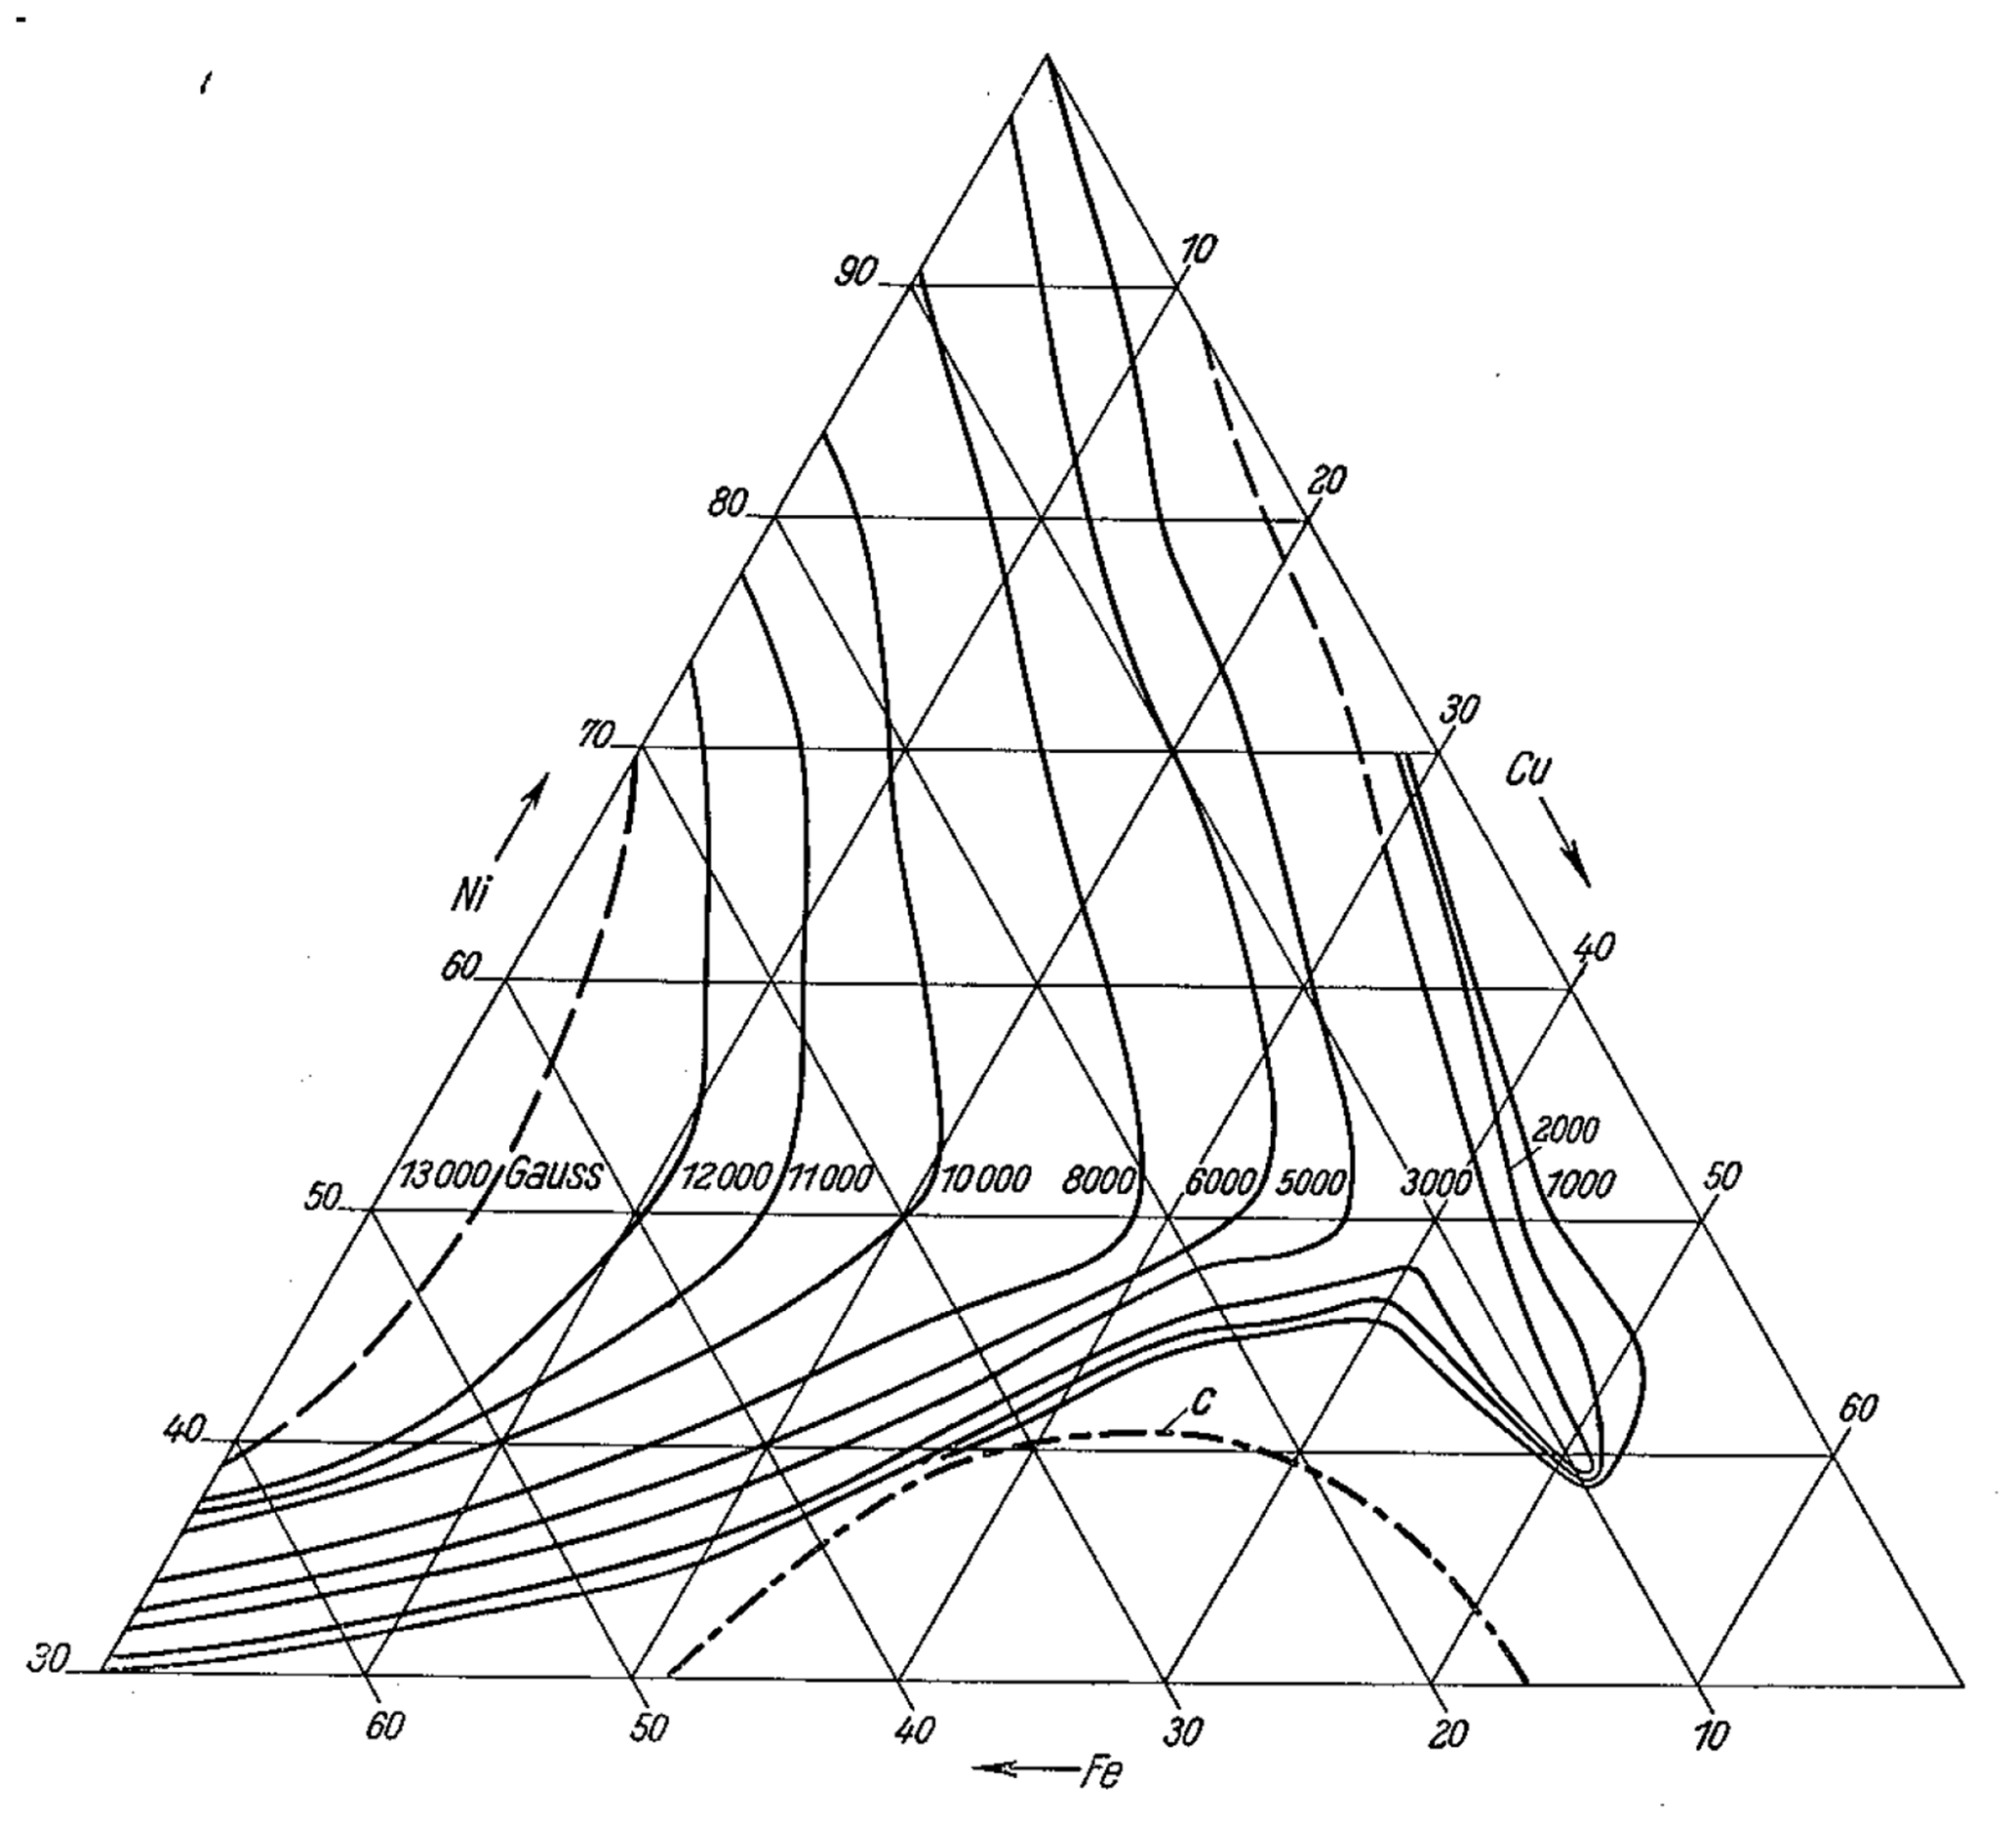
Figure B12Lines of constant induction (in Gauss) (–) for H=10 Oe in the FeNiCu system; Permalloy-handling.
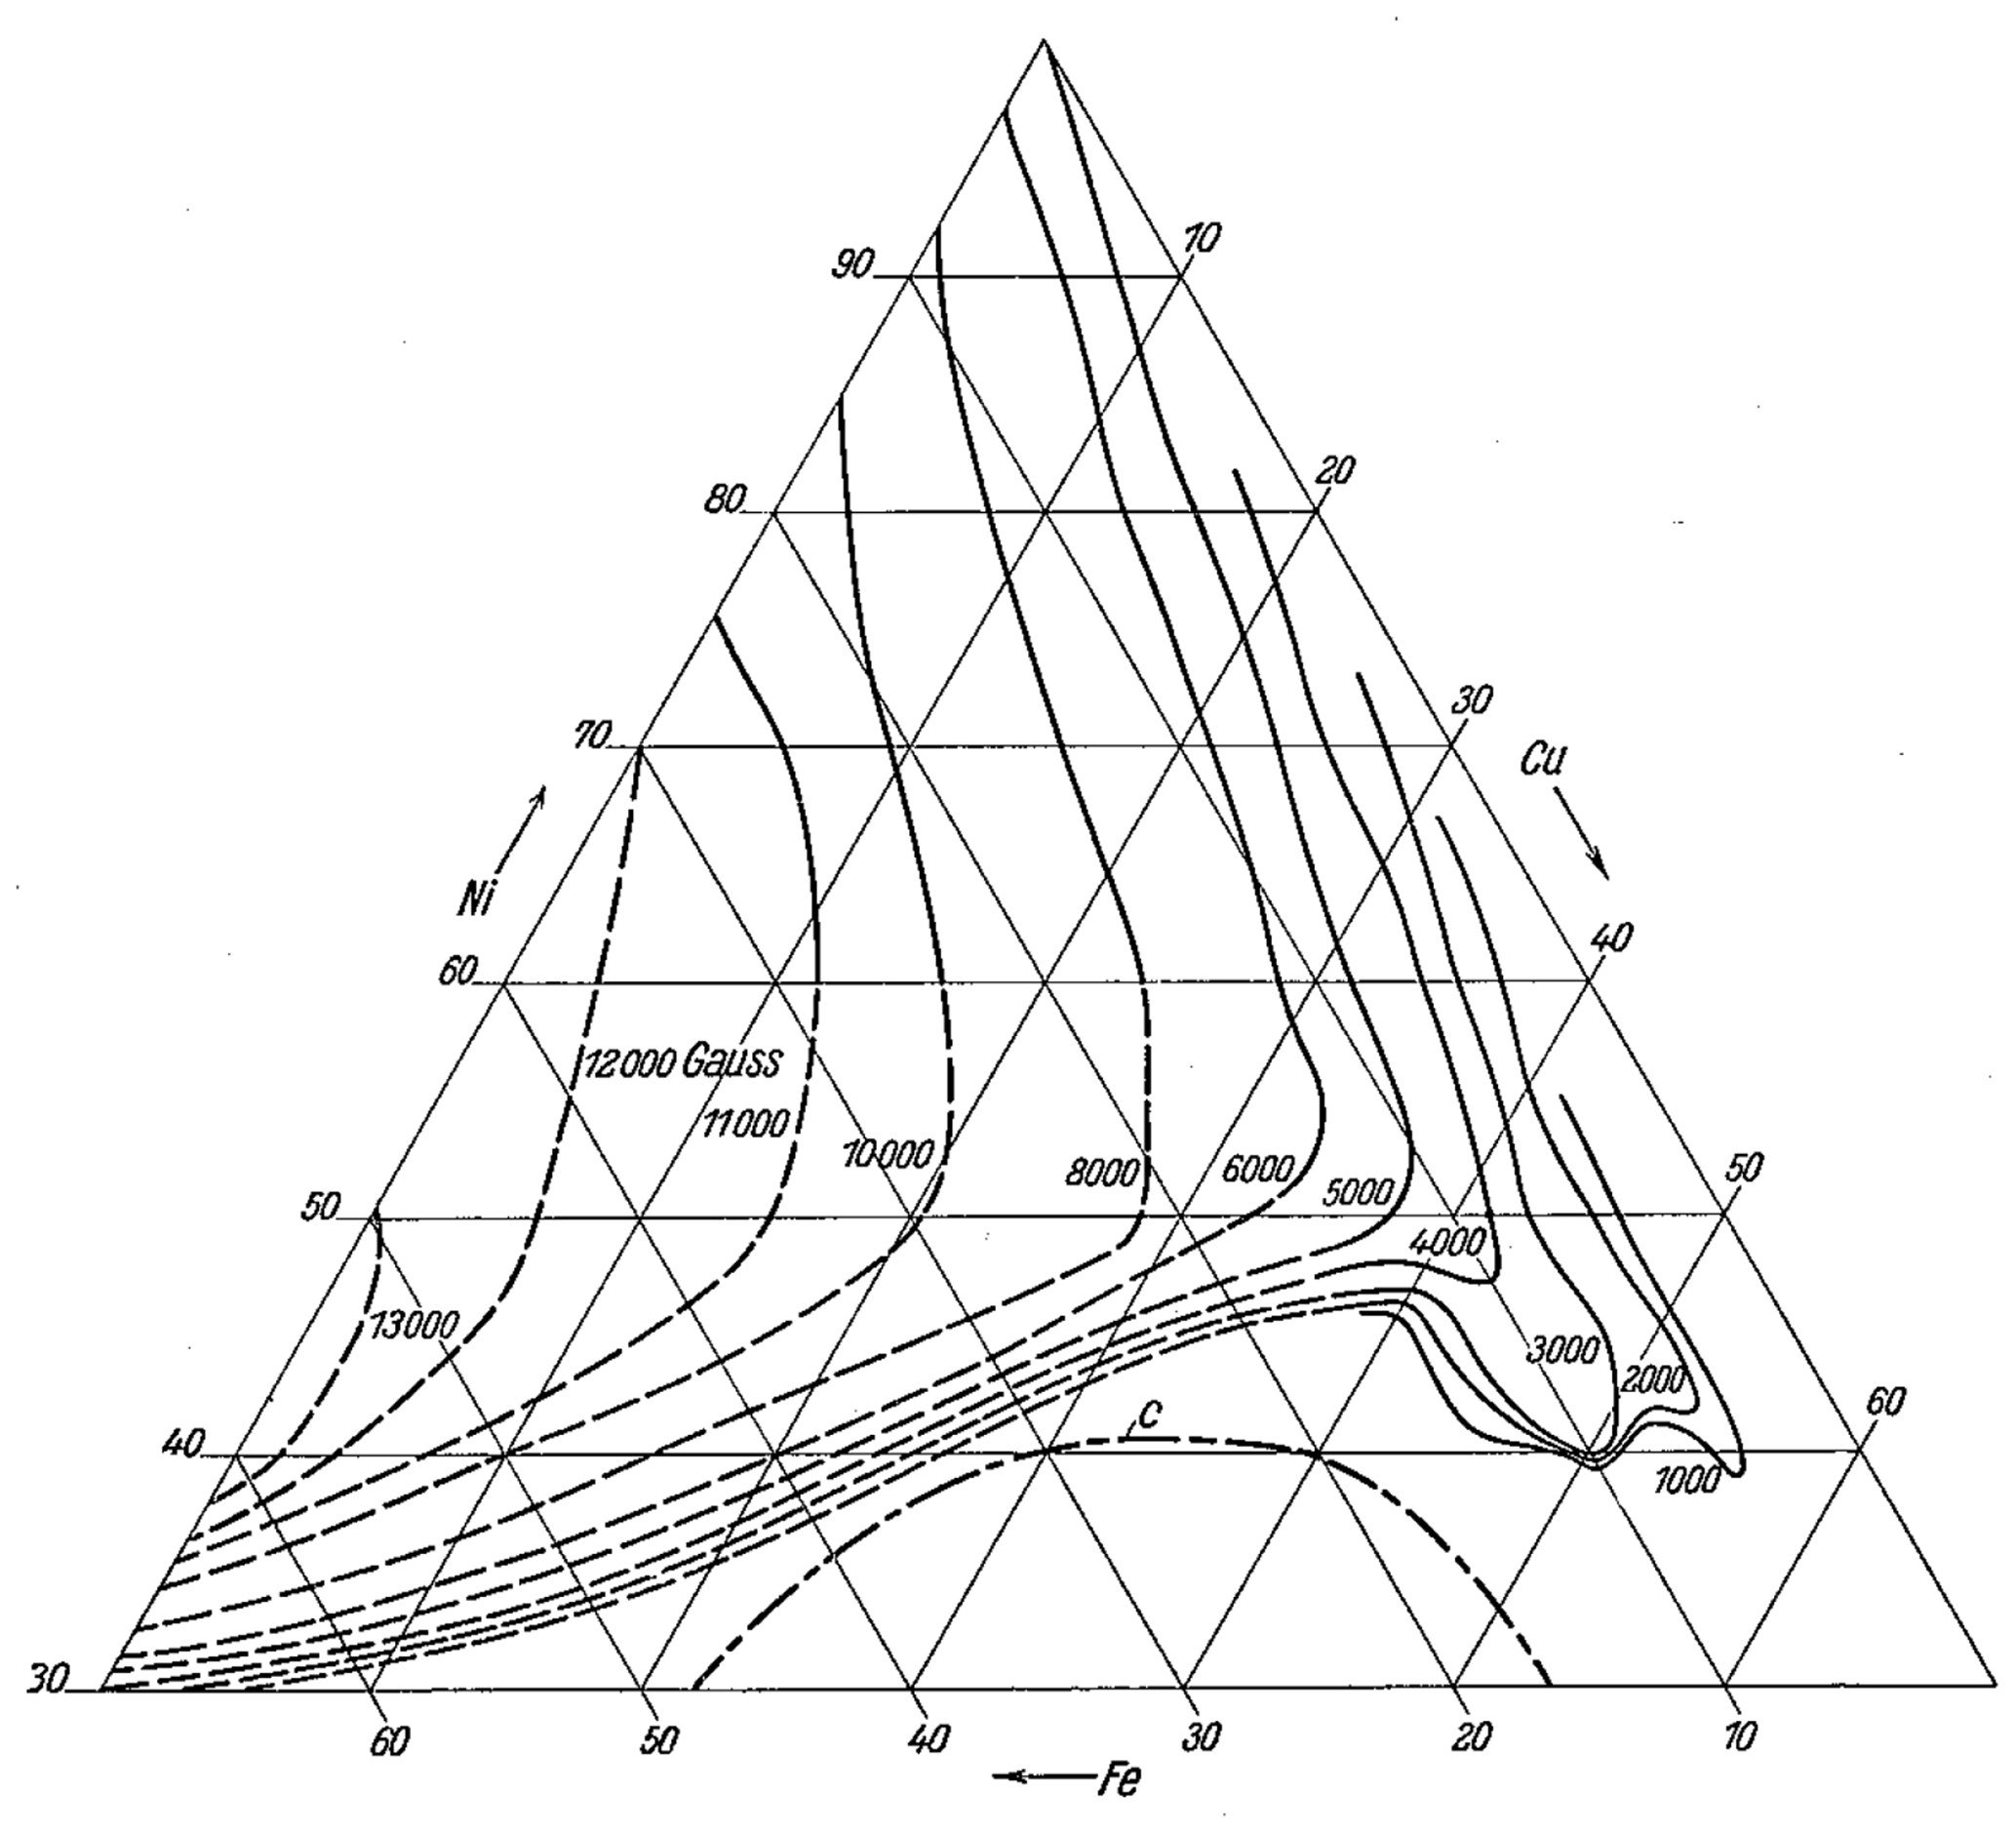
Figure B13Lines of constant induction (in Gauss) (–) for H=10 Oe in the FeNiCu system; 1100 °C-handling.
B1.7 Changing the heat treatment
This becomes especially clear when one follows the trace of μ0 or of Hc along the highly permeable zones. Thus, because of the different positions of the optimal values of μ0 and Hc, in every case there has to be a boundary at which both heat treatments yield the same values for μ0 and for Hc. Figure B14 presents each of the achieved maximum values of μ0 for each of the heat treatments as a function of the Cu content while Fig. B15 gives the same for the Hc values. While the associated Ni-contents for both curves are not entirely the same, it is clearly apparent that for μ0 the boundary is at 22 % Cu and for Hc the boundary is at 13 % Cu; the reason being that the contour lines of the μ0 crests are at that place coincidentally parallel to the lines of constant Cu content as is apparent from Figs. B6, B8 and B11. This is only one quantitative indication for the already mentioned fact, that for high Ni and low Cu-contents the Permalloy treatment gives the better magnetic values, while for low Ni- and high Cu-contents it is the 1100 °C-handling.
B1.8 Reproducibility of the measurements on sheet metal strips
Some evidence is shown in Fig. B16, for the good reproducibility of measurements regarding the locations of μ0-maxima cf. the Hc-minima, for the section 70 % Ni and 1100 °C-treatment. μ0 and Hc are presented as functions of the Cu-content, once for the sheet metal rings used and once for the later-on treated sheet metal strips, on which the associated magnetostriction measurements were done. The two large drawn-in circles represent the μ0-values of the rings that were annealed together with the sheet metal strips; the conformity between the values and the curves is, as shown, very good with respect to the positions of the optima, even though regarding the magnitude of the magnetic values there are present, as previously mentioned, somewhat larger fluctuations.
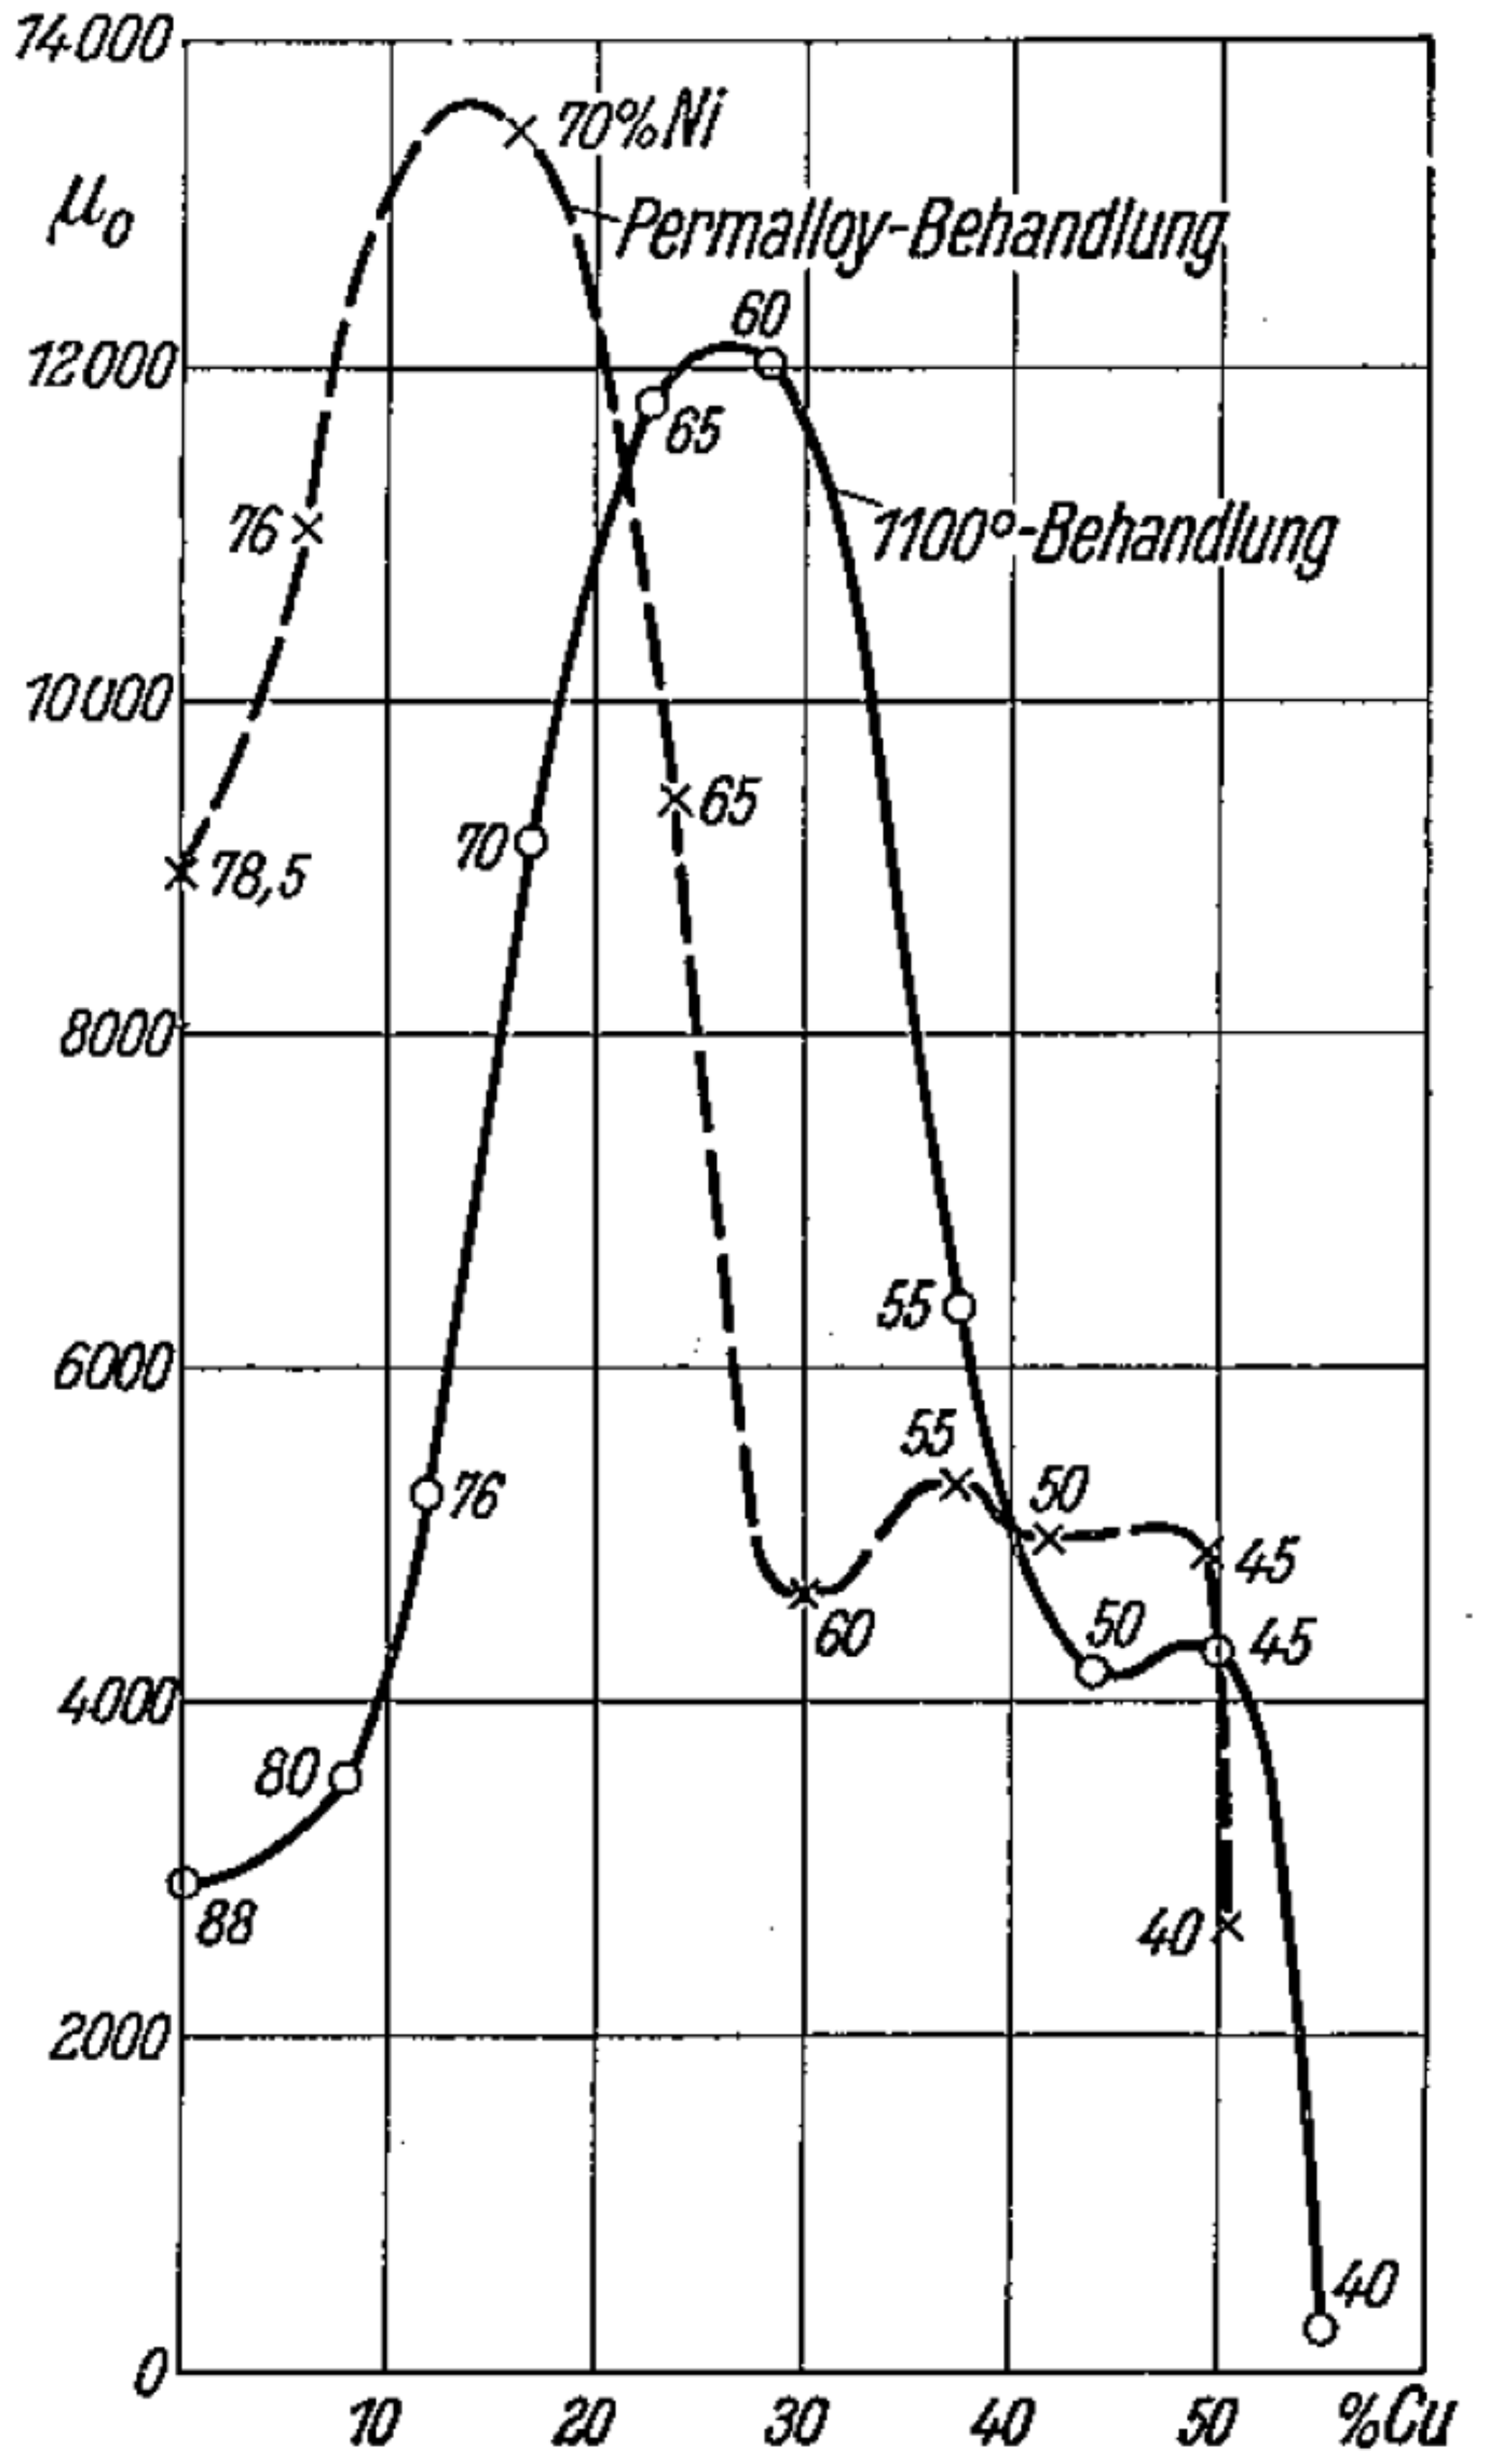
Figure B14Points of μ0-maxima as function of Cu-content (the figures on the curves signify the Ni-content).
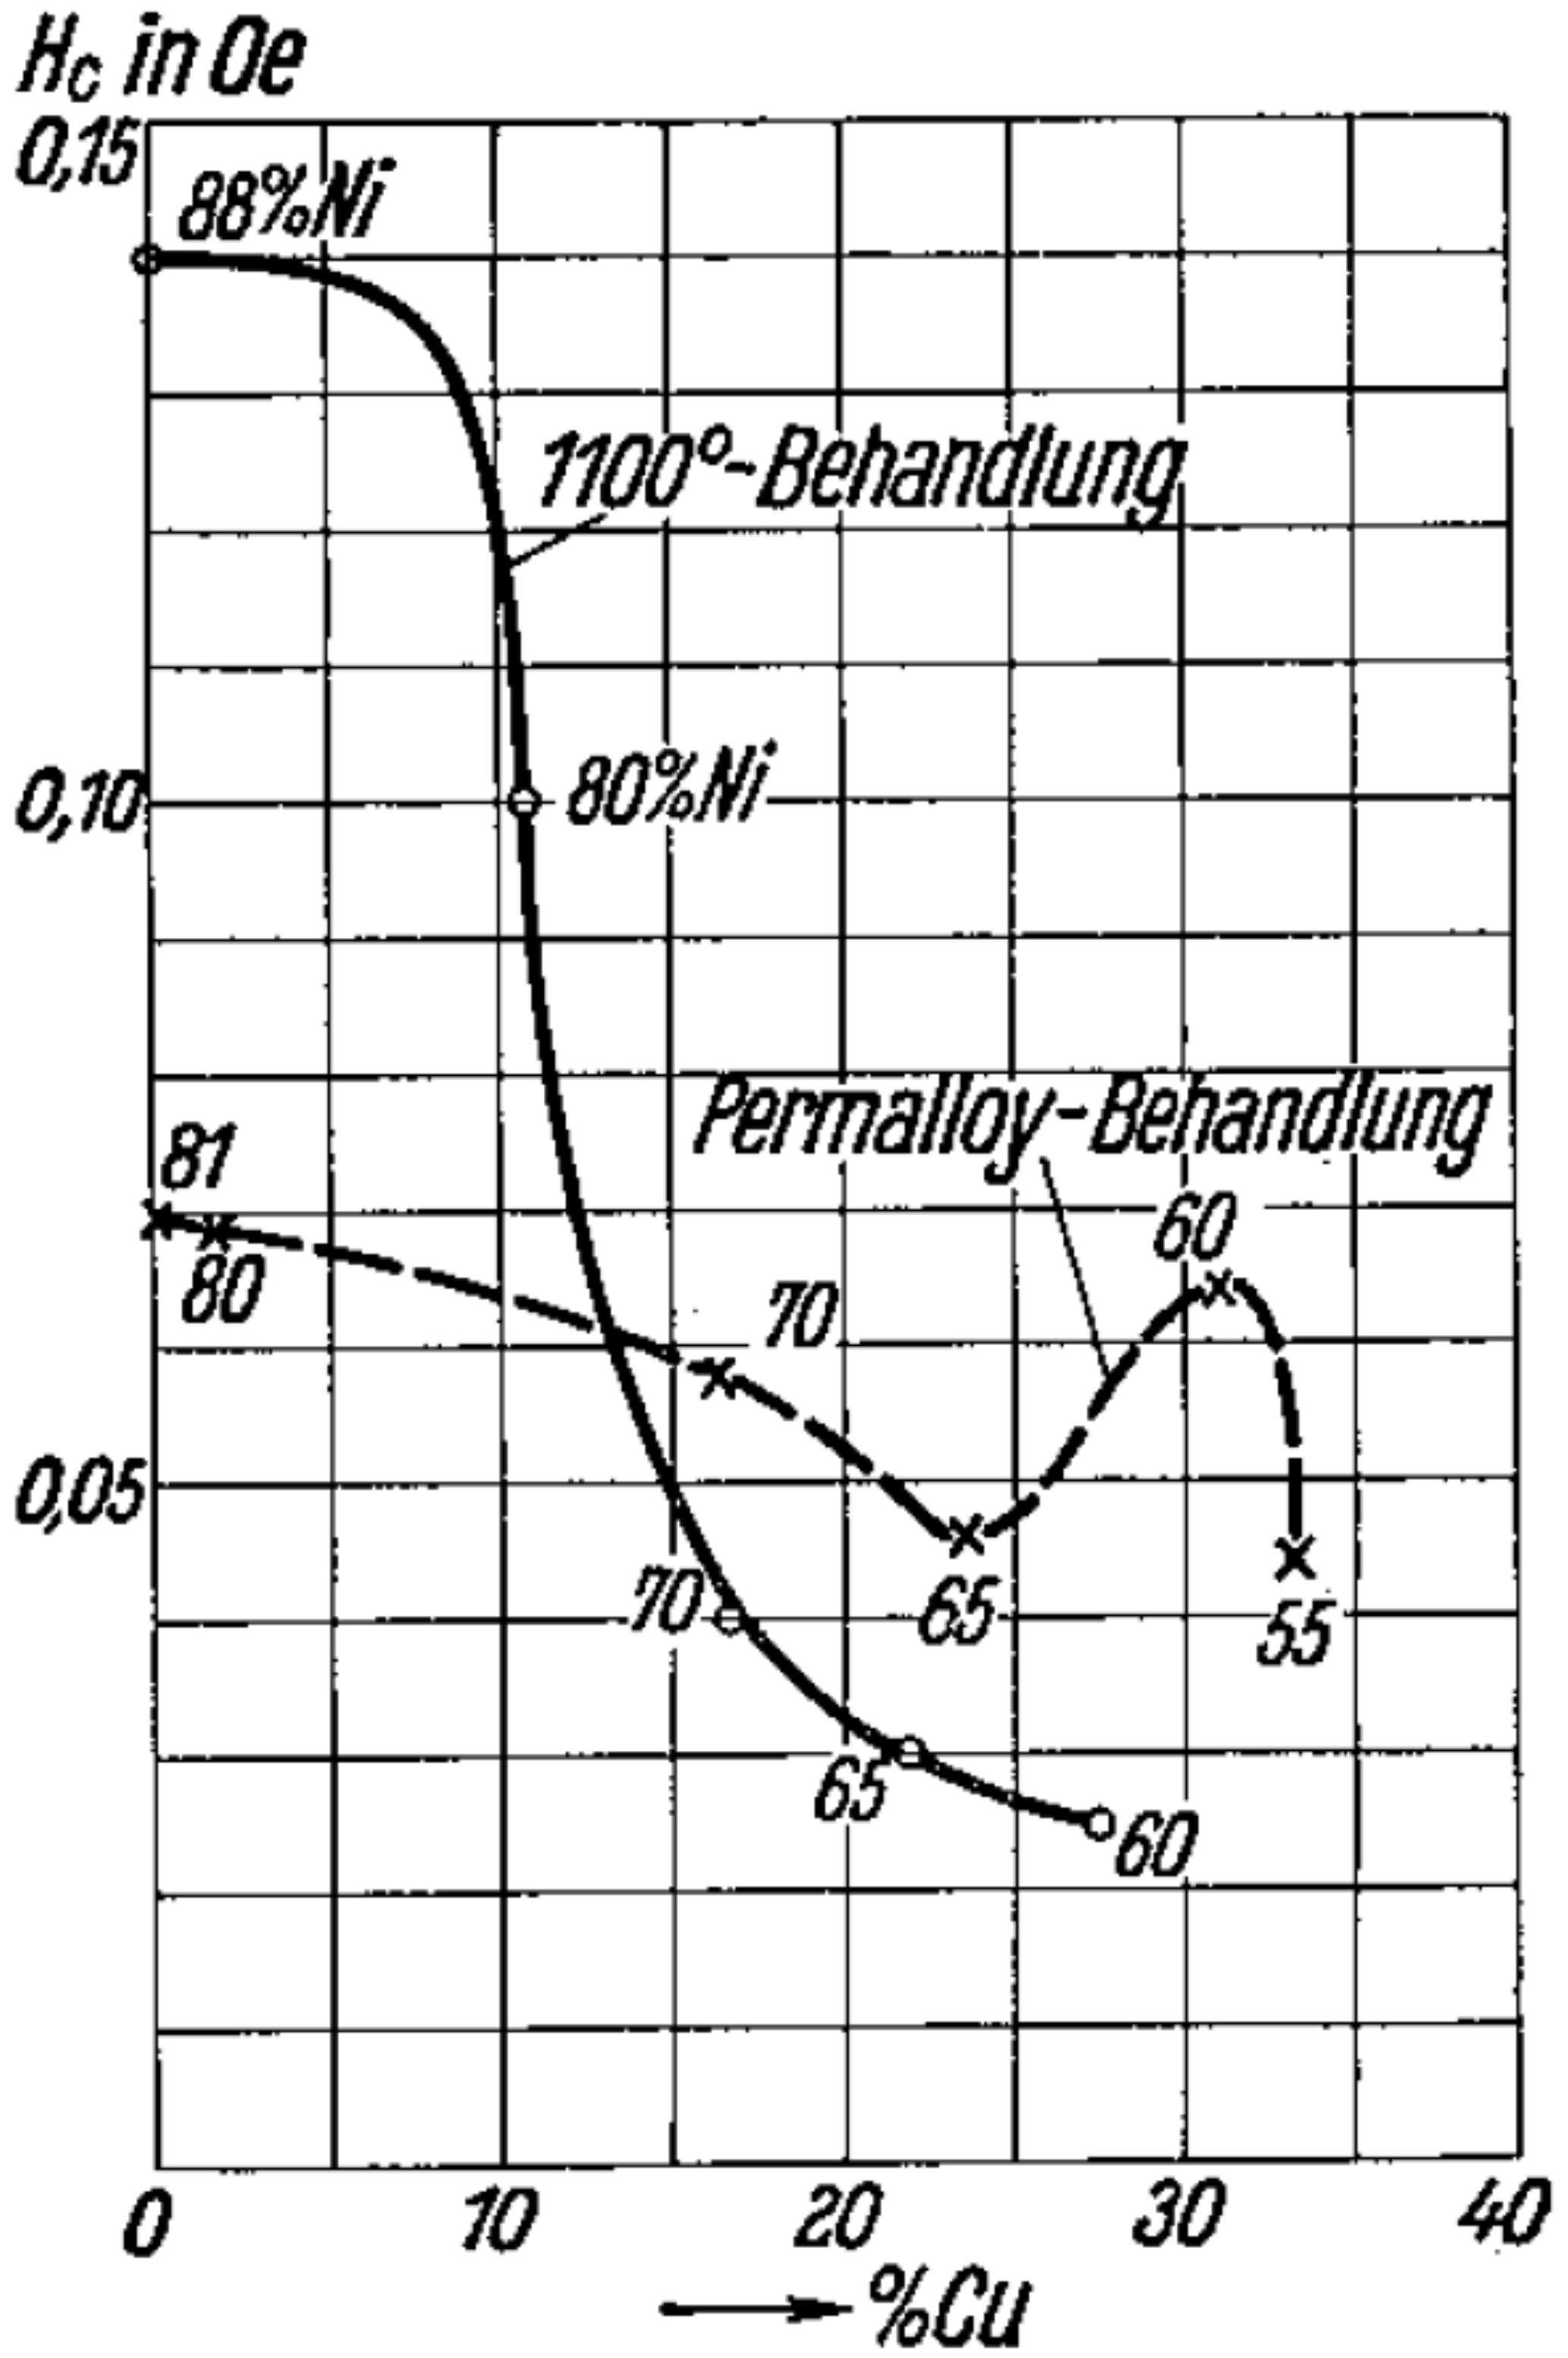
Figure B15Points of minimum coercive force Hc, as function of Cu-content (the figures on the curves signify the Ni-content).
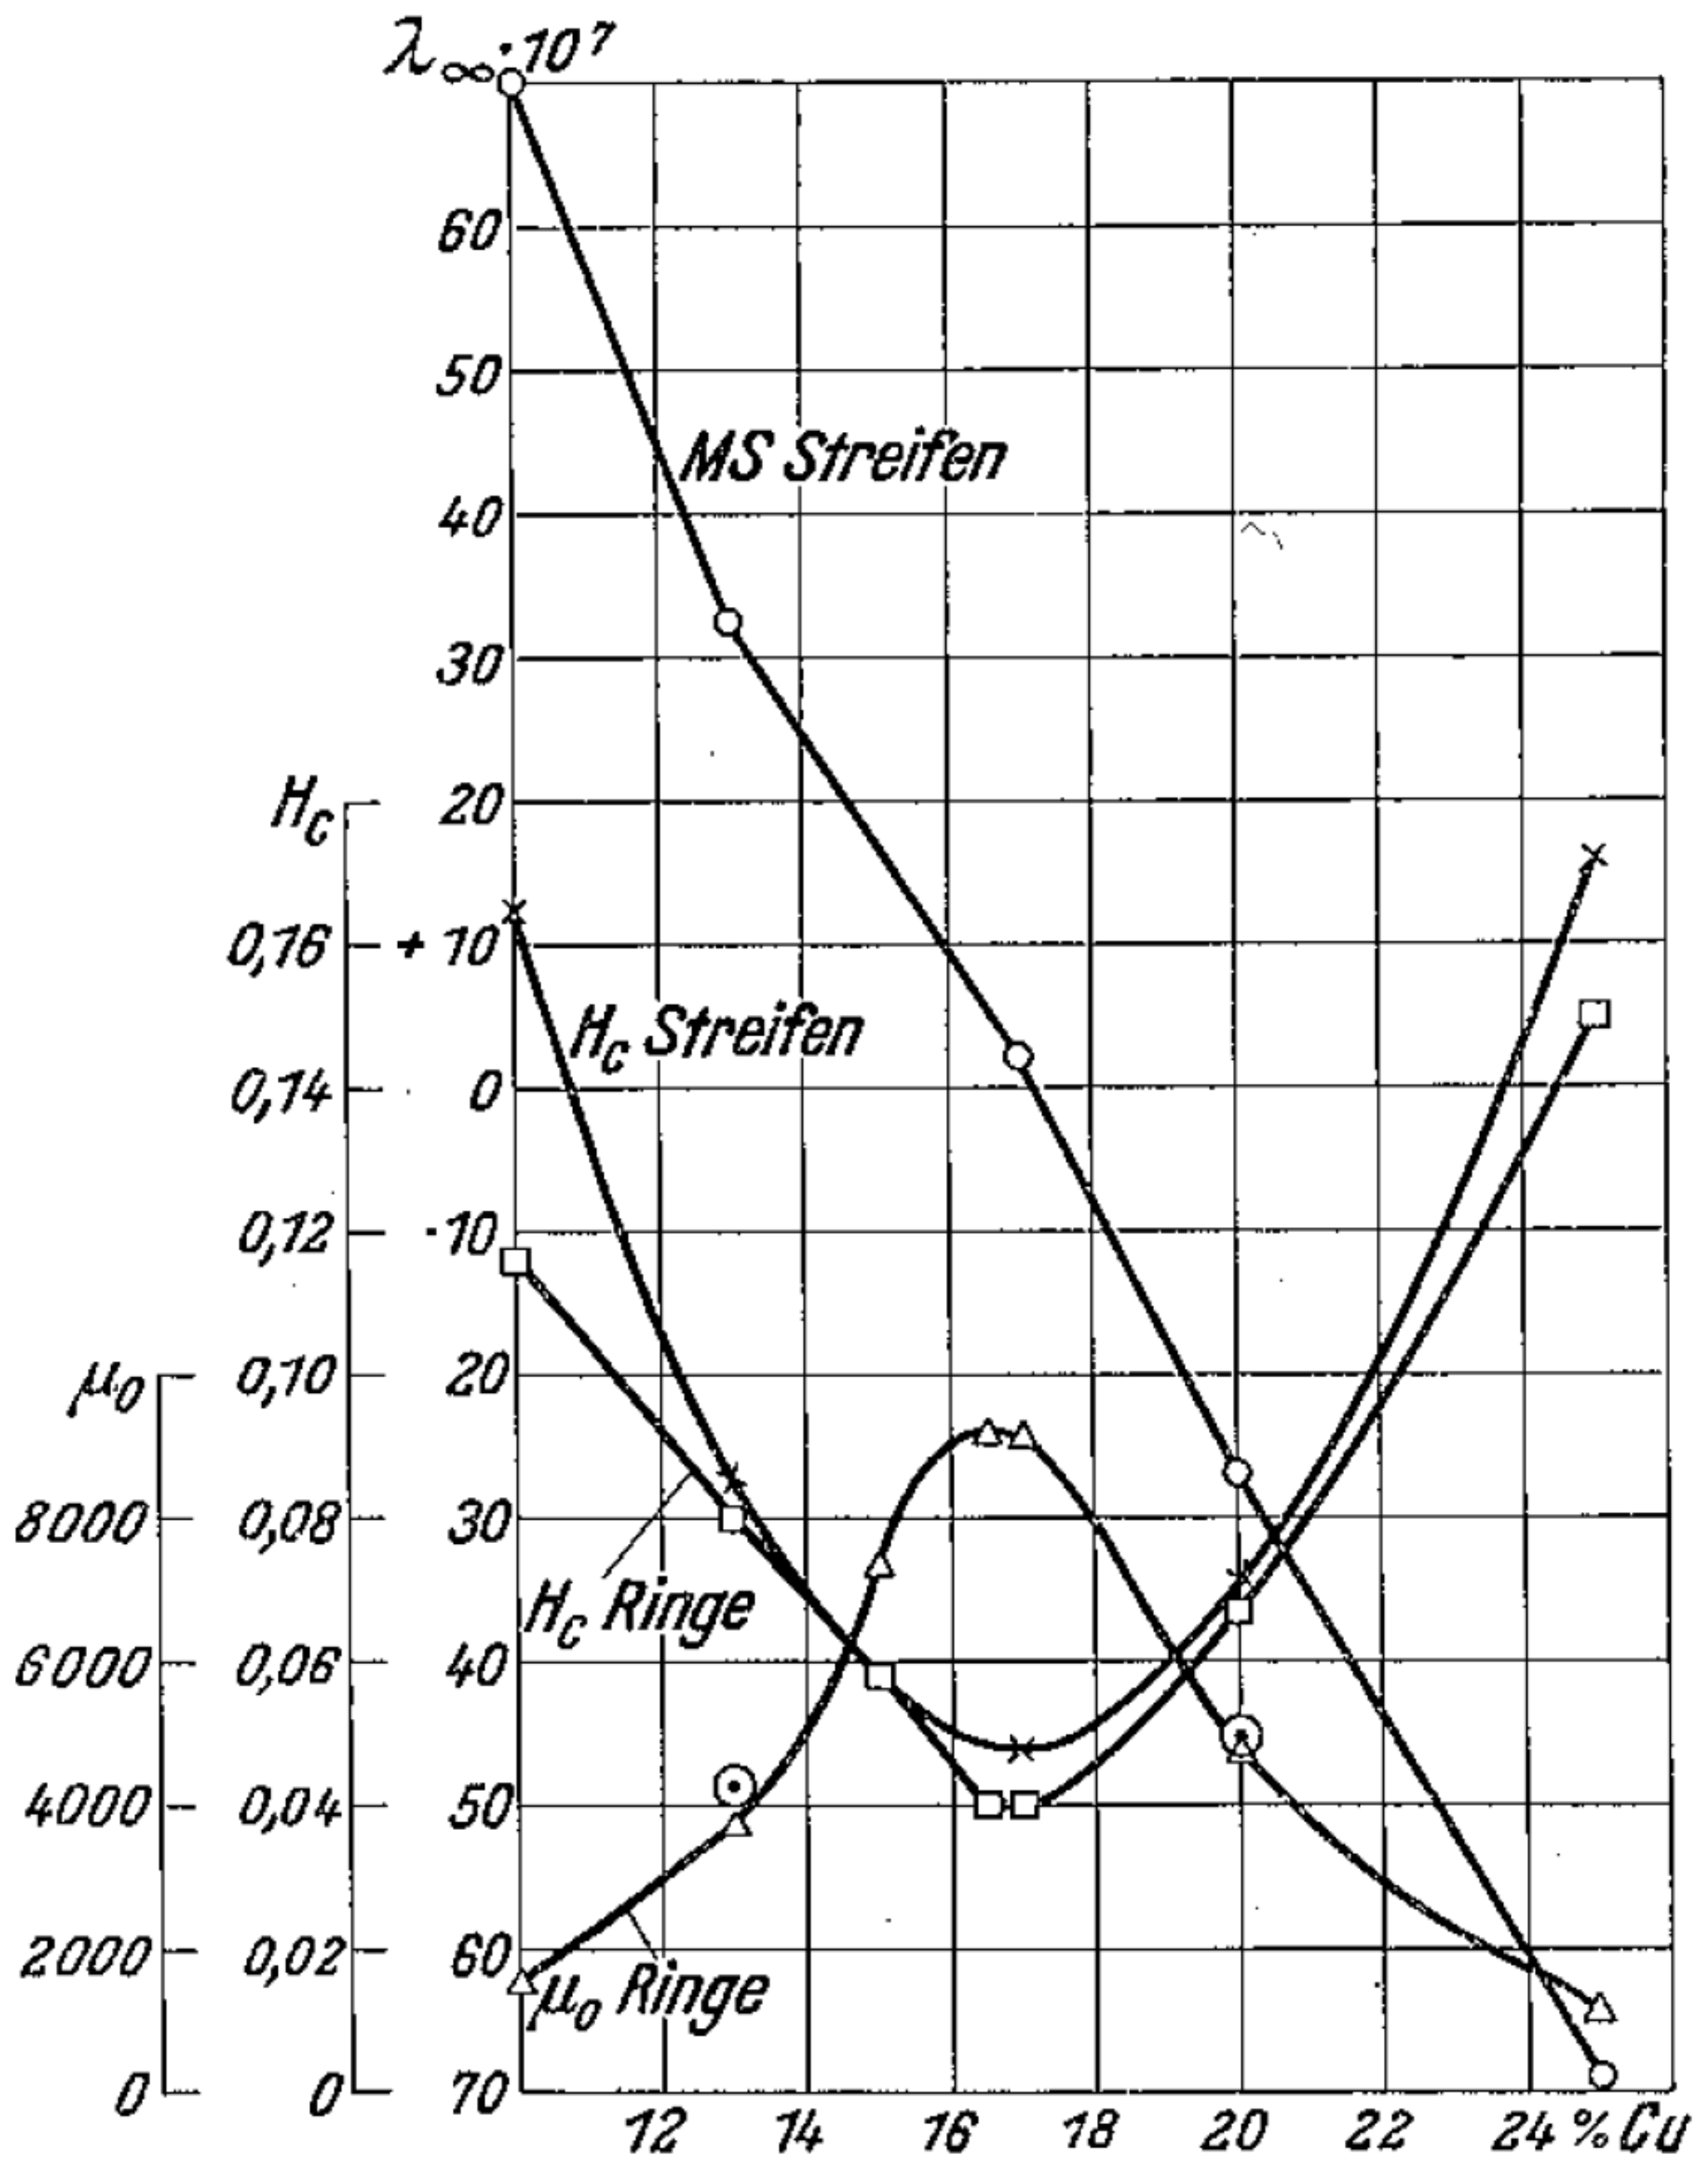
Figure B16Initial permeability μ0 and coercive force Hc of rings; coercive force Hc and saturation magnetostriction (λ∞) MS on strips as function of Cu-content; section for 70 % Ni; 1100 °C-handling.
B2 The connection with magnetostriction
The idea to bring a connection between high initial permeabilities and small magnetostriction-values λ, was first mentioned by McKeehan (1925, 1926) in the form of a stress-hypothesis with respect to the then highest known permeability values for Permalloys, and found wider development subsequently in the works of Akulov (1930a, b, 1931), Becker (1930) and Becker and Kersten (1930), which led Kersten (1931) to the simple formula
(X∞ = initial susceptibility, T∞ = magnetic saturation, λ∞ = saturation-magnetostriction, σi = mean stress). In broad outline the usefulness of this formula (after replacement of the difficult to obtain measurement for inside tension σi by λE)
(E = elastic modulus) was confirmed in the FeNi-series, by Kersten (1931).
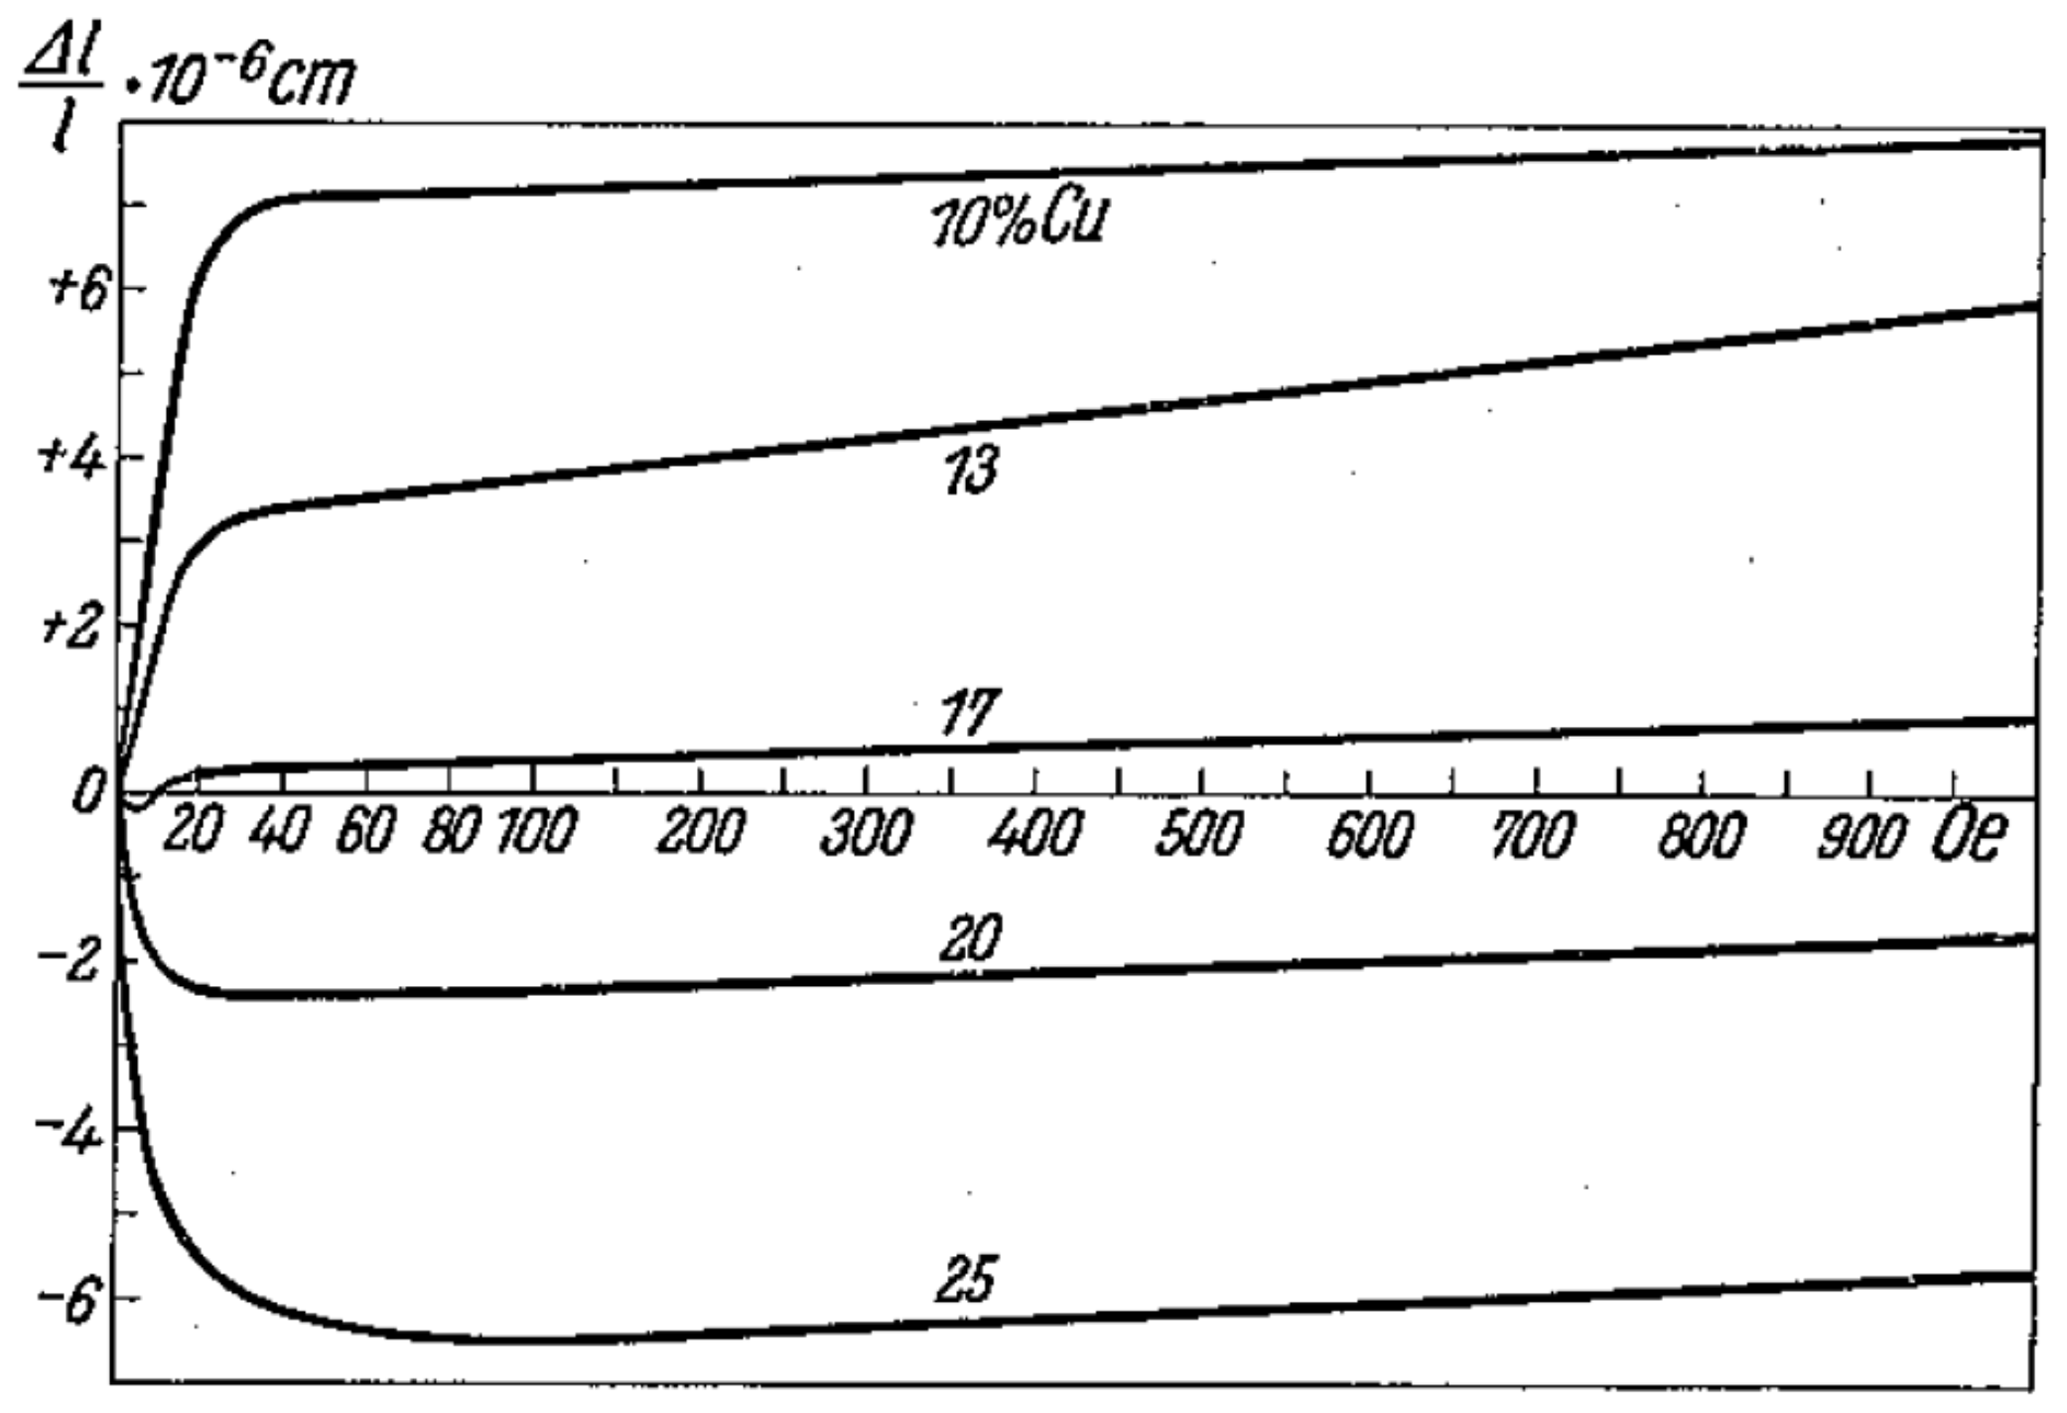
Figure B17Magnetostriction as function of the applied field strength for 70 % Ni, for various Cu-contents; 1100 °C-handling.
In this situation it appears interesting3 if and which connections exist for the above described high-permeability alloys of the FeNiCu-system with the magnetostriction values of these alloys. Thus 28 alloys of this system were investigated for their longitudinal magnetostriction. According to the earlier work of von Auwers (1933), Becker (1934) and Kornetzki (1934) one can from their documents also determine the behaviour of volume-magnetostriction.
The related alloys were the same as those used in the first part the work. For the magnetostriction measurements metal strips of mm3, together with some rings that had been used for the magnetic measurements, underwent the same (cf. Fig. B16) heat treatments (1100 °C-treatment and Permalloy-treatment). The present investigation was then done on those alloys slowly cooled from 1100 °C. The measuring apparatus was recreated as that of Kornetzki (1934), the measuring-length 30 mm.
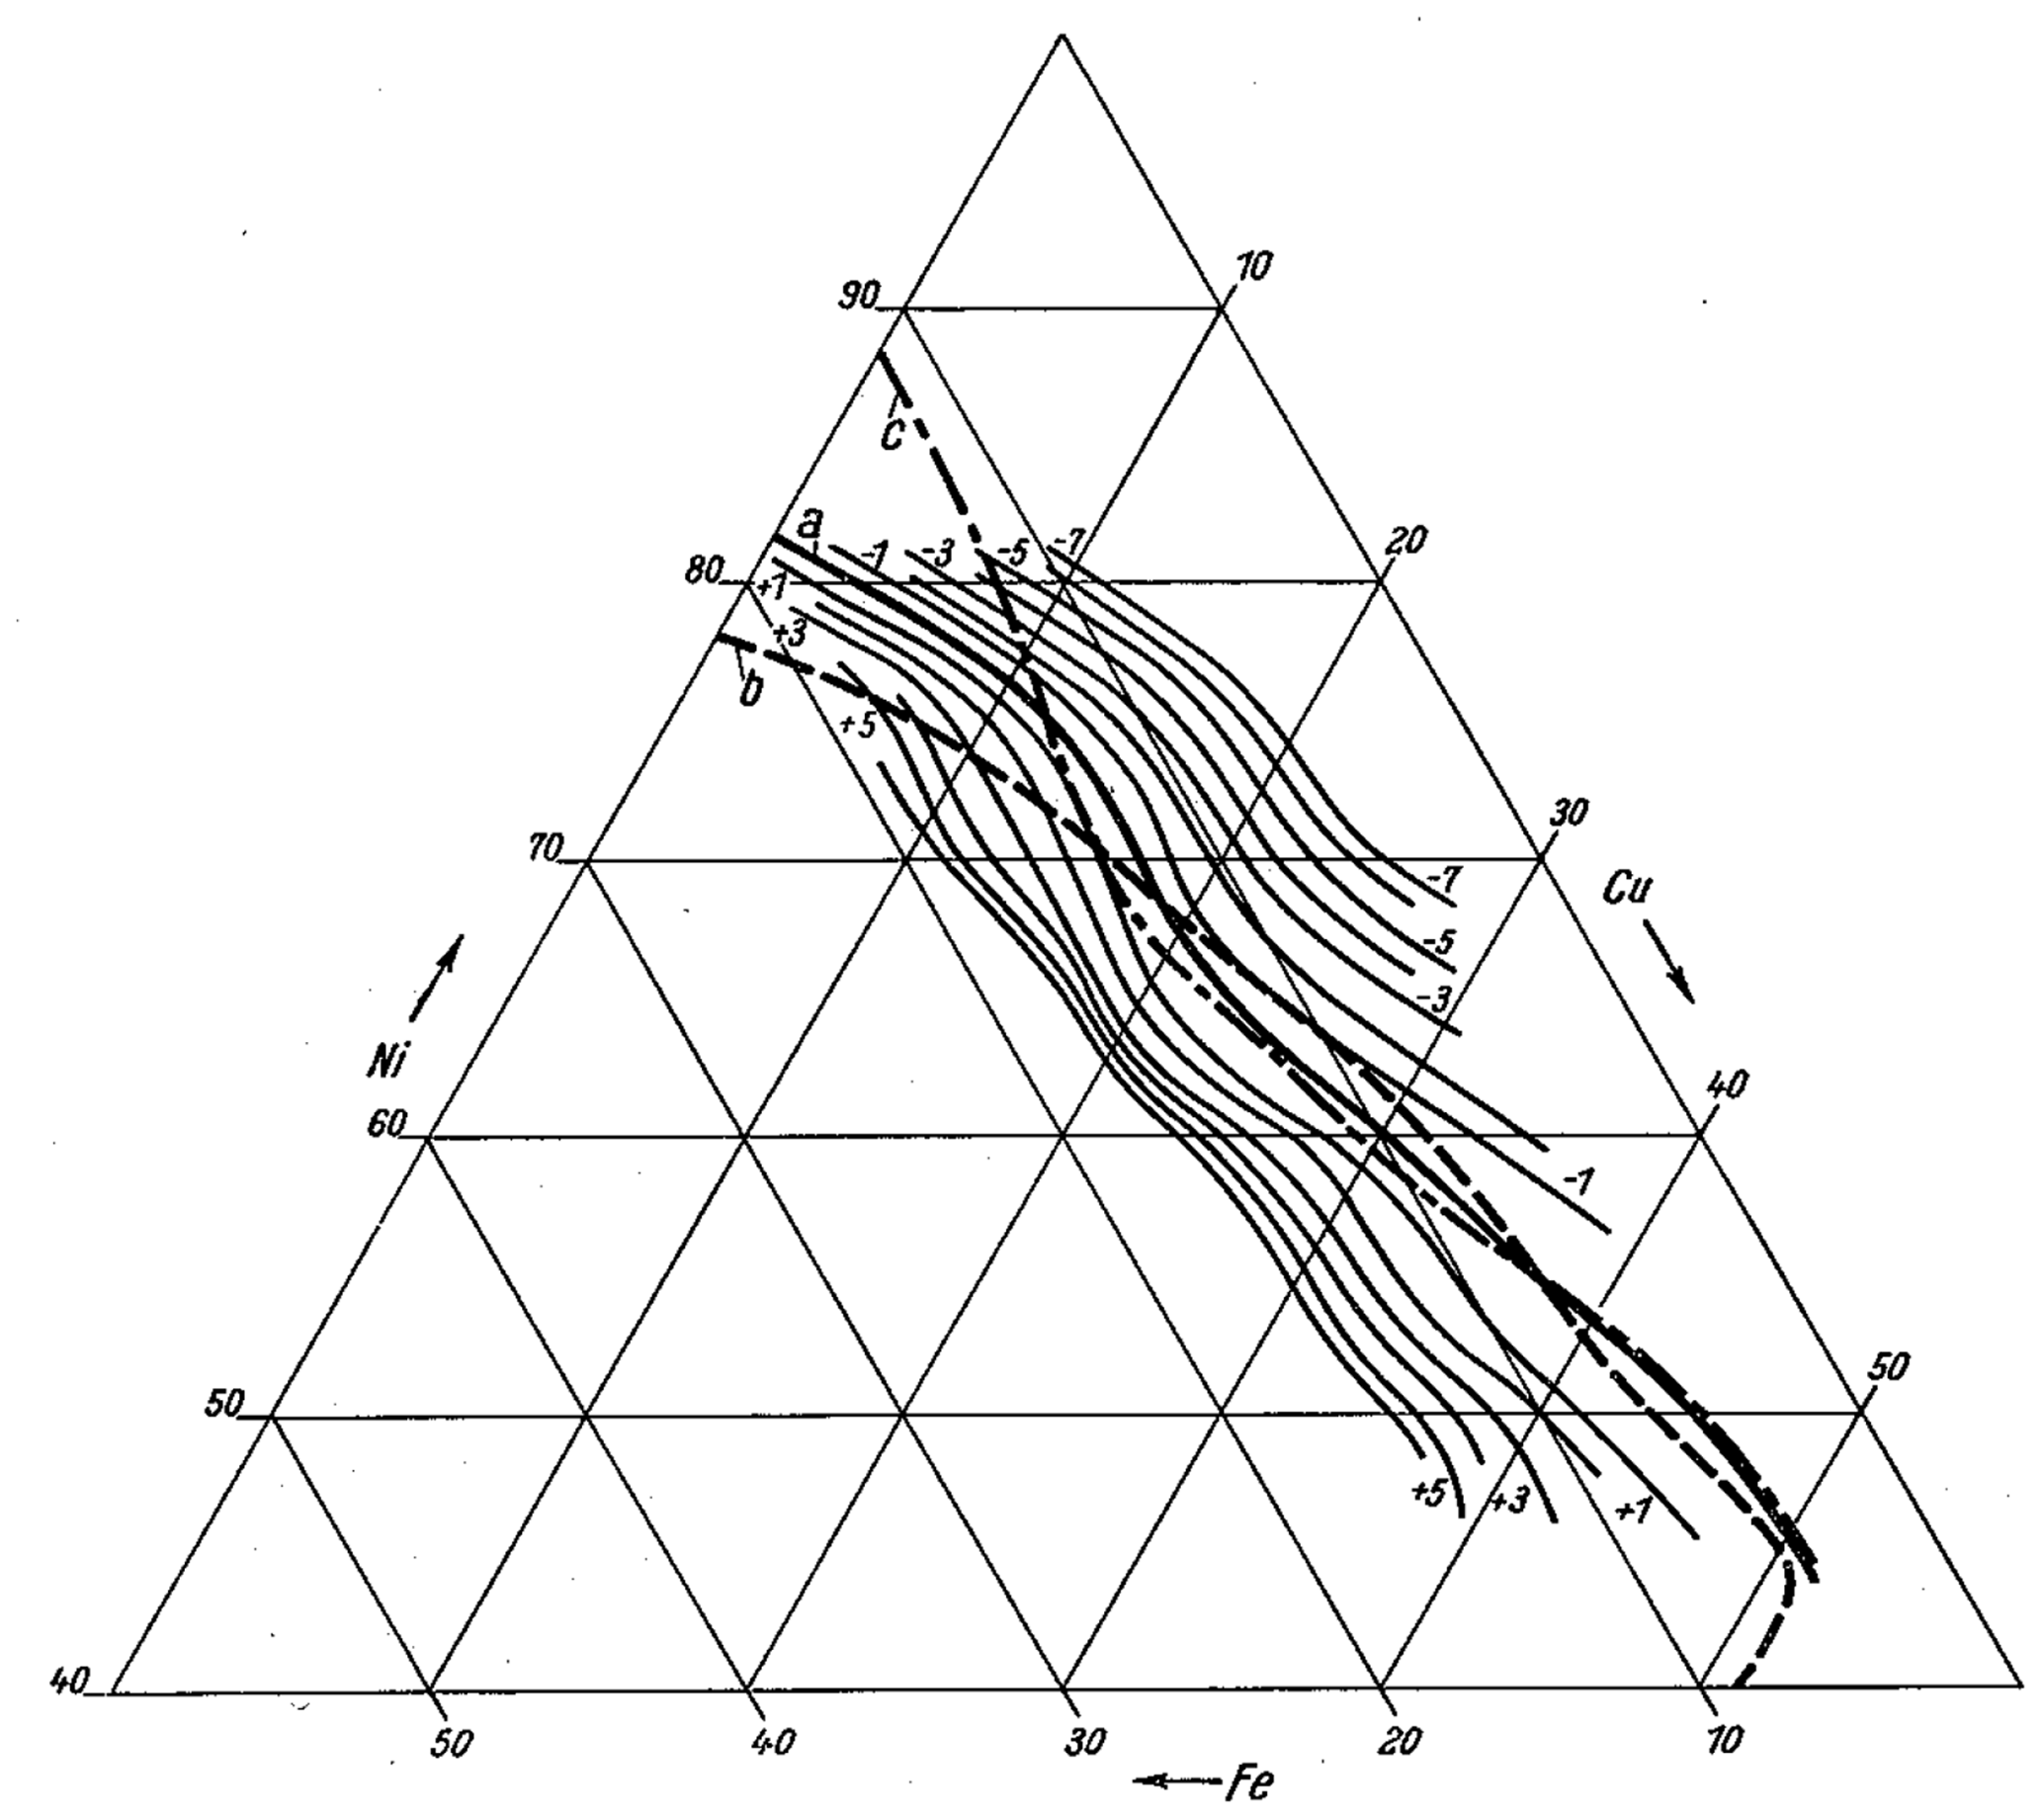
Figure B18Lines of constant magnetostriction; line of magnetostriction nulls (curve a); Line of highest initial permeability for 1100 °C-handling (curve c) and for Permalloy-handling (curve b).
B2.1 Longitudinal magnetostriction
All alloys were measured in fields up to 1000 Oe. This field-strength proved to be adequate to determine with sufficient accuracy, in spite of the unfavourable aspect ratios, not only the saturation magnetostriction but also the linear increase of longitudinal magnetostriction, for all the high permeability alloys with exception of the alloys with 40 % Ni. From this gradient one can, as is well known (Nagaoka and Taylor-Jones, 1896; Graetz, 2023), determine the volume-effect, since4
The validity of these relations was confirmed by Kornetzki (1934) for iron and by Otto von Auwers5 in numerous FeNi-single-crystals from Lichtenberger (1932). Figure B17 may give an example of the magnetostriction-values for alloys with 70 % Ni, which fundamentally shows the recurring behaviour for all other section tests. From these curves, for which the connection with the magnetization intensity B will be elaborated later, were determined the magnetostriction-saturation values λ∞, that means the λ-values, for which the λ−H-curves passed into the linear part above the technical saturation together with the associated field strengths H0. With the thus collected λ∞-values one can plot various sections, for which Fig. B16 gives an example. The intersections these curves make with the zero-line give the chemical compositions, for which the integrated6 magnetostriction of the polycrystalline alloys becomes zero. Carrying these values into the alloy-triangle, its connecting-line (Fig. B18, curve a) (with exception higher Nickel-contents) becomes practically coincident with the contour lines of initial permeability for the same heat treatment (1100 °C) (Fig. B18, curve b) within the error-bounds.
Figure B18 presents other lines of constant saturation magnetostriction values, which in their aggregate course show a close connection with initial permeability (Fig. B8). In Figs. B8 and B11 the lines for magnetostriction null are drawn in as well; here also the connection is clearly recognized. Thus is given convincing evidence not only for the far reaching importance of Equations (1) and (2), but at the same time a plausible explanation for the course of initial permeability in the FeNiCu-system: the initial permeability has the maximum value, where the longitudinal magnetostriction was zero.
Against the obvious objections, that for Eqs. (1) and (2) for λ=0 their validity must fail, one can exercise two points of view: (1) the denominator could be assembled as the sum of two7 energies, for which the second in general can have negligible size, as compared to λ∞⋅σi, whereby the value μ0=∞ is excluded when λ goes to zero; and (2) one must consider, that the equations are derived for “anisotropic” magnetostriction, that is, by neglecting the fact that magnetostriction is generally to some extent anisotropic, that means it does not go to zero simultaneously in all orientations of the crystal lattice.
That alone is sufficient to always maintain for the gross magnetostriction strain in polycrystalline materials a certain underlying stress level that originates in the crystallographic anisotropy of magnetostriction and must formally make itself noticeable as an additive component in the denominator.
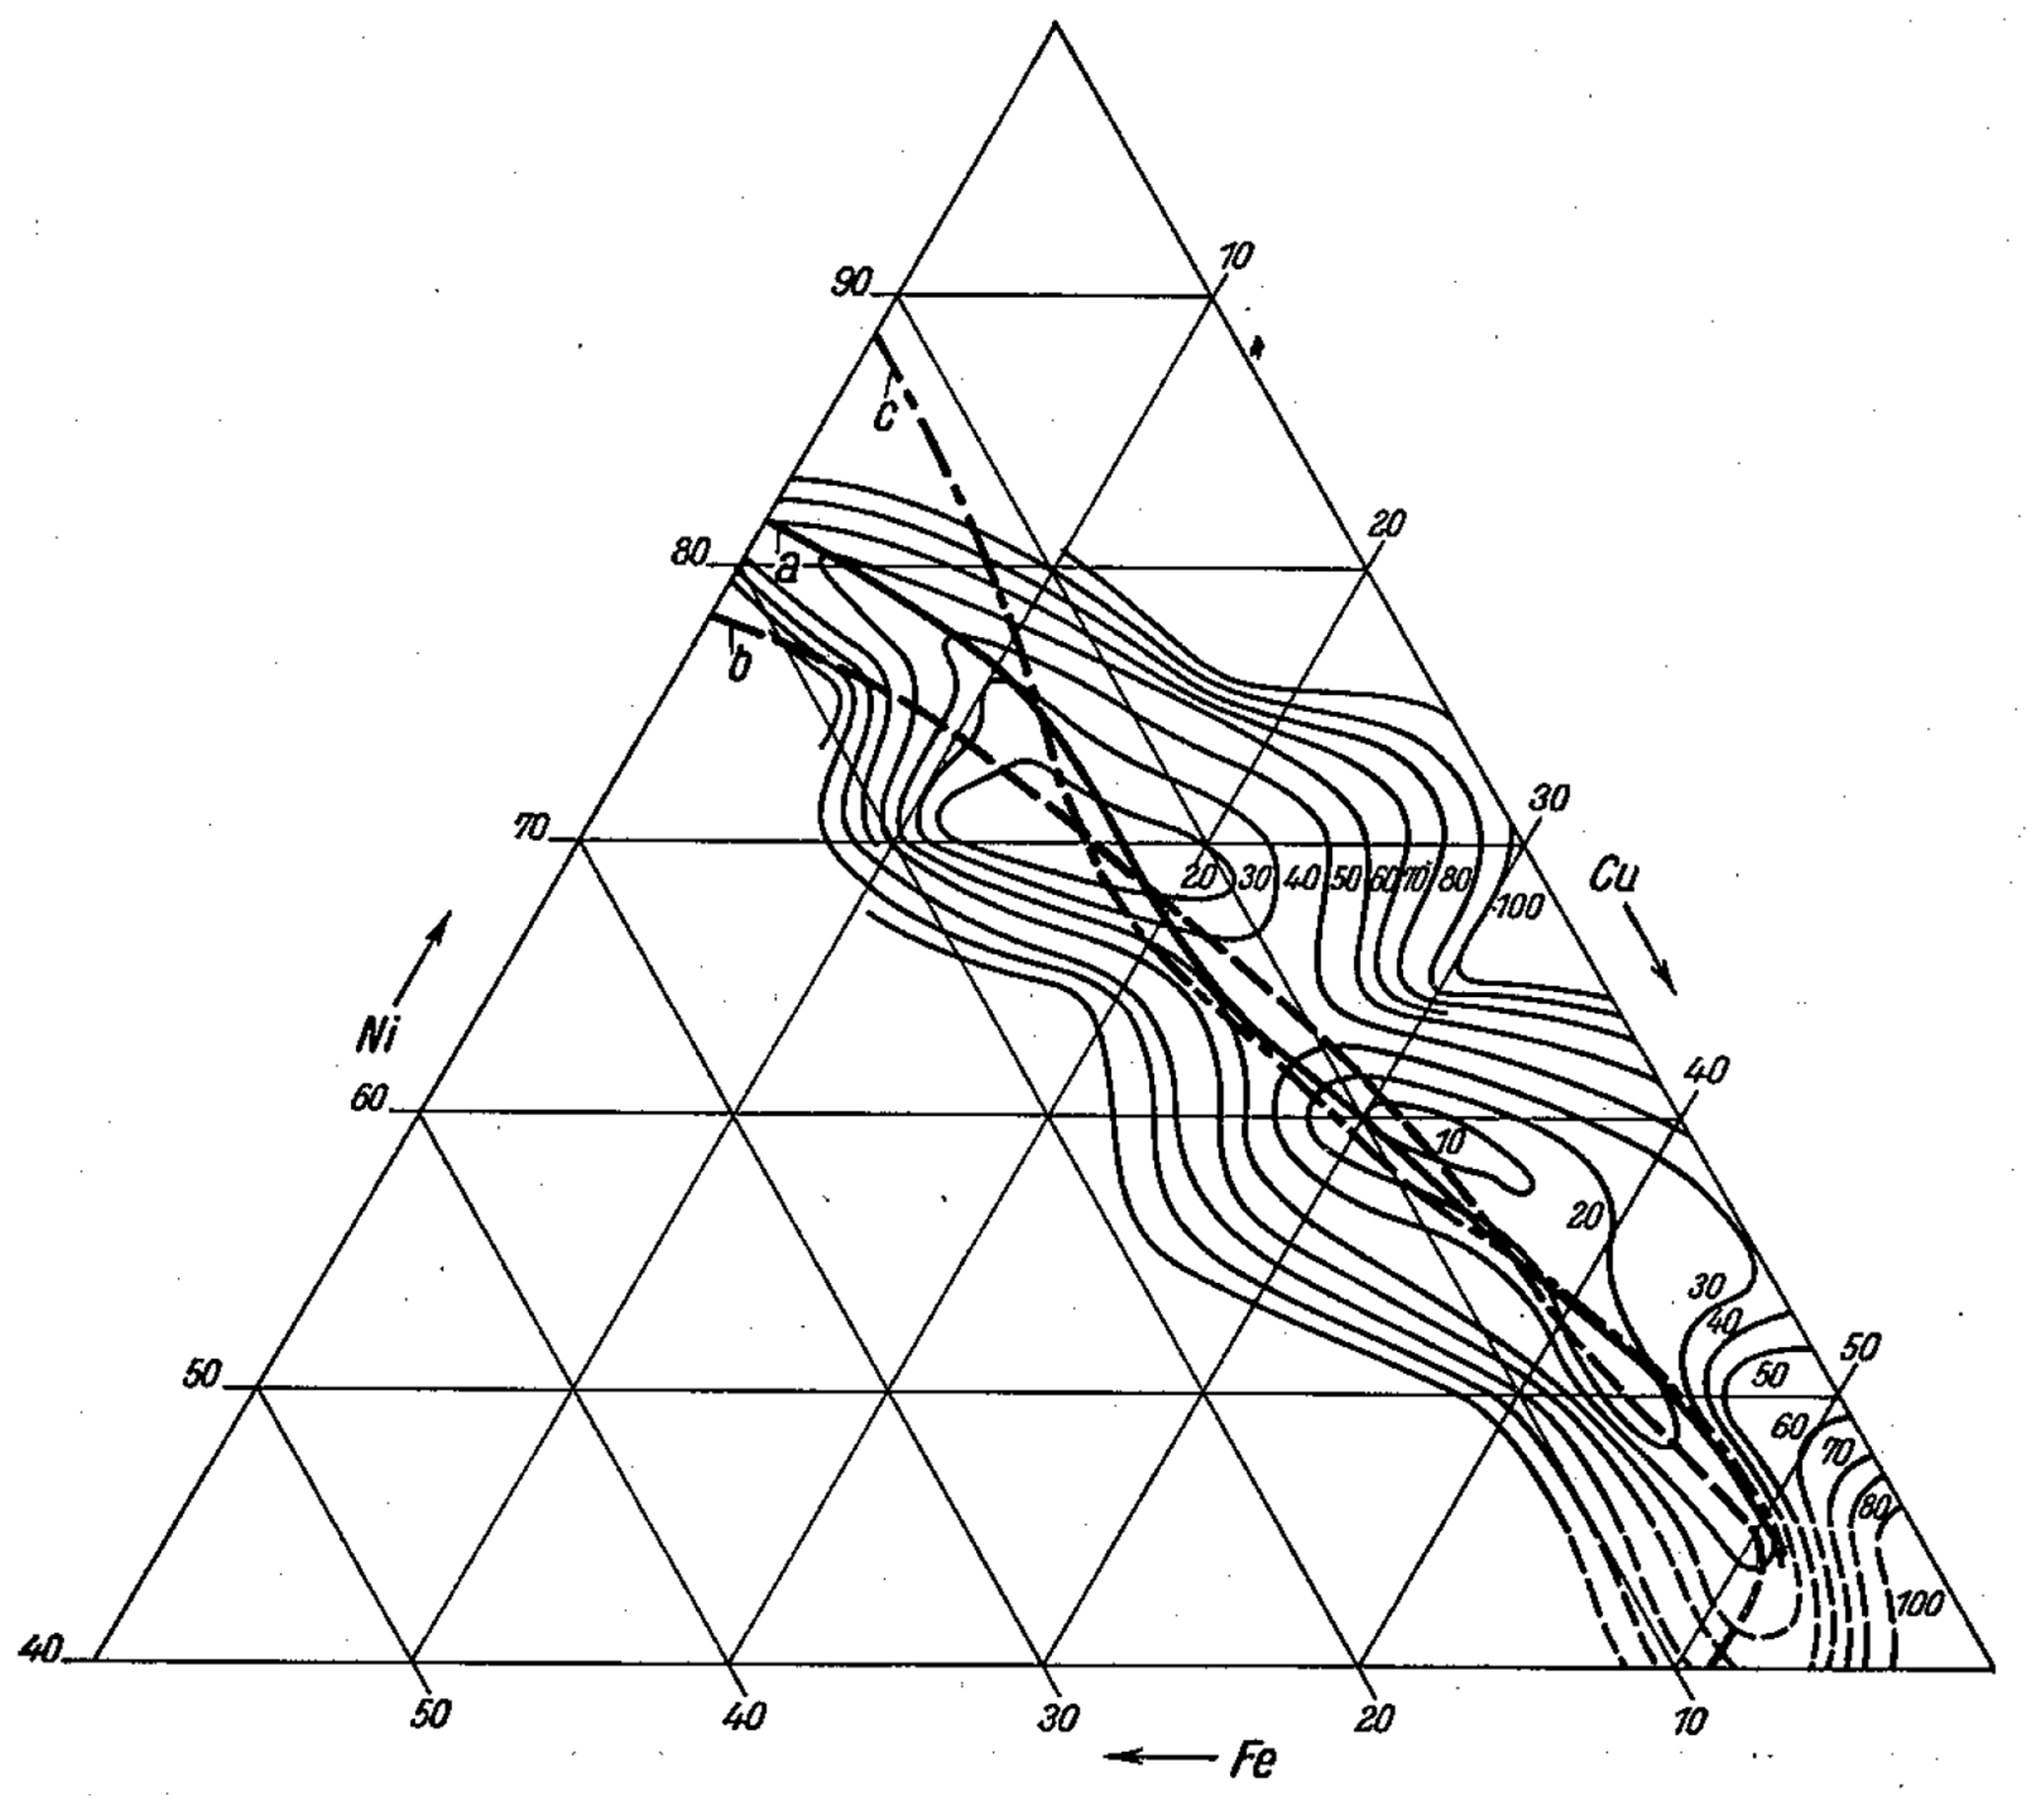
Figure B19Lines of constant field strength for saturation magnetostriction; Line of magnetostriction null (curve a); Lines of highest initial permeability for 1100 °C-handling (curve c) and for Permalloy-handling (curve b).
B2.2 The H0 field
Taking from the λ−H curves the outer ones, depending on the shape8, for which field-values H0 for saturation-magnetostriction λ∞ have been reached, and contour plotting in the alloy-triangle (Fig. B19), one can also recognize here a close connection of the course of the crest-lines with the initial permeability peaks: the contour lines close to minima of coercivity and the saddle between them. But maybe this connection is less a dependence on the magnetostrictive properties and is rather an immediate effect of the regime of permeability, as H0 must naturally be smaller, as ever lighter magnetic saturation values were reached.
B2.3 Volume magnetostriction
In the same manner were handled the linear ramps of the λ−H-curves (cf. Fig. B17) above technical saturation. They gave, as already observed, [von Auwers und Neumann, 1935, p. 103], again one-third the volume effects. Notice once again the lines of constant volume-effect in the alloy-triangle, as follows in Fig. B20; its comparison with the course of both crest-lines of initial permeability, in spite of their larger complexity can yet still reveal some coherence. In this example the crest lines of initial permeability for both heat treatments go with great accuracy across the narrowest and lowest position of the canyon between 65 % Ni and 75 % Ni. The alloys with 40 % Ni given up to 1000 Oe still easily bent λ−H-curves. A basis for their ill form might be sought in the larger coercive forces of these alloys (cf. Fig. B11). It is interesting, that the volume magnetostriction in the FeNiCu-system is similar to that of the FeNiCo-system9, a similar embedded saddle was found in it.
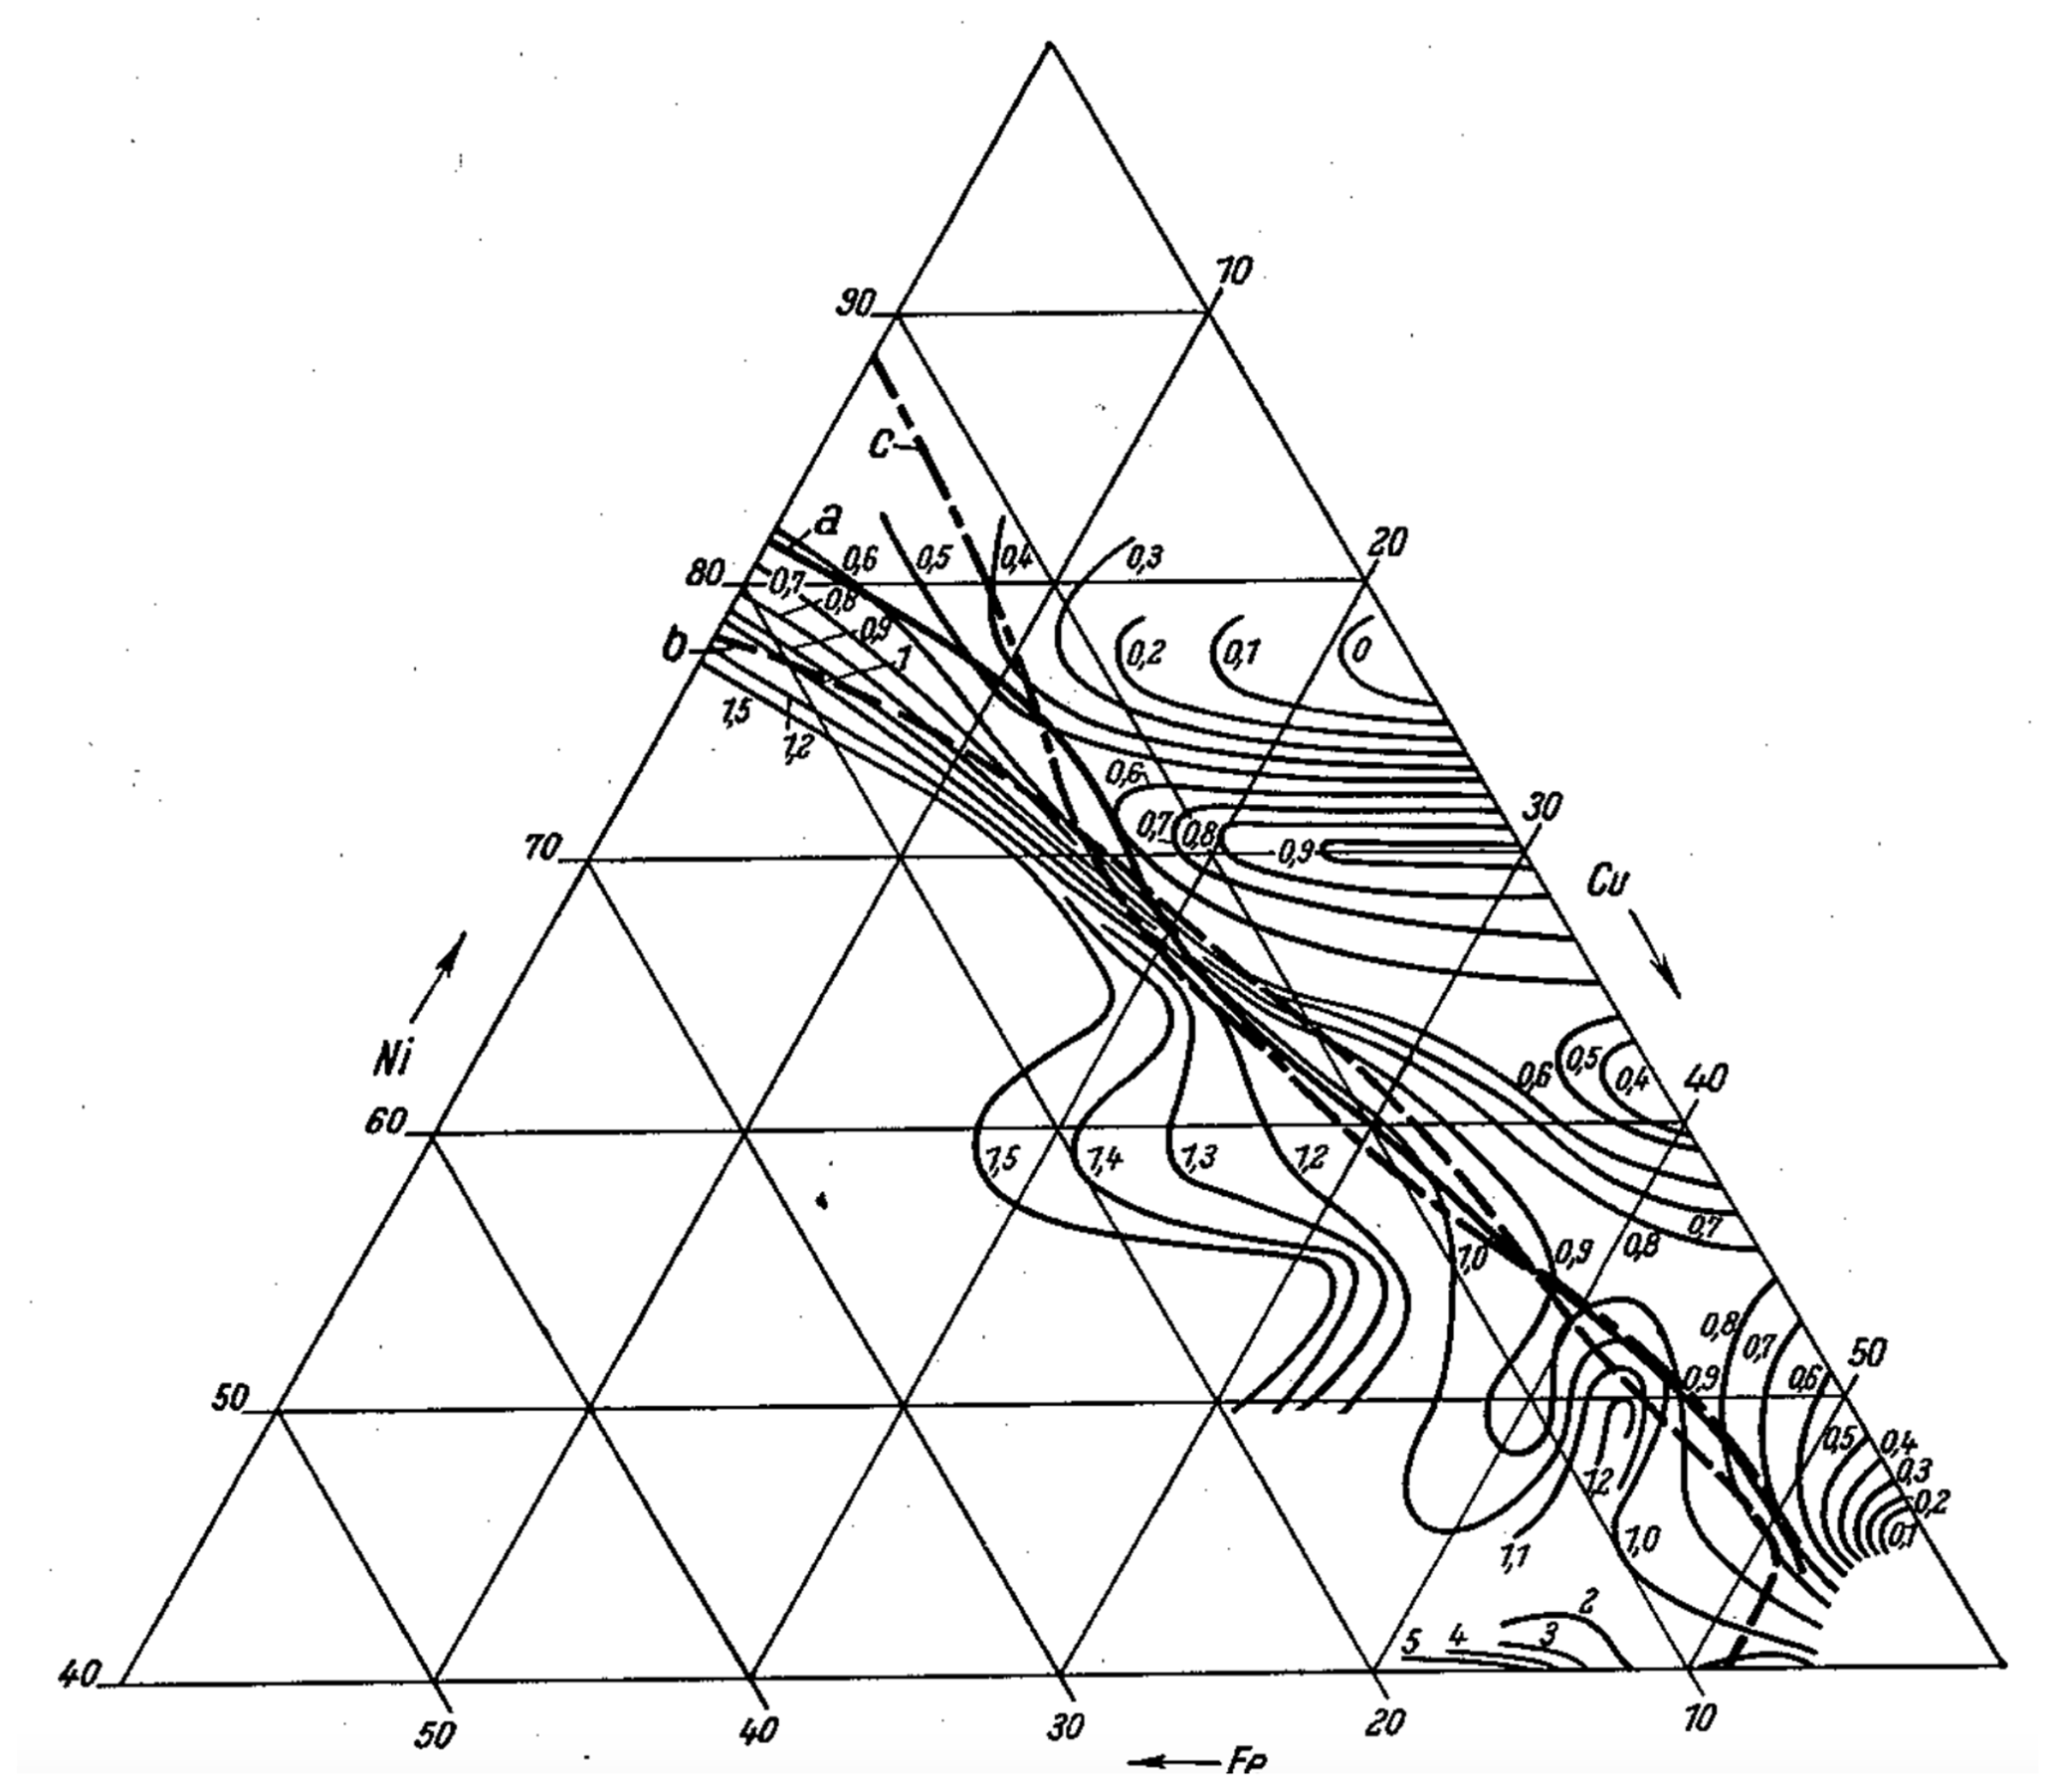
Figure B20Lines of constant volume magnetostriction, (); Line of zero magnetostriction (curve a); line of maximum initial permeability for 1100 °C-handling (curve c) and for Permalloy-handling (curve b).
B2.4 Effects of thermal handling
The magnetostriction measurements described above were all for alloys for which 1100 °C slow cooling were executed. To clarify the question, considering the above-noted effects of thermal processing on the initial permeability, and whether it may also make a noticeable effect in the magnetostriction values, some samples made as metal bands were given Permalloy handing. It was thus shown that the heat treatment has no noticeable effect on the null line of longitudinal magnetostriction. More about this and of a likely equivalent effect on volume magnetostriction will be reported fully in a later publication.
B2.5 Results
In summary one can say that the present magnetostriction measurements on high permeability FeNiCu-alloys not only narrows the relation between initial permeability and the magnetostrictive behaviour these alloys have expressed, but together have given a convincing story for the accuracy of modern theories of magnetization in ferromagnetic crystal lattices, theories that establish all of the legendary importance of magnetostriction for the magnetic behaviour of ferromagnetics. This connection has still one evident restriction, in so far as the tests point, that aside from magnetostriction as already indicated above, still other magnitudes can have significance for the permeability (cf. for example alloys above 70 % Ni). This can also be expressed, that the position of the magnetostriction curves, in contrast to the curve of maximum permeability, is entirely independent from the thermal process used.
B3 Overview
In an overview of the entirety of the acquired results, the following can be said: there was found a long, narrow zone of highest μ0-values, below 70 % Ni found practically coincident with the zone of smallest coercivity. In the zone above 70 % Ni the heat treatment had a particular influence and occurs on both magnetic attributes (μ0 and Hc) in the same sense. For both magnetic values there existed within the narrow zone an optimum zone, for μ0 a maximum, for Hc a minimum; for an 1100 °C anneal temperature both optima fall together, whereas for a 900 °C anneal temperature the μ0 maximum has shifted to 70 % Ni and the Hc minimum to 45 % Ni. On the width of the high permeability zone and its form taken in the lower part, there is a phase separation region extending from the FeCu-line, and due to differences in the segregation processes the particular heat treatment has some influence.
The line for zero magnetostriction in polycrystals with less than 70 % Ni, practically coincided with the zone of Hc minima and μ0 maxima; the sites of μ0 maxima and Hc minima respectively, within the high permeability zone had no natural expression in the line for zero magnetostriction. In the region above 70 % Ni there exists a deviation of the magnetostriction line away from the regime of optimal μ0 and Hc zones respectively; the line of zero magnetostriction for both heat treatments runs approximately to the alloy 82 % Ni, 18 % Fe, then for highest initial permeability for 1100 °C-handling to 88 % Ni, 12 % Fe, for the Permalloy handling to 78.5 % Ni, while the Hc minimum for Permalloy-handling went to 81 % Ni and for the 1100 °C-handling to 88 % Ni. About the as yet unexplained reason for these deviations, more should also be reported.
In addition to the clearly confirmed connection with the magnetostriction there is the following remarkable fact: the direction of the narrow high permeability zone, originating at the FeNi-line, passes towards the Cu-corner, while the location of the exit point of the regions, as discussed above, can shift according to the heat treatment. The whole regime of zones of higher permeability can – irrespective of the deviations in the vicinity of the FeNi-line – indicate, as whether we are involved in this zone with alloys of constant Ni:Fe ratio. One draws a specific line originating at 84 % Ni 16 % Fe (respectively the ratio Ni5:Fe) and going towards the Cu-corner, which follows, especially from about 70 %Ni, along the general regime of μ0-crests (Fig. B6) and also lies together, in good agreement with the line for the magnetostriction null (Fig. B8). The divergences for lower Ni-content and within the large zone near the NiCu-line should perhaps be taken conditionally; the alloys in this zone have typically very low Curie-points, for example under 100C for an alloy of 45 % Ni, 50 % Cu, 5 % Fe, compared with an alloy of 70 % Ni, 10 % Cu, 20 % Fe, which has 490 °C. Because of the various intervals of the measurement temperature (+20 °C) to the Curie-points the results for the individual alloys were thus not directly comparable, and it is conceivable that with lower temperatures the alloys with low Curie-points give values to the zone of higher permeability, something others could also do. This question is to be investigated later.
Summary
There was found in the FeNiCu-system a zone of high initial permeability and small coercivity, its location goes from about 80 % Ni, 20 % Fe reaching down to 40 % Ni, 50 % Cu, 10 % Fe.
For the large, upper part of this zone there existed a broad connection with magnetostriction in such a way that at alloys with highest initial permeability the magnetostriction sign reversed.
Data and source code used in the creation of this paper can be accessed by contacting the authors.
BBN wrote the paper, with contributions from DMM. DMM produced the alloy ingots and fabricated and tested the racetrack fluxgate sensors. BBN produced the magnetic testing specimens, performed the magnetic material testing, and translated von Auwers and Neumann (1935).
B. Barry Narod operated Narod Geophysics Ltd., which manufactured fluxgate magnetometers until the company ceased production operation in 2008. David M. Miles and B. Barry Narod hold provisional U.S. patent 63/164,045 related to the use of the described copper alloy regime for magnetic field instruments and magnetic shielding. The peer-review process was guided by an independent editor, and the authors also have no other competing interests to declare.
Publisher's note: Copernicus Publications remains neutral with regard to jurisdictional claims made in the text, published maps, institutional affiliations, or any other geographical representation in this paper. While Copernicus Publications makes every effort to include appropriate place names, the final responsibility lies with the authors.
That authors wish to thank Christian Hansen, Andrew Schmitt, Matt Miller, and Toby Tompkins for their work manufacturing and machining the permalloy samples, Tino Smith for his work assembling the fluxgate cores, and John Bennest for his work characterizing loops.
This research has been supported by the National Aeronautics and Space Administration (grant nos. 80NSSC19K0491 and 80GSFC18C0008).
This paper was edited by Valery Korepanov and reviewed by two anonymous referees.
Akulov, N. S.: Über ein Gesetz, das verschiedene Eigenschaften ferromagnetischer Kristalle miteinander verknüpft, Z. Physik, 59, 254–264, https://doi.org/10.1007/BF01341430, 1930a.
Akulov, N. S.: Über die Anwendungen des Gesetzes ferromagnetischer Anisotropie zur Berechnung der Eigenschaftern polykristallinisschen Eisens, Z. Physik, 66, 533–542, https://doi.org/10.1007/BF01402036, 1930b.
Akulov, N. S.: Zur Theorie der Feinstruktur der Magnetisierungskurven der Einkristalle, Z. Physik, 69, 78–99, https://doi.org/10.1007/BF01391515, 1931.
Anonymous: Die Magnetischen Eigenshaften des Monel-Metalle, Electrotechnik und Maschinenbau, 40, 142, 1922.
Anonymous: The Electrician, https://en.wikipedia.org/wiki/The_Electrician (last access: 15 February 2024), 1927.
Arnold, H. D. and Elmen, G. W.: Permalloy, and alloy of remarkable magnetic properties, J. Franklin Inst., 195, 621–632, https://doi.org/10.1016/S0016-0032(23)90114-6, 1923a.
Arnold, H. D. and Elmen, G. W.: Permalloy, A New Magnetic Material of Very High Permeability, Bell Syst. Tech. J., 2, 101–111, https://doi.org/10.1002/J.1538-7305.1923.TB03595.X, 1923b.
Arnold, H. D. and Elmen, G. W.: Permalloy, an alloy of remarkable magnetic properties, Proc. Amer. Phys. Soc., 20–21 April 1923, Washington, DC, 701–722, 1923c.
Aschenbrenner, H. und Goubau, G.: Ein Anordnung zur Registrierung rascher magnetischer Störungen, Hochfrequenztechnik und Electroakustik, 47, 177–181, 1936.
Becker, R.: Zur Theorie der Magnetisierungskurve, Z. Physik, 62, 253–269, https://doi.org/10.1007/BF01339797, 1930.
Becker, R.: Über die Magnetostriktion von ferromagnetischen Ellipsoiden I., Z. Physik 87, 547–559, https://doi.org/10.1007/BF01333324, 1934.
Becker, R. und Kersten, M.: Die Magnetisierung von Nickeldraht unter starkem Zug., Z. Physik, 64, 660–681, https://doi.org/10.1007/BF01397217, 1930.
Boothby, O. L. and Bozorth, R. M.: A New Magnetic Material of High Permeability, J. Appl. Phys., 18, 173–176, https://doi.org/10.1063/1.1697599, 1947.
Bozorth, R. M.: Ferromagnetism, in: facsimile, 1993 edition, edited by: Perkins, W., IEEE Press, Piscataway, NJ, ISBN 0-7803-1032-2, 1951.
Bozorth, R. M.: The Permalloy Problem, Rev. Mod. Phys. 25, 42–48, https://doi.org/10.1103/RevModPhys.25.42, 1953.
Carpenter Technology: Cartech® HyMu “800” Alloy, Technical Datasheet, https://www.carpenterelectrification.com/hubfs/Resources/Datasheets/20230324--Electrification_Datasheet_HyMu_800_F.pdf (last access: 15 February 2024), 1991.
Chaston, J. C.: Permalloys and Related Ferromagnetic Alloys – A Review, Elect. Commun., 15, 38–51, 1936.
Chevenard, P. A., Portevin, A. M. and Waché, X. F.: A Dilatometric study of some Univariant two-phase reactions, J. I. Met., 42, 337–373, 1929.
Cohen, P.: Effect of Compositional Variation on the Permeability of Molybdenum Permalloy, J. Appl. Phys., 38, 1174–1175, https://doi.org/10.1063/1.1709529, 1967.
Copper Development Association Inc.: Copper-Nickel Alloys: Properties, Processing, Applications, https://www.copper.org/applications/marine/cuni/properties/DKI_booklet.html#2.1 (last access: 15 February 2024), 2023.
Couderchon, G., Porteseil, J. L., Bertotti, G., Fiorillo, F., and Soardo, G. P.: Magnetization Process in NiFe Alloys with Vanishing Anisotropies, IEEE T. Mag., 25, 3973–3975, https://doi.org/10.1109/20.42493, 1989.
Dahl O. and Pfaffenberger, J.: Peculiar Magnetic Behaviour of Cold-Rolled Iron-Nickel Alloys on Precipitation Hardening, Metallwirtschaft, 13, 527–530, 543–549, 559–563, 1934.
Dahl, O., Pfaffenberger, J., and Sprung, H.: New Magnetic Materials for Loading Coils, Elek. Nach, Tech., 10, 317–332, 1933.
Delatorre, R. G., Sartorelli, M. L., Schervenski, A. Q., and Pasa, A. A.: Thermoelectric properties of electrodeposited CuNi alloys on Si, J. Appl. Phys., 93, 6154–6158, https://doi.org/10.1063/1.1569432, 2003.
Edgcumbe, K. and Ockenden, F. E. J.: Some recent advances in alternating-current measuring instruments, J. Inst. Electr. Engr., 65, 553–586, https://doi.org/10.1049/jiee-1.1927.0058, 1927.
Electr. Rev.: The magnetic properties of monel metal, Elect. Rev., 89, 292–293, 1921.
Elmen, G. W.: US Patent 1,586,884, 1926.
Elmen, G. W.: US Patent 1,768,443, 1930.
English, A. T. and Chin, G. Y.: Metallurgy and magnetic properties control in permalloy, J. Appl. Phys., 38, 1183–1187, https://doi.org/10.1063/1.1709532, 1967.
Enoch, R. D. and Fudge, A. D.: High magnetic permeability in Ni-Fe alloys, Brit. J. Appl. Phys. 17, 623–634, https://doi.org/10.1088/0508-3443/17/5/307, 1966.
Enoch, R. D. and Murrell, D. L.: High magnetic permeability in Ni-Fe-Cu-Mo alloys, IEEE T. Mag., 5, 370–372, https://doi.org/10.1109/TMAG.1969.1066450, 1969.
Farcas, T.: Les moments ferromagnétiques dans quelques alliages du cobalt, Annales de Physique, 11, 146–152, https://doi.org/10.1051/anphys/193711080146, 1937.
Fornacon, K. H., Auster, H. U., Georgescu, E., Baumjohann, W., Glassmeier, K. H., Haerendel, G., Rustenbach, J., and Dunlop, M.: The magnetic field experiment onboard Equator-S and its scientific possibilities, Ann. Geophys., 17, 1521–1527, https://doi.org/10.1007/s00585-999-1521-3, 1999.
Foster, A. E., Ledger, P. G., and Rosen, A.: The continuously-loaded submarine telegraph cable, J. Inst. Elect. Eng., 67, 475–498, https://doi.org/10.1049/jiee-1.1929.0037, 1929.
Gerdien, H. und Neumann, H.: Über ein astatisches Kompensationmagnetometer, Wiss. Veröff. a. d. Siemens-Konz., 11, 12–34, 1932.
Gordon, D. I., Lundsten, R. H., Chiarodo, R. A., and Helms Jr., H. H.: A Fluxgate Sensor of High Stability for Low Field Magnetometry, IEEE T. Mag., 4, 397–401, https://doi.org/10.1109/TMAG.1968.1066332, 1968.
Graetz, L. (Ed.): Handbuch der Elektrizität und des Magnetismus, u. d. IV, J. A. Barth, Leipzig, p. 276, ISBN 13 978-1148101897, 1923.
Greene, K., Hansen, C., Narod, B. B., Dvorsky, R., and Miles, D. M.: Tesseract – a high-stability, low-noise fluxgate sensor designed for constellation applications, Geosci. Instrum. Method. Data Syst., 11, 307–321, https://doi.org/10.5194/gi-11-307-2022, 2022.
Guertler, W. und Tammann, G.: Metallographische Mitteilungen aus dem Institut für anorganische Chemie der Universität Göttingen, XXXVIII Über Kupfernickellegierungen, Z. Anorg. Chem., 52, 25–29, https://doi.org/10.1002/zaac.19070520104, 1907.
Heraeus-Vakuumschmelze: Archiv Technisches Messen, Archiv Tech. Messen Z., 913–912, 47–50, https://doi.org/10.1524/teme.1931.112.jg.47, 1931.
Herzer, G.: Grain size dependence of coercivity and permeability in nanocrystalline ferromagnets, IEEE T. Mag., 26, 1397–1402, https://doi.org/10.1109/20.104389, 1990.
Herzer, G.: Nanocrystalline soft magnetic materials, Physica Scripta, 49, 307–314, 1993.
Hopkinson, J.: Magnetic and other Physical Properties of Iron at a High Temperature, Philos. T. Roy. Soc. Lond. A, 180, 443–465, https://doi.org/10.1098/rsta.1889.0014, 1889.
Hund, A. I.: Electrotechnik und Maschinenbau: Springer Verlag, Wien, p. 143, 1922.
Keinath, G.: Hochmagnetische Legierungen, Archiv für Technisches Messen, Z913-3, 291–292, https://doi.org/10.1524/teme.1932.1324.jg.282, 1932.
Kersten, M.: Über den Einfluss des elastischen Spannungszustanden auf die Grosse der Anfagspermeabilitat, Z. Techn. Physik, 12, 665–669, 1931.
Kersten, M.: Physikalische Untersuchungen an neuen magnetischen Werkstoffen, Z. Techn. Physik, 15, 249–257, 1934.
Kinnard, I. F. and Faus, H. T.: Temperature Errors in Induction Watthour Meters, J. Am. Inst. Electr. Engr., 44, 275–287, https://doi.org/10.1109/T-AIEE.1925.5061109, 1925.
Kornetzki, M.: Über die Magnetostriktion von ferromagnetischen Ellipsoiden II, Z. Physik, 87, 560–579, https://doi.org/10.1007/BF01333325, 1934.
Kussmann, A. und Scharnow, B.: Über Härte und magnetische Eigenshaften von Eisen-Kupferlegierungen und ihre Beziehungen zum Zustandsdiagramm, Z. Anorg. Allg. Chem., 178, 317–324, https://doi.org/10.1002/zaac.19291780124, 1929a.
Kussmann, A. and Scharnow, B.: Über die Koerzitivkraft, Z. Physik, 54, 1–15, https://doi.org/10.1007/BF01339802, 1929b.
Lichtenberger, F.: Untersuchung der Magnetostriktion und der Magnetisierung von Einkrtallen der Eisen-Nickelreihe, Ann. Physik, 15, 45–71, https://doi.org/10.1002/andp.19324070104, 1932.
Lykens, A., A.: Effects of Alloy Additions to 4–79 Molybdenum Permalloy, J. Appl. Phys., 37, 1201–1206, https://doi.org/10.1063/1.1708394, 1966.
Major, R. and Martin, M.: The effect of grain orientation on the initial permeability of mumetal strip, IEEE T. Mag., 6, 101–105, https://doi.org/10.1109/TMAG.1970.1066680, 1970.
McKeehan, L. W.: A Contribution to the Theory of Ferromagnetism, Phys. Rev., 26, 274–279, https://doi.org/10.1103/PhysRev.26.274, 1925.
McKeehan, L. W.: Magnetostriction, J. Franklin Inst., 202, 737–773, https://doi.org/10.1016/S0016-0032(26)90695-9, 1926.
Merz, L.: Prof. Dr.-Ing. Georg Keinath 75 Jahre alt, Archiv für Technisches Messen, 295, R97–98, https://doi.org/10.1524/teme.1960.288299.jg.353, 1960.
Messkin, W. S. und Kussmann, A.: Die Ferromagnetischen Legierungen und ihre gewerbliche Verwendung, Julius Springer Verlag, Berlin, p. 110, ISBN 13 978-3-642-89358-2, ISBN 13 978-3-642-91214-6, https://doi.org/10.1007//978-3-642-91214-6, 1932.
Miles, D. M., Mann, I. R., Ciurzynski, M., Barona, D., Narod, B. B., Bennest, J. R., Pakhotin, I. P., Kale, A., Bruner, B., Nokes, C. D. A., Cupido, C., Haluza-DeLay, T., Elliott, D. G., and Milling, D. K.: A miniature, low-power scientific fluxgate magnetometer: A stepping-stone to cube- satellite constellation missions, J. Geophys. Res.-Space, 121, 11839–11860, https://doi.org/10.1002/2016JA023147, 2016.
Miles, D. M., Dvorsky, R., Greene, K., Hansen, C. T., Narod, B. B., and Webb, M. D.: Contributors to fluxgate magnetic noise in permalloy foils including a potential new copper alloy regime, Geosci. Instrum. Method. Data Syst., 11, 111–126, https://doi.org/10.5194/gi-11-111-2022, 2022.
Müller, A.: Über die Mischungslücke in flüssigen Eisen-Kupfer-Legierungen, Z. Anorg. Chem., 162, 231–236, https://doi.org/10.1002/zaac.19271620121, 1927.
Müller, M., Lederer, T., Fornacon, K. H., and Schäfer, R.: Grain structure, coercivity and high-frequency noise in soft magnetic Fe81Ni-6Mo alloys, J. Magnet. Magnet. Mater., 177–181, 231–232, https://doi.org/10.1016/S0304-8853(97)00672-0, 1998.
Musmann, G. (Ed.) and Afanassiev, Y. V.: Fluxgate magnetometers for space research, BoD – Books on Demand, ISBN 978-3-8391-3702-4, 2010.
Nagaoka, H. and Taylor-Jones, E.: On the Effects of Magnetic Stress in Magnetostriction, Philos. Mag., 41, 454–461, https://doi.org/10.1080/14786449608620868, 1896.
Narod, B. B.: The origin of noise and magnetic hysteresis in crystalline permalloy ring-core fluxgate sensors, Geosci. Instrum. Method. Data Syst., 3, 201–210, https://doi.org/10.5194/gi-3-201-2014, 2014.
Narod, B. B., Bennest, J. R., Strom-Olsen, J. O., Nezil, F., and Dunlap, R. A.: An evaluation of the noise performance of Fe, Co, Si, and B amorphous alloys in ring-core fluxgate magnetometers, Can. J. Phys., 63, 1468–1472, https://doi.org/10.1139/p85-246, 1985.
Nature: “Supermalloy”: a New Magnetic Alloy, Nature, 161, 554, https://doi.org/10.1038/161554a0, 1948.
Neumann, H.: Über ballistische Messungen an hochpermeablen Materialien, Wiss. Veröff. a. d. Siemens-Konz., 10, 55–71, 1931.
Neumann, H.: Neue magnetisch Legierung “1040” mit hoher Anfangs-Permeabilität, Archiv für Technisches Messen, Z913-5, 291–292, https://doi.org/10.1524/teme.1934.3748.jg.291, 1934.
Neumann, H., Büchner, A., and Reinboth, H.: Mechanisch weiche Dauermagnetlegierungen aus Kupfer, Nickel und Eisen, Z. Metallkd., 29, 173–185, 1937.
Odani, Y.: Magnetic Properties of Cube-Textured 6–81.3 Mo – Permalloy, J. Appl. Phys., 35, 865–866, https://doi.org/10.1063/1.1713512, 1964.
Odani, Y. and Sunazawa, M.: US Patent 3,348,983, 1967.
Omega Sensing Solutions: FBGS Non-Fraying Fiberglass Sleeving, https://www.omega.ca/en/accessories/protection/wire-sleeves/p/FBGS (last access: 15 February 2024), 2022.
Pfeifer, F.: Zum Verständnis der magnetischen Eigenschaften technischer Permalloylegierungen, Z. Metallkd., 57, 295–300, 1966.
Pfeifer, F. and Boll, R.: New soft magnetic alloys for applications in modern electrotechnics and electronics, IEEE T. Mag., 5, 365–370, https://doi.org/10.1109/TMAG.1969.1066595, 1969.
Portevin, A. M. and Chevenard, P. A.: Influence de la finesse de structure lors du recuit des fontes grises, C. R. Acad. Sci. Paris, 189, 759–761, 1929.
Preisach, F.: Magnetische Untersuchungen an ausscheidungsfähigen Eisen-Nickel-Legierungen, Z. Physik, 93, 245–268, https://doi.org/10.1007/BF01365125, 1935.
Puzei, I. M.: The Influence of Cu, Si, Cr and Mo on the Magnetic Anisotropy and Saturation Induction of Ni-Fe Monocrystals, The Physics of Metals and Metallogaphy, 12, 136–138 (Fiz Metal. Metalloved, 12, 453–455), 1961.
Puzei, I. M.: A New Range of Compositions in the High-permeability Alloys on the System Fe-Ni-Mo, The Physics of Metals and Metallogaphy, 14, 47–49 (Fiz Metal. Metalloved, 14, 374–377), 1962.
Puzei, I. M. and Molotilov, B. V.: Volume Magnetostriction of Nickel-Iron-Molybdenum Alloys, (Izv. Akad. Nauk Ser. Fis., 22, 1244, 1958.) Bulletin of the Academy of Sciences of the USSR, 22, 1236–1242, 1958.
Qader, M. A., Vishina, A., Yu, L., Garcia, C., Singh, R. K., Rizzo, N. D., Huang, M., Chamberlin, R., Belashchenko, K. D., van Schilfgaarde, M., and Newman, N.: The magnetic, electrical and structural properties of copper-permalloy alloys, J. Magn. Magn. Mater., 442, 45–52, https://doi.org/10.1016/j.jmmm.2017.06.081, 2017.
Roll, F.: Beiträge zum Einfluss des Ni und Si auf die Mischungslücke des Fe/Cu-Systems im festen Zustand (20 °C), Z. Anorg. Allg. Chem., 212, 61–64, https://doi.org/10.1002/zaac.19332120109, 1933.
Ruer, R.: Über die Mischungslücke in flüssigen Eisen-Kupferlegierungen Z. Anorg. Chem., 164, 366–376, https://doi.org/10.1002/zaac.19271640134, 1927.
Ruer, R. und Goerens, F.: Über die Schmelz-und Kristallisationsvorgänge bei den Eisen-Kohlenstoff-Legierungen, Ferrum, 14, 49–61, 1916.
Sahmen, R.: Über die Legierungen des Kupfers mit Kobalt, Eisen, Mangan und Magnesium, Z. Anorg. Chem., 57, 1–33, https://doi.org/10.1002/zaac.19080570102, 1908.
Scanlon, W. W.: Solid state research of the Applied Physics Department for the year 1965, Naval Ordnance Lab, White Oak, MD, https://ntrs.nasa.gov/api/citations/19670003774/downloads/19670003774.pdf (last access: 15 February 2024), 1966.
Scholefield, H. H., Major, R. V., Gibson, B., and Martin, A. P.: Factors influencing the initial permeability of some alloys based on 80Ni20Fe, Brit. J. Appl. Phys., 18, 41–48, https://doi.org/10.1088/0508-3443/18/1/309, 1967.
Sekels: Shielding Foils from Vitrovac 6025 I50X, https://sekels.de/fileadmin/PDF/English/Materials__Magnetic_Shieldings/32_Brochure_Shielding_Foils_from_amorphous_VITROVAV_6025X.pdf (last access: 15 February 2024), 2019.
Shirae, K.: Noise in amorphous magnetic materials, IEEE T. Mag., 20, 1299–1301, https://doi.org/10.1109/TMAG.1984.1063504, 1984.
Smith, W. S. and Garnett, H. J.: US Patent 1,552,769, 1925.
Smith, W. S. and Garnett, H. J.: US Patent 1,582,353, 1926.
Smith, W. S. and Garnett, H. J.: US Patent1,635,443, 1927.
Snee, D. J.: Effects of Composition and Cooling Rate on the Initial Permeability of Mumetal, J. Appl. Phys., 38, 1174–1175, https://doi.org/10.1063/1.1709528, 1967.
Turbitt, C.: INTERMAGNET Definitive One-Second Data Standard, INTERMAGNET Technical Note TN6, https://intermagnet.org/docs/technical/im_tn_06_v1_0.pdf (last access: 15 February 2024), 2014.
Vacquier, V.: US Patent 2,406,870, 1946a.
Vacquier, V.: US Patent 2,407,202, 1946b.
Vogel, R.: Über das ternäre System Eisen-Kupfer-Nickel, Z. Anorg. Chem., 67, 1–16, 1910.
von Auwers, O.: Über Volumenmagnetostriktion an Poly- und Ein kristallen. Untersuchung an Eisen-Nickel- und Eisen-Nickel- Kobalt-Legierungen über die Abhängigkeit der Volumenmagnetostriktion von der Feldstärke und von der Kristallorientierung, Physik. Z., 34, 824–827, 1933.
von Auwers, O. and Neumann, H.: Über Eisen–Nickel–Kupfer-Legierungen hoher Anfangspermeabilität, Spec. Print. Sci. Publ. Siemens-Fact., Julius Springer, XIV, 92–108, 1935.
Williams, E. H.: Magnetic Properties of Copper-Nickel Alloys, Phys. Rev., 38, 828–831, https://doi.org/10.1103/PhysRev.38.828, 1931.
Wyckoff, R. D.: The Gulf Airborne Magnetometer, Geophysics, 13, 182–208, https://doi.org/10.1190/1.1437391, 1948.
The statements in this work are weight-percentages.
With an alloy of 72 % Ni, 11 % Fe, 14 % Cu, 3 % Mo, Neumann (1934) has realized the highest ever measured μ0-value (recently to 51 000).
Prior search in this direction was done in Inst. of Richard Becker, Charlottenburg, in 1933 by Max Kornetzki and Hans Neumann.
on the impact of Hc cf. below and von Auwers (1933).
Unpublished.
This naturally says nothing about the magnetostrictive behaviour in the various crystal-orientations, which individually can be different from zero and even need not agree in polarity; cf. Lichtenberger (1932).
The magnetostrictive strain-energy in the crystal lattice and as always – also in a well annealed lattice – available deformation-energy.
The other dimensions were the same for all probes, so that the values “ceteris paribus” [all else being equal] are comparable. The internal field-strength oriented H0-value might be very much smaller.
cf. Otto von Auwers (1933), p. 833, Fig. 6.
- Abstract
- Introduction
- Sample preparations
- Data acquisition
- Discussion
- Concluding remarks
- Appendix A: Translation of On Iron–Nickel–Copper Alloys of High Initial Permeability by Otto v. Auwers and Hans Neumann
- Appendix B: On Iron-Nickel-Copper Alloys of High Initial Permeability by Otto v. Auwers and Hans Neumann
- Code and data availability
- Author contributions
- Competing interests
- Disclaimer
- Acknowledgements
- Financial support
- Review statement
- References