the Creative Commons Attribution 4.0 License.
the Creative Commons Attribution 4.0 License.
Improving relative humidity measurements on Mars: new laboratory calibration measurements
Iina Jaakonaho
Jouni Polkko
Andreas Lorek
Stephen Garland
Jean-Pierre de Vera
Maria Genzer
Ari-Matti Harri
In this paper we present new calibration measurements that have been performed with the ground reference models of the relative humidity instruments of the Mars Science Laboratory (MSL), Mars 2020 and ExoMars missions. All instruments are based on capacitive sensor head technology, and they are developed, manufactured and tested by the Finnish Meteorological Institute (FMI). Calibration of capacitive humidity sensors for the Martian environment has been a challenging task and special facilities are needed in order to create Martian conditions including all relevant environmental parameters that can be accurately controlled and measured: low pressure, low temperature, carbon dioxide environment and especially humidity. A measurement campaign was performed at the German Aerospace Center (DLR) PASLAB (Planetary Analog Simulation Laboratory) to determine relative humidity calibration datasets for REMS-H, MEDA HS and METEO-H instruments in temperatures from −30 °C down to −70 °C in low-pressure CO2. In addition to the stable point humidity calibration measurements in CO2, the instrument performance was tested with the actual Martian atmosphere composition and during long continuous measurements. The new calibration dataset has already been used in the flight calibration of the MEDA HS instrument, resulting in successful calibration and excellent accuracy. The results from this campaign will further improve relative humidity measurements on Mars by providing the means to reanalyze the current calibration of the REMS-H flight model and by allowing more accurate comparison between the two instruments currently on the Martian surface.
- Article
(7061 KB) - Full-text XML
- BibTeX
- EndNote
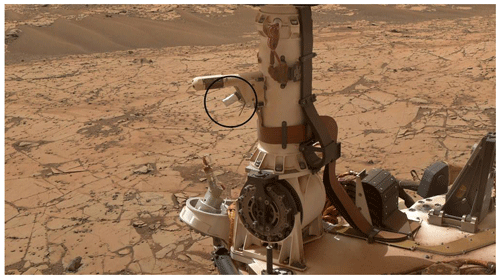
The Finnish Meteorological Institute (FMI) has provided atmospheric relative humidity (RH) instruments based on capacitive sensor heads for several Mars missions, the first operational one being REMS-H on board the Curiosity rover (Fig. 1), which landed on Mars in 2012. REMS-H was followed by MEDA HS on board the Perseverance rover in 2021. Both instruments are still active and producing daily readings of relative humidity. Relative humidity instruments have also been delivered for Mars-96 penetrators and small stations (Harri et al., 1998), for DREAMS on board the ExoMars 2016 Schiaparelli Entry, Descent and Landing Demonstrator Module (EDM) (Esposito et al., 2018), and for METEO on the ExoMars 2020 surface platform Kazachok (Zelenyi et al., 2015). The Mars-96 mission experienced a failure during launch, resulting in the loss of the mission; the landing of Schiaparelli EDM was not successful, and the ExoMars 2020 mission was suspended in March 2022. The ExoMars rover mission has been restarted but the landing platform will be a new development. In addition to the FMI instruments, only the Phoenix lander has measured relative humidity directly on the Martian surface (Zent et al., 2009).
Calibration of capacitive humidity sensors for the Martian environment has proven to be a challenging task. The capacitive sensors, which have been used in all in situ measurements so far, are sensitive not only to relative humidity but also other variables like temperature, low pressure and carbon dioxide (CO2) (Harri et al., 2014; Lorek and Majewski, 2018; Tabandeh and Högström, 2021). Special facilities are needed in order to create Martian conditions including all relevant environmental parameters, especially to control and measure the humidity inside the measurement chamber with sufficient accuracy, limiting the existing test facilities. In addition, measurements at low temperatures take time because the stabilization of the measurement system can be slow. Typically, the calibration campaign for the flight model needs to find a balance between the schedule, test scope and limitations such as cleanliness requirements, which can restrict the extent of any campaign. In fact, previous missions have encountered diverse challenges during the calibration process. The original calibration range of the Phoenix thermal and electrical conductivity probe (TECP) only partially overlapped with the actual operating conditions and the TECP was later recalibrated using an engineering model by Fischer et al. (2019). Curiosity's REMS-H returned relative humidity readings that were too low due to an unknown transducer electronics artifact, and a calibration compensation was developed (Harri et al., 2014) but without new calibration measurements in a relevant environment. The original REMS-H calibration data were measured in ambient pressure air and not in low-pressure CO2.
Building upon the experience from previous missions, a test program was planned for the humidity sensors from Mars 2020 and ExoMars 2020 using extensive ground reference model measurements to supplement the flight model calibration (Hieta et al., 2022). The actual flight models would go through only a simplified two-point calibration in Martian conditions. An appropriate facility for the supplementary ground reference measurements was identified as the German Aerospace Center (DLR) PASLAB (Planetary Analog Simulation Laboratory). This facility is used for habitability-related experiments under Martian conditions and for humidity sensor studies, for example by Lorek (2014) and Lorek and Majewski (2018).
In this work, we present the measurement campaign at the DLR PASLAB and its results, encompassing calibration measurements of three relative humidity instruments. The main motivation for the campaign was supplementing the flight calibration of the MEDA HS instrument on the Perseverance rover, while simultaneously gaining information and knowledge on the behavior of the older sensor type of the REMS-H instrument. The results of the measurement campaign presented in this paper regarding the MEDA HS have already been summarized in Hieta et al. (2022) and the dataset has been used in formulating the flight calibration for MEDA HS. This paper will provide a more thorough description of the tests, provide equivalent results for REMS-H and METEO-H, and provide new results of measurements in an accurate Martian gas mixture as well as characterization of MEDA HS self-heating during continuous measurements. The implications of these results concerning current REMS-H flight calibration are beyond the scope of this paper but will be a topic of future work.
1.1 Scientific background
Despite the atmosphere of Mars being extremely dry, water vapor still holds significant importance as one of the three main cycles that define the present climate of the planet, along with the cycles of CO2 and dust. Understanding the Martian water cycle is of high scientific importance as it can provide insight into the history and evolution of the planet's climate, geology and potential for habitability. Furthermore, accurate measurements of water vapor in the Martian atmosphere can inform future missions to the planet, including the search for signs of past or present microbial life (e.g., Kappen et al., 1996; de Vera et al., 2014; Stevenson et al., 2014).
Over a span of more than 50 years the combined observations from ground-based, satellite and in situ measurements have provided us with a solid understanding of the current climate on Mars. Most of the water today exists as ice in the polar caps and within the soil, providing reservoirs for a planetary-scale water cycle between the atmosphere and the polar cap areas. Strong seasonal variability is driven by water sublimating off of the north residual cap, producing the annual local maximum in atmospheric water vapor at high northern latitudes during summertime. The southern summer produces the opposite effect but with a significantly lower amplitude. This seasonal and latitudinal dependence has been known since the Viking era (e.g., Jakosky, 1985), and our understanding of the details of Martian water has inevitably advanced over time due to more observations.
In situ observations have been reviewed by Martínez et al. (2017). They can provide detailed information about local conditions, atmospheric properties and surface interactions, and they can support orbital observations by providing the ground truth. Near-surface humidity measurements have been used in particular for studying the exchange processes between the atmosphere and the regolith (e.g., Jakosky et al., 1997; Savijärvi et al., 2016) and for studying the potential for brine or ice formation (e.g., Fischer et al., 2016; Martínez et al., 2016). Furthermore, in situ atmospheric humidity measurements have been expanded through modeling activities conducted by, e.g., Savijärvi et al. (2019) and Savijärvi et al. (2020).
This paper is structured as follows. Section 2 introduces the experimental method, related equations, the FMI's relative humidity instruments and the experimental setup. The campaign results are presented in Sect. 3. Section 4 explains how the data have been used to formulate the calibration equations for MEDA HS and how the calibrated readings in this paper have been obtained. Section 5 provides conclusions and a discussion of the results presented.
2.1 Humidity equations
The HUMICAP sensor heads measure relative humidity (RH). The relative humidity is normally expressed as a percentage, representing the amount of water vapor in the air compared to the to the equilibrium amount (saturation) at that temperature:
where e is the water vapor partial pressure (hPa) and es is the saturation vapor pressure over ice (hPa). Relative humidity in this paper is calculated with respect to ice.
In order to calculate the water vapor volume mixing ratio (VMR), an equation for saturated water vapor pressure es over ice is needed. Several different equations exist for this purpose and we used the 1996 revision of the Buck equation (Buck, 1981):
where T is the air temperature in degrees Celsius (°C). The VMR (ppm) in pressure p (hPa) is then obtained with the equation
The reference dew point hygrometer measures the dew or frost point of the gas, which can be converted to relative humidity using Eq. (2).
2.2 FMI's relative humidity instruments
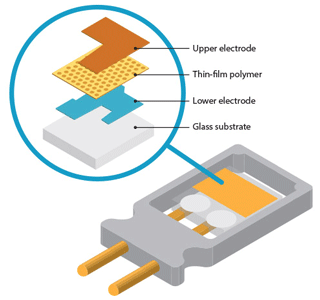
All the FMI's Martian relative humidity instruments are based on polymeric capacitive humidity sensor head technology, HUMICAP®, developed by a private company, Vaisala Oyj (Hum, 2020), which makes use of read-out electronics placed in the vicinity of the humidity sensor heads on the same printed circuit board (PCB). A schematic view of the HUMICAP is shown in Fig. 2. The sensor heads have integrated heating resistors that are used periodically to regenerate the HUMICAPs, removing possible contaminants that can affect the capacitance, restoring the sensor head performance and correcting for possible long-term drifts. The read-out electronics are based on an oscillator transducer that converts the output of the capacitive sensors into frequency. The capacitance of the channel is then obtained using the constant reference channels. The instruments contain eight measurement channels which can include two or three HUMICAP sensor heads, capacitive THERMOCAP® temperature sensors, and reference and housekeeping capacitors. The transducer's active components and the multiplexer are implemented into a Vaisala proprietary ASIC (application-specific integrated circuit). The humidity instruments are mounted outside the lander, providing ventilation with the ambient atmosphere through a filter protecting the devices from airborne dust.
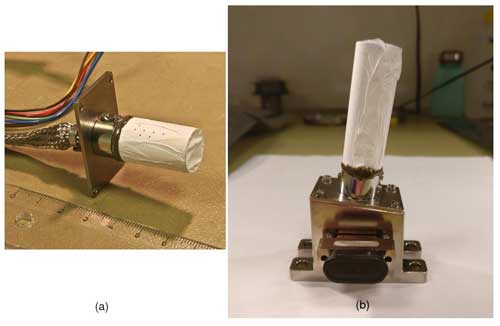
Figure 3REMS-H flight model (a) and MEDA HS flight model (b) inside the FMI's clean room. The white perforated PTFE filter around the cylindrical Faraday cage protects the instrument from atmospheric dust. MEDA HS is shown in flight configuration with complete mechanics, but during the DLR test campaign the large housing box for mounting the instrument was not installed on the REF model. METEO-H is almost identical to MEDA HS, except that the top of the housing box is not slanted.
REMS-H (Fig. 3a) represents the first generation of FMI relative humidity sensors including three earlier-generation HUMICAP sensor heads. REMS (Rover Environmental Monitoring Station) is a suit of sensors on board the Curiosity rover that measures various environmental parameters on the Martian surface and REMS-H is the sensor measuring relative humidity (Gomez-Elvira et al., 2012; Harri et al., 2014). The Curiosity rover landed at Gale Crater in early August 2012, meaning that it has operated on the Martian surface for over 10 years, providing valuable long time series of atmospheric measurements including relative humidity data (e.g., Savijärvi et al., 2019). DREAMS-H of the DREAMS (Dust Characterisation, Risk Assessment, and Environment Analyser on the Martian Surface) experiment on board ExoMars 2016 Schiaparelli (Esposito et al., 2018) was an almost exact copy of REMS-H except for some minor details in the PCB and mechanical design. Before the unsuccessful landing of the Schiaparelli module on Mars, the module's central computer activated the DREAMS instrument and sent back housekeeping data indicating that the DREAMS sensors were performing nominally.
MEDA HS (Fig. 3b) and the almost identical METEO-H are the next-generation successors of REMS-H. MEDA HS is a relative humidity sensor for the Mars 2020 Perseverance rover, and it has measured the Martian atmosphere since landing in February 2021 (Rodriguez-Manfredi et al., 2021, 2023; Hieta et al., 2022; Polkko et al., 2023). METEO-H was delivered for the ExoMars 2020 surface platform, but cooperation with Roscosmos on the ExoMars mission has since been terminated. Both MEDA HS and METEO-H are based on next-generation HUMICAP sensor heads. The new HUMICAP sensor head has the same polymer and operating principle as the one used in REMS-H but incorporates several improvements: the sensor heads have a significantly larger dynamic range and faster response time, and they include on-chip temperature measurement with Pt1000 platinum resistance temperature sensors. Pt1000 sensors are read directly by the MEDA Instrument Control Unit (ICU). The integrated temperature sensor allows calculation of humidity values with respect to the actual sensor head temperature instead of the PCB temperature. MEDA HS and METEO-H include two HUMICAP sensor heads and a revised selection of reference and housekeeping channels, as well as two board-mounted THERMOCAP temperature channels. The MEDA HS PCB is shown in Fig. 4.
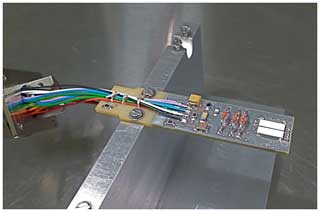
Figure 4MEDA HS PCB without the mechanics. The HUMICAP sensor heads are facing downwards through a hole in the PCB.
Each ground reference model (REF) of these relative humidity instruments is as similar to the flight model as possible, and they have been kept at the Finnish Meteorological Institute for calibration or performance testing. All REF models were regenerated before the measurement campaign. The REF models have been manufactured and tested together with the actual flight models but have not gone through environmental qualification or acceptance tests to avoid stressing the instruments.
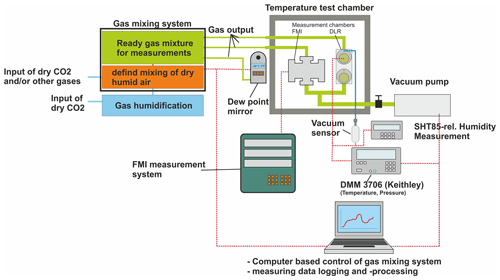
Figure 5Test setup for the FMI sensors at DLR. The measurement chamber (Fig. 6) including all three instruments was placed inside a temperature test chamber and connected to the gas mixing system and the vacuum pump. Part of the gas mixing system output was diverted to a reference dew point mirror.
2.3 Experimental setup
The results presented in this publication were obtained using the sensor calibration facility of the PASLAB (Planetary Analog Simulation Laboratory) at the Institute for Planetary research at the German Aerospace Center (DLR) in Berlin. The laboratory is used for habitability-related experiments under Martian conditions as well as humidity sensor studies (Lorek and Koncz, 2013). Similar sensor studies have been performed previously by Lorek and Majewski (2018) and Lorek (2014). A schematic diagram of the setup is shown in Fig. 5. At the core of the setup is a temperature control chamber, KWP240, capable of regulating the temperature inside the chamber in the range −75 to +130 °C. The chamber has two ports, one on the left and one on the right, through which cables, a gas inlet and vacuum tubing can be laid. It was considered critically important that all the instruments see the same conditions at the same time during the campaign in order to ensure equal calibration for all and to allow comparison between the instruments. For this purpose, a single test chamber including all three instruments was designed. The same chamber was previously used at the FMI for testing relative humidity instruments, but for the first time it was modified to house three sensors of different missions with slightly different dimensions and interfaces. Figure 6 shows the instruments placed inside the test chamber facing towards the middle. The gas flow through the chamber across each sensor is equal. A small-sized Pt100 temperature sensor was also included in the chamber to measure the temperature independently of the instruments. In addition to the three humidity sensors from the FMI, a series of Sensirion SHT-85 relative humidity sensors from the DLR were installed in a parallel chamber. The results of these measurements will be presented in a separate publication.
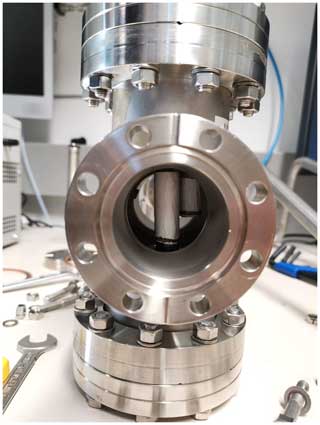
Figure 6All three instruments inside the measurement chamber (the third one is behind the others). The opening from the front to the back of the chamber that can be seen here is the path of the gas flow when the chamber is placed in the test setup. The other two flanges have the electrical feedthroughs for the instruments and the separate temperature sensor.
The gas composition was generated using the gas mixing system indicated in Fig. 5 and the pressure in the chamber was controlled using a vacuum pump. It consists of a gas humidification system where part of the matrix gas, in this case CO2, is diverted and dispersed in a bottle containing distilled water, thus obtaining close to 100 % humidity. This humidified CO2 is then mixed with CO2 directly from the gas bottle (99.995 % CO2) at approximately −65 °C frost point using precision El-flow Select mass-flow controllers from the company Bronkhorst High-Tech B.V. Nine controllers were used for this experiment, allowing control of gas flow down to 0.014 mLn min−1 (milliliter normal per minute) and guaranteeing precise humidity generation over the full range of required humidities with a stability of ±0.1 °C. Correction factors can be applied to the controllers for a variety of gases, including CO2. The humidity generated by the gas mixing system can be estimated to a precision of the order of 1 or 2 °C frost point; however, to obtain the high precision necessary for sensor calibration experiments part of the outgoing gas flow was diverted to a dew point mirror (MBW 373) to directly measure the humidity to a precision of 0.1 °C frost point. With knowledge of the atmospheric pressure and the pressure inside the measurement chamber, the humidity in the measurement chamber can be calculated. A paper analyzing MEDA HS instrument uncertainty and also including the error in the humidity measurement has been written by Tabandeh et al. (Tabandeh and Högström, 2021). The expanded uncertainty (k=2) of the Pt100 sensor inside the chamber is equal to or better than 0.18 °C, and for the MEDA HS Pt1000 sensors the expanded uncertainty is equal to or better than 0.22 °C. The chamber pressure measurement has an expanded uncertainty of approximately 14 to 17 Pa, while the atmospheric pressure measurement has an expanded uncertainty of 400 Pa.
The entire climate simulation system was controlled using LabVIEW software, allowing automated generation of humidity and pressure control. In addition, the software was used to log data from the climate chamber, dew point mirror, vacuum pump and the relative humidity sensors from the DLR. The reference dew point mirror and pressure sensor were logged every 2 min continuously. The FMI humidity sensors were read by another computer with dedicated test equipment, the same equipment that has been used in all calibration tests.
2.4 Experimental procedure
The main part of the measurement campaign consisted of measurements in equilibrium temperature and relative humidity conditions. The goal parameters were set in the control software and the chamber was left to stabilize for a predetermined time period. The gas flow rate through the measurement chamber was 10 NL h−1. Controlling of the parameters was automatic, allowing the experiment to run continuously for long periods of time.
Dry measurements were performed as a part of the experiment, but saturation humidities were not planned. Saturation conditions would not cause damage to the sensors but can cause erroneous readings until the sensor heads have dried out.
The following measurement goals were set for these experiments (in priority order).
-
Measure the instrument response in RH in the range from 0 % to <100 % RH at stable Martian temperature (−50 °C or less) and at a stable Martian pressure of 8 hPa in CO2 gas.
-
Repeat the RH measurements at multiple temperatures between −30 and −70 °C.
-
Repeat the RH measurements at higher and lower Martian range pressure in CO2.
-
Repeat the measurements at a representative Martian gas mixture, at least at one temperature and pressure.
Each instrument was measured with 1 Hz frequency for only 10 s in order to avoid self-heating. From the 10 s data, seconds 2–5 are averaged in order to get the actual measurement point. Each instrument was measured with a 10 min period. The measurements were run automatically in a continuous way, also during the environmental changes.
The measurement set points are given in Table 1. The actual achieved input values for pressure and humidity differ slightly compared to the table, and the final achieved measurement points are presented in Sects. 3.1 and 3.2. Parameters like temperature and pressure can also drift slowly during the measurements, but this is not an issue because all reference values are taken from the reference sensors simultaneously with the instrument measurements.
The campaign was carried out successfully and all the campaign objectives were met. The campaign was run from autumn 2020 to spring 2021 despite the COVID-19 pandemic. The measurements started from stable temperature and pressure and close to zero humidity, and the humidity inside the chamber was increased in a stepwise manner. After reaching the highest humidity, the steps were repeated again towards zero relative humidity. Figure 7 gives an example of measurements of one humidity instrument during a measurement run at stable temperature and pressure and changing humidity. In addition to the stable point calibration measurements in CO2 (Sects. 3.1 and 3.2), experiments were also performed in a Martian-like gas mixture (Sect. 3.3) and with MEDA HS kept continuously powered on instead of regular short measurements (Sect. 3.4).
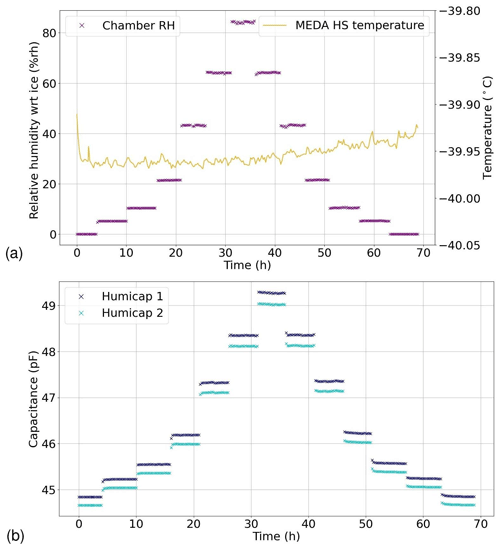
Figure 7Example of increasing and decreasing RH measurements in −40 °C. Panel (a) shows the relative humidity reference measurement calculated from the dew point mirror at instrument temperature (purple) and the instrument temperature evolution during the measurement (orange). In panel (b) HUMICAP 1 and 2 capacitances calculated from raw data are shown for the same run. Each point represents one measurement every 15 min.
3.1 Temperature dependence in the Martian environment
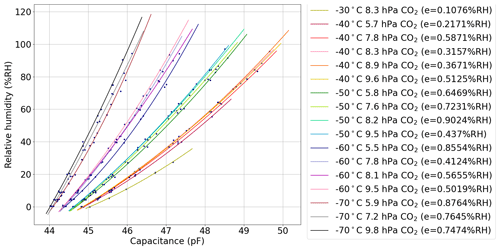
The environmental temperature not only affects the HUMICAP sensor capacitance but also the sensor dynamic range. At low temperatures the dynamic range is significantly reduced compared to room temperature. At +22 °C and atmospheric pressure the dynamic range of the newer HUMICAP sensor head is on the order of 7 pF and at −70 °C only 2.5–3 pF. The older sensor type used in REMS-H has a dynamic range of only 0.3 pF in −70 °C. An example of humidity measurements at different temperatures is shown in Fig. 8. Using regression analysis on the dataset it was determined that a second-degree polynomial curve provided the best fit for the observed relationships between the variables with all three measured instruments. Examples of second-degree polynomial fits are shown in Fig. 8. The different temperatures are clearly distinguishable and the reduced dynamic range towards lower temperatures is also evident. Due to limitations in the humidity control system at the PASLAB the range of possible relative humidities was limited at higher temperatures, and thus −30 °C was the highest test temperature.
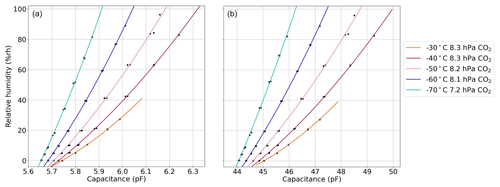
Figure 8Measurements of REMS-H (a) and MEDA HS (b) at different temperatures and relative humidities between 0 % and 100 % RH at stable Mars pressure. The results are shown in terms of reference relative humidity (y axis) and the calculated capacitance of one HUMICAP sensor head (x axis). The HUMICAP behavior at each temperature was found to be optimally captured by fitting a second-degree polynomial function to the data.
3.2 Pressure dependence in the Martian environment
In addition to different Martian temperatures, measurements were also taken under different pressures ranging from 5.5 to 9.8 hPa. Figure 9 shows all the successful measurement points for each instrument in CO2, resulting from the measurement program given in Table 1. The temperatures vary from −30 to −70 °C and relative humidity from close to zero to almost 100 % RH. As expected, it was more challenging to reach lower humidity levels at lower temperatures. At −70 °C the lowest humidities recorded were approximately 0.3 % RH, while at −40 °C, the humidity levels ranged between 0.01 % and 0.02 % RH.
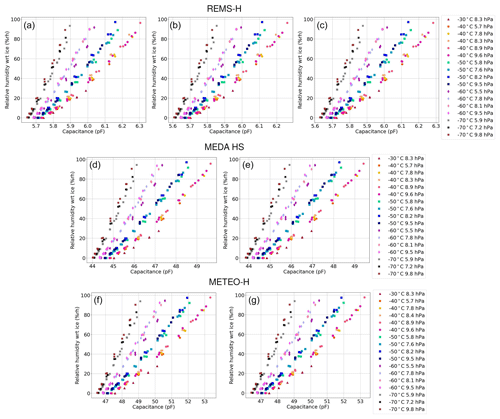
Figure 9Resulting measurements at different temperatures, humidities and pressures for all HUMICAP sensor heads from the three tested instrument models: REMS-H (a–c), MEDA HS (d, e) and METEO-H (f, g). The relative humidity is calculated from the experimental chamber parameters and the capacitance is calculated from the raw HUMICAP data. Each point is averaged over a 4 s period, calculated from the beginning of a stabilized measurement.
The measurements revealed a pressure dependency under Martian conditions, increasing towards the coldest temperatures. For example, in the case of MEDA HS, at −70 °C a pressure difference of 100 Pa would result in a difference of 2.8 % in relative humidity. The difference is of the same order as the measurement uncertainty of the sensor. For reference, the diurnal pressure amplitude at the Perseverance landing site, Jezero Crater, is 10–35 Pa, and the seasonal pressure variation based on previous missions can be more than 200 Pa (Harri et al., 2024). It is therefore clear that the pressure changes on the Martian surface must also be taken into account in the calibration of the instruments. An example of second-degree polynomial fits to each measurement series for one sensor head of MEDA HS REF is given in Fig. 10.
3.3 Martian-like gas mixture
It has been assumed that because the Martian atmosphere is 95 % by volume carbon dioxide, the calibration could be performed in pure CO2 without the other trace gases. That assumption was possible to put to the test at the PASLAB by comparing measurements with 100 % CO2 with measurements in a Martian-like gas mixture. The tested Martian-like atmosphere was composed of 3.7 % air (ca. 2.96 % N2 and 0.74 % O2), 1.6 % Ar and 94.7 % CO2. The Martian atmosphere measured by Curiosity's SAM (Sample Analysis at Mars) instrument is 95 % by volume of carbon dioxide (CO2), 2.6 % molecular nitrogen (N2), 1.9 % argon (Ar), 0.16 % molecular oxygen (O2) and 0.06 % carbon monoxide (CO) (Trainer et al., 2019).
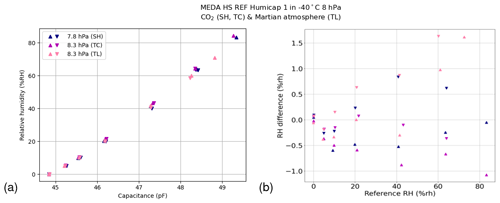
The Martian gas mixture was tested only at one temperature, −40 °C, and one Martian pressure but at multiple RH points. This temperature was selected over lower, maybe more representative, temperatures because the dynamic range of the instruments is larger at higher temperature and therefore any difference between the measurements would be more easily seen. Scattering of the measurements is also smaller at higher temperatures. The resulting data series was compared to measurements in pure CO2 at the same temperature and at two similar pressures. The results can be seen in Fig. 11. In the capacitance plot there is no visible difference between the measurements in pure CO2 and in the Martian gas mixture. The difference was further investigated using calibrated RH data (calibration as described in Sect. 4) from MEDA HS REF. The larger scattering and larger calibration error of the measurement point towards higher humidities, in line with the typical behavior of the instrument. There is no distinctive pattern in the Martian gas mixture measurements in the difference plot, and while the largest discrepancies from the reference, reaching 1.5 % RH, are seen in the Martian gas mixture measurements at humidity of 60 % RH, the measurements are not consistently higher than the CO2 measurements, leading to the conclusion that the measurements show no differences related to the gas compositions. Even the largest differences fall within the measurement uncertainty range of approximately 3 % RH (uncertainty of MEDA HS flight model in similar conditions).
3.4 Startup self-heating effect
The calibration of the humidity instruments has been determined by using very short measurements in order to avoid self-heating; however, on Mars both the MEDA and REMS humidity instruments have been measuring continuously, also for longer time periods, for operational reasons.
When the instrument is powered on, a slight warming of the temperature sensors is visible over a time on the order of 10 s, even though the power consumption of the sensor is only about 20 mW. The sensor self-heating is prominent for approximately 15 to 20 min, after which the sensor temperature stabilizes. Intrinsically the local relative humidity at the sensor drops when the sensor temperature rises, and this can usually be clearly seen in the long continuous measurements of the REMS-H and MEDA HS on Mars.
While the relative humidity is intrinsically affected by the self-heating, in the ideal case the derived absolute VMR should be the same before and after self-heating when the environment stays the same. In that case the relative humidity sensor data could be used as such after the self-heating period. This theory was tested with the MEDA HS ground reference model at the DLR PASLAB in low-pressure CO2 at −60 °C.
Figure 12 shows two test measurements. The calibrated relative humidity (calibration as described in Sect. 4) of the MEDA HS ground reference model is compared to the reference RH, calculated from the dew point mirror frost point temperature and from the MEDA HS temperature, and to chamber RH. Both measurements were performed at −60 °C but in different humidities. In the upper panel the RH was around 9 % during instrument startup and in the lower panel 38 %. A small calibration offset has been added in order to see the difference between the instrument and reference RH more clearly. The plots show that there is no significant difference after the self-heating period has stabilized, and even during self-heating both readings follow the ideal reference curve quite well.
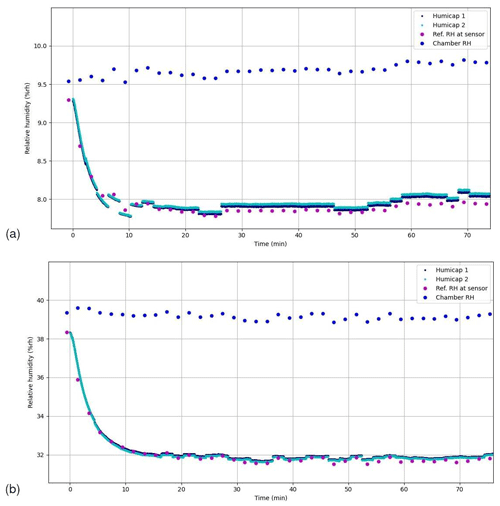
Figure 12Calibrated RH of MEDA HS compared to the reference during the MEDA HS self-heating test. Two measurements shown in panels (a) and (b) were acquired with different humidity levels, both at −60 °C in 8 hPa. The reference RH is calculated from the reference frost point at HS temperature, while the chamber RH is calculated from the reference frost point at chamber temperature. The MEDA HS RH has been offset-corrected to the same level as the reference RH in order to allow comparison of the two readings. Occasionally disjointed RH values from MEDA HS are due to fluctuations in the chamber reference pressure readings, which are used to calculate the calibrated RH.
Figure 13 shows the same measurements as Fig. 12 but with a derived VMR (average of the two sensor heads) compared to the reference VMR. The reference VMR is calculated from the dew point mirror frost point, chamber temperature and pressure. In the 9 % RH measurement the instrument VMR first rises rapidly 2 ppm above the reference VMR and then drops about 1.5 ppm below the reference before stabilizing slightly above the reference VMR. Similar behavior is also present in the 38 % RH measurement. This behavior is most likely due to small temperature gradients developing in the PCB electronics during the self-heating period (Polkko et al., 2023). At the end of the measurements, 70 min after powering up the instrument, the difference between the measured VMR and reference VMR is about 2 ppm. It is very small compared to the measurement uncertainty of the MEDA HS flight model VMR, which would be around 15 ppm at 9 % RH and about 30 ppm at 38 % RH at this temperature.
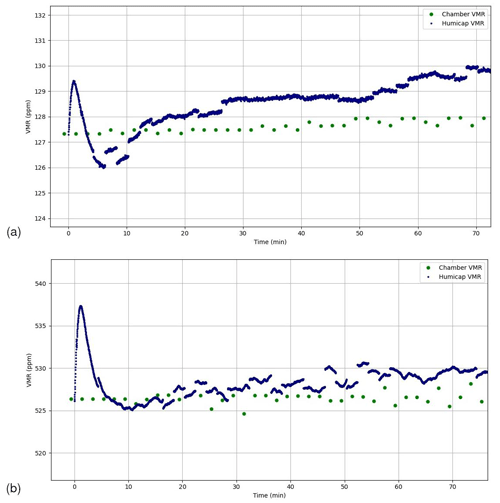
Figure 13Calibrated average VMR of MEDA HS HUMICAPs compared to the reference during the MEDA HS self-heating test in the same cases as in Fig. 12. Reference VMR is calculated from the reference frost point at chamber temperature and pressure. The sensor VMR first rapidly increases and decreases during the self-heating period before stabilizing slightly above the reference VMR.
As the test was only performed at one temperature and in two different humidities, the results cannot be considered conclusive yet. But it seems plausible that these instruments can also be operated continuously with the current calibration.
The measurements presented in this paper have already been used in Perseverance's MEDA HS humidity sensor calibration. The measurements of the actual flight model at the FMI and the measurements at the DLR PASLAB were combined to provide more accurate calibration coefficients that would not have been achieved with the original measurements at the FMI alone.
Because all sensor heads and instruments are unique, in order to utilize the ground reference model measurements, information about the differences between the instruments is needed so that the calibration information can be transferred. This is made possible by simultaneous measurements of flight and reference models at the FMI, the very similar behavior between the different HS models and also the statistics of an almost identical METEO-H REF model included in the calibration campaign.
Using data taken at 7–8 hPa, dry and saturation curves were calculated from HUMICAP capacitance readings (pF) as a function of the HUMICAP temperature. Only the average values of the first 2–5 s of each measurement are used in the calibration. A scaled capacitance was calculated using 100 % and 0 % RH curves to give the range of the capacitance at each temperature. Scaled capacitances of all four HUMICAP sensor heads from MEDA HS and METEO-H were combined to increase statistics, and a calibration curve was fitted to the combined data. This calibration curve was then transferred to MEDA HS flight model HUMICAPs. The calibration of the MEDA HS is presented in more detail in Hieta et al. (2022). For the ground reference models, a calibration has been calculated separately for each HUMICAP since the averaging is not necessary.
The relative humidity reading (% RH) is calculated from the scaled capacitance with a second-degree polynomial:
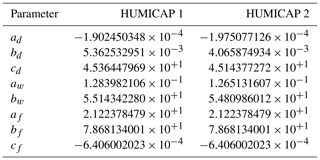
Calibration parameters for the MEDA HS ground reference model used in this paper are given in Table 2.
A comprehensive uncertainty analysis was performed for the MEDA HS flight model by Tabandeh and Högström (2021). Fitting residuals of the method described above were found to be the main uncertainty source for MEDA HS. Therefore a compensation model was developed by studying the correlation between the fitting residuals and temperature, pressure and relative humidity. The compensation model has also been applied to the MEDA HS ground reference model calibrated RH shown in Figs. 12 and 11.
The compensation is the same for both the MEDA HS reference model and flight model HUMICAPs, defined as
where T is temperature (°C) and P is pressure (Pa). Terms c1, c2 and c3 are defined as follows.
Final corrected RH for the MEDA HS ground reference model is obtained by adding the compensation to the RH obtained through scaled capacitance:
The measurement campaign at the DLR PASLAB resulted in high-quality calibration datasets in a representative Martian environment for REMS-H, MEDA HS and METEO-H relative humidity instruments. The tested models were flight-representative ground reference models which were manufactured and tested together with the actual flight models. Currently REMS-H on board the Curiosity rover and MEDA HS on board the Perseverance rover are operating on Mars, while the ExoMars surface platform mission including METEO-H has been canceled. Although METEO-H will not be operational on Mars, it has provided important statistics about the behavior of the new HUMICAP sensor heads.
The new calibration dataset has already been used in the flight calibration of the MEDA HS instrument, resulting in excellent accuracy and trustworthiness of the measurements the instrument provides. With this dataset and the calibration compensation developed based on it, we were able to improve the calibration uncertainty from an estimated ≤10 % to ≤4.4 % RH at temperatures down to −70 °C (Tabandeh and Högström, 2021). No changes or corrections have been necessary since the calibration presented in Hieta et al. (2022).
The dataset also provides the means to reanalyze the current calibration of the REMS-H flight model. The current compensated calibration of REMS-H will be compared to a calibration derived from the dataset presented in this paper in order to assess the need for possible recalibration, and in the best case the flight calibration could be improved using the new data. However, the unknown transducer electronics artifact affecting REMS-H is likely more complicated than just a calibration issue, so we do not expect it to reach the same performance as MEDA HS even with recalibration. In any case, the analysis of REMS-H calibration will allow for a better comparison between the two instruments on Mars, enhancing the scientific output from the two locations.
In addition to the stable point humidity calibration measurements in carbon dioxide, two other experiments were run with the same setup. Comparative measurements were performed with a realistic Martian atmosphere composition to confirm that there is no difference compared to a pure CO2 atmosphere, justifying the calibration performed in just CO2. The measurements were successful and indeed they confirmed that the measurements were fully concordant. Another experiment in addition to the normal calibration was to test the continuous measurement mode of MEDA HS, where the instrument is kept powered on for longer periods of time, instead of periodic operation, used to avoid self-heating. The conducted tests have produced encouraging results, suggesting that self-heating has a negligible impact on the absolute VMR. However, additional testing and analysis are required to validate these findings over a larger operational temperature range and to determine their applicability to the flight models.
The raw calibration data are partially treated as confidential; however, a processed dataset can be provided upon request.
Conceptualization: all authors. Data curation: MH, IJ, JP, AL and SG. Formal analysis: MH, IJ and JP. Investigation: MH, IJ, AL and SG. Methodology: MH, IJ, JP, AL and SG. Project administration and supervision: JPdV, MG, AMH. Resources: MH, IJ, JP, AL, SG and JPdV. Software: MH, IJ, AL and SG. Visualization: IJ, AL and SG. Writing – original draft: MH, IJ and JP. Writing – review and editing: MH, IJ, JP, AL, SG and AMH.
At least one of the (co-)authors is a member of the editorial board of Geoscientific Instrumentation, Methods and Data Systems. The peer-review process was guided by an independent editor, and the authors also have no other competing interests to declare.
Publisher's note: Copernicus Publications remains neutral with regard to jurisdictional claims made in the text, published maps, institutional affiliations, or any other geographical representation in this paper. While Copernicus Publications makes every effort to include appropriate place names, the final responsibility lies with the authors.
Maria Hieta, Iina Jaakonaho, Jouni Polkko and Ari-Matti Harri are grateful for Research Council of Finland grant no. 310509. We would also like to thank Vaisala Oyj for providing the sensor heads for the relative humidity instrument family and for their long-term cooperation and support.
This research has been supported by the Research Council of Finland (grant no. 310509).
This paper was edited by Ralf Srama and reviewed by Andrew Ball and one anonymous referee.
Buck, A. L.: New equations for computing vapor pressure and enhancement factor, J. Appl. Meteorol. Clim., 20, 1527–1532, https://doi.org/10.1175/1520-0450(1981)020<1527:NEFCVP>2.0.CO;2, 1981. a
de Vera, J.-P., Schulze-Makuch, D., Khan, A., Lorek, A., Koncz, A., Möhlmann, D., and Spohn, T.: Adaption of an Antarctic lichen to Martian niche conditions can occur within 34 days, Planet. Space Sci., 98, 182–190, https://doi.org/10.1016/j.pss.2013.07.014, 2014. a
Esposito, F., Debei, S., Bettanini, C., Molfese, C., Arruego Rodríguez, I., Colombatti, G., Harri, A.-M., Montmessin, F., Wilson, C., Aboudan, A., Schipani, P., Marty, L., Álvarez, F. J., Apestigue, V., Bellucci, G., Berthelier, J.-J., Brucato, J. R., Calcutt, S. B., Chiodini, S., Cortecchia, F., Cozzolino, F., Cucciarrè, F., Deniskina, N., Déprez, G., Di Achille, G., Ferri, F., Forget, F., Franzese, G., Friso, E., Genzer, M., Hassen-Kodja, R., Haukka, H., Hieta, M., Jiménez, J. J., Josset, J.-L., Kahanpää, H., Karatekin, O., Landis, G., Lapauw, L., Lorenz, R., Martinez-Oter, J., Mennella, V., Möhlmann, D., Moirin, D., Molinaro, R., Nikkanen, T., Palomba, E., Patel, M. R., Pommereau, J.-P., Popa, C. I., Rafkin, S., Rannou, P., Renno, N. O., Rivas, J., Schmidt, W., Segato, E., Silvestro, S., Spiga, A., Toledo, D., Trautner, R., Valero, F., Vázquez, L., Vivat, F., Witasse, O., Yela, M., Mugnuolo, R., Marchetti, E., and Pirrotta, S.: The DREAMS Experiment Onboard the Schiaparelli Module of the ExoMars 2016 Mission: Design, Performances and Expected Results, Space Sci. Rev., 214, 103, https://doi.org/10.1007/s11214-018-0535-0, 2018. a, b
Fischer, E., Martínez, G., and Rennó, N.: Formation and Persistence of Brine on Mars: Experimental Simulations throughout the Diurnal Cycle at the Phoenix Landing Site, Astrobiology, 16, 937–948, https://doi.org/10.1089/ast.2016.1525, 2016. a
Fischer, E., Martínez, G. M., Rennó, N. O., Tamppari, L. K., and Zent, A. P.: Relative Humidity on Mars: New Results From the Phoenix TECP Sensor, J. Geophys. Res.-Planet., 124, 2780–2792, https://doi.org/10.1029/2019JE006080, 2019. a
Gomez-Elvira, J., Armiens, C., Castañer, L., Domínguez, M., Genzer, M., Gómez, F., Haberle, R., Harri, A.-M., Jiménez, V., Kahanpää, H., Kowalski, L., Lepinette, A., Martín, J., Martínez-Frías, J., McEwan, I., Mora, L., Moreno, J., Navarro, S., de Pablo, M. A., Peinado, V., Peña, A., Polkko, J., Ramos, M., Renno, N. O., Ricart, J., Richardson, M., Rodríguez-Manfredi, J., Romeral, J., Sebastián, E., Serrano, J., de la Torre Juárez, M., Torres, J., Torrero, F., Urquí, R., Vázquez, L., Velasco, T., Verdasca, J., Zorzano, M.-P., and Martín-Torres, J.: REMS: The Environmental Sensor Suite for the Mars Science Laboratory Rover, Space Sci. Rev., 170, 583–640, https://doi.org/10.1007/s11214-012-9921-1, 2012. a
Harri, A.-M., Linkin, V., Polkko, J., Marov, M., Pommereau, J. P., Lipatov, A., Siili, T., Manuilov, K., Lebedev, V., Lehto, A., Pellinen, R., Pirjola, R., Carpentier, T., Malique, C., Makarov, V., Khloustova, L., Esposito, L., Maki, J., Lawrence, G., and Lystsev, V.: Meteorological observations on Martian surface: met-packages of Mars-96 Small Stations and Penetrators, Planet. Space Sci., 46, 779–793, https://doi.org/10.1016/S0032-0633(98)00012-9, 1998. a
Harri, A.-M., Genzer, M., Kemppinen, O., Gomez-Elvira, J., Haberle, R., Polkko, J., Savijärvi, H., Rennó, N., Rodriguez-Manfredi, J. A., Schmidt, W., Richardson, M., Siili, T., Paton, M., de la Torre-Juarez, M., Mäkinen, T., Newman, C., Rafkin, S., Mischna, M., Merikallio, S., Haukka, H., Martin-Torres, J., Komu, M., Zorzano, M.-P., Peinado, V., Vazquez, L., and Urqui, R.: Mars Science Laboratory relative humidity observations: Initial results, J. Geophys. Res.-Planet., 119, 2132–2147, https://doi.org/10.1002/2013JE004514, 2014. a, b, c
Harri, A.-M., Paton, M., Hieta, M., Polkko, J., Newman, C., Pla-Garcia, J., Leino, J., Mäkinen, T., Kauhanen, J., Jaakonaho, I., Sánchez-Lavega, A., Hueso, R., Genzer, M., Lorenz, R., Lemmon, M., Vicente-Retortillo, A., Tamppari, L. K., Viudez-Moreiras, D., de la Torre-Juarez, M., Savijärvi, H., Rodríguez-Manfredi, J. A., and Martinez, G.: Perseverance MEDA Atmospheric Pressure Observations–Initial Results, J. Geophys. Res.-Planet., 129, e2023JE007880, https://doi.org/10.1029/2023JE007880, 2024. a
Hieta, M., Genzer, M., Polkko, J., Jaakonaho, I., Tabandeh, S., Lorek, A., Garland, S., de Vera, J.-P., Fischer, E., Martínez, G. M., Harri, A.-M., Tamppari, L., Haukka, H., Meskanen, M., de la Torre Juárez, M., and Rodriguez Manfredi, J. A.: MEDA HS: Relative humidity sensor for the Mars 2020 Perseverance rover, Planet. Space Sci., 223, 105590, https://doi.org/10.1016/j.pss.2022.105590, 2022. a, b, c, d, e
Hum: HUMICAP technology description, Vaisala Oyj, https://www.vaisala.com/sites/default/files/documents/HUMICAP-Technology-description-B210781EN.pdf (last access: 2 August 2023), 2020. a, b
Jakosky, B. M.: The Seasonal Cycle of Water on Mars, Space Sci. Rev., 41, 131–200, https://doi.org/10.1007/BF00241348, 1985. a
Jakosky, B. M., Zent, A. P., and Zurek, R. W.: The Mars Water Cycle: Determining the Role of Exchange with the Regolith, Icarus, 130, 87–95, https://doi.org/10.1006/icar.1997.5799, 1997. a
Kappen, L., Schroeter, B., Scheidegger, C., Sommerkorn, M., and Hestmark, G.: Cold resistance and metabolic activity of lichens below 0 degC, Adv. Space Res., 18, 119–128, https://doi.org/10.1016/0273-1177(96)00007-5, 1996. a
Lorek, A.: Humidity measurement with capacitive humidity sensors between −70 °C and 25 °C in low vacuum, J. Sens. Sens. Syst., 3, 177–185, https://doi.org/10.5194/jsss-3-177-2014, 2014. a, b
Lorek, A. and Koncz, A.: Simulation and Measurement of Extraterrestrial Conditions for Experiments on Habitability with Respect to Mars, in: Habitability of Other Planets and Satellites, vol. 28, edited by: de Vera, J.-P. and Seckbach, J., Springer Netherlands, Dordrecht, 145–162, https://doi.org/10.1007/978-94-007-6546-7_9, 2013. a
Lorek, A. and Majewski, J.: Humidity Measurement in Carbon Dioxide with Capacitive Humidity Sensors at Low Temperature and Pressure, Sensors, 18, 2615, https://doi.org/10.3390/s18082615, 2018. a, b, c
Martínez, G. M., Fischer, E., Rennó, N., Sebastián, E., Kemppinen, O., Bridges, N., Borlina, C., Meslin, P.-Y., Genzer, M., Harri, A.-H., Vicente-Retortillo, A., Ramos, M., de la Torre Juárez, M., Gómez, F., and Gómez-Elvira, J.: Likely frost events at Gale crater: Analysis from MSL/REMS measurements, Icarus, 280, 93–102, https://doi.org/10.1016/j.icarus.2015.12.004, 2016. a
Martínez, G. M., Newman, C. N., De Vicente-Retortillo, A., Fischer, E., Rennó, N. O., Richardson, M. I., Fairén, A. G., Genzer, M., Guzewich, S. D., Haberle, R. M., Harri, A.-M., Kemppinen, O., Lemmon, M. T., Smith, M. D., de la Torre-Juárez, M., and Vasavada, A. R.: The Modern Near-Surface Martian Climate: A Review of In-situ Meteorological Data from Viking to Curiosity, Space Sci. Rev., 212, 295–338, https://doi.org/10.1007/s11214-017-0360-x, 2017. a
Polkko, J., Hieta, M., Harri, A.-M., Tamppari, L., Martínez, G., Viúdez-Moreiras, D., Savijärvi, H., Conrad, P., Zorzano Mier, M. P., De La Torre Juarez, M., Hueso, R., Munguira, A., Leino, J., Gómez, F., Jaakonaho, I., Fischer, E., Genzer, M., Apestigue, V., Arruego, I., Banfield, D., Lepinette, A., Paton, M., Rodriguez-Manfredi, J. A., Sánchez Lavega, A., Sebastian, E., Toledo, D., Vicente-Retortillo, A., and MEDA team: Initial Results of the Relative Humidity Observations by MEDA Instrument Onboard the Mars 2020 Perseverance Rover, J. Geophys. Res.-Planet., 128, e2022JE007447, https://doi.org/10.1029/2022JE007447, 2023. a, b
Rodriguez-Manfredi, J. A., de la Torre Juárez, M., Alonso, A., Apéstigue, V., Arruego, I., Atienza, T., Banfield, D., Boland, J., Carrera, M. A., Castañer, L., Ceballos, J., Chen-Chen, H., Cobos, A., Conrad, P. G., Cordoba, E., del Río-Gaztelurrutia, T., de Vicente-Retortillo, A., Domínguez-Pumar, M., Espejo, S., Fairen, A. G., Fernández-Palma, A., Ferrándiz, R., Ferri, F., Fischer, E., García-Manchado, A., García-Villadangos, M., Genzer, M., Giménez, S., Gómez-Elvira, J., Gómez, F., Guzewich, S. D., Harri, A. M., Hernández, C. D., Hieta, M., Hueso, R., Jaakonaho, I., Jiménez, J. J., Jiménez, V., Larman, A., Leiter, R., Lepinette, A., Lemmon, M. T., López, G., Madsen, S. N., Mäkinen, T., Marín, M., Martín-Soler, J., Martínez, G., Molina, A., Mora-Sotomayor, L., Moreno-Álvarez, J. F., Navarro, S., Newman, C. E., Ortega, C., Parrondo, M. C., Peinado, V., Peña, A., Pérez-Grande, I., Pérez-Hoyos, S., Pla-García, J., Polkko, J., Postigo, M., Prieto-Ballesteros, O., Rafkin, S. C. R., Ramos, M., Richardson, M. I., Romeral, J., Romero, C., Runyon, K. D., Saiz-Lopez, A., Sánchez-Lavega, A., Sard, I., Schofield, J. T., Sebastian, E., Smith, M. D., Sullivan, R. J., Tamppari, L. K., Thompson, A. D., Toledo, D., Torrero, F., Torres, J., Urquí, R., Velasco, T., Viúdez-Moreiras, D., Zurita, S., and MEDA team: The Mars Environmental Dynamics Analyzer, MEDA. A Suite of Environmental Sensors for the Mars 2020 Mission, Space Sci. Rev., 217, 48, https://doi.org/10.1007/s11214-021-00816-9, 2021. a
Rodriguez-Manfredi, J. A., de la Torre Juarez, M., Sanchez-Lavega, A., Hueso, R., Martinez, G., Lemmon, M. T., Newman, C. E., Munguira, A., Hieta, M., Tamppari, L. K., Polkko, J., Toledo, D., Sebastian, E., Smith, M. D., Jaakonaho, I., Genzer, M., De Vicente-Retortillo, A., Viudez-Moreiras, D., Ramos, M., Saiz-Lopez, A., Lepinette, A., Wolff, M., Sullivan, R. J., Gomez-Elvira, J., Apestigue, V., Conrad, P. G., Del Rio-Gaztelurrutia, T., Murdoch, N., Arruego, I., Banfield, D., Boland, J., Brown, A. J., Ceballos, J., Dominguez-Pumar, M., Espejo, S., Fairén, A. G., Ferrandiz, R., Fischer, E., Garcia-Villadangos, M., Gimenez, S., Gomez-Gomez, F., Guzewich, S. D., Harri, A.-M., Jimenez, J. J., Jimenez, V., Makinen, T., Marin, M., Martin, C., Martin-Soler, J., Molina, A., Mora-Sotomayor, L., Navarro, S., Peinado, V., Perez-Grande, I., Pla-Garcia, J., Postigo, M., Prieto-Ballesteros, O., Rafkin, S. C. R., Richardson, M. I., Romeral, J., Romero, C., Savijärvi, H., Schofield, J. T., Torres, J., Urqui, R., and Zurita, S.: The diverse meteorology of Jezero crater over the first 250 sols of Perseverance on Mars, Nat. Geosci., 16, 19–28, https://doi.org/10.1038/s41561-022-01084-0, 2023. a
Savijärvi, H., Harri, A.-M., and Kemppinen, O.: The diurnal water cycle at Curiosity: Role of exchange with the regolith, Icarus, 265, 63–69, https://doi.org/10.1016/j.icarus.2015.10.008, 2016. a
Savijärvi, H., McConnochie, T. H., Harri, A.-M., and Paton, M.: Annual and diurnal water vapor cycles at Curiosity from observations and column modeling, Icarus, 319, 485–490, https://doi.org/10.1016/j.icarus.2018.10.008, 2019. a, b
Savijärvi, H., Martinez, G. M., Fischer, E., Rennó, N., Tamppari, L., Zent, A., and Harri, A.-M.: Humidity observations and column simulations for a warm period at the Mars Phoenix lander site: Constraining the adsorptive properties of regolith, Icarus, 343, 113688, https://doi.org/10.1016/j.icarus.2020.113688, 2020. a
Stevenson, A., Burkhardt, J., Cockell, C., Cray, J., Dijksterhuis, J., Fox-Powell, M., Kee, T., Kminek, G., Mcgenity, T., Timmis, K., Timson, D., Voytek, M., Westall, F., Yakimov, M., and Hallsworth, J.: Multiplication of microbes below 0.690 water activity: Implications for terrestrial and extraterrestrial life, Environ. Microbiol., 17, 257–277, https://doi.org/10.1111/1462-2920.12598, 2014. a
Tabandeh, S. and Högström, R.: Uncertainty evaluation of MEDA HS humidity measurements, Confidential report VTT-CR-01095-21, VTT Technical Research Centre of Finland, 2021. a, b, c, d
Trainer, M. G., Wong, M. H., McConnochie, T. H., Franz, H. B., Atreya, S. K., Conrad, P. G., Lefèvre, F., Mahaffy, P. R., Malespin, C. A., Manning, H. L., Martín-Torres, J., Martínez, G. M., McKay, C. P., Navarro-González, R., Vicente-Retortillo, Á., Webster, C. R., and Zorzano, M.-P.: Seasonal Variations in Atmospheric Composition as Measured in Gale Crater, Mars, J. Geophys. Res.-Planet., 124, 3000–3024, https://doi.org/10.1029/2019JE006175, 2019. a
Zelenyi, L. M., Korablev, O. I., Rodionov, D. S., Novikov, B. S., Marchenkov, K. I., Andreev, O. N., and Larionov, E. V.: Scientific objectives of the scientific equipment of the landing platform of the ExoMars-2018 mission, Solar Syst. Res.+, 49, 509–517, https://doi.org/10.1134/S0038094615070229, 2015. a
Zent, A. P., Hecht, M. H., Cobos, D. R., Campbell, G. S., Campbell, C. S., Cardell, G., Foote, M. C., Wood, S. E., and Mehta, M.: Thermal and Electrical Conductivity Probe (TECP) for Phoenix, J. Geophys. Res.-Planet., 114, E00A27, https://doi.org/10.1029/2007JE003052, 2009. a


