the Creative Commons Attribution 4.0 License.
the Creative Commons Attribution 4.0 License.
 | 28 Aug 2025
Introducing a learning tool (QSVI): A QGIS plugin for computing vegetation, chlorophyll, and thermal indices with remote sensing images
Nuray Baş
Remote sensing technology can be used to monitor environmental changes using satellite imagery. However, to obtain a more precise model, it is necessary to process high-resolution and multilayered data, which require high-capacity software. Commercial software is often difficult to access by students and researchers because of its high cost and complex interface. This paper introduces a plugin designed in open-source Quantum GIS (QGIS) software using Python, called QGIS Sentinel Vegetation Indices (QSVI). QSVI can quickly process and automatically calculate many environmental indices on a single platform. These included the Normalized Difference Vegetation Index (NDVI), Enhanced Vegetation Index (EVI), Atmospheric Resilient Vegetation Index (ARVI), Leaf Area Index (LAI), Chlorophyll Vegetation Index (CVI), Urban Thermal Field Variation Index (UTFVI), and Thermal Disturbance Index (TDI). The performance of QSVI was tested in the Sarıyer District of Istanbul, Türkiye. The results indicate that, for Sentinel-2 data, QSVI reduces processing time by an average of 2.1 min compared to common commercial software, such as ArcGIS, GRASS, and SAGA GIS. Sentinel-3 data were processed 13.6 s quicker than with the same software. The findings indicate that QSVI can be an alternative tool for researchers and students because of its easy accessibility and low cost. Because of its speed and simple interface, it can provide practical solutions for both researchers and students.
- Article
(6907 KB) - Full-text XML
- BibTeX
- EndNote


In recent years, the use of digital software for monitoring environmental dynamics in remote sensing areas has increased widely. These technologies are faster and more effective than the traditional methods. This is why researchers are increasingly preferring this approach. Research has indicated that, when people use digital software, their performance increases by 15 % to 25 % (Bernard et al., 2014; Sung et al., 2016; Wulandari et al., 2021). Moreover, when interacting with software during the process, they may perform their own analysis and share information with other people (Dinçer, 2017; Gomez et al., 2010); therefore, this process can be executed more rapidly, iteratively, and quickly with complex multilayer datasets at different scales than with traditional methods.
Some research shows that using environmental indices such as the Normalized Vegetation Index (NDVI) and Enhanced Vegetation Index (EVI), which are used for land use monitoring, show better performance (Aldhebiani et al., 2018). Moreover, these indices have been used in many studies (Bastiaanssen et al., 2000; Wachendorf et al., 2018). In addition to software, it is crucial to identify open-access data to achieve economic results for education and research purposes. This is because high-cost data cannot support many users.
Landsat imagery is preferred for classification and environmental monitoring because it is freely downloadable and includes multispectral and thermal bands (Narine et al., 2009; Ran et al., 2017). The Copernicus program supplied a free dataset that included sentinel images. Sentinel-2 Level 2A (L2A) is the preferred choice with atmospherically corrected data and is thus available in a directly analyzable format. The Sentinel-3 satellite is also advantageous owing to its thermal band, which is used for temperature and climate research (García, 2022).
These remote sensing images often prefer many areas, such as grassland monitoring (Potočnik Buhvald et al., 2022); risk management (García-Fernández et al., 2020); land classification and agricultural studies (De Fioravante et al., 2021; Segarra et al., 2020); surface temperature, soil moisture, and oil spill detection (Liu et al., 2021; Nie et al., 2021; Zakzouk et al., 2024); and NDVI, EVI, and water index (Choudhary and Ghosh, 2022; Peddinti et al., 2021; Ran et al., 2017; Roßberg and Schmitt, 2023). Currently, these analyses, owing to spectral indicators, produce accurate and reliable results in monitoring and detection (Carless et al., 2019) but are still time-consuming and difficult. To overcome these challenges, many software packages and plugins have already been used. One of them is Quantum GIS (QGIS), a Geographic Information System software.
The core team of QGIS allows many independent organizations to contribute by integrating their own plugins. One of them is the Semi-Automated Classification Plugin (SCP), which is capable of downloading and performing analyses such as the NDVI and the Atmosphere Resistant Vegetation Index (ARVI) (Congedo, 2021). Open-source plugins, such as the System for Automated Geoscientific Analyses (SAGA GIS) (Conrad et al., 2015) and the Geographic Resources Analysis Support System (GRASS GIS) (GRASS, 2025), provide advantages in data filtering, classification, and spatial analysis in this application. However, the use of this popular software requires a high level of expertise and experience, and most people prefer basic functions, simple calculations, and one-step processes.
To address this issue, this study aims to introduce a new tool integrated into QGIS, called the QGIS Sentinel Vegetation Indices (QSVI). It provides computational simplicity for environmental indices, which are commonly used in most remote sensing applications. This tool can automatically and quickly calculate many indices, such as NDVI, EVI, Leaf Area Index (LAI), Chlorophyll Vegetation Index (CVI), thermal indices, Urban Thermal Field Variance Index (UTFVI), and Thermal Discomfort Index (TDI), on the same platform, even for large datasets. Owing to its simple and user-friendly interface, it offers an efficient and preferred solution for both beginner and advanced researchers.
2.1 Development of the QSVI plugin
QGIS is a widely used open-source GIS platform that is recognized for its extensive capabilities in monitoring and analyzing geospatial data. Its ability to enhance GIS functionality combined with the support of a large development community contributes to its effectiveness and popularity. The QSVI plugin, developed by the QGIS plugin community, was written in Python 3.9 and designed using Qt Designer, a tool for creating integrated user interfaces within QGIS. This design does not require any extra Python packages, making it compatible with the standard desktop versions of QGIS for all operating systems.
To install the plugin, users simply extract the ZIP file and navigate to “Plugins” → “Manage and Install Plugins.” After installation, the plugin was automatically integrated into the user interface and could be accessed directly from the raster menu in the QGIS toolbar. This allows users to immediately analyze the index data (Fig. 1a and b).
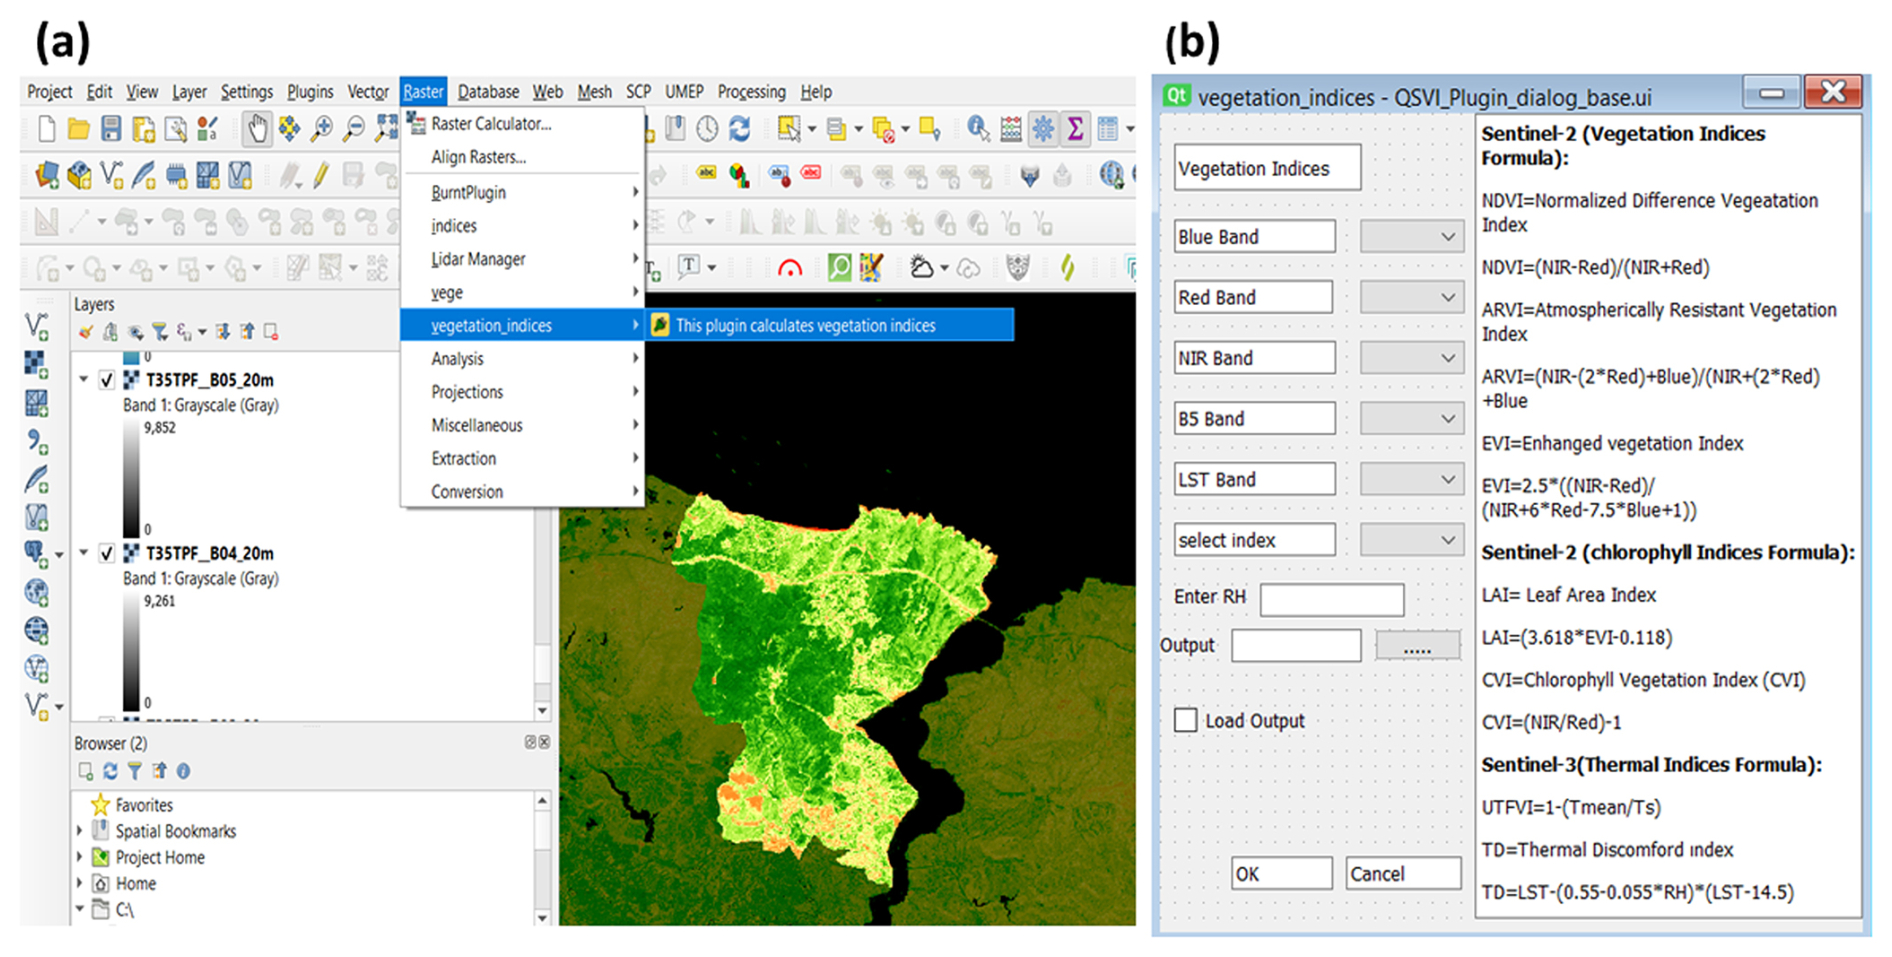
Figure 1(a) Plugin menu tab on the QGIS platform, (b) Tabs of the QSVI graphical user interface. The screenshot is from the QGIS interface (https://qgis.org, last access: 10 June 2025) showing the custom QSVI plugin. The plugin was developed by the author.
This tool simplifies the processing of remote sensing images and allows the effective calculation of different indices. To ensure optimal performance, particularly with images exceeding 1 GB, it is advisable to use a computer with at least 8 GB RAM.
2.2 Process description
The QSVI processing functionality was divided into three categories (vegetation, chlorophyll, and thermal indices), which were designed for comprehensive environmental analysis (Fig. 2). The QSVI plugin requires a remote sensing image as its primary input. Users can load an image directly from the interface or select it from a list of images already available in QGIS. The supported image formats include TIFF and JPEG. The calculation process begins after selecting the image and desired index from the options provided. Once completed, the resulting image is saved in the user-selected output folder.
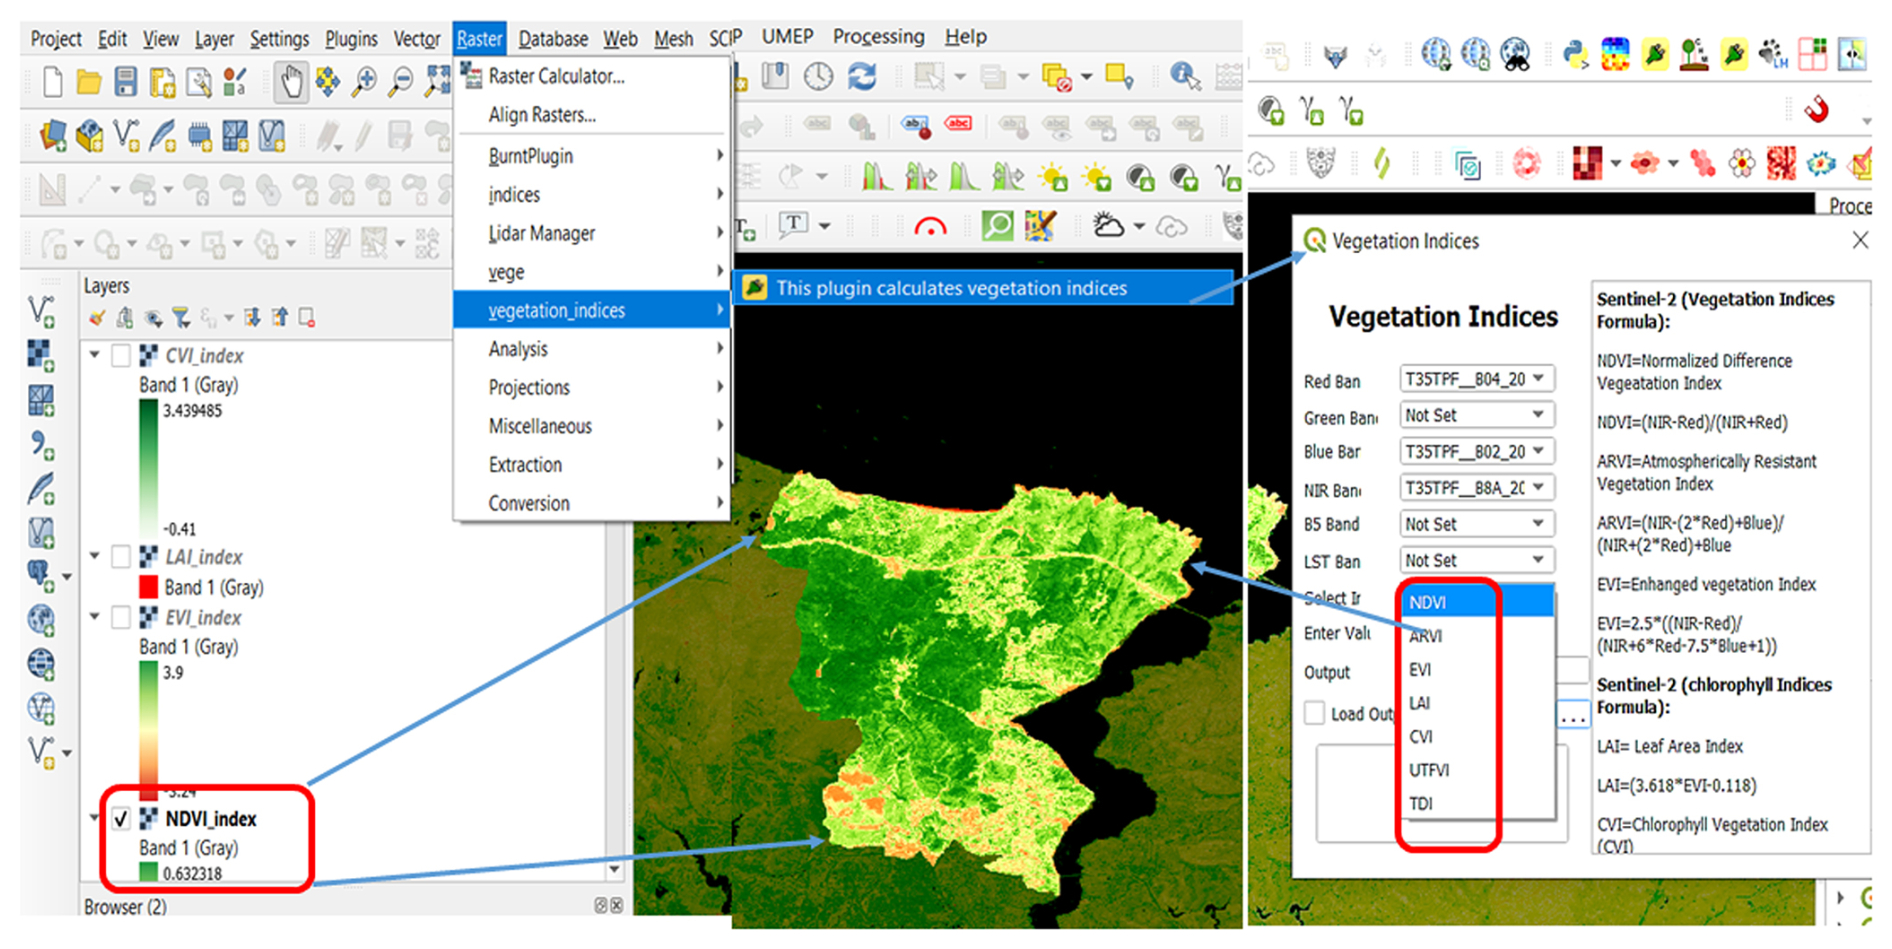
Figure 2Overview of QSVI plugin functionalities developed by Nuray Baş. The screenshot shows the custom plugin in the QGIS interface (https://qgis.org).
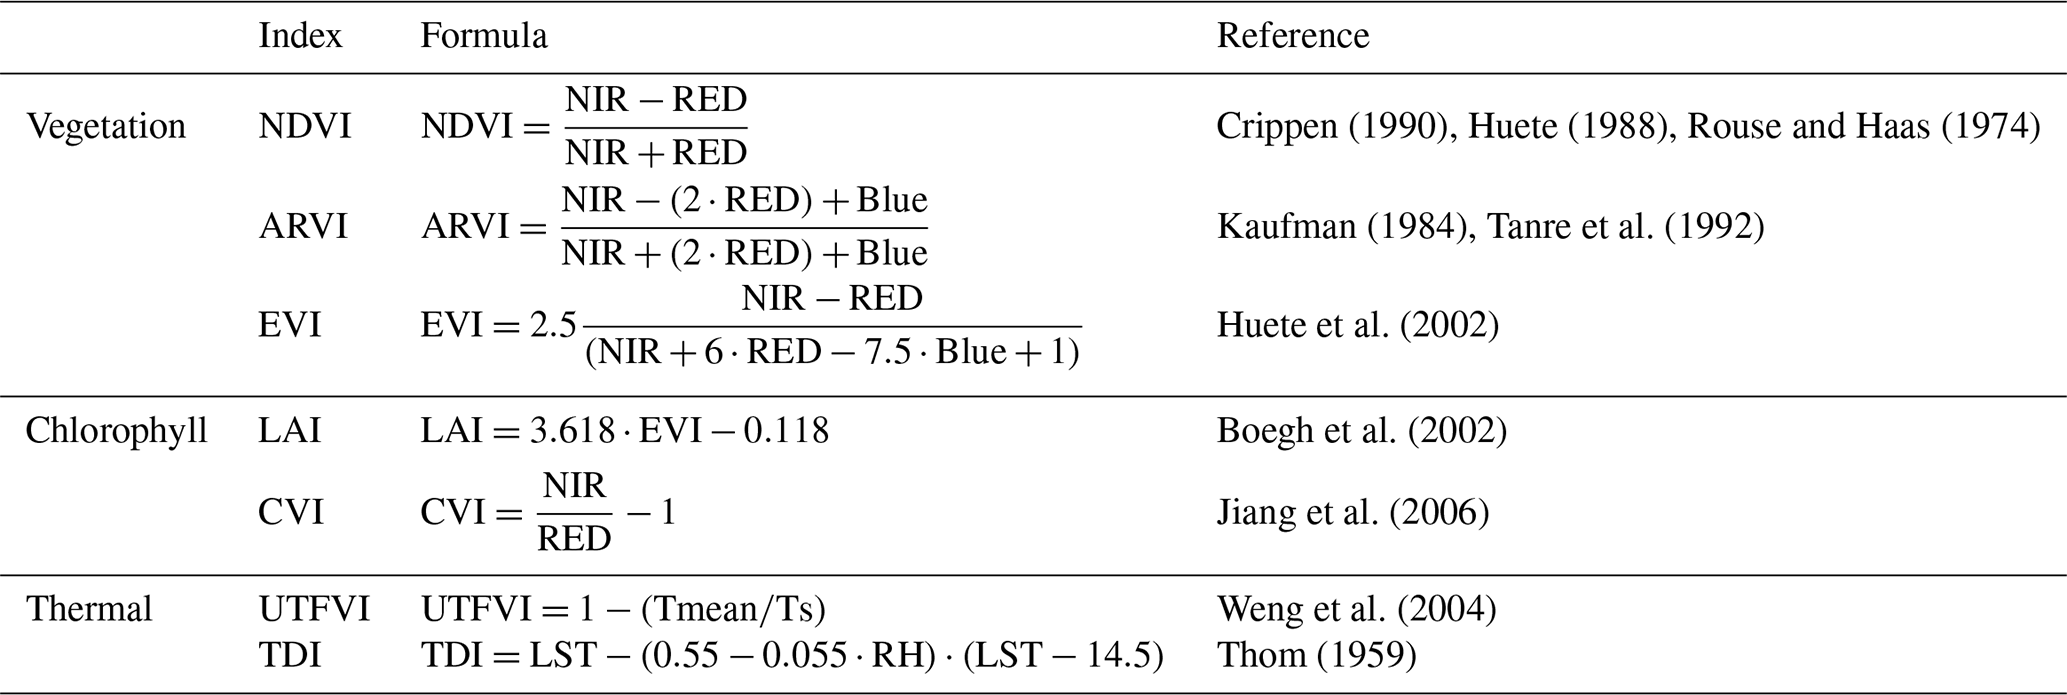
The process was divided into two main steps: loading the remote sensing image and selecting the necessary indices from the icons at the interface. Users then specify the output folder and the file names. QSVI automatically calculates the selected indices and then generates a raster output file, either in TIFF or JPEG format, containing the calculated indices. Table 1 presents all indices, along with their corresponding formulas.
Table 1The environmental indices computed using the QSVI plugin.
In the vegetation category, the NDVI, EVI, and ARVI indices can be accessed easily. These indices are important for monitoring the health and dynamics of the vegetation on Earth. NDVI determines vegetation change by calculating the difference between near-infrared and red band reflections. These analyses were performed quickly and practically, owing to the plugin's integrated calculation processes. Even large raster datasets can be processed within a short time. Different indices showed different sensitivities to environmental variables in the analysis. For example, EVI provides a more accurate representation of vegetation than NDVI because it focuses more on ground brightness and atmospheric effects. On the other hand, ARVI uses blue light reflectance information, which is advantageous for studies in areas with high atmospheric pollution. In fact, all these indices do more than monitor ecological health. They also measured the responses of plants to environmental changes and presented these changes to researchers and practitioners (Jombo and Adelabu, 2022; Lei et al., 2024).
QSVI provides a simplified and practical application of these dynamics with remotely sensed imagery over large geographic areas. CVI and LAI, which are partially different and also focus on plants, monitor plant growth and development. Thus, QSVI contributes to the sustainability of agricultural and forestry activities.
The study area is the Sarıyer municipality, which covers 177 km2 of the European side of Istanbul ( N, E). Sarıyer is bordered by the districts of Beşiktaş and Kâğıthane to the south, Eyüpsultan to the west, Bosphorus to the east, and the Black Sea to the north (Fig. 3).
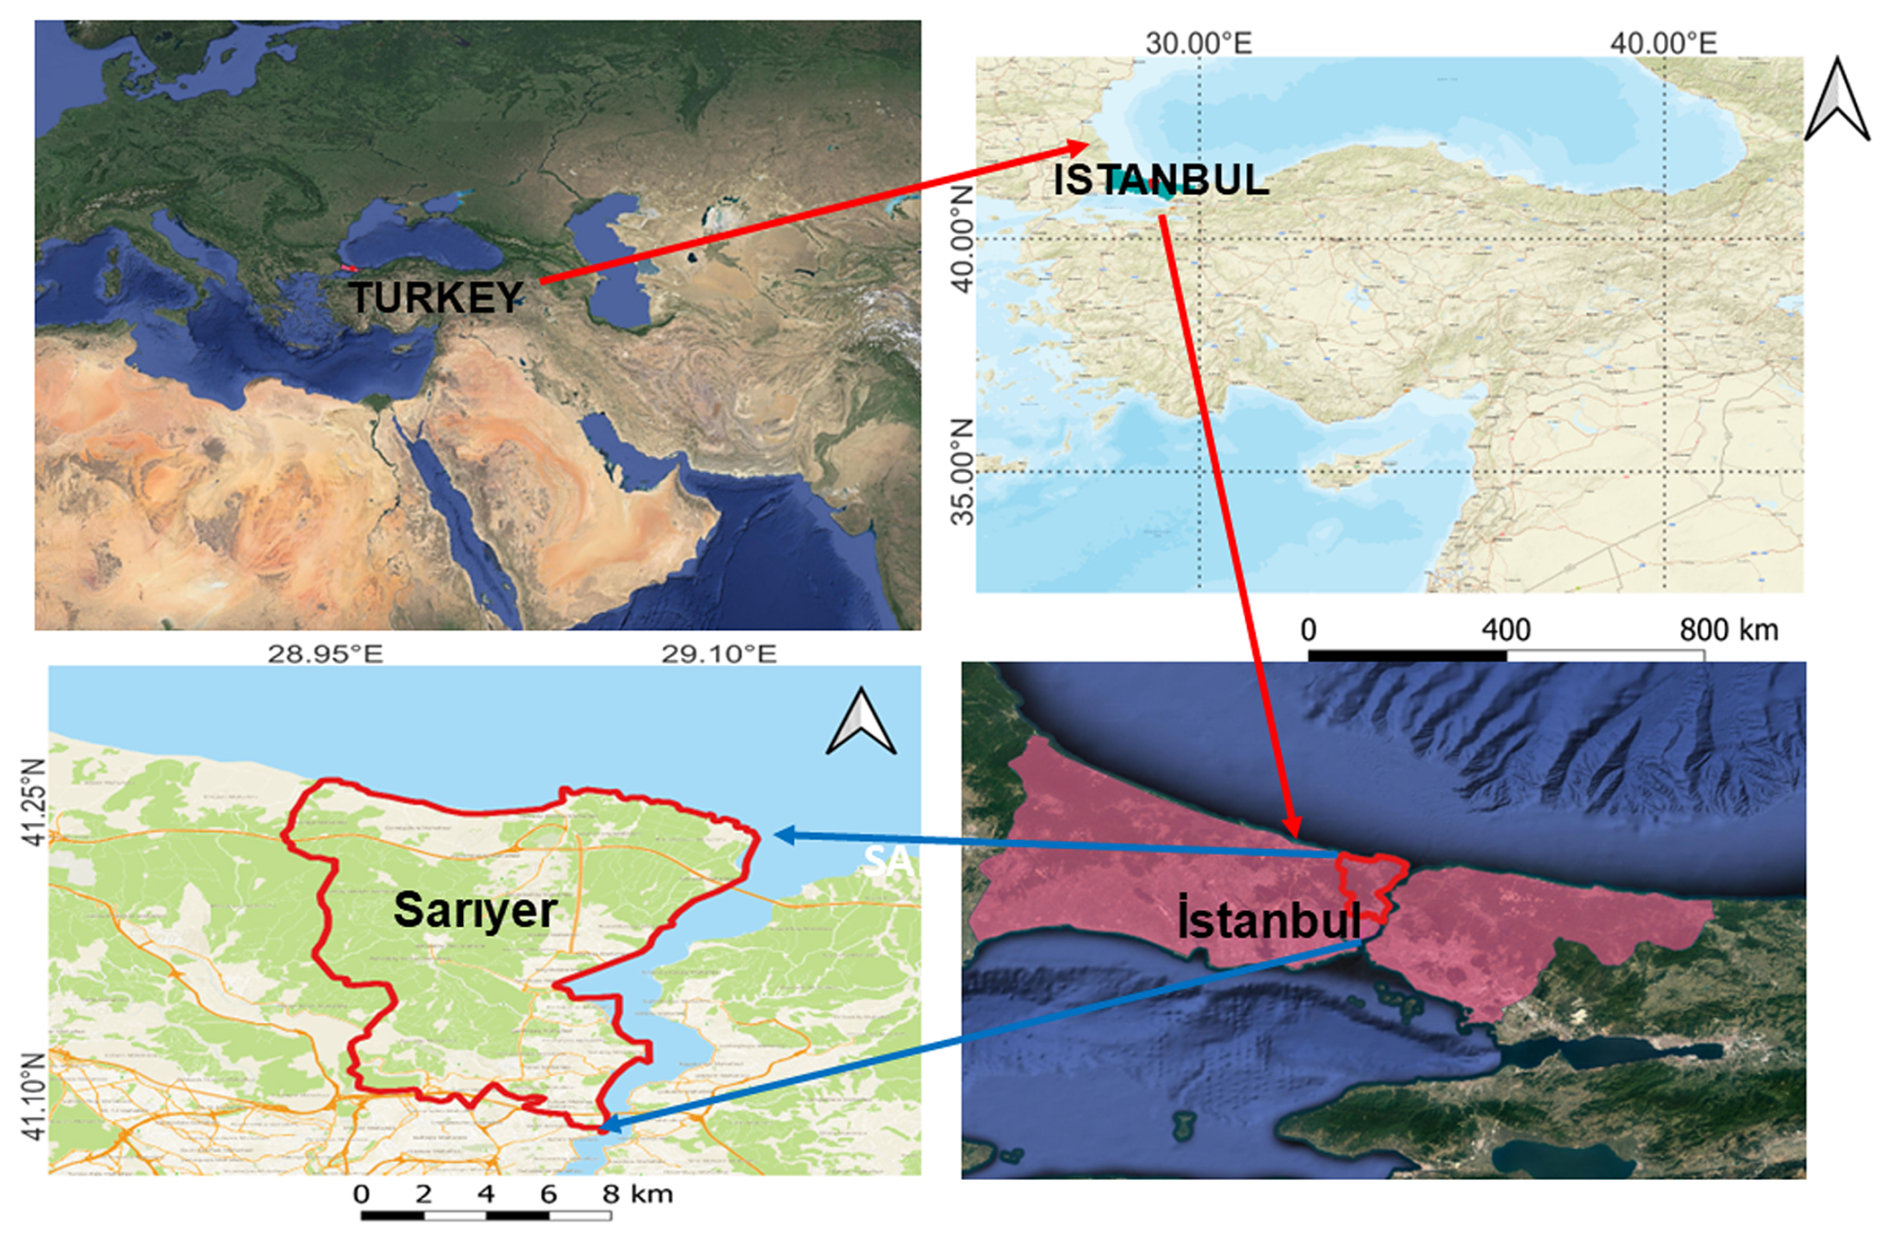
Figure 3Location of the plugin's testing area (Basemap: Esri ArcGIS Online, 2024).
The coastline along the Bosphorus is characterized by steep cliffs and crags, while Sarıyer is renowned for its rich biodiversity, including the eastern end of the Belgrade Forest, which is situated within the municipality's boundaries. Furthermore, the area defined by the Rumelikavağı–Rumelifeneri–Kilyos triangle is characterized by a high degree of forestation. However, this has partially been affected by the recent construction of residential buildings. Sarıyer has a Black Sea climate characterized by seasonal variations in temperature and humidity, especially along the coastline.
During the measurement period (1950–2023), Sarıyer recorded its lowest temperature of −9 °C in February and its highest temperature of 40.6 °C in July, with an average annual precipitation of 662.5 mm (Turkish State Meteorological Service, 2023). The majority of Sarıyer's land area is covered by rich natural vegetation (Turkish State Meteorological Service Official Web Sites, 2025). The image data from Sentinel-2 and Sentinel-3, which were atmospherically corrected and in TIFF format, were utilized in this study. The data were downloaded from https://www.copernicus.eu/en (last access: 9 July 2022), with a total disk size of 1010 MB.
This study provides important findings regarding the processing and analysis of various environmental indices. Many indices, including vegetation, chlorophyll, and thermal indices, have been calculated using the QSVI tool, and their potential applications in research and education have been investigated.
Various steps were performed to generate output data. After the raster remote sensing data are displayed on the screen, the QSVI algorithm computes the indices and generates the corresponding result files. The processing tab is divided into three categories: vegetation, chlorophyll, and thermal indices. Users must select a preferred category before proceeding with index calculation. NDVI, ARVI, and EVI were generated within the vegetation category to assess vegetation greenness. In this study, Sentinel-2 Level 2A products were used as a real data source to test the QSVI plugin outputs. Owing to its open-access data policy, users can access four spectral bands (10 m resolution) and six spectral bands (20 m resolution).
NDVI and EVI are valuable for monitoring vegetation status, especially in areas characterized by high biomass densities. EVI, which is more sensitive than NDVI, especially in densely vegetated areas, offers nuanced insights because it is less susceptible to atmospheric conditions. (Bounoua et al., 2000; Huang et al., 2021; Xiao et al., 2003). These differences provide EVI preferences for agricultural and forest health applications. The results are illustrated in Fig. 4a and b, which show that the NDVI vegetation spectral reflectance range was smaller than that of the EVI (Tucker, 1977) (Fig. 4a and b). Additionally, ARVI corrects for atmospheric scattering effects by utilizing blue light reflectance, thereby influencing red light reflectance (Fig. 4c).
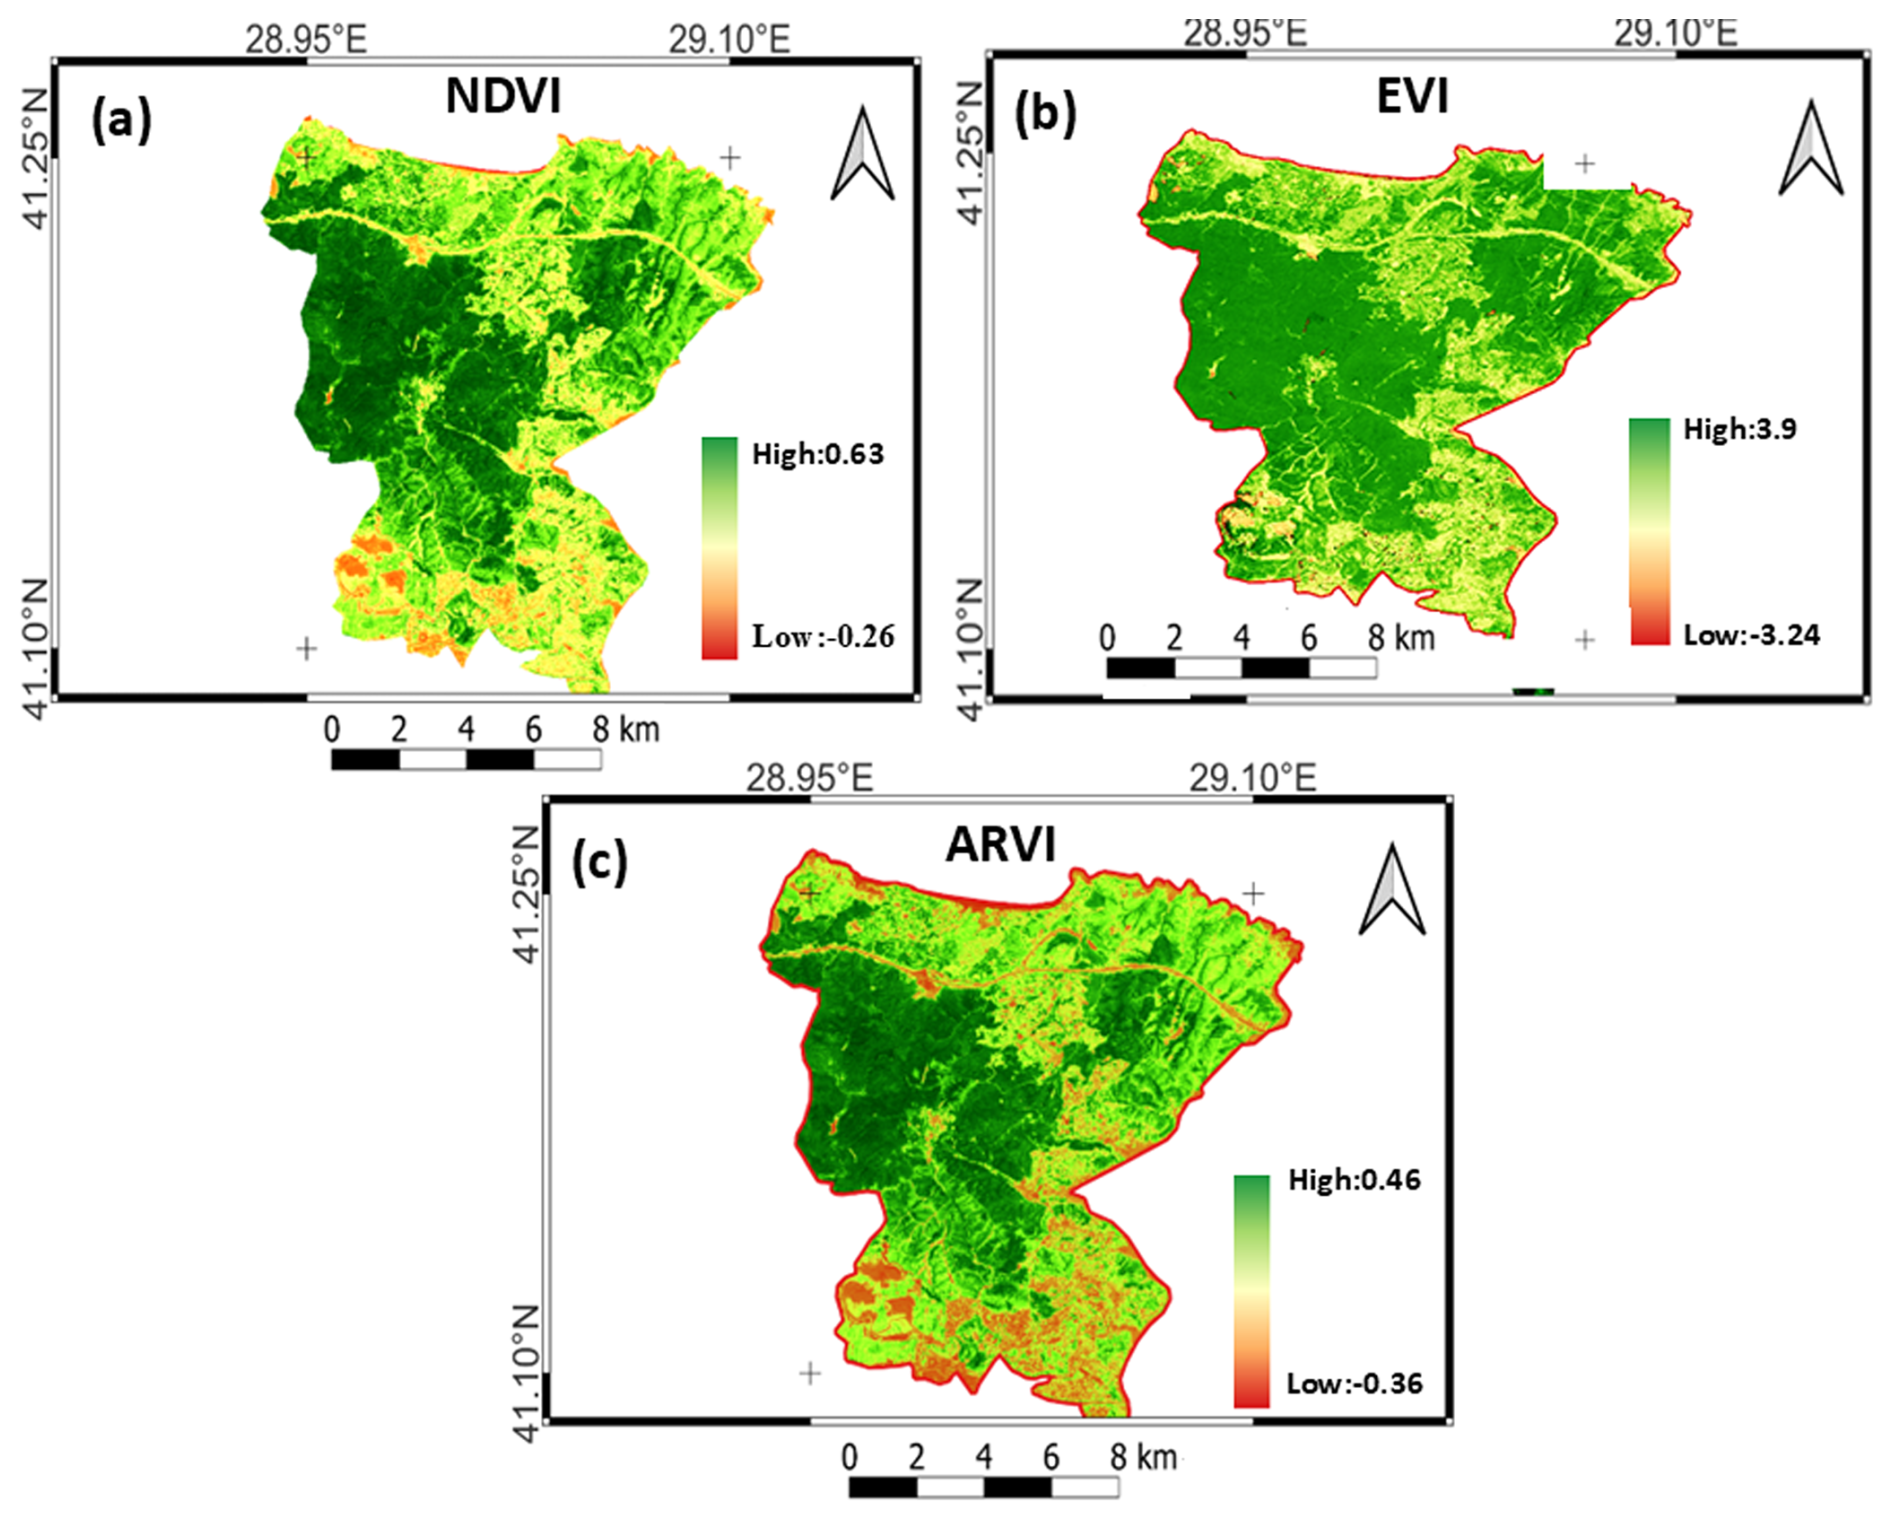
Figure 4Calculated from Sentinel-2 images with plugins: (a) NDVI indices, (b) EVI indices, and (c) ARVI indices.
In the second category, the CVI and LAI were generated to quantify the chlorophyll index, which provides information at the canopy scale. These indices can be estimated from the overall photosynthetic capacity of the canopy (Broge and Leblanc, 2001) (Fig. 5a and b).
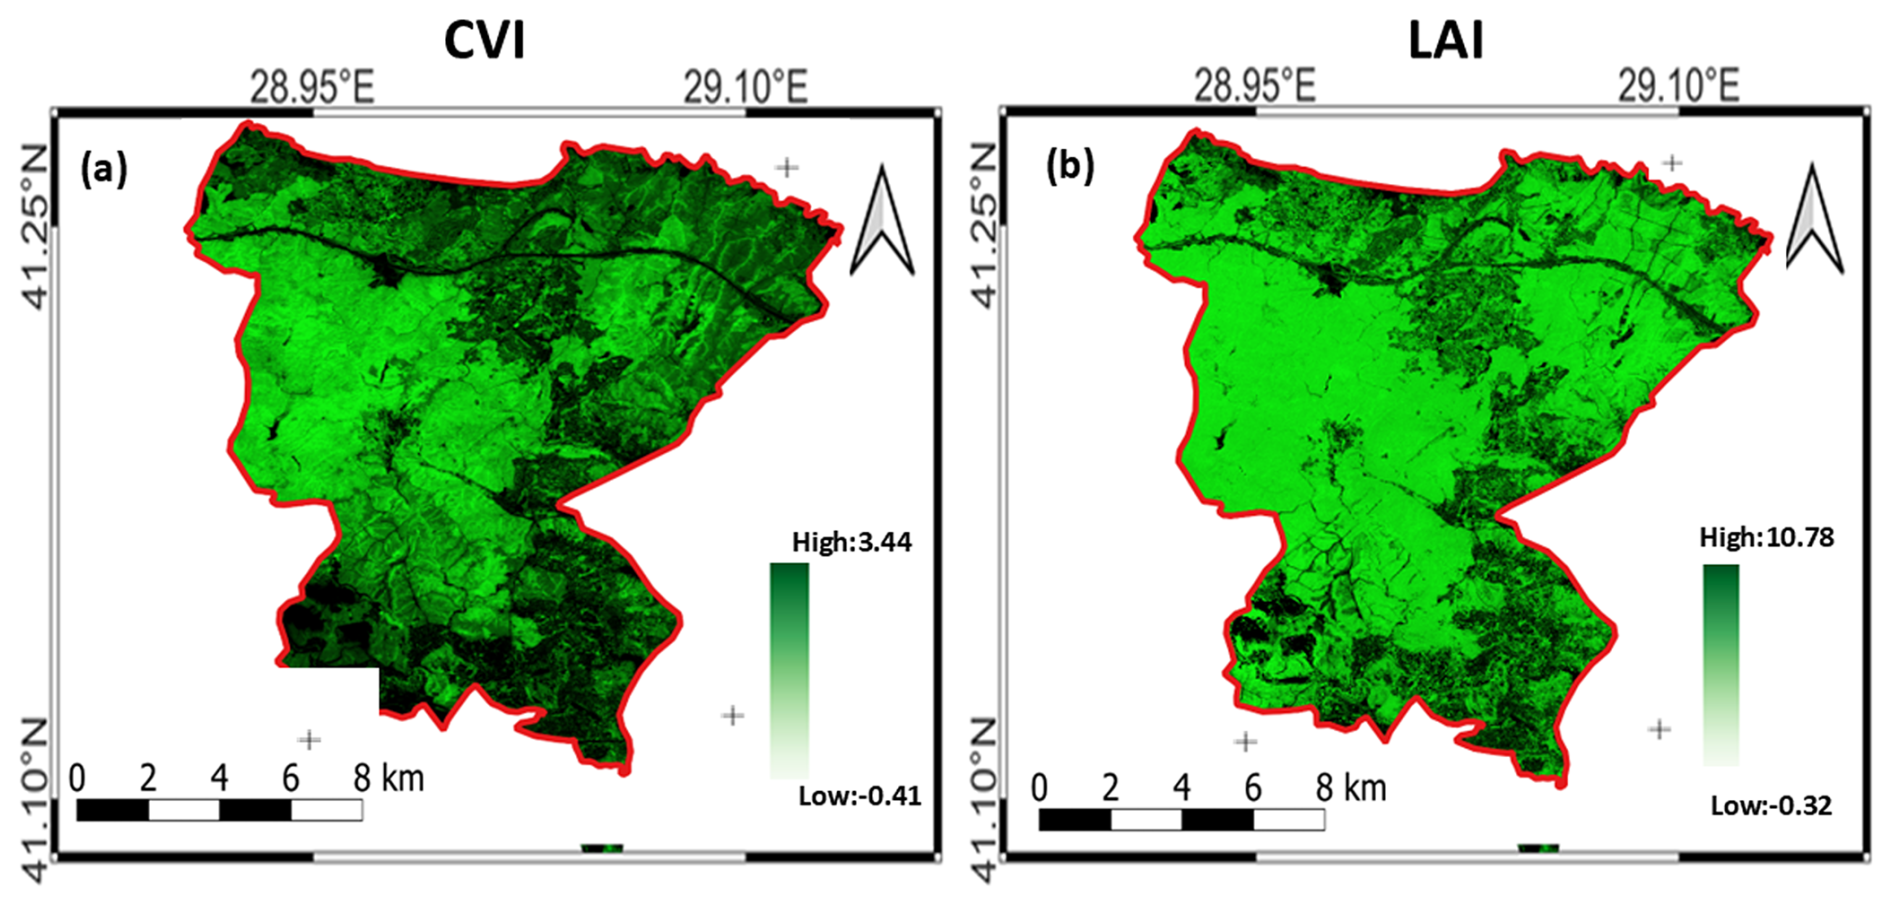
Figure 5Calculated from Sentinel-2 images with plugins: (a) CVI indices and (b) LAI indices.
Plants on Earth are often subjected to stress owing to environmental factors. As a result, vegetation changes have occurred. The LAI, which is used to detect these changes, was designed to monitor and analyze this negativity in plants (De Bock et al., 2023). CVI measures chlorophyll content in plants under stress (Broge and Leblanc, 2001; Poletaev and Lisetskii, 2024). LAI provides information on the density and distribution of plants, whereas CVI identifies changes in plant health and chlorophyll content. The CVI is an important index that assesses the level of physiological stress induced by chlorophyll reduction in plants, thereby enabling timely intervention in plant management (Vijayalakshmi et al., 2024).
Unlike Sentinel-2, the Sentinel-3 satellite includes a thermal band obtained with a Sea and Land Surface Temperature Radiometer (SLSTR) sensor, which enables the acquisition of detailed information about the Earth's temperature. Thus, owing to the strong correlation between UTFVI and land surface temperature (LST), thermal effects in urban areas can be identified (Naim and Kafy, 2021; Sharma et al., 2021). This process is performed by grouping all pixel values in the image according to the thermal stress level. Another extremely important thermal index is the TDI. This index was used to assess the combination of heat and humidity perceived by the individuals. It is a psychophysical measure of the discomfort experienced by individuals under different environmental conditions. The TDI categories define comfort levels as follows: temperatures ranging from 15 to 19.9 °C are considered comfortable, temperatures between 26.4 and 29.9 °C are categorized as very hot, and temperatures exceeding 30 °C are classified as torrid, according to TDI. Additionally, psychological parameters play a role in influencing thermal comfort, as noted by de Dear and Brager (1998). The combined impact of these factors underscores the need to comprehend and mitigate the effects of urban heat islands (UHIs) on human wellbeing. The UHI effect negatively affects the quality of life in cities and increases energy consumption due to high temperatures, especially during summer months. The UTFVI measures the UHI effect on the surface and helps reduce its negative impacts on the city (Cevik Degerli and Cetin, 2023). The relationship between the UTFVI and UHI provides important data for urban planning and public health strategies. Moreover, it can help assess ecosystem health by monitoring vegetation changes. In addition to these negativities, unexpected changes in vegetation can occur over time. Figure 6a illustrates the thermal stress (TDI, °C), whereas Fig. 6b displays the UTFVI thermal comfort levels. Red indicates the highest level of thermal stress, whereas green indicates the lowest level of thermal discomfort.
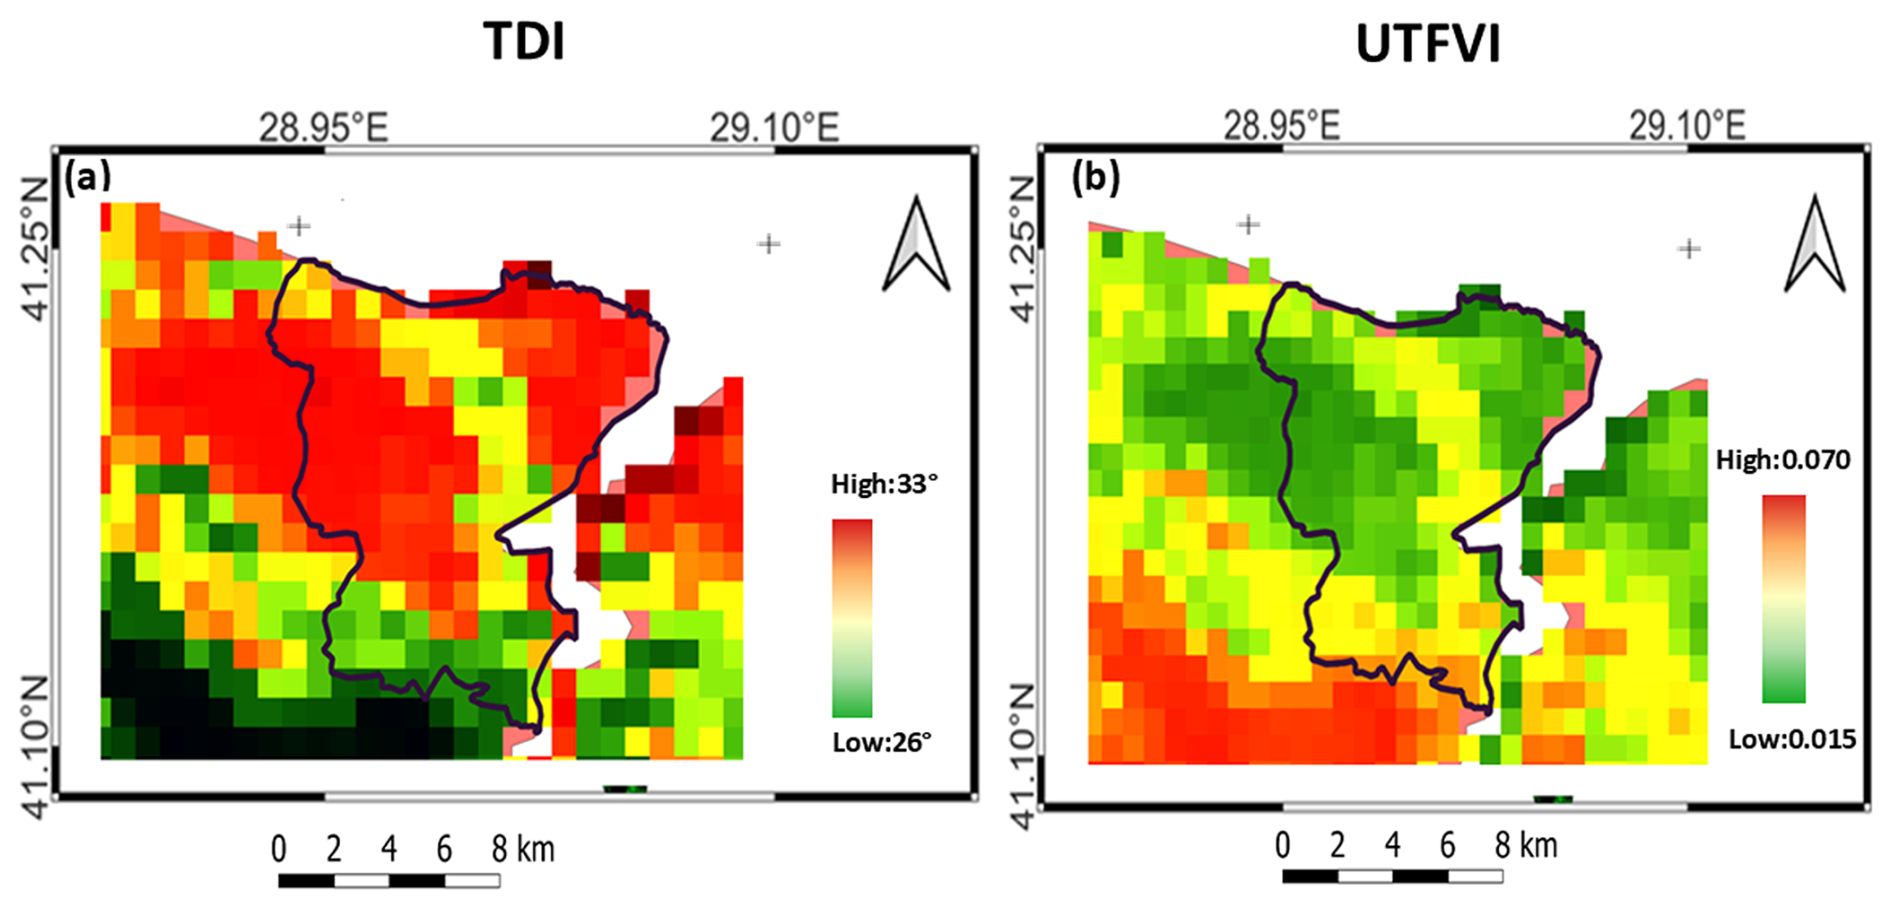
Figure 6Calculated from Sentinel-3 images with plugins: (a) TDI thermal stress and (b) UTFVI thermal comfort level.
The study also compared the raster calculation menu in other popular GIS software (SAGA GIS, GRASS GIS, ArcGIS, and QGIS) to determine the performance of QSVI (Table 2).
Table 2Comparison of computation times between QSVI and other popular software.
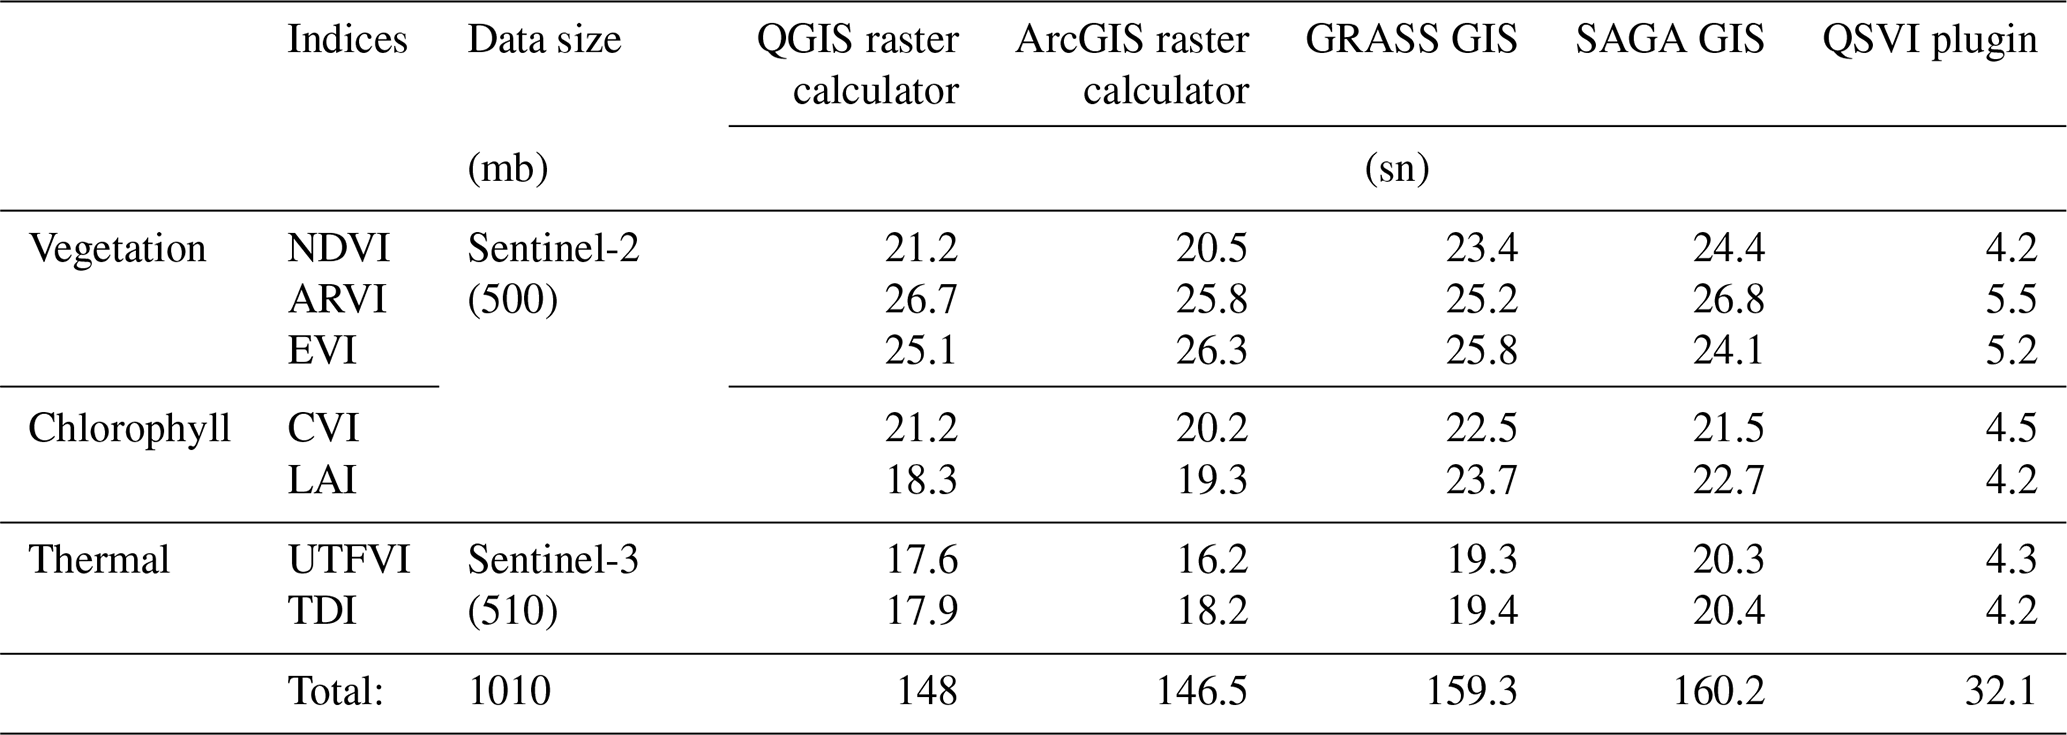
The calculations were performed on a PC with 8 GB of RAM using a 500 MB Sentinel-2 dataset and a 510 MB Sentinel-3 dataset. The results indicated that QSVI significantly outperformed other GIS software in terms of the overall processing time. At the end of the process, the QGIS raster calculator took 148 s to complete, whereas QSVI finished in 32.1 s. Thus, QSVI reduced the processing time by approximately 116 s or approximately 1.93 min.
Similarly, the ArcGIS raster calculator takes 146.5 s to complete, whereas QSVI reduces this time by approximately 1.90 min (114 s). GRASS GIS required 159.3 s, while QSVI cut this time by about 2.12 min (127 s). Similarly, while SAGA GIS took 160.2 s, QSVI saved approximately 2.14 min. In particular, for 1 GB datasets, QSVI decreases the processing time by an average of 2.1 min compared with other popular software. These results demonstrate that the QSVI plugin not only provides high processing efficiency but also greatly simplifies the workflow for users by saving time when analyzing large datasets. QSVI is a valuable tool for both academic research and educational applications.
In this study, a new plugin was introduced to assess the calculation of vegetation indices more practically and quickly. These indices are widely used in environmental monitoring using remote sensing technology. While they can be calculated on various platforms, the new plugin (QSVI) is designed to allow a simpler solution. Simultaneously, its open-source code makes it accessible to a large number of users, making it an alternative study with large datasets.
The primary contribution of this research is not the development of new environmental indices; rather, it is faster and easier to use all the indices on the same platform. This provides an easily accessible choice for both beginners and experts studying vegetation dynamics.
Today, remote sensing digital software, which is widely used by researchers, such as ArcGIS (Esri, 2025), SAGA GIS, and GRASS GIS, is known to be very reliable and ia known for its sophisticated algorithms in data processing and analysis. However, not all users can perform powerful computational processes. QSVI facilitates the automation of calculations and implementation of a simplified set of functions, making it accessible to non-expert users. There is potential for further improvement by incorporating additional functionalities to maintain the current logical structure of the plugin. For example, adding a new function can enhance its utility.
However, QSVI can be compared with the existing remote sensing plugins, such as PI2GIS, which is very convenient for processing remote sensing data. (Correia et al., 2017). QSVI shares similarities with PI2GIS in terms of its learning strategies but distinguishes itself by incorporating not only vegetation indices, but also chlorophyll and thermal indices. In the future, different indices could be added to QSVI for further development.
It is also worth mentioning that the Q-LIP add-on is designed for users with limited remote sensing experience. Furthermore, the plugin developed by Sebbah et al. (2021) for downloading and calculating various environmental indices using Landsat images is notable for its efficiency; it can process a 1.73 GB Landsat-8 image in just 3 min, whereas QSVI demonstrates its capabilities by processing an approximately 1 GB image in a total of 2.1 min for Sentinel-2 and Sentinel-3 datasets.
As a result, QSVI can be an alternative for education and research, especially because of its simple interface and computational capability. QSVI also reduced the processing time for Sentinel-2 images by about 2.1 min on standard systems (8 GB RAM, 1 GB disk space). For Sentinel-3, the time was reduced by 13.6 s. QSVI is available without additional installation using GDAL/OGR and NumPy. However, QSVI is aimed at basic environmental analysis and is not intended to replace ArcGIS-, SAGA GIS-, and GRASS GIS-specialized platforms.
In particular, high-resolution remote sensing imagery requires extensive analysis and data processing. The complex interfaces and sophisticated algorithms of digital tools used for this purpose can be challenging, especially for beginner researchers or users from different disciplines. This study developed an innovative evaluation methodology and introduced a new Python plugin within the existing QGIS software. This plugin provides a graphical user interface (GUI) with a simple interface and practical computational capability that allows users from different disciplines to compute various environmental vegetation indices, without the need for extensive background knowledge in the field. In this respect, the tool is not only an educational tool but also a tool for researchers interested in the environmental problems of the Earth. Unlike standard tools, QSVI supports researchers working on vegetation health and thermal models with the ability to calculate the well-known NDVI index, along with chlorophyll and thermal indices, on a single platform. Compared with other GIS software, QSVI reduced the processing time for Sentinel-2 and Sentinel-3 data by 2.1 min for datasets ranging from 500 MB to 1 GB in the study area. With this performance, users can be provided with practicality and ease of use for large datasets.
All Sentinel-2 and Sentinel-3 images used in this study were obtained from the Copernicus Sentinel Data (2025). The Python code for the QGIS Sentinel Vegetation Indices (QSVI) plugin (Baş, 2025) is not yet publicly available but will be provided upon request.
The author has declared that there are no competing interests.
Publisher's note: Copernicus Publications remains neutral with regard to jurisdictional claims made in the text, published maps, institutional affiliations, or any other geographical representation in this paper. While Copernicus Publications makes every effort to include appropriate place names, the final responsibility lies with the authors.
The author would like to thank the developers and contributors of the open-source QGIS software and the Copernicus program for providing the satellite data used in this study.
This paper was edited by Fernando Nardi and reviewed by two anonymous referees.
Aldhebiani, A. Y., Elhag, M., Hegazy, A. K., Galal, H. K., and Mufareh, N. S.: Consideration of NDVI thematic changes in density analysis and floristic composition of Wadi Yalamlam, Saudi Arabia, Geosci. Instrum. Method. Data Syst., 7, 297–306, https://doi.org/10.5194/gi-7-297-2018, 2018.
Baş, N.: QSVI plugin, QGIS Sentinel Vegetation Indices (QSVI) plugin [code], Developed for the QGIS platform, 2025.
Bastiaanssen, W. G. M., Molden, D. J., and Makin, I. W.: Remote sensing for irrigated agriculture: examples from research and possible applications, Agr. Water Manage., 46, 137–155, https://doi.org/10.1016/S0378-3774(00)00080-9, 2000.
Bernard, R. M., Borokhovski, E., Schmid, R. F., Tamim, R. M., and Abrami, P. C.: A meta-analysis of blended learning and technology use in higher education: from the general to the applied, J. Comput. High. Educ., 26, 87–122, https://doi.org/10.1007/s12528-013-9077-3, 2014.
Boegh, E., Soegaard, H., Broge, N., Hasager, C. B., Jensen, N. O., Schelde, K., and Thomsen, A.: Airborne multispectral data for quantifying leaf area index, nitrogen concentration, and photosynthetic efficiency in agriculture, Remote Sens. Environ., 81, 179–193, https://doi.org/10.1016/S0034-4257(01)00342-X, 2002.
Bounoua, L., Collatz, G. J., Los, S. O., Sellers, P. J., Dazlich, D. A., Tucker, C. J., and Randall, D. A.: Sensitivity of Climate to Changes in NDVI, J. Climate, 13, 2277–2292, https://doi.org/10.1175/1520-0442(2000)013<2277:SOCTCI>2.0.CO;2, 2000.
Broge, N. H. and Leblanc, E.: Comparing prediction power and stability of broadband and hyperspectral vegetation indices for estimation of green leaf area index and canopy chlorophyll density, Remote Sens. Environ., 76, 156–172, https://doi.org/10.1016/S0034-4257(00)00197-8, 2001.
Carless, D., Luscombe, D. J., Gatis, N., Anderson, K., and Brazier, R. E.: Mapping landscape-scale peatland degradation using airborne lidar and multispectral data, Landscape Ecol., 34, 1329–1345, https://doi.org/10.1007/s10980-019-00844-5, 2019.
Cevik Degerli, B. and Cetin, M.: Evaluation of UTFVI index effect on climate change in terms of urbanization, Environ. Sci. Pollut. R., 30, 75273–75280, https://doi.org/10.1007/s11356-023-27613-x, 2023.
Choudhary, S. S. and Ghosh, S. K.: Surface Water Area Extraction by Using Water Indices and DFPS Method Applied to Satellites Data, Sensing and Imaging, 23, 33, https://doi.org/10.1007/s11220-022-00403-4, 2022.
Congedo, L.: Semi-Automatic Classification Plugin: A Python tool for the download and processing of remote sensing images in QGIS, Journal of Open Source Software, 6, 3172, https://doi.org/10.21105/joss.03172, 2021.
Conrad, O., Bechtel, B., Bock, M., Dietrich, H., Fischer, E., Gerlitz, L., Wehberg, J., Wichmann, V., and Böhner, J.: System for Automated Geoscientific Analyses (SAGA) v. 2.1.4, Geosci. Model Dev., 8, 1991–2007, https://doi.org/10.5194/gmd-8-1991-2015, 2015.
Copernicus Sentinel Data: Copernicus Data Space, Copernicus Data Space [data set], https://dataspace.copernicus.eu/data-collections/copernicus-sentinel-data (last access: 30 May 2025), 2025.
Correia, R., Teodoro, A., and Duarte, L.: PI2GIS: processing image to geographical information systems, a learning tool for QGIS, in: SPIE Remote Sensing 2017, Earth Resources and Environmental Remote Sensing/GIS Applications VIII, Proc. SPIE 10428, 104281H, Warsaw, Poland, https://doi.org/10.1117/12.2277952, 2017.
Crippen, R. E.: Calculating the vegetation index faster, Remote Sens. Environ., 34, 71–73, https://doi.org/10.1016/0034-4257(90)90085-Z, 1990.
De Bock, A., Belmans, B., Vanlanduit, S., Blom, J., Alvarado-Alvarado, A. A., and Audenaert, A.: A review on the leaf area index (LAI) in vertical greening systems, Build. Environ., 229, 109926, https://doi.org/10.1016/j.buildenv.2022.109926, 2023.
de Dear, R., and Brager, G. S.: Developing an Adaptive Model of Thermal Comfort and Preference, ASHRAE Transactions, 104, RP-884 [report], MRL: Sydney, 1997.
De Fioravante, P., Luti, T., Cavalli, A., Giuliani, C., Dichicco, P., Marchetti, M., Chirici, G., Congedo, L., and Munafò, M.: Multispectral Sentinel-2 and SAR Sentinel-1 Integration for Automatic Land Cover Classification, Land, 10, 611, https://doi.org/10.3390/land10060611, 2021.
Dinçer, S.: Effects of computer literacy, motivation and self-efficacy on learning success in computer assisted instruction: Investigation of the variables with study duration, UluslararasıEğitim Programlarıve Öğretim ÇalışmalarıDergisi, 7, 147–162, https://doi.org/10.31704/ijocis.2017.009, 2017.
Esri: ArcGIS Desktop: Release 10.9. Redlands, CA: Environmental Systems Research Institute, 2025.
García, D. H.: Analysis of Urban Heat Island and Heat Waves Using Sentinel-3 Images: a Study of Andalusian Cities in Spain, Earth Syst. Environ., 6, 199–219, https://doi.org/10.1007/s41748-021-00268-9, 2022.
García-Fernández, A., Espin, S., Gómez-Ramírez, P., Martínez-López, E., and Navas, I.: Wildlife Sentinels for Human and Environmental Health Hazards in Ecotoxicological Risk Assessment, in: Ecotoxicological QSARs, Methods in Pharmacology and Toxicology, edited by: Roy, K., Humana, New York, NY, 77–94, https://doi.org/10.1007/978-1-0716-0150-1_4, 2020.
Gomez, E. A., Wu, D., and Passerini, K.: Computer-supported team-based learning: The impact of motivation, enjoyment and team contributions on learning outcomes, Comput. Educ., 55, 378–390, https://doi.org/10.1016/j.compedu.2010.02.003, 2010.
GRASS – Bringing advanced geospatial technologies to the world: https://grass.osgeo.org/, last access: 25 May 2025.
Huang, S., Tang, L., Hupy, J. P., Wang, Y., and Shao, G.: A commentary review on the use of normalized difference vegetation index (NDVI) in the era of popular remote sensing, J. Forestry Res., 32, 1–6, https://doi.org/10.1007/s11676-020-01155-1, 2021.
Huete, A., Didan, K., Miura, T., Rodriguez, E. P., Gao, X., and Ferreira, L. G.: Overview of the radiometric and biophysical performance of the MODIS vegetation indices, Remote Sens. Environ., 83, 195–213, https://doi.org/10.1016/S0034-4257(02)00096-2, 2002.
Huete, A. R.: A soil-adjusted vegetation index (SAVI), Remote Sens. Environ., 25, 295–309, https://doi.org/10.1016/0034-4257(88)90106-X, 1988.
Jiang, Z., Huete, A. R., Chen, J., Chen, Y., Li, J., Yan, G., and Zhang, X.: Analysis of NDVI and scaled difference vegetation index retrievals of vegetation fraction, Remote Sens. Environ., 101, 366–378, https://doi.org/10.1016/j.rse.2006.01.003, 2006.
Jombo, S. and Adelabu, S. A.: Spatiotemporal Variations of Land Surface Temperature and Vegetation Coverage in Free State Province, South Africa, in: IGARSS 2022 – 2022 IEEE International Geoscience and Remote Sensing Symposium, Kuala Lumpur, Malaysia, 17–22 July 2022, 2414–2417, https://doi.org/10.1109/IGARSS46834.2022.9884372, 2022.
Kaufman, Y. J.: Atmospheric effects on remote sensing of surface reflectance, NASA Goddard Space Flight Center, NTRS Document ID: 19860034741 [conference paper], 1984.
Lei, J., Wang, S., Wang, Y., and Luo, W.: Determining the planting year of navel orange trees in mountainous and hilly areas of southern China: a remote sensing based method, J. Mt. Sci., 21, 3293–3305, https://doi.org/10.1007/s11629-024-8673-1, 2024.
Liu, Y., Qian, J., and Yue, H.: Combined Sentinel-1A With Sentinel-2A to Estimate Soil Moisture in Farmland, IEEE J. Sel. Top. Appl., 14, 1292–1310, https://doi.org/10.1109/JSTARS.2020.3043628, 2021.
Naim, Md. N. H. and Kafy, A.-A.: Assessment of urban thermal field variance index and defining the relationship between land cover and surface temperature in Chattogram city: A remote sensing and statistical approach, Environmental Challenges, 4, 100107, https://doi.org/10.1016/j.envc.2021.100107, 2021.
Narine, L. L., Popescu, S., Zhou, T., Srinivasan, S., and Harbeck, K.: Mapping forest aboveground biomass with a simulated ICESat-2 vegetation canopy product and Landsat data, Ann. For. Res., 52, 69–86, https://doi.org/10.15287/afr.2018.1163, 2009.
Nie, J., Ren, H., Zheng, Y., Ghent, D., and Tansey, K.: Land Surface Temperature and Emissivity Retrieval From Nighttime Middle-Infrared and Thermal-Infrared Sentinel-3 Images, IEEE Geosci. Remote S., 18, 915–919, https://doi.org/10.1109/LGRS.2020.2986326, 2021.
Peddinti, V. S. S., Mandla, V. R., Mesapam, S., and Kancharla, S.: Selection of optimal bands of AVIRIS – NG by evaluating NDVI with Sentinel-2, Earth Sci. Inform., 14, 1285–1302, https://doi.org/10.1007/s12145-021-00662-x, 2021.
Poletaev, A. and Lisetskii, F.: Using vegetation indices to identify high chlorophyll tree cover in floodplains for carbon sequestration, E3S Web Conf., 486, 07013, https://doi.org/10.1051/e3sconf/202448607013, 2024.
Potočnik Buhvald, A., Račič, M., Immitzer, M., Oštir, K., and Veljanovski, T.: Grassland Use Intensity Classification Using Intra-Annual Sentinel-1 and -2 Time Series and Environmental Variables, Remote Sens.-Basel, 14, 3387, https://doi.org/10.3390/rs14143387, 2022.
Ran, L., Zhang, Y., Wei, W., and Zhang, Q.: A Hyperspectral Image Classification Framework with Spatial Pixel Pair Features, Sensors-Basel, 17, 2421, https://doi.org/10.3390/s17102421, 2017.
Roßberg, T. and Schmitt, M.: A Globally Applicable Method for NDVI Estimation from Sentinel-1 SAR Backscatter Using a Deep Neural Network and the SEN12TP Dataset, PFG– Journal of Photogrammetry, Remote Sensing and Geoinformation Science, 91, 171–188, https://doi.org/10.1007/s41064-023-00238-y, 2023.
Rouse, W. and Haas, R. H.: Monitoring Vegetation Systems in the Great Plains with Erts NASA NTRS, https://ntrs.nasa.gov/citations/19740022614 (last access: 30 May 2025), 1974.
Sebbah, B., Yazidi Alaoui, O., Wahbi, M., Maâtouk, M., and Ben Achhab, N.: QGIS-Landsat Indices plugin (Q-LIP): Tool for environmental indices computing using Landsat data, Environ. Modell. Softw., 137, 104972, https://doi.org/10.1016/j.envsoft.2021.104972, 2021.
Segarra, J., Buchaillot, M., Araus, J., and Kefauver, S.: Remote Sensing for Precision Agriculture: Sentinel-2 Improved Features and Applications, Agronomy, 10, 641, https://doi.org/10.3390/agronomy10050641, 2020.
Sharma, R., Pradhan, L., Kumari, M., and Bhattacharya, P.: Assessing urban heat islands and thermal comfort in Noida City using geospatial technology, Urban Climate, 35, 100751, https://doi.org/10.1016/j.uclim.2020.100751, 2021.
Sung, Y.-T., Chang, K.-E., and Liu, T.-C.: The effects of integrating mobile devices with teaching and learning on students' learning performance: A meta-analysis and research synthesis, Comput. Educ., 94, 252–275, https://doi.org/10.1016/j.compedu.2015.11.008, 2016.
Tanre, D., Holben, B. N., and Kaufman, Y. J.: Atmospheric correction algorithm for NOAA-AVHRR products: theory and application, IEEE T. Geosci. Remote, 30, 231–248, https://doi.org/10.1109/36.134074, 1992.
Thom, E. C.: The Discomfort Index, Weatherwise, 12, 57–61, https://doi.org/10.1080/00431672.1959.9926960, 1959.
Tucker, C. J.: Asymptotic nature of grass canopy spectral reflectance, Appl. Optics, 16, 1151–1156, https://doi.org/10.1364/AO.16.001151, 1977.
Turkish State Meteorological Service Official Web Sites: https://www.mgm.gov.tr/eng/forecast-cities.aspx, last access: 25 May 2025.
Vijayalakshmi, D., Jeevitha, R., Gowsiga, S., Vinitha, A., and Soumya, R.: Evaluation of chlorophyll index as indicators to screen sorghum genotypes for drought stress tolerance, Cereal Res. Commun., 52, 1511–1525, https://doi.org/10.1007/s42976-024-00494-7, 2024.
Wachendorf, M., Fricke, T., and Möckel, T.: Remote sensing as a tool to assess botanical composition, structure, quantity and quality of temperate grasslands, Grass Forage Sci., 73, 1–14, https://doi.org/10.1111/gfs.12312, 2018.
Weng, Q., Lu, D., and Schubring, J.: Estimation of land surface temperature–vegetation abundance relationship for urban heat island studies, Remote Sens. Environ., 89, 467–483, https://doi.org/10.1016/j.rse.2003.11.005, 2004.
Wulandari, F., Anika Marhayani, D., Setyowati, R., Anitra, R., Sulistri, E., and Mursidi, A.: The Effectiveness of Study Online in Higher Education, in: Proceedings of the 6th International Conference on Information and Education Innovations (ICIEI 2021), Belgrade, Serbia, 16–18 April 2021, 41–45, Association for Computing Machinery, New York, NY, USA, https://doi.org/10.1145/3470716.3470724, 2021.
Xiao, X., Braswell, B., Zhang, Q., Boles, S., Frolking, S., and Moore, B.: Sensitivity of vegetation indices to atmospheric aerosols: continental-scale observations in Northern Asia, Remote Sens. Environ., 84, 385–392, https://doi.org/10.1016/S0034-4257(02)00129-3, 2003.
Zakzouk, M., El-Magd, I. A., Ali, E. M., Abdulaziz, A. M., Rehman, A., and Saba, T.: Novel oil spill indices for sentinel-2 imagery: A case study of natural seepage in Qaruh Island, Kuwait, MethodsX, 12, 102520, https://doi.org/10.1016/j.mex.2023.102520, 2024.