the Creative Commons Attribution 4.0 License.
the Creative Commons Attribution 4.0 License.
 | 02 Dec 2025
Measurements on physical snow properties in Dronning Maud Land, Antarctica
Antero Kukko
Aleksi Rimali
Aku Riihelä
Priit Tisler
In this study, we present in situ measurements collected during the Finnish Antarctic Research Programme (FINNARP) 2022 expedition at the Finnish Aboa station, located in Dronning Maud Land, Western Antarctica, which is characterized by snow accumulation. Field observations were carried out weekly at the AWS5 automatic weather station, situated approximately 10 km from Aboa, as well as at selected overpass locations of the IceSat-2 and CryoSat-2 satellites. This paper presents data from the AWS5 site, where seasonal snow evolution was systematically monitored. The measurements included continuous meteorological observations from the weather station maintained by FINNARP, detailed snow pit profiles, ground-based and drone-based radiation measurements, and snow surface roughness observed using both drone-mounted and backpack-mounted laser scanners. Drone-based measurements enabled spatially extensive coverage using a laser scanner, a hyperspectral camera, and a pyranometer. Spatial variability of snow surface properties was assessed at five locations in addition to the primary snow pit. The collected dataset provides valuable insight for improving satellite remote sensing and for advancing our understanding of the relationships between albedo, surface roughness, and physical snow properties.
- Article
(7687 KB) - Full-text XML
- BibTeX
- EndNote


Understanding the seasonal evolution of Antarctic snow is essential for interpreting satellite observations and quantifying surface mass balance in Antarctica. The paper describes a data set collected in 2022–2023 in Antarctica as part of the Low orbit altimetry, albedo, and Antarctic Snow and Sea-ice Surface Roughness (LAS3R) project funded by the Research Council of Finland. Measurements were conducted during Finnish Antarctic Research Programme (FINNARP) 2022 expedition to Finnish Aboa station located in Dronning Maud Land in western Antarctica. Aim of the expedition was to characterize and quantify the impact of surface roughness on surface albedo and altimetry-based retrieval of snow elevation over Antarctica. The objective was gathering a unique data set to be analysed for surface roughness scale dependence and directionality.
Majority of the earlier snow pit studies around Aboa station have been longer transects including only few measurements at vicinity of the Basen nunatak without repetition at the same location (Table 1) (Isaksson and Karlén, 1994; Kärkäs et al., 2002; Kärkäs et al., 2005; Rasmus, 2006; Ingvander et al., 2016; Vihma et al., 2011; Järvinen and Leppäranta, 2013). However, studies in 2006, 2007, 2009 and 2014 had a stable snow measurement site close to Basen (lat −73.064283, long −13.47668) where snow pits were made 1–2 times per day (Vihma et al., 2011; Pirazzini et al., 2015). In 2018, almost daily snow pit measurements were made at the AWS5 site (FINNARP, 2019). Previous unpublished drone measurements near Basen nunatak have been related to albedo, atmospheric and meteorological observations.

Isaksson and Karlén (1994) studied snow accumulation with a stake transect from coast to Heimefrontfjella, and with density measurements in snow pits nearby. They found that the spatial variations in accumulation are large over short distances, local topography and slope changes cause smaller-scale variations in accumulation, and a decreasing accumulation rate from the coast and up to 300 km inland is visible in the stake measurements. Reijmer and Broeke (2003) studied surface mass balance derived from automatic weather stations, including AWS5 station close to Basen nunatak in 1998–2001. They summarized that at AWS5 the accumulation is most abundant in autumn and winter, with 65 %–75 % of the annual accumulation occurring in these seasons. The autumn or winter maximums differ significantly from the spring or summer minimums. The mean accumulation at AWS5 was 17.7 cm ± 3.6 cm in their study. They also say that the tendency of larger events contributing (positively) to the total accumulation is a function of distance from the coast, elevation and annual accumulation.
Sinisalo et al. (2003) measured snow layers with ground penetrating radar during FINNARP 1999 from the topmost 50 m of the snowpack. They also compared radar observations with a 10 m deep snow pit and a 20 m deep snow pit. However, only the highest frequency, 800 MHz, gave results from the topmost 1–2 m. Moreover, detailed layer structure was not visible in the radar data.
Snow pits with depth of 1–2 m were made from coast to mountain range of Heimefrontfjella, including 17 snow pits in FINNARP 1999, 11 snow pits in FINNARP 2000 and 10 snow pits FINNARP 2003 expeditions (Kärkäs et al., 2002, 2005). They concluded that mean traditional grain size in the annual layer ranged between 1.5–1.8 mm and grain size decreases exponentially with the distance from the ice edge. They found that the snow cover contains numerous thin ice layers and crusts (0.5–2 mm), which, according to Goodwin (1991), form at the surface in summer due to strong incident solar radiation and wind. According to Mosley-Thompson et al. (1985), a high-density layer with fine grains forms in winter, while summer layers have lower density and bigger grains. Near the Basen nunatak from 20 cm depth, well-rounded grains represent the most common grain shape (Kärkäs et al., 2002). Snow grain size was measured in a transect from coast to plateau in 2007–2008 (Ingvander et al., 2016). They concluded that there are significant differences in particle size between the coast and the plateau, and the range in snow particle size varies significantly between the geographical regions at local scale due to different surface conditions such as microtopography. According to Kärkäs et al. (2002), daily temperature variations were significant down to about 30 cm depth. During the FINNARP 1999 expedition the mean density in the first metre with the standard deviation was 409 ± 8 kg m−3 (Kärkäs et al., 2002).
FINNARP 2006 and 2007 expeditions made daily snow pits (depth 50–90 cm) close to Basen nunatak including temperature and density measurements (Vihma et al., 2011). They found large inter-annual variations in the uppermost 50 cm of the snowpack; In 2007–2008 the snow temperatures were as much as 1.4 °C lower than in the previous summer. In 2006–2007 the snow density was higher than in 2007–2008 in the whole 50 cm layer, the maximum difference of 40 % at the surface. Also, they concluded that considering time scales of hours and days, the temperature of the uppermost 20 cm of the snowpack was strongly correlated with the mean air temperature during the preceding 6 to 12 h. At deeper layers the most important time scale was 72 h. They deduced that short-term temporal variations of snow density were less well explained, but the history of solar radiation on a time scale of 10 d controlled the density at the depth of 30 cm. They also observed that temperature maxima were close to the melting point during most clear and cloudy days, but temperature minima were much lower during clear days than during cloudy days.
Spectral and total albedo measurements were made along a line from the coast via Aboa to Svea station during FINNARP 1999 expedition (Rasmus, 2006; Kärkäs et al., 2002). They concluded that mean spectral albedo for snow from the Aboa traverse showed values of 0.95 in the visible band with minor wavelength dependence. After 700 nm, the wavelength dependence increased and at 1034 nm, the albedo dipped down to 0.70. They observed that the variations due to ambient conditions seem to outweigh the spatial variations. They showed that overcast and partly cloudy albedo cases resulted values that were 0.1 higher, between 400 and 700 nm, than those for the clear sky or almost clear sky cases. At longer wavelengths, the partly cloudy cases showed slightly lower values than those of the overcast cases. Midday total albedo values were between 0.85 and 0.90 for overcast conditions. Some diurnal variations were found with the lowest albedos being in the mornings and in the evenings since the sun shines from behind the sastrugi and the surface can appear relatively dark.
Solar radiation between 400–900 nm and snow pits were measured in the FINNARP 2009 expedition to study transmittance through snow (Järvinen and Leppäranta, 2013). Then a total of eight pits were made between Aboa and Svea, including measurements of thickness, density, hardness (hand test), liquid-water content, and grain size and shape (from photographs of grains). They concluded that the predominant grain type was large and rounded particles, and the predominant grain size was 1 mm in every snow pit. Snow pits including temperature, density, grain size and spectral albedo were made on eight days close to Basen nunatak at FINNARP 2009 expedition for comparison between measured and modelled albedo (Pirazzini et al., 2015). Stratigraphy observations were only made at a qualitative level, without snow hardness measurements and systematic recording of layer properties.
Main purpose of the field campaign during the FINNARP 2022 expedition was to collect innovative combination of drone-based data on snow surface roughness and albedo together with in-situ observations of physical snow properties. Drone-based observations on surface roughness have not been made before in the area and drone-based albedo observations were also more extensive than existing ones. Spatial coverage was also wide due to measurements at the satellite overpass locations. Aim of this paper is to describe the collected data set and provide example data from the AWS5 site. All measurement methods used in the field campaign are described with details and example data for the AWS5 field site is presented. In the end, short conclusions are given.
Aboa is located in the snow accumulation area (Isaksson and Karlén, 1994; Reijmer and Broeke, 2003). The field measurements were made weekly at AWS5 weather station (lat −73.105034, long −13.162370), approximately 10 km from Aboa station, and at different satellite overpass locations on pre-checked GPS routes typically 5–35 km from the station. Measurement configurations and coordinates are presented in Table 2. The presented data in this paper are from the AWS5 site, where seasonal snow evolution was monitored. Measurements included automated meteorological measurements at the weather station, snow pit measurements, radiation observations on the ground, radiation observations on a drone, and snow surface roughness observed with a drone-based laser scanner and a backpack-based laser scanner (Table 3). In total eight measurement occasions were made at AWS5 site and 16 measurements at different IceSat-2 and CryoSat-2 satellite overpass locations, including measurements at Riiser-Larsen shelf-ice approximately 100–130 km north-west from the Aboa station (Figs. 1 and 2), between November 2022 and February 2023.
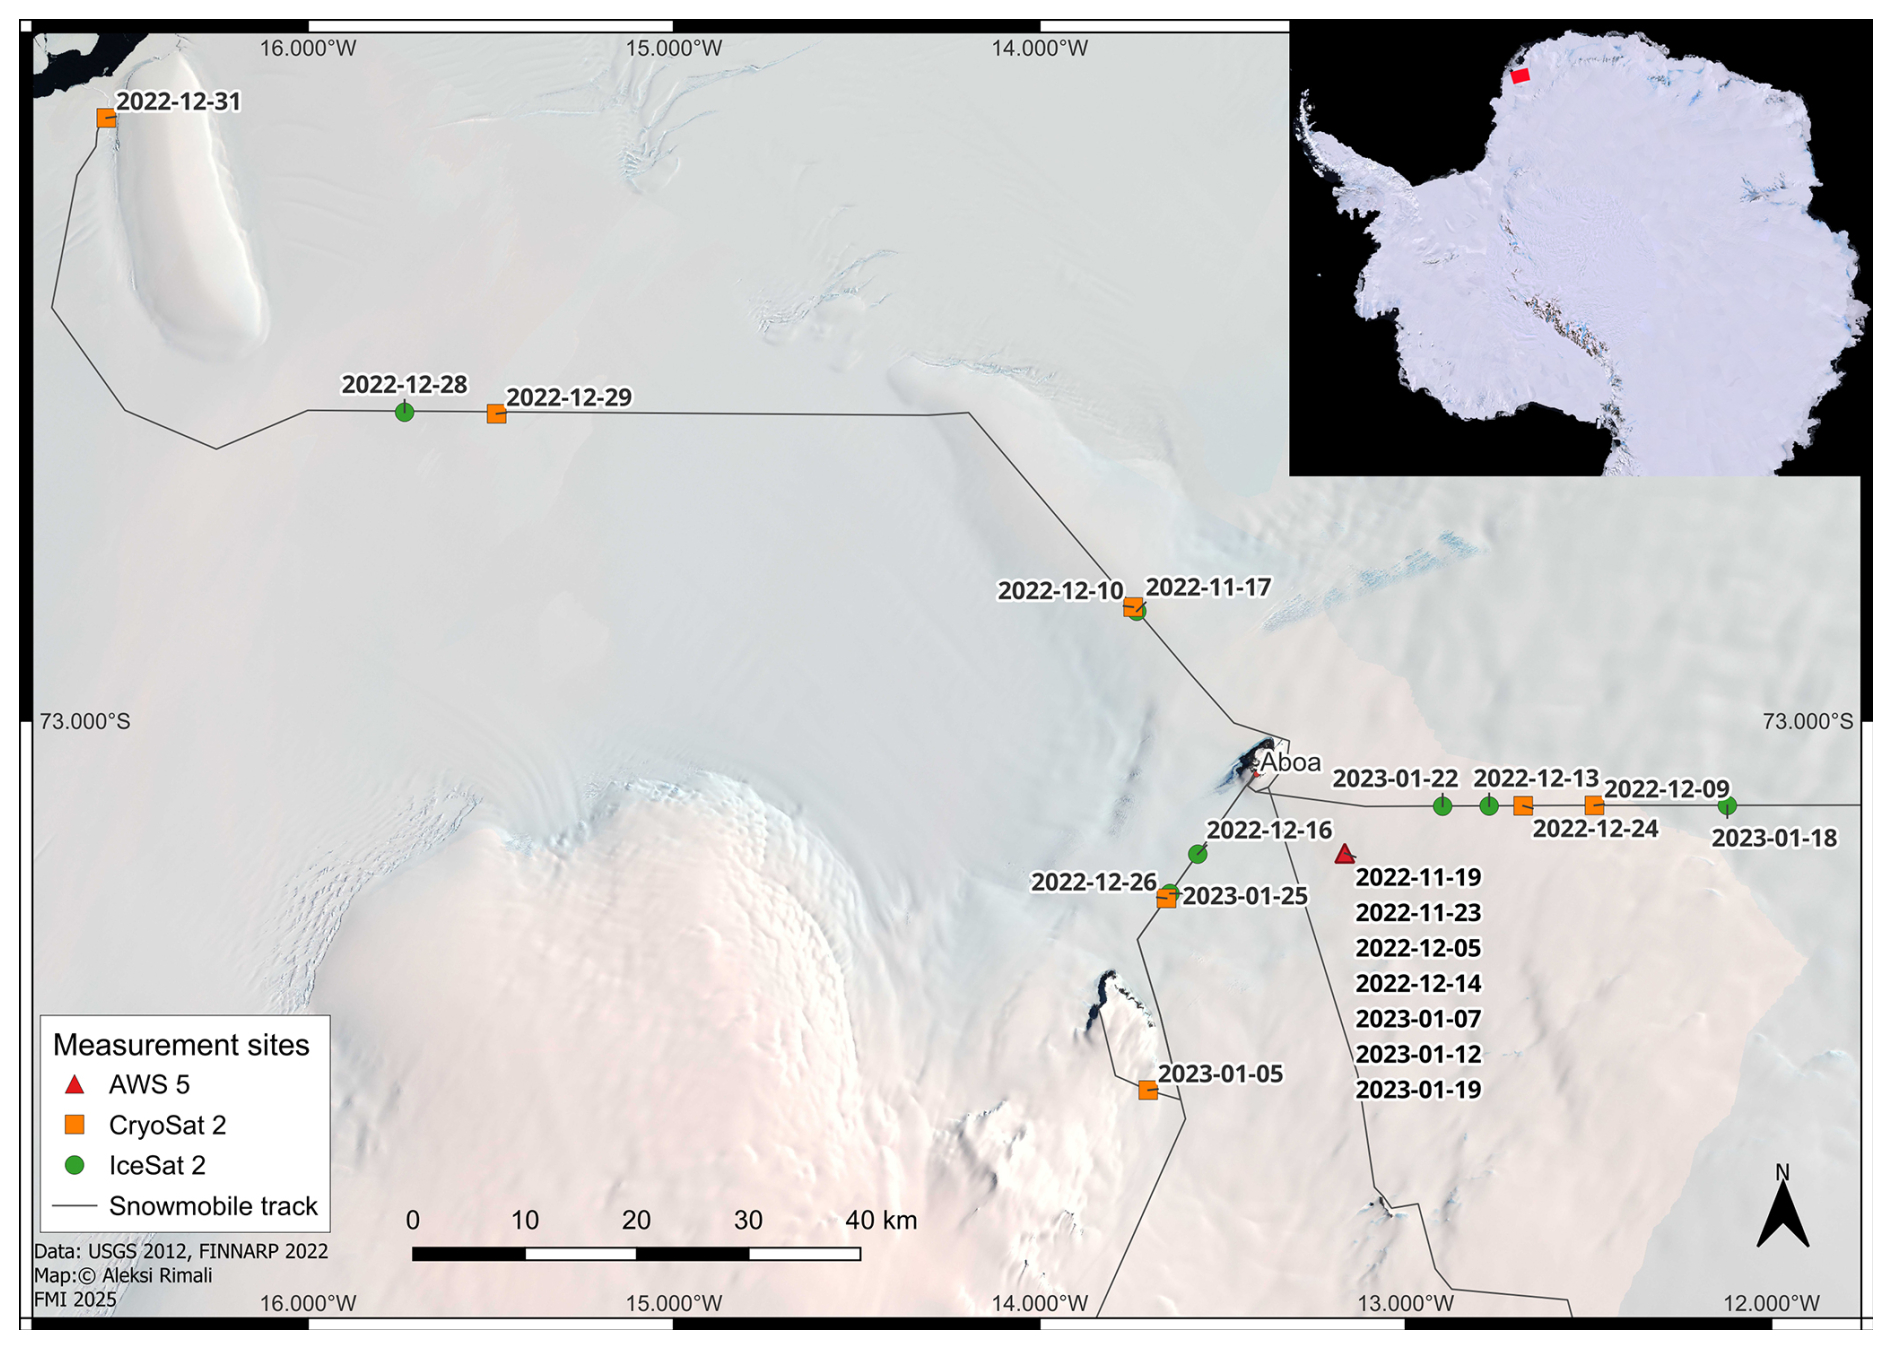
Figure 1Map of the area where field sites are located. Red square in the small map right up corner shows the area in the larger map. Dates indicate when measurements were made.
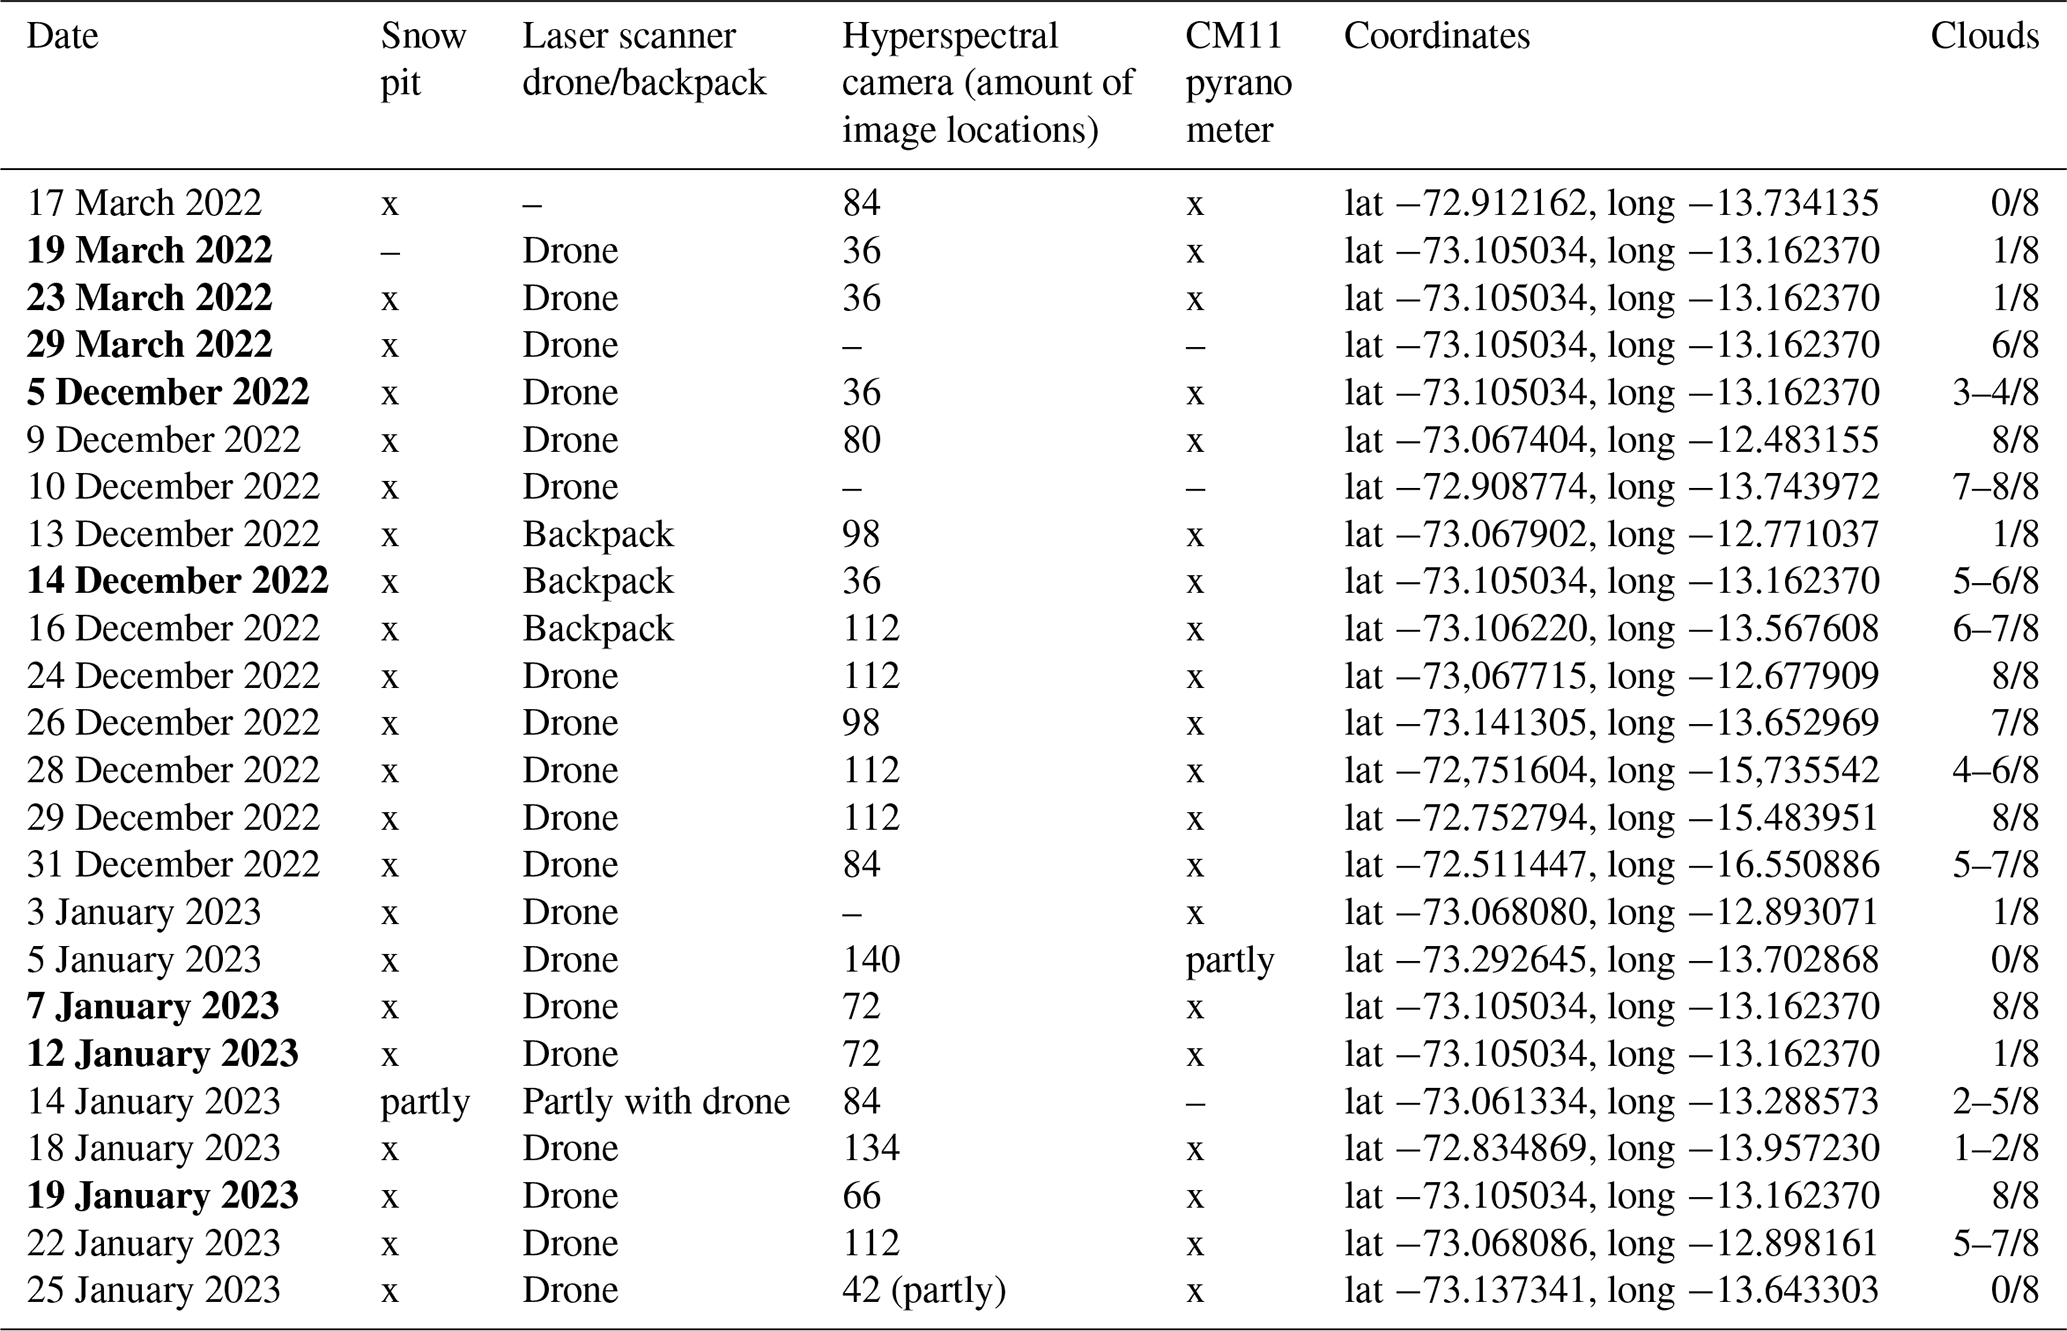
Total 26 measurement occasions were conducted. Measurements at the IceSat-2 and CryoSat-2 satellite overpass locations were made for calibration and comparison of these data with simultaneous in situ data (within a few hours, if not simultaneous). To follow the evolution of snow properties over the summer 2022–2023, repeated measurements in the vicinity of the AWS5 weather station are studied.
Table 2Date and conducted measurements for each measurement occasion. Cloudiness is also noted. Dates of the AWS5 site measurements are bolded.

2.1 Avartek Boxer drone
Avartek Boxer is a Finnish made octocopter (Fig. 3a), which is operated electrically, but it has a gasoline generator to produce electric power during flight. This drone was used for measurements with a laser scanner. The maximum take-off weight of the UAV is 27 kg. The two fuel tanks on both sides of the UAV take altogether seven litres of gasoline (∼ 5 kg), and based on the experiences in this campaign the fuel consumption was about 2.2–2.5 L h−1. Consumption depends on the prevailing wind conditions, and 12 m s−1 wind speed on ground was kept as a safety limit for the flights.
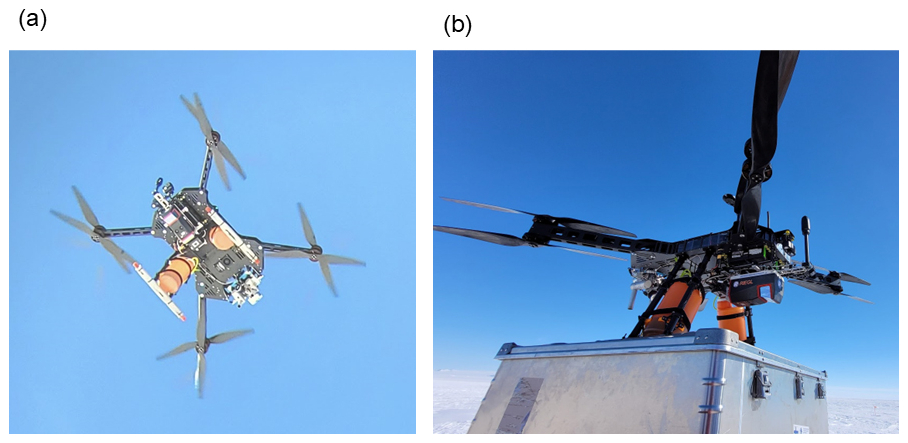
Figure 3(a) Avartek Boxer and (b) Riegl VUX-120 laser scanner mounted on the front of Avartek Boxer drone, GNSS-IMU unit is located right behind the scanner, antenna is seen at the front of the scanner.
We conducted flights at 75 and 100 m above the surface, and typical flight speed was 8 m s−1, though 5 and 7 m s−1 speeds were also used in some cases. The longest flight we did was 2 h 45 min. The flight plan was designed using QGroundControl UVS controller software (https://qgroundcontrol.com/, last access: 28 November 2025) on the remote controller and transferred to the UAV to perform automated flight. Take-offs and landings were operated manually.
2.2 Laser scanner
The scientific payload for the UAV laser scanning was Riegl VUX-120 (Fig. 3b). The specific feature of the scanner is to provide three consequential cross-track scan lines across the area of interest at ten-degree intervals. This feature is implemented using a rotational mirror with tree facets and permits to capture even steep surface shapes in a single flight pass. The optical configuration gives 100° maximum cross-track field of view, and an effective pulse rate of 1500 kHz. The laser operates at 1550 nm wavelength and produces 10 mm ranging accuracy and 5 mm precision on targets. Flight parameters were set to produce 3 cm along- and across-track point spacing for 100 m, and 2 cm for 75 m flight altitudes at single flight pass right below the UAV. For the complete point cloud data more dense distribution was achieved due to overlapping of the flight lines.
Positioning for the scanner was based on NovAtel CPT7 GNSS-INS with a dual-antenna array by two Harxon HX600A antennas to provide global reference and accurate attitude information to georeference the laser data (Fig. 4). Positioning data was recorded at 5 Hz for the GNSS and 400 Hz for the INS data and complemented with simultaneous 5 Hz base station Differential GNSS (DGNSS) data with Trimble R10 receiver.
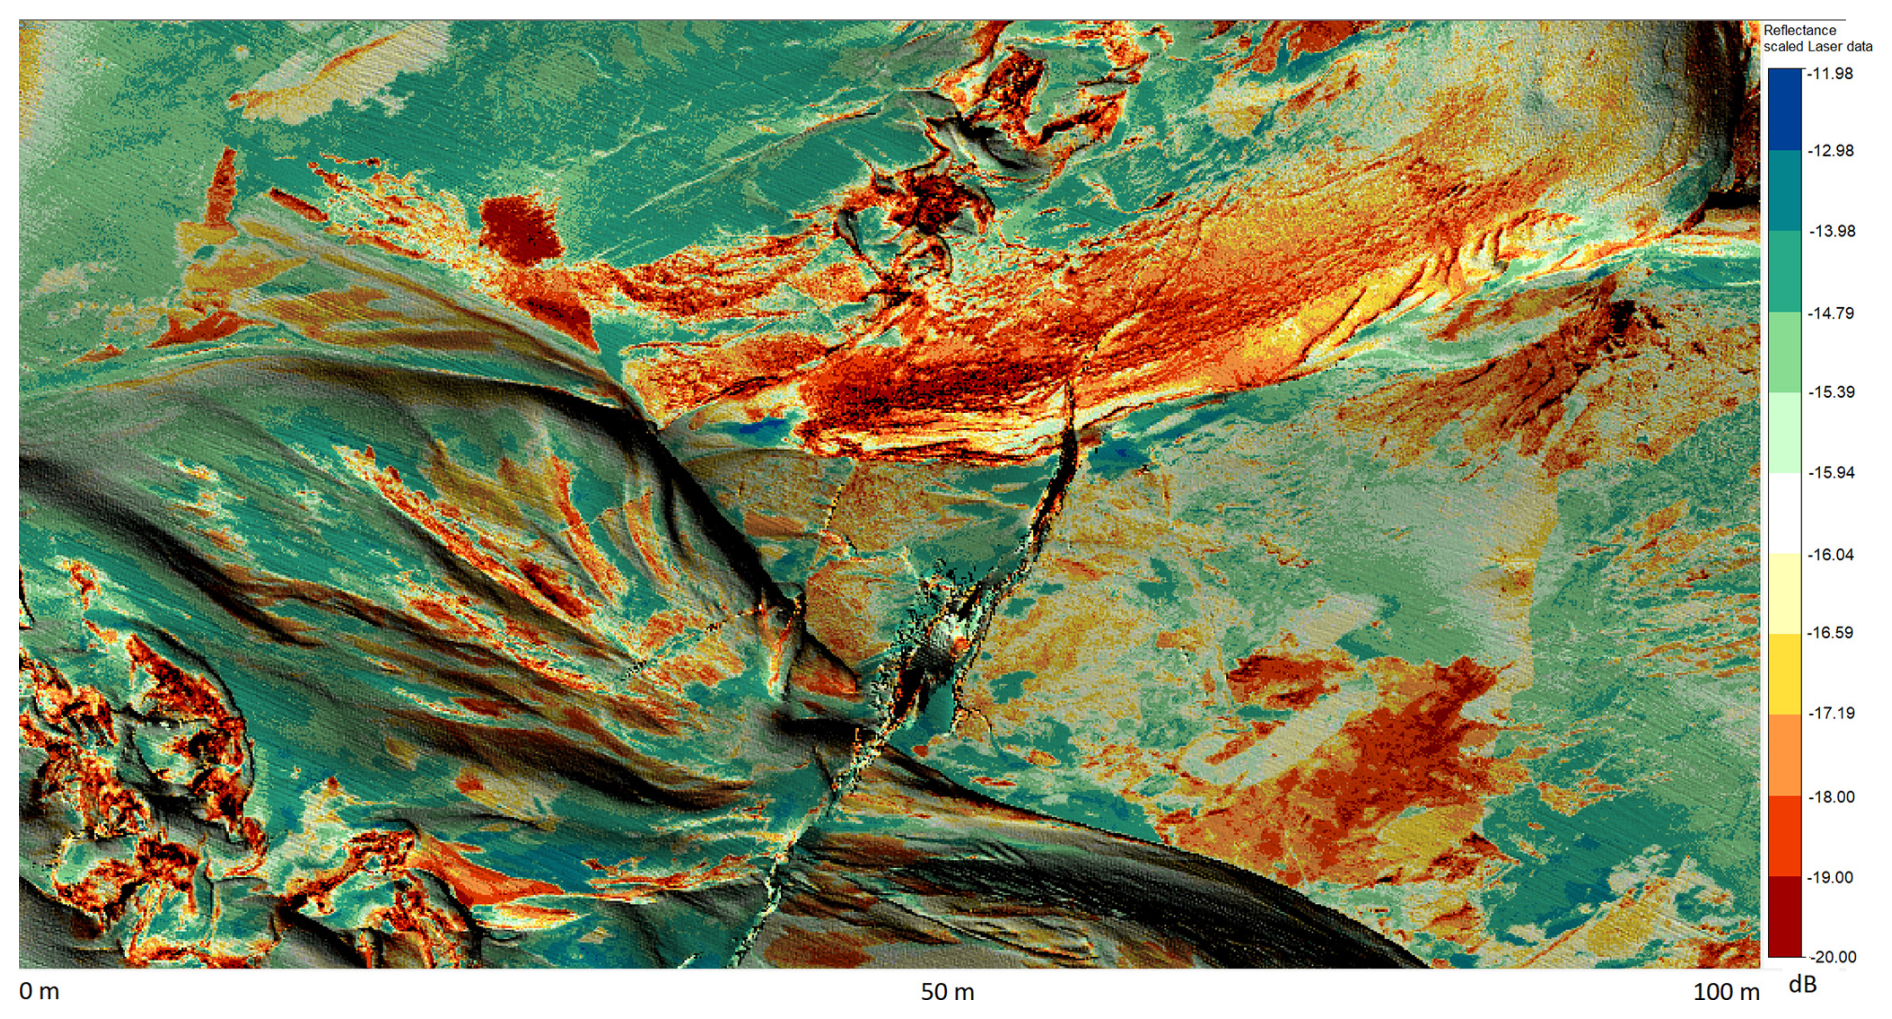
Figure 4An example of the laser scanning data at the Riiser-Larsen shelf-ice shows the rugged transition zone with sea ice and wind erosion patterns. Colouring indicates the reflectivity of the surface at 1550 nm. Image width approximately 100 m, pixel size 10 cm.
The trajectory, which is needed for reconstructing the digital replica of the snow surface, computation takes place post-mission, and for that end a GNSS base station data was collected on site with Trimble R10 receiver observing GPS and GLONASS satellite constellations. It is also possible to compute the trajectories using precise point positioning (PPP) method, and then all the Inertial Measurement Unit (IMU) observations of Galileo and BeiDou satellite constellations could also be used. PPP was however applied only on a few datasets where the base station data was sporadic or disturbed, most probably due to the radio traffic (base station too close to the radio masts). Waypoint Inertial Explorer (8.90) software was used for computing the trajectories in a tightly coupled process with IMU to primary antenna translations of (8, 439, 247) mm. A 12° elevation angle was used for the satellite masking. PPP was used for computing the WGS84 coordinates for the base station for each session to allow DGNSS processing.
Point cloud processing was perfomed in RiProcess software (version 1.9.0, Riegl gmbH), which essentially combines the trajectory and raw laser scanner data and transforms them into 3D points. To do that accurately the boresight misalignment between the IMU and scanner were solved using the “Scan data Adjustment” tool, which searches for and matches planar features within the scanned area and data computed with initial values to yield accurate parameters for refine point clouds. However, trajectories usually have some residual errors and dynamic drifting, which was then accounted for using RiPrecision process to mitigate the temporal variations in the trajectory. When all these were addressed properly, the data was recomputed for the final point clouds for further analysis. The point clouds include information on range, amplitude, reflectance and echo deviation.
2.3 Matrice 600 Pro drone
Matrice 600 Pro (DJI) drone was used for radiation measurements (Fig. 5a). The same drone has been used for field measurement in Sodankylä, Finland and therefore, it was proven to be able to operate in winter conditions. The drone uses lithium batteries, and its maximum take-off weight is 15.5 kg. The typical flight speed was 3 m s−1 and flight time was around 15–20 min with one set of batteries, but this varied depending on wind conditions. A typical 84-point flight plan required at least two sets of batteries and took approximately 45 min. Flight altitude was typically 100 m, but occasionally vertical radiation profile measurements were made with 100, 85, 65, 50, 40, 30, 20 and 10 m altitudes. Flight plan was similar for each measurement occasion, and the measurement procedure was automated. Gimbal H16 (Gremsy) was mounted on the drone where radiation measurements were attached to be able to level them correctly.
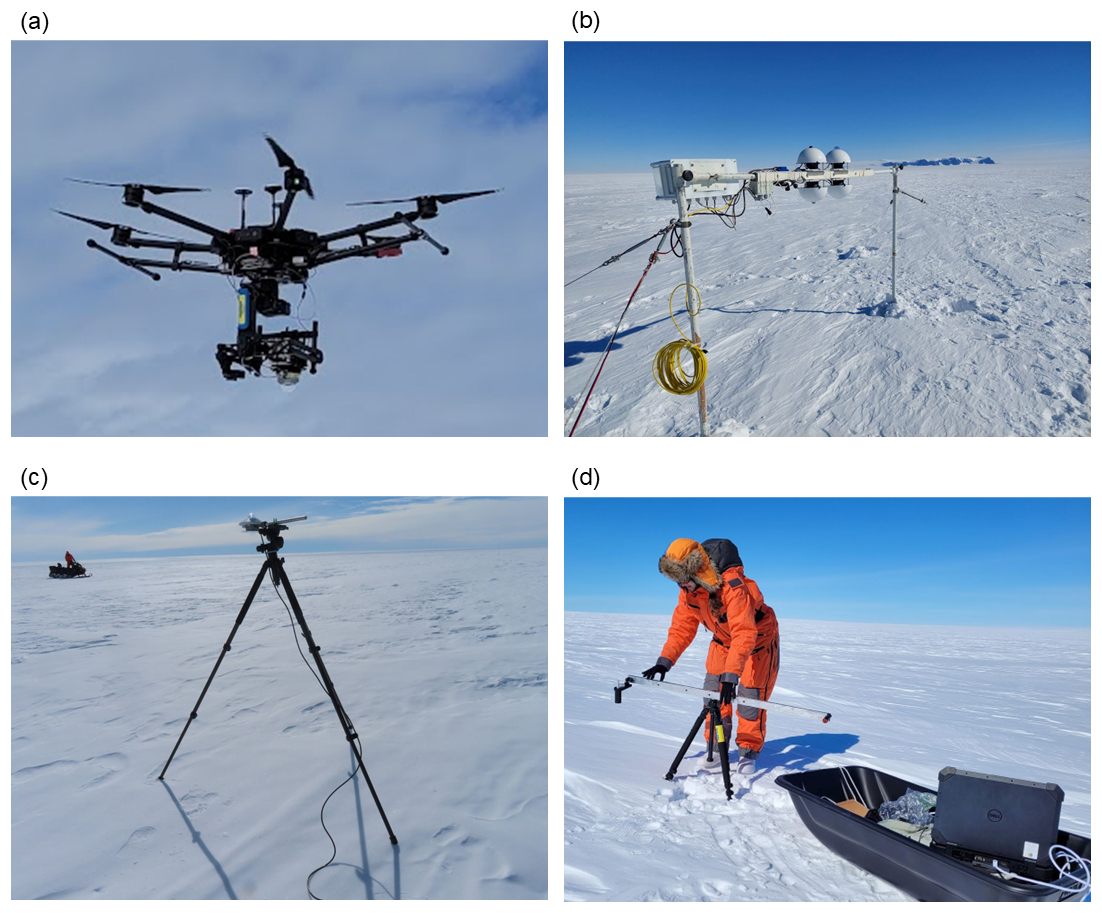
Figure 5(a) Hyperspectral camera and CM11 pyranometer in a drone, (b) Eppley radiation station, (c) removable CM14 station, and (d) ASD spectrometer.
The drone included three GPS sensors. Ground control points were marked with reference flags to be able to georeference the images more accurately. Moreover, accurate GPS location of the reference flags were measured with a precision GPS device (parts from ArduSimple). However, connection problems reduced the accuracy in November and December to approximately 30 cm. In January, problems were fixed, and accuracy was approximately 2 cm. However, a more accurate GPS sensor was located at the laser scanner drone, which data can be combined also with the radiation measurements.
2.4 Radiation measurements
Eppley radiation station (Fig. 5b) was installed at the AWS5 site on 19 November 2022 and disassembled on 19 January 2023. The radiation station has two broadband upwelling and downwelling radiative flux sensors observing shortwave (280–2800 nm) and longwave (4–50 µm) radiation wavelengths. The sensors were not ventilated due to power limitations in the field conditions, but regular visits were made to maintain the station. Incoming and outgoing irradiances and albedo are presented for the measurement period in Fig. 6. Albedo values > 1.0 on 18 December and 1 January were filtered, which correspond to broken-cloud conditions where concurrent enhancement or inhibition of incoming solar flux by cloud shadowing of the direct radiation path and e.g. cloud side reflections combine with alteration of reflected flux by moving cloud shadows in the pyranometer field of view, creating conditions where the measured apparent albedo of fine-grained dry snow may variably exceed 1.0 or be suppressed to 0.8. The instrument has two support legs and the sensors are installed to a bar between them. Installation was made so that shades were minimized on the instrument field-of-view area at noon. The height of the sensors was approximately 120–140 cm above the snow surface depending on whether there was new or drifted snow below the instrument.
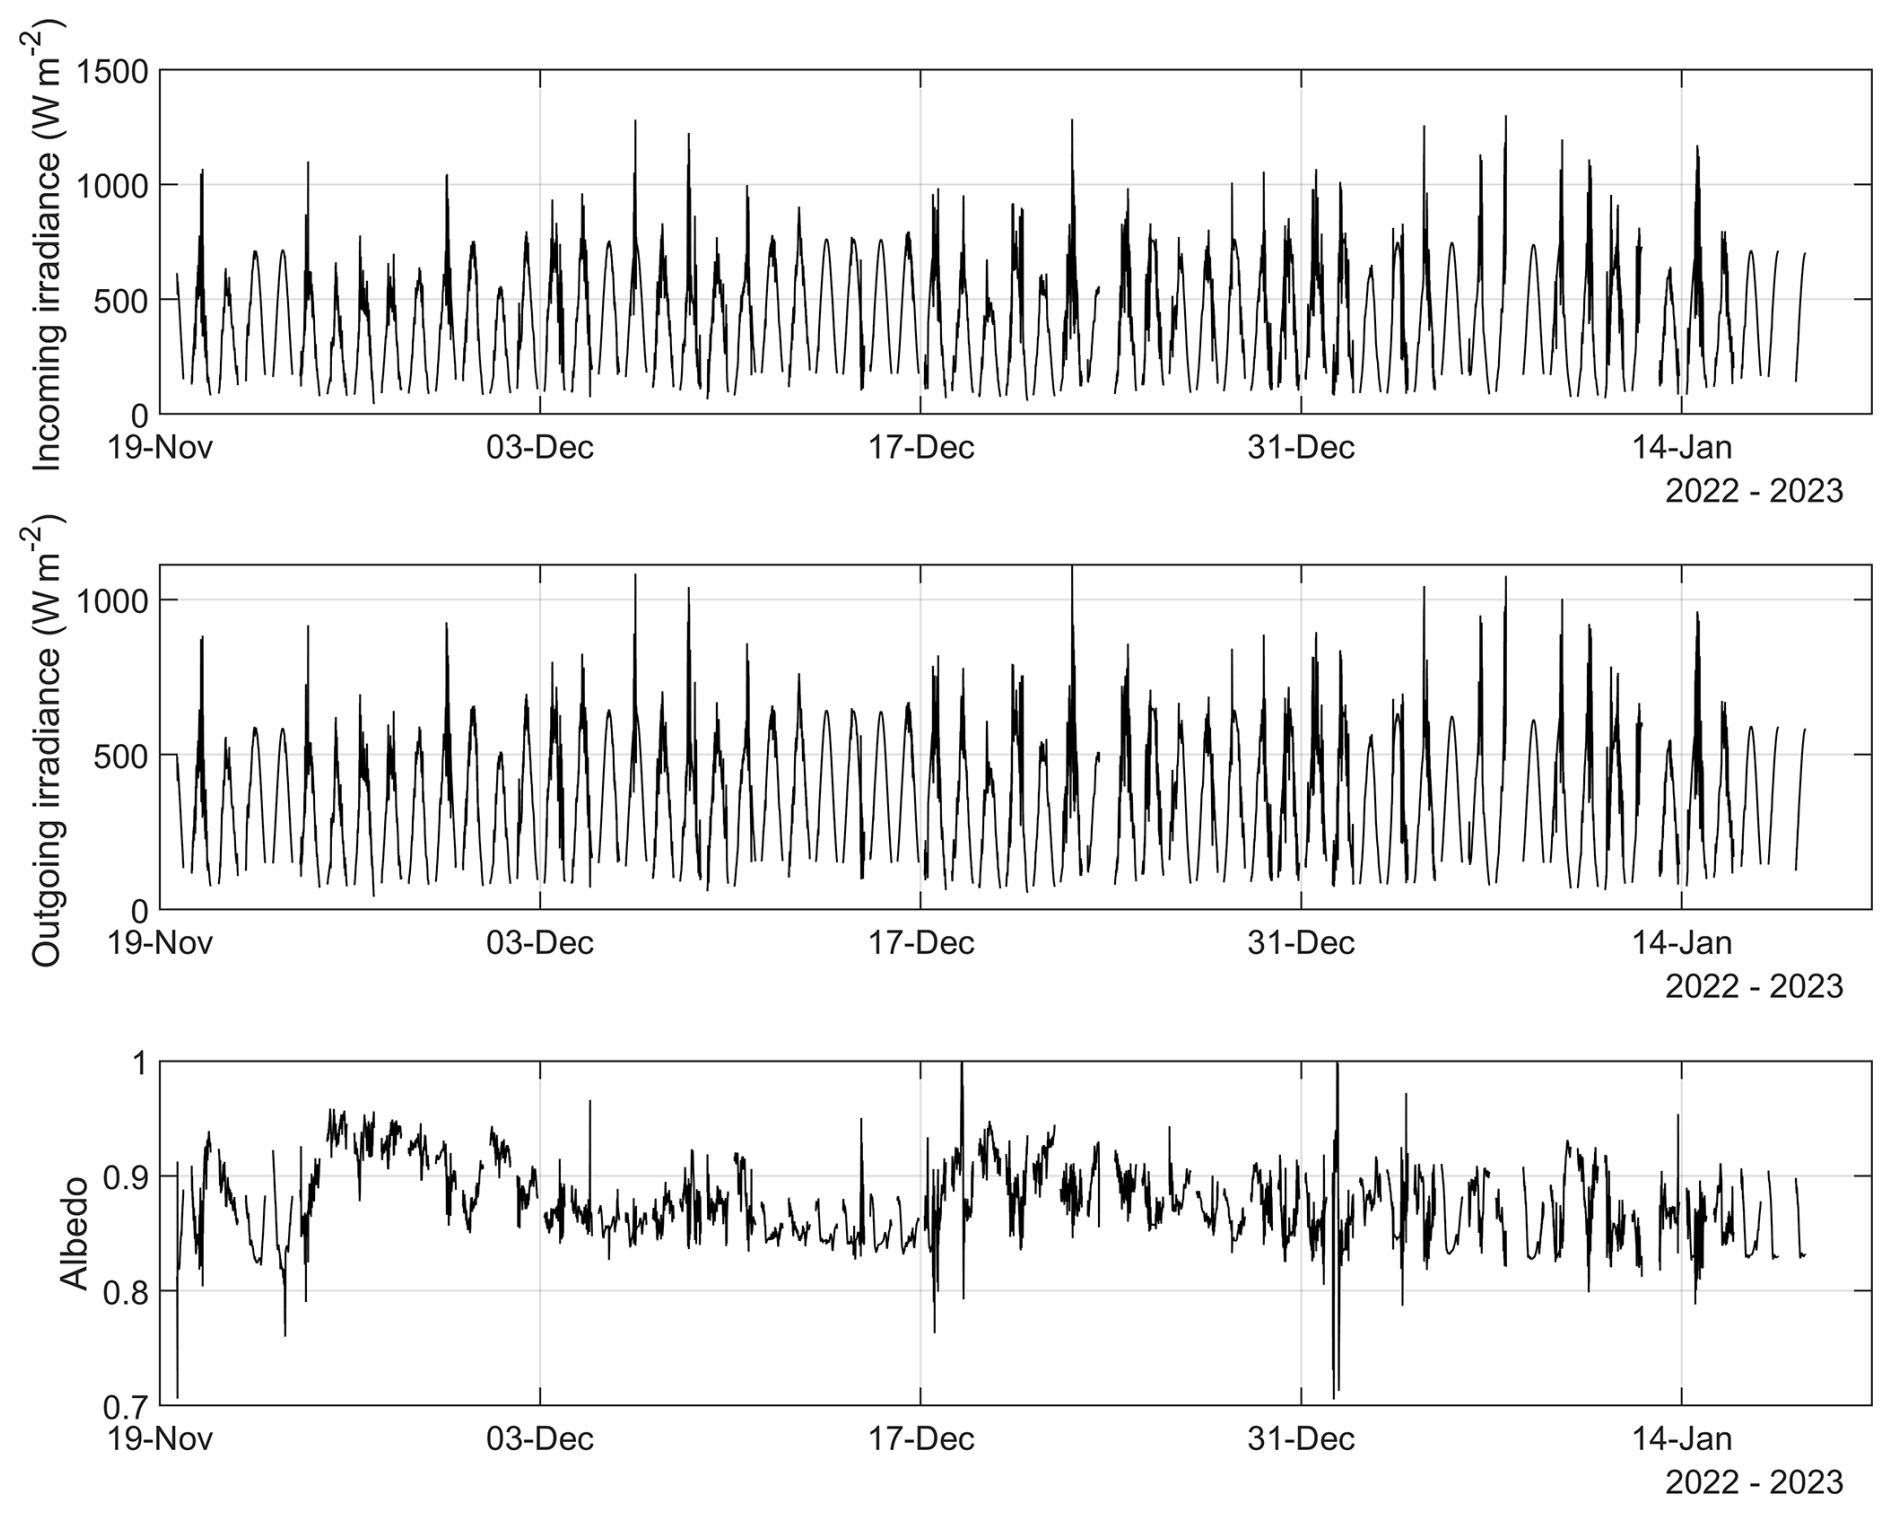
Figure 6Incoming (top panel) and outgoing (middle panel) shortwave irradiance measured by the Eppley radiation station. Albedo (bottom panel) is calculated as the ratio of incoming to outgoing irradiance. Data corresponding to solar zenith angles greater than 80° have been excluded to minimize potential biases due to low sun angles. Albedo values > 1.0 created by broken cloud conditions on 18 December and 1 January are also filtered out as well as respective irradiance values.
The lightweight Kipp & Zonen CM14 radiation station (Fig. 5c) measures both incoming and reflected solar radiation at 340–2200 nm wavelengths. The instrument was mounted on a tripod and azimuthally pointed towards the Sun when measuring at satellite overpass locations. In addition, comparative measurements were made at the AWS5 site with the Eppley radiation station. The height of the sensor was approximately 120–140 cm above the snow surface. The instrument was manually levelled during each setup with a bubble level.
Hyperspectral camera (Rikola Ltd) with 30 channels between 500–900 nm wavelengths was installed on the Matrice 600 Pro drone (Fig. 5a). The channels were chosen to cover the whole wavelength range (Table 4) and to match with optical satellites like Sentinel 2 and Landsat. The hyperspectral camera also included an irradiance sensor and GPS. At AWS5, the covered area was approximately 80 m × 80 m. At the satellite overpass locations, the covered area was 221 m × 85 m which was expanded to 221 m × 119 m when batteries allowed. Measurements were made typically at 36 locations but occasionally also 72 locations in the measurement area depending on the covered area (see Table 2). Drone stopped for each measurement location to allow stable conditions for imaging. Images had approximately 80 % front and side overlap to cover the area so that it is possible to combine a mosaic image for each used wavelength (Fig. 7a). Due to limited possibility to adjust settings for each channel, shorter wavelengths of some images have overexposure problems.
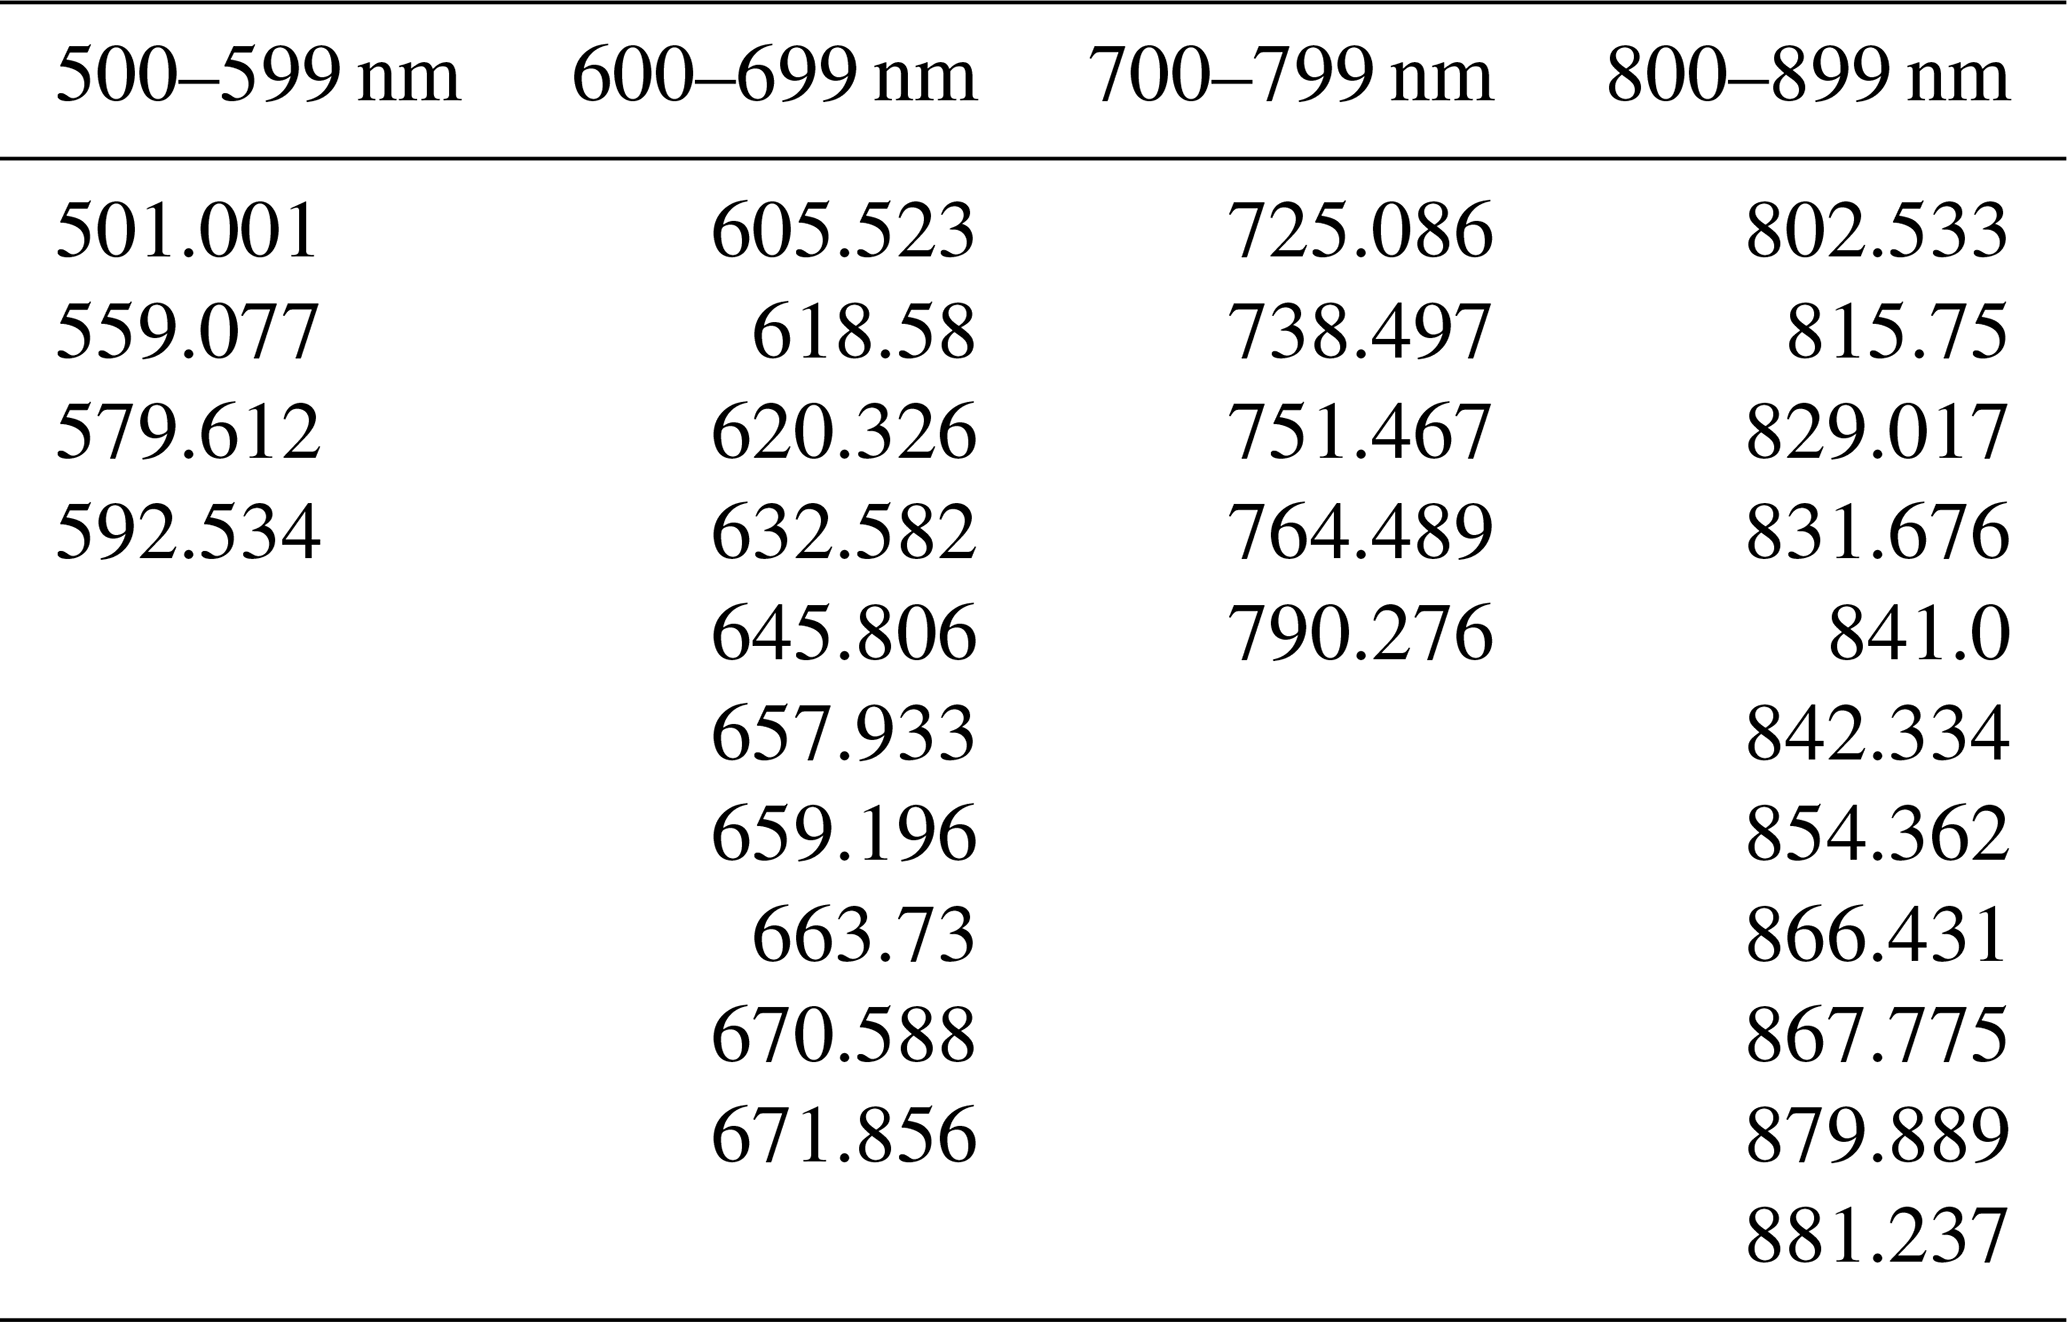
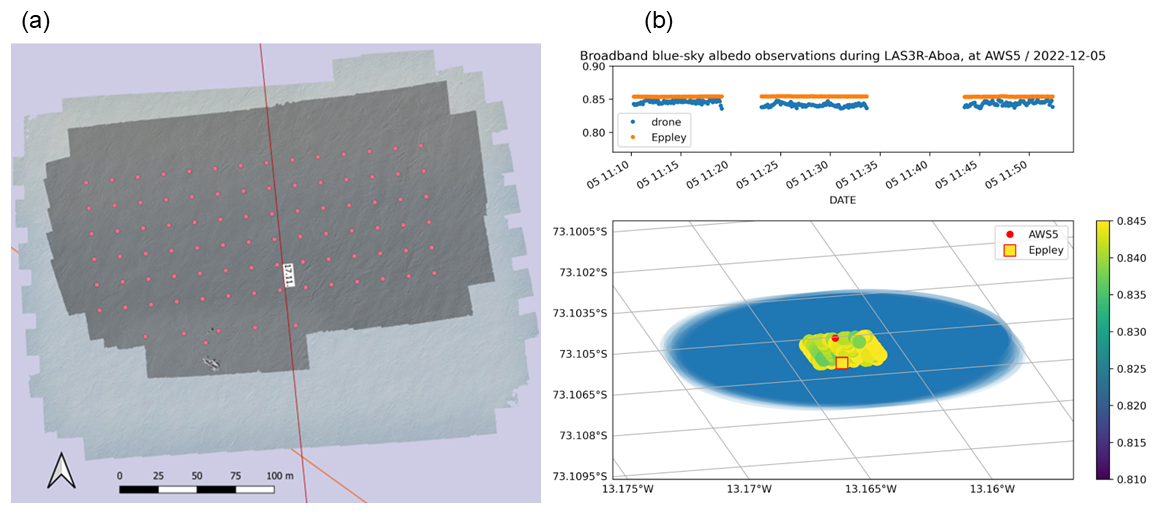
Figure 7(a) Example of hyperspectral camera spectral radiance data in channel 501 nm on 23 November 2022. (b) Example of CM11 data on 5 December 2022. Top panel presents broadband blue-sky albedo from the drone and Eppley in UTC time. In the lower panel, spatial variability of CM11 albedo is shown and the blue area presents the field of view of the CM11 instrument at the flight altitude.
The hyperspectral images were calibrated using the manufacturer's software, applying dark reference images acquired before each measurement flight. These dark references provided a baseline signal used to remove sensor bias from the raw data. In addition, white, grey, and black reference panels with known reflectance values were positioned in the measurement area. These targets were subsequently used to convert image radiance to reflectance. The calibrated hyperspectral data were then processed to create mosaic images for each measurement area using Agisoft Metashape software (https://www.agisoft.com/, last access: 28 November 2025). Georeferencing of the mosaics was also carried out in the same software, utilizing ground control points that had been placed in the measurement field prior to data collection.
A downward-pointing and gimbal-stabilized broadband Kipp & Zonen CM11 pyranometer (Fig. 5a) with 340–2200 nm wavelengths sensor and 180° field of view was also installed to the radiation observation drone. The logger also included a GPS sensor. Radiation was measured continuously when the sensor was powered. Typically, the hyperspectral camera and pyranometer observations were made simultaneously. However, occasionally the instruments were not successfully started to store data properly and measurements needed to be repeated with an additional flight. Measurement with CM11 on a drone includes more than just snow, such as sky, snowmobiles, and other instruments, due to wide viewing angle of 180° (Fig. 7b).
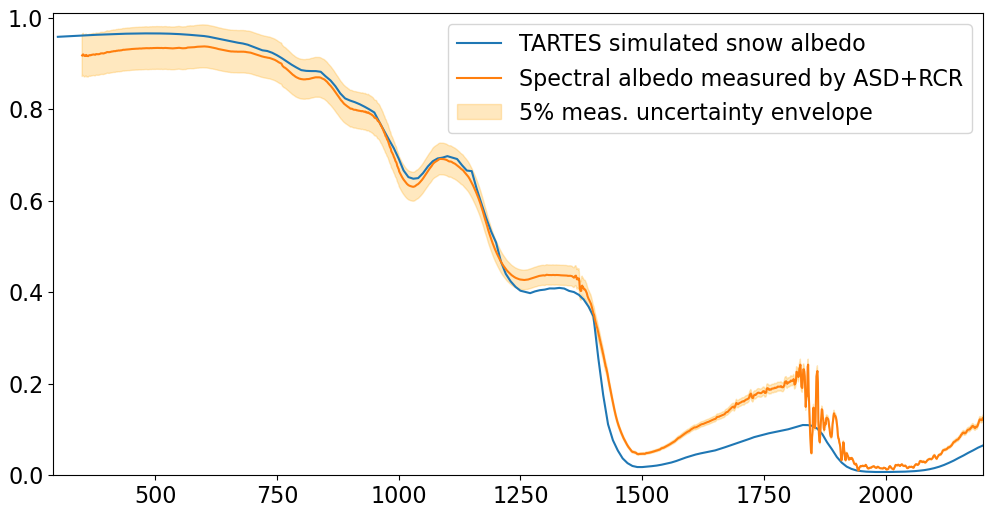
Figure 8Spectral albedo measured with ASD spectroradiometer using an alternation of RCR foreoptic pointing up- and downward on 5 January 2023, a clear-sky day and simulated black-sky snow albedo with TARTES model with inputs consistent with observed conditions.
In addition, a portable ASD Field Spec Pro Jr. spectroradiometer (Fig. 5d) measuring spectral reflectance with 350–2500 nm wavelengths and ∼ 10 nm spectral resolution was used at several locations at the drone measurement area. Locations were chosen visually representing different surface roughness close to measurement of physical surface snow properties. A pistol grip with 8° fore optics was mounted on a tripod to stabilize the measurement. In addition, up-wards and down-wards remote cosine receptor (RCR) measurements were made at the snow pit location. Spectral albedo in range 350–2200 nm measured by the ASD using an alternation of RCR foreoptic pointing up- and downward on 5 January 2023, a clear-sky day is presented in Fig. 8. For assessing the quality of the measurement, we simulated black-sky snow albedo with Two-streAm Radiative TransfEr in Snow (TARTES) (Picard and Libois, 2024) and inputs consistent with observed conditions (SSA = 18 m2 kg−1, density = 260 kg m−3, SZA of 51°, direct illumination, climatological impurities of 1.5 ng g−1 in the surface layer). A commonly quoted 5 % relative measurement uncertainty envelope is estimated for the ASD measurement, consisting of calibration uncertainty, the difficulty of establishing a stable thermal regime for the instrument in harsh conditions, and from the imperfect cosine response of the RCR foreoptic. The agreement between measured and simulated spectral snow albedo is good in the near-infrared wavelengths where grain size is most significant and e.g. impurities play a minor role. In the shortwave infrared, it is likely that imperfect leveling of the instrument and/or sloping terrain affect the ASD measurement – slope effects are known to affect the shortwave infrared region over snow much more than visual or near-infrared (Picard et al., 2016). The shortest wavelengths also show differences above the uncertainty envelope, potentially being caused by a combination of RCR response imperfections and even operator presence if visible in the upward hemisphere during the near-ultraviolet measurement which is sensitive to sky blockage.
Moreover, traditional RPG photos were also taken from the drone measurement area with the original camera of Mavic 2 Pro (DJI) drone.
2.5 Snow pit measurements
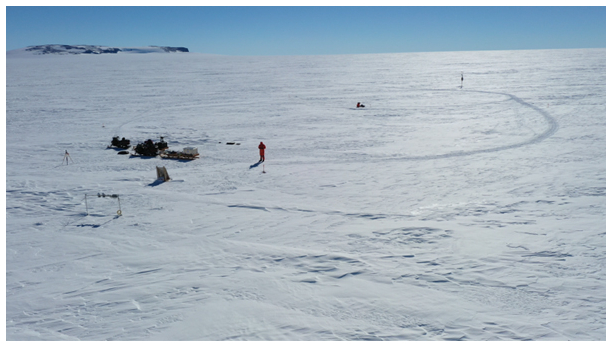
A total of 25 snow pits were made at AWS5 and satellite overpass locations during the campaign, excepting the first day on site when the Eppley radiation station was installed instead of the snow pit measurements. Snow pit measurements were made in the vicinity of Eppley radiation station or the removable CM14 radiation station, so that the sampled location was different at every measurement occasion. All snow pits were made towards the direction of the Sun, so that the snow pit wall was shaded (Fig. 9a). The main interest was on snow surface properties and therefore the typical depth of the pit was only approximately 25–30 cm. Measurement methods were similar as described in Leppänen et al. (2016).
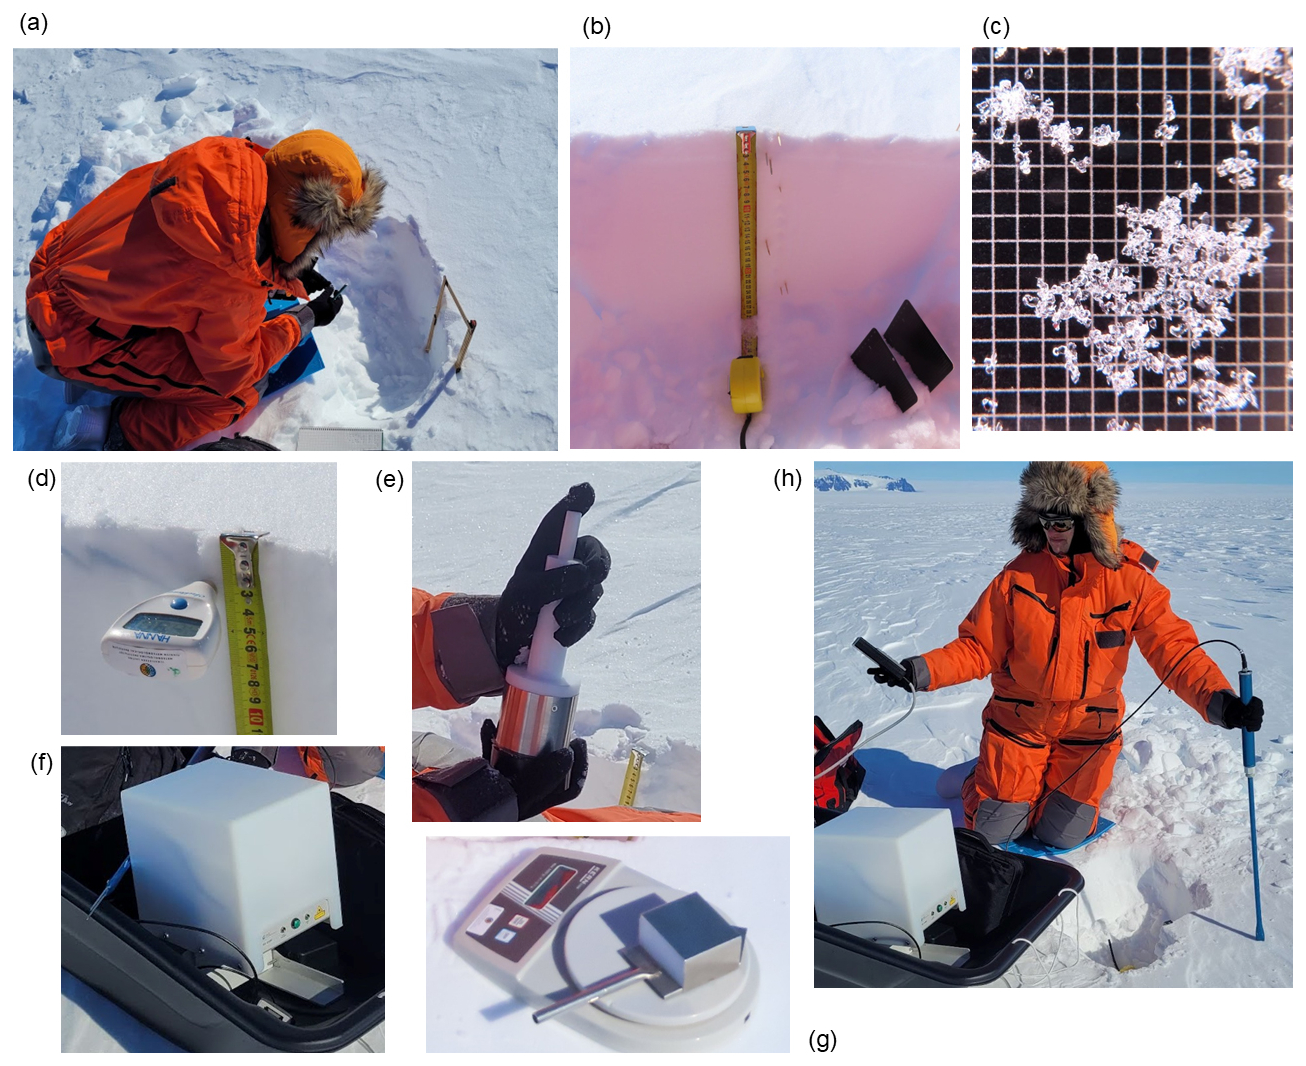
Figure 9(a) Overview of snow pit work, (b) example of profile photo, (c) example of grain macrophoto, (d) temperature measurement, (e) snow sampling for IceCube SSA measurement, (f) IceCube instrument, (g) density measurement, (h) SnowFork measurement from the surface.
Snow stratigraphy with hardness, traditional grain size, grain type and wetness were analysed according to Fierz et al. (2009). The snow pit area was photographed before digging the pit and photos of the profile including layer interfaces marked with toothpicks was made (Fig. 9b). Snow grains from every layer were photographed against a crystal card (SEAR) 1 mm reference grid to enable analysis of post-processed grain size and grain type (Fig. 9c). Temperature was measured from air, surface, and snow at 1, 2, 4, 6, 10, 15 and 20 cm below surface with HI98501 digital thermometer (Hanna Instruments Ltd) (Fig. 9d).
Specific surface area (SSA) of snow was measured with IceCube instrument (A2 Photonic Sensors) which measures hemispherical near-infrared reflectance from snow sample surface using 1310 nm wavelength laser and integrating sphere (Fig. 9e and f), to be converted to SSA with a dedicated software (Gallet et al., 2009; Zuanon, 2013). This was the first time when the IceCube instrument was used for SSA observations in the vicinity of Aboa station. The measurement was made from the surface and every layer thicker than 2 cm, and for the thick layers, the measurement was repeated approximately every 5 cm.
Density was measured every 3 cm, with a 3 cm high rectangular sampler with a volume of 100 cm3 (Fig. 9g). These snow samples were weighed with a digital scale (KERN EMB 500-1, KERN & SOHN Gmbh), and the weight of the empty sampler was also recorded. Moreover, liquid water content and density were measured with the Snow Fork instrument (Insinööritoimisto Toikka Oy) from the surface and every 10 cm (Sihvola and Tiuri, 1986). The surface measurements were made holding the instrument vertically so that the measurement covers the topmost 7 cm (Fig. 9h). In the other measurements, the instrument was positioned horizontally to the snowpack.
In addition to the snow pit, spatial variability of surface snow properties was measured at the drone measurement area by repeating the topmost measurements at five locations close to reference flags of the Matrice 600 Pro drone. For those locations, air temperature, surface temperature, grain size and type, SSA, density, liquid water content and density with Snow Fork were measured. Additionally, photos were taken from all measurement locations.
The snowpack in the region consisted mostly of rounded grains (Fig. 10). However, new precipitation particles were deposited on top after a snowfall on the second measurement day in November. Additionally, some ice or crust layers were occasionally detected. Average SSA was 29.4 m2 kg−1 and SSA values varied between 14 and 52 m2 kg−1 (Fig. 11). However, SSA values were typically between 20 and 35 m2 kg−1. SSA was highest, around 50 m2 kg−1, for the second measurement day in November when the observed grain type was precipitation particles. Average density was 410 kg m−3 and density varied between 250 and 520 kg m−3 (Fig. 12). Values measured from the surface were generally close to the values measured from the profile. However, surface values were more often the smallest or largest values from the day. Average liquid water content was 1.8 % and values varied between 0.8 % and 3.8 % but most typical values lie between 1 % and 2 % (Fig. 13). Average surface temperature was −4.6 °C and it varied from −8.1 to +0.2 °C. Highest surface temperature was not indicating the highest liquid water content.
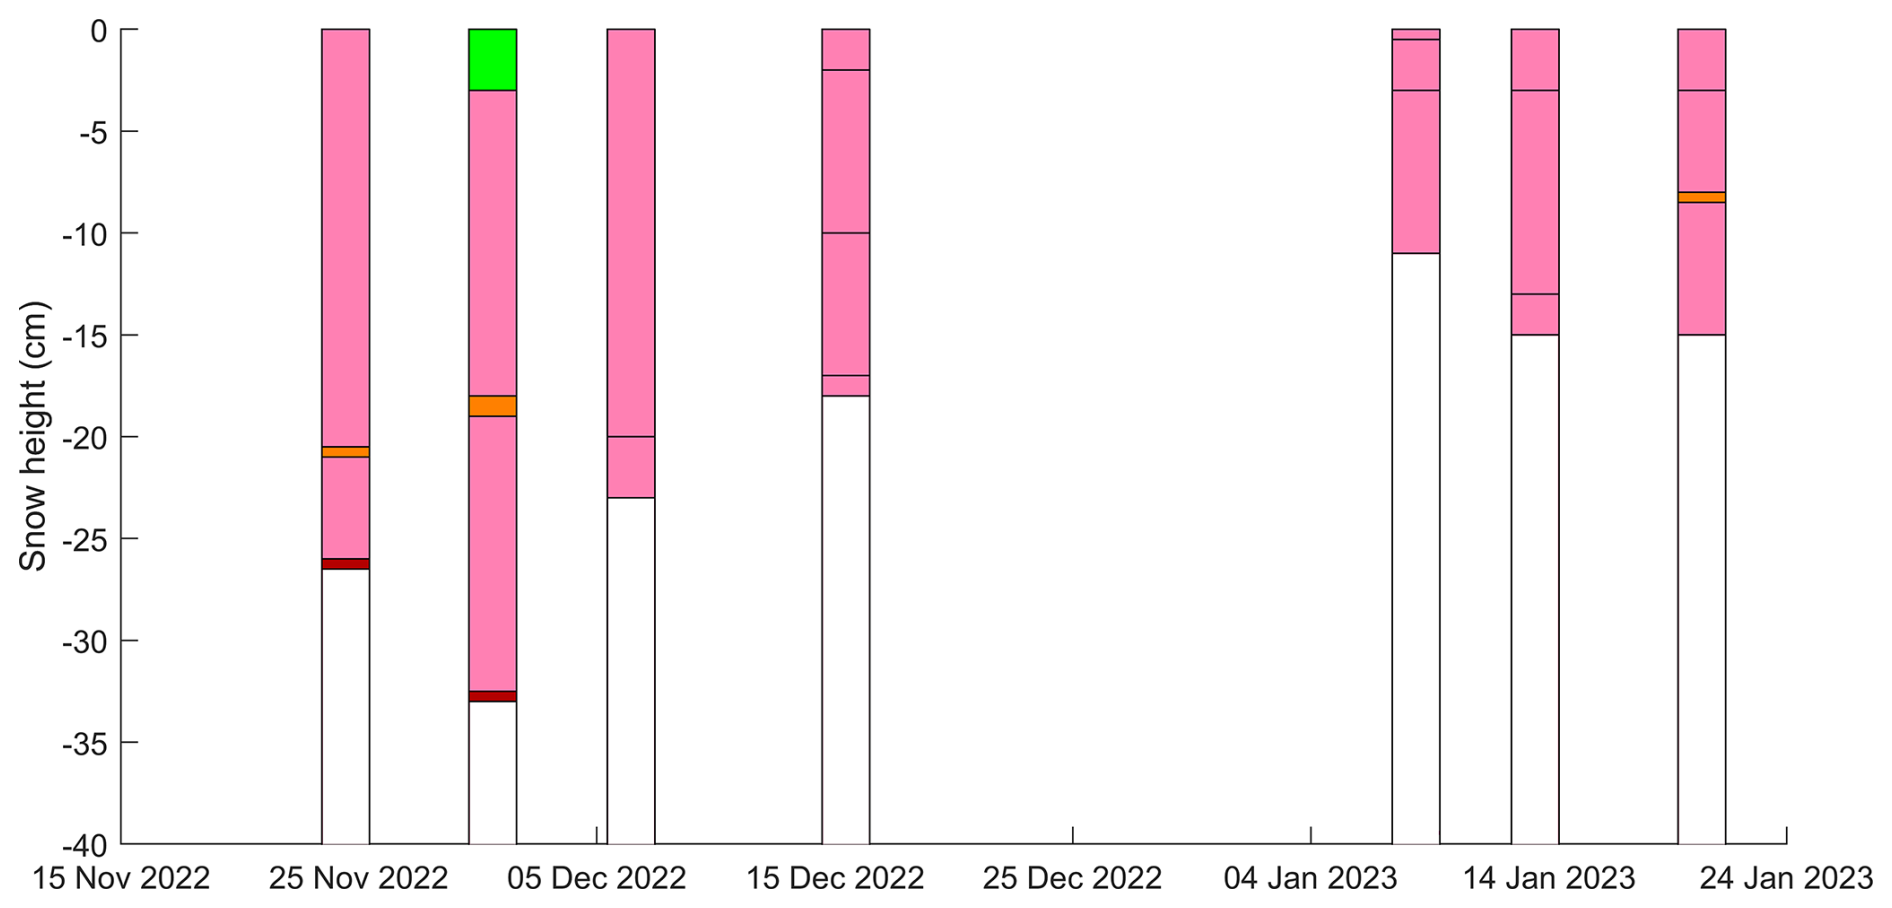
Figure 10Stratigraphy for the topmost snowpack. Following grain types were observed: rounded grains (pink), crust or ice layer (red), crust and rounded grains (orange) and precipitation particles (green). Snow depth 0 cm is the surface. Time period in x-axel for each layer structure is 2 d.
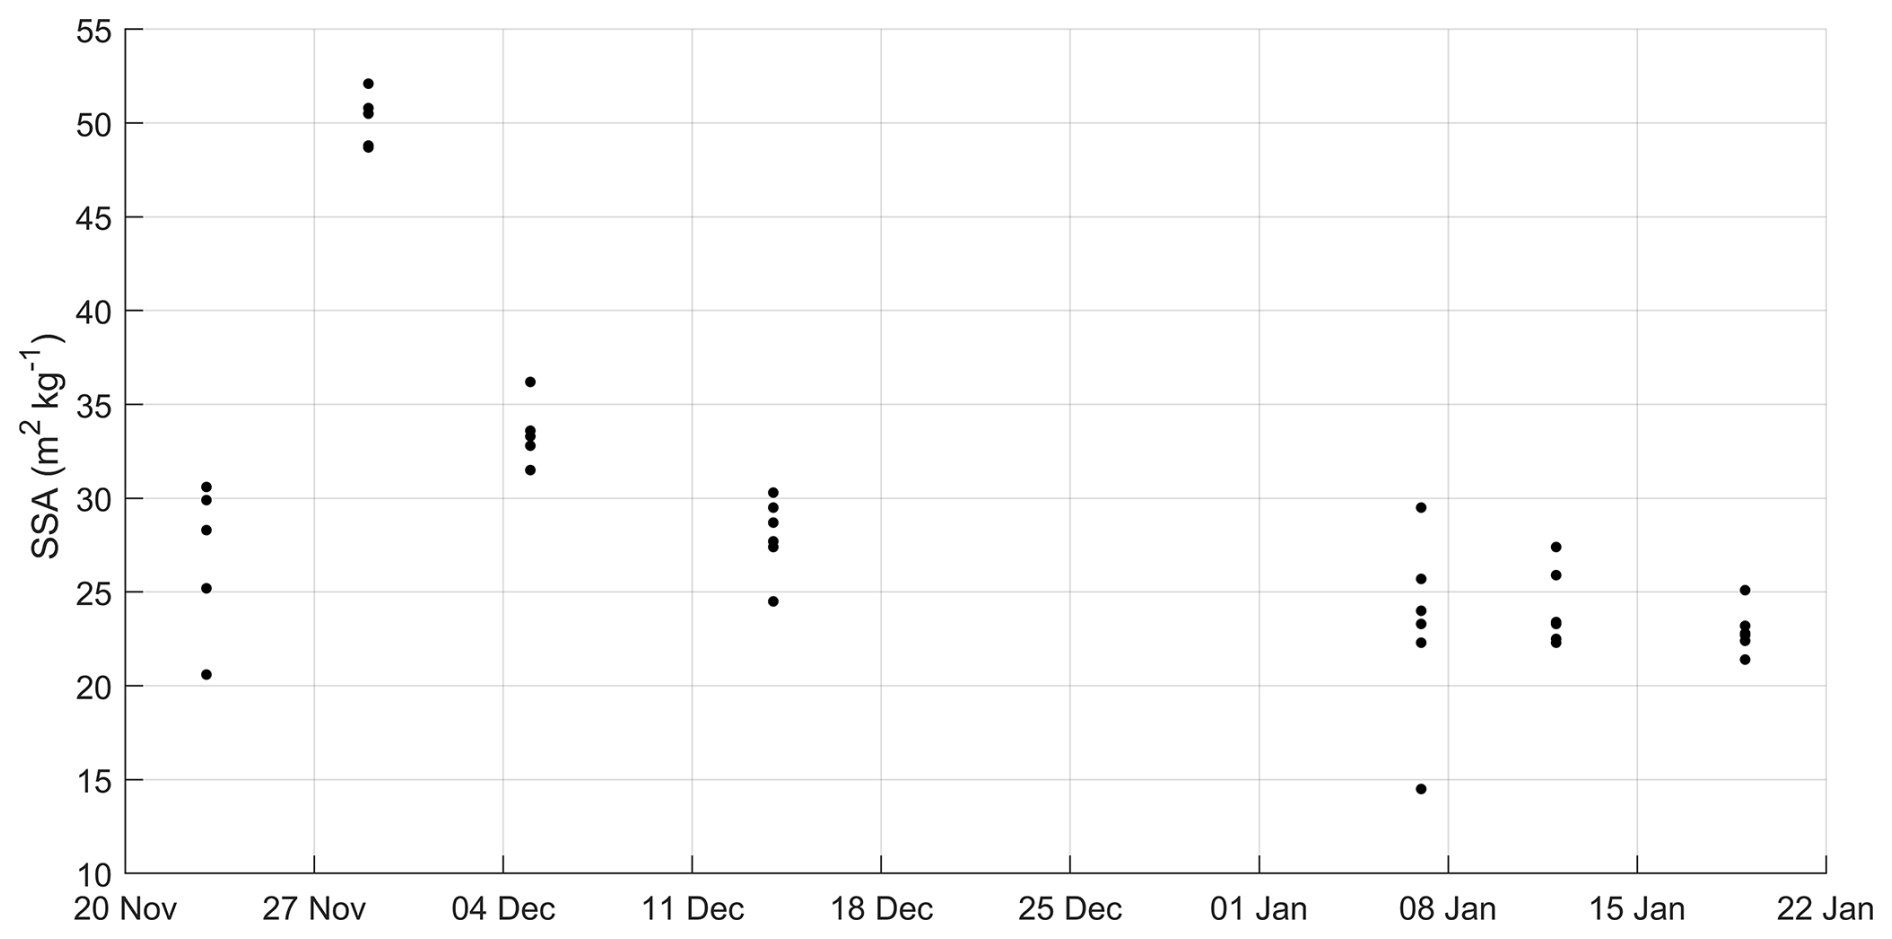
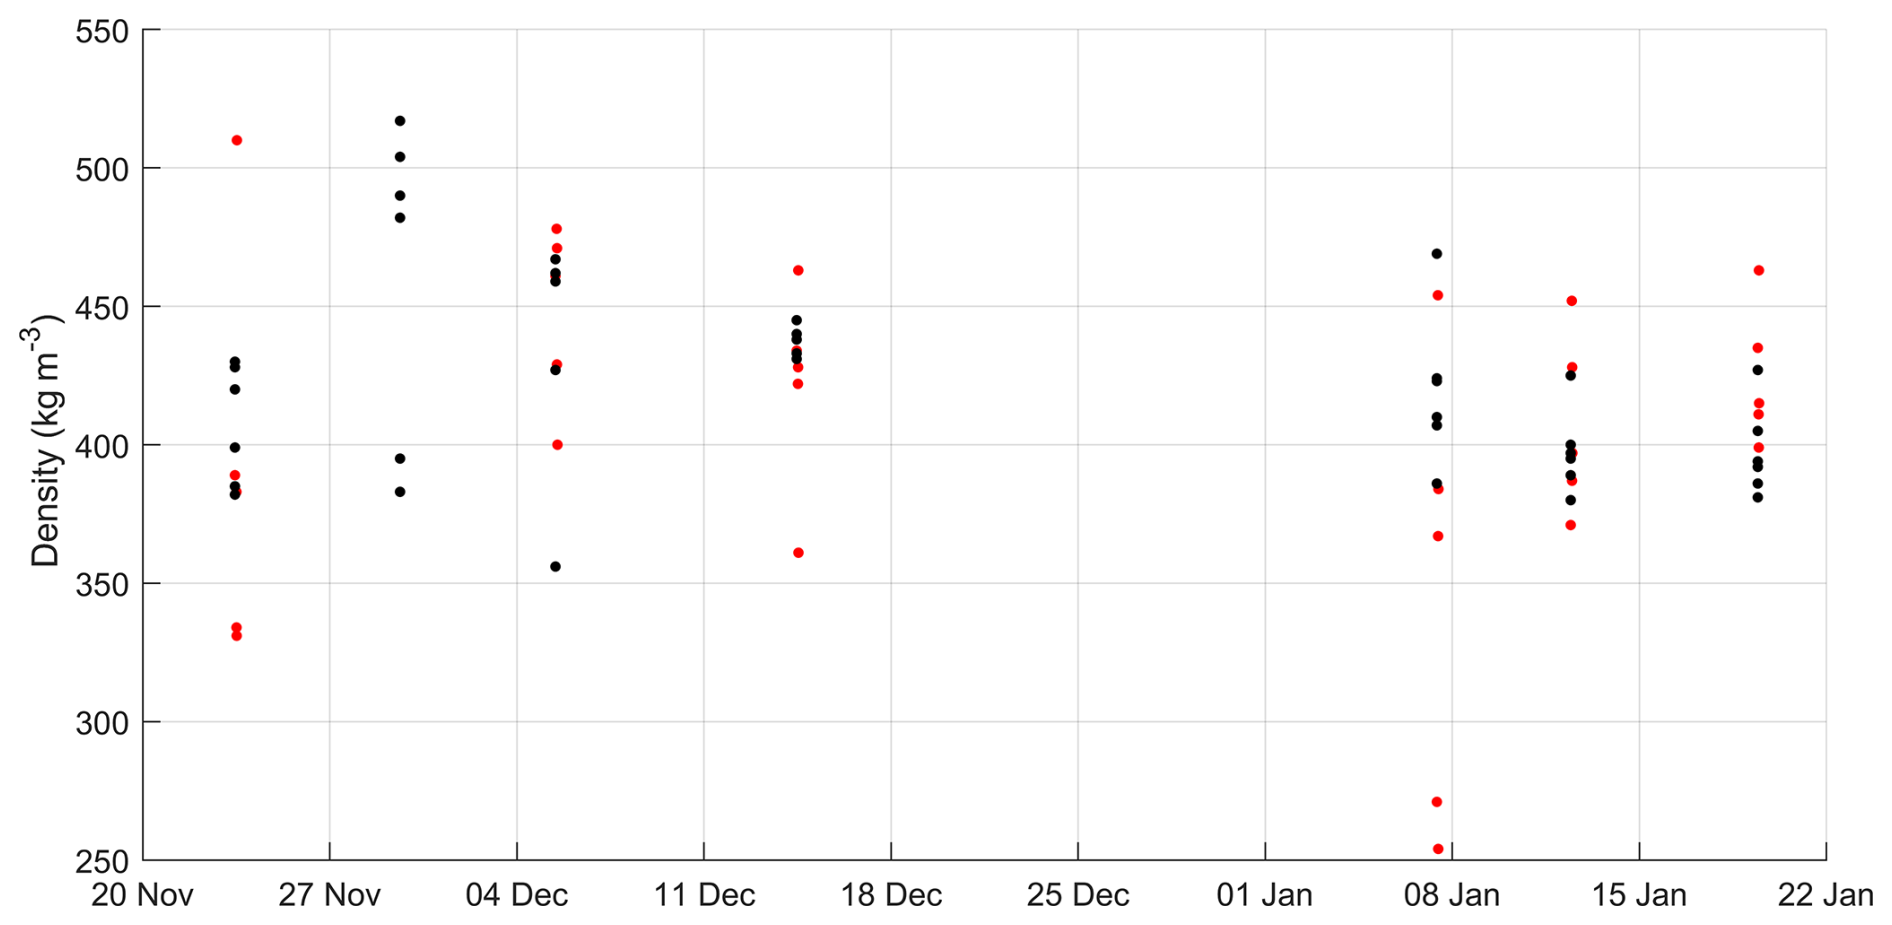
Figure 12Density measured at the snow pit profile every 3 cm (black) and distributed density measurements from the snow surface (red) at the AWS5 site.
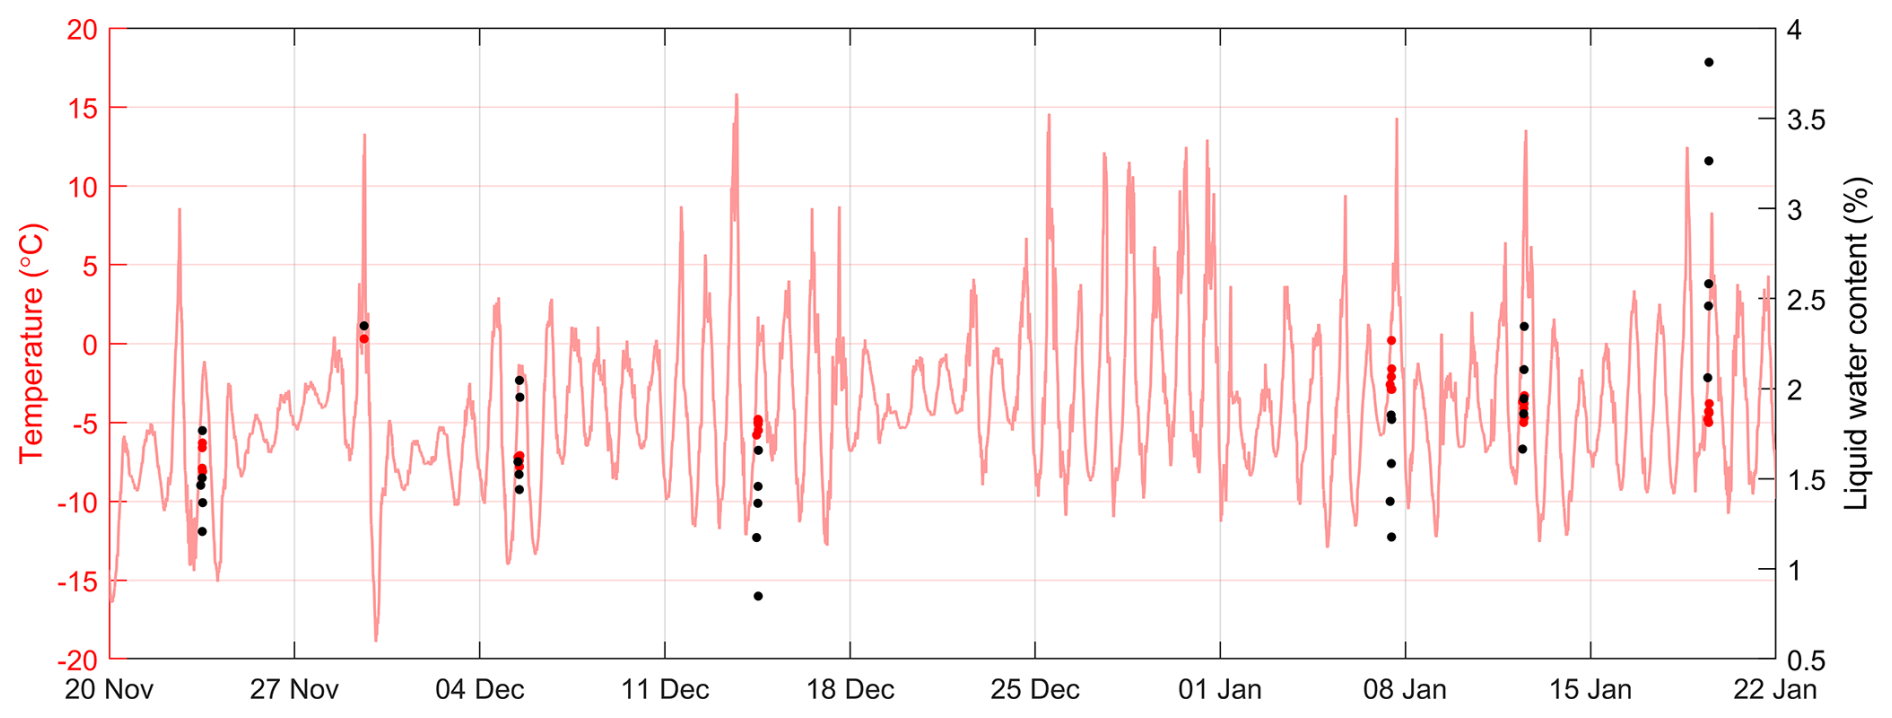
Figure 13Liquid water content from snow surface (black dots), snow surface temperature (red dots) and air temperature (light red solid line) from an automatic weather station at the AWS5 site.
2.6 AWS5 meteorological data
The automatic weather station equipped to continuously monitor key meteorological variables is situated at the AWS5 field site and maintained by FINNARP (Fig. 14). Sensor distance to the snow surface is measured with the SR50A sensor (Campbell Scientific). Air temperature and relative humidity are measured using the HMP110 sensor (Vaisala). Air pressure is measured with the PTB100 sensor (Vaisala) and wind speed is measured using the Heavy Duty Wind Monitor HD-Alpine Model 05108-45 sensor (R&M Young). Surface albedo is determined via upward and downward facing CNR4 pyranometers (Kipp & Zonen). All sensors are mounted on a mast structure. The exact sensor height varies annually due to changes in surface elevation resulting from snow accumulation and ablation. Due to location in the ablation zone, the weather station is lifted regularly keeping the sensors above the snow surface. Air temperature and sensor distance to the snow surface during the field campaign are presented in Fig. 15. Jumps in the sensor distance from the snow surface potentially originate from ice or snow accumulation to the sensor or wind drift to the measured area. If sensor distance from snow surface values has difference to the average of an hour is more than 15 cm, values are filtered out. Other quality control has not been made for the data.
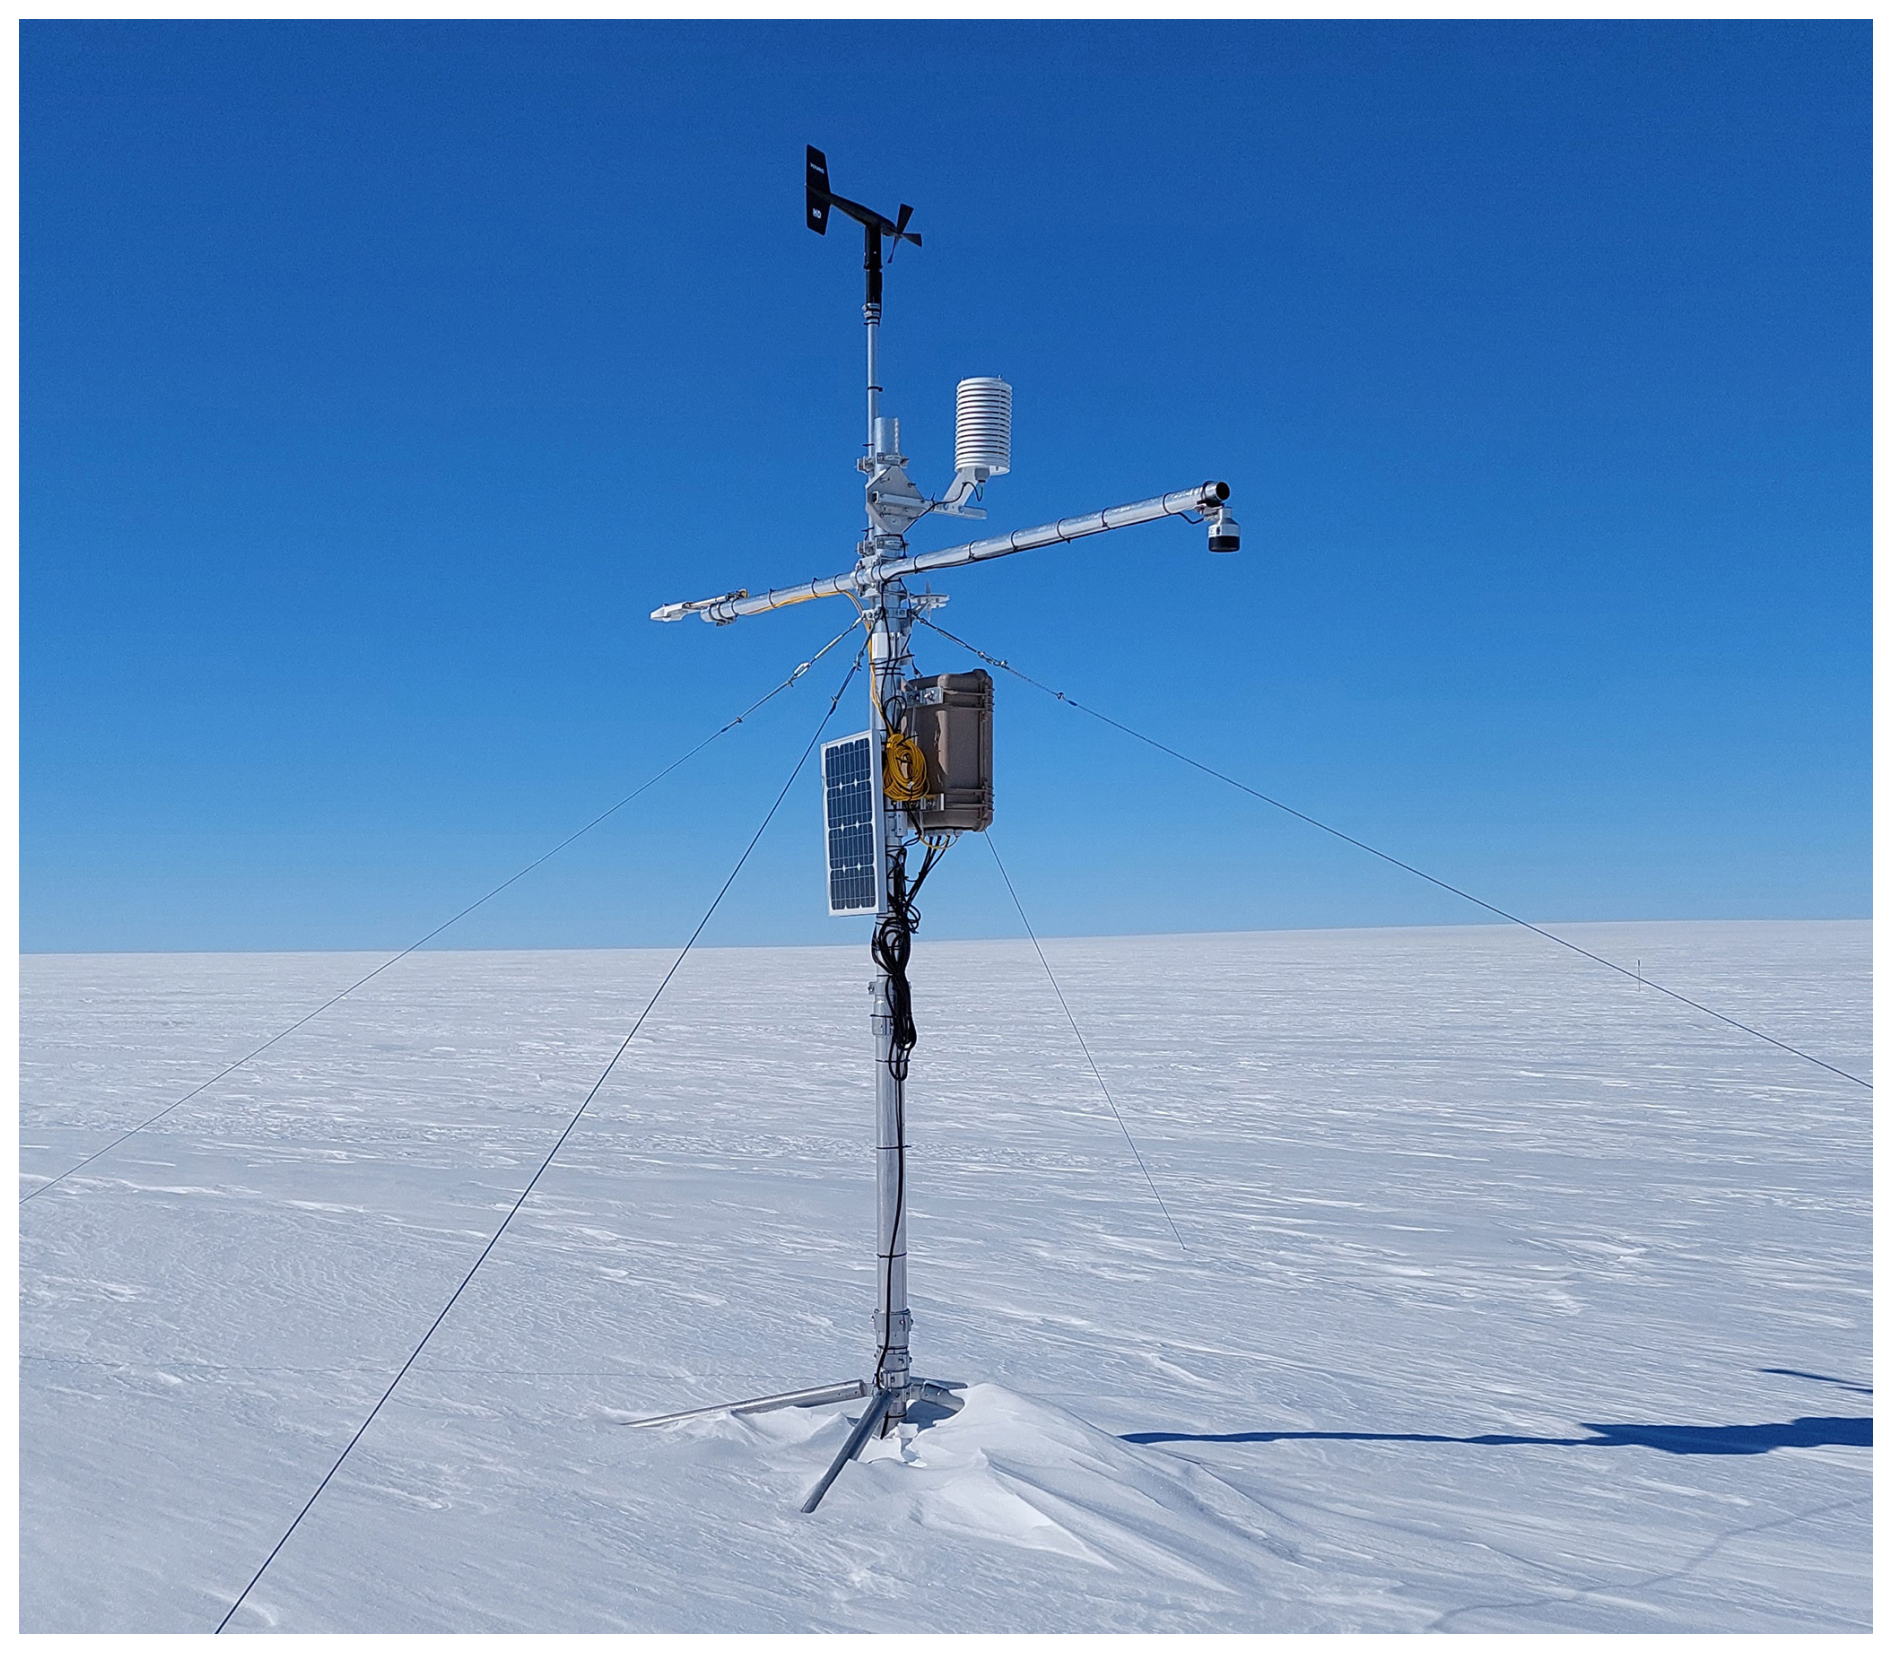
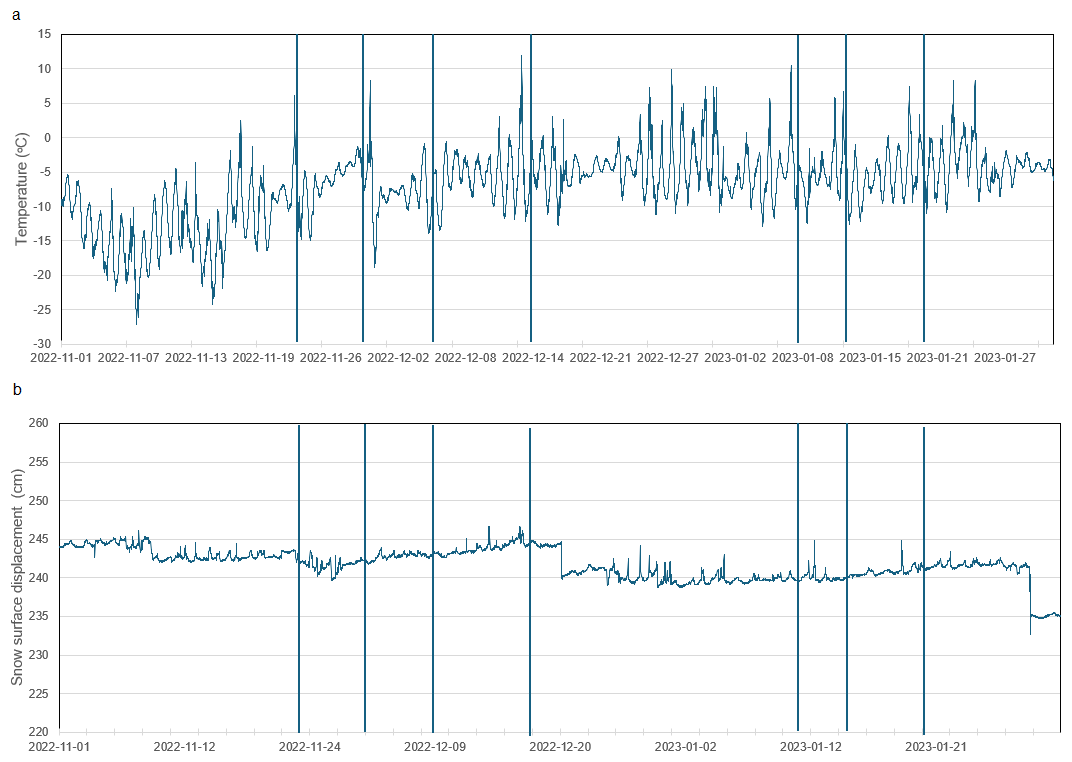
Figure 15(a) Air temperature and (b) sensor distance from snow surface during the season 2022–2023. Measurement days are marked with vertical lines.
2.7 Novel methodological aspects
This study introduced several novel aspects in snow pit measurements and drone-based remote sensing observations that have not previously been applied in the area. The snow pit measurements incorporated advanced instrumentation, including the IceCube, which provides highly accurate determination of SSA, which is a critical parameter for optical studies of snow. Previously, snow pit measurements have involved only one or two points at a time. In this campaign, we expanded the spatial coverage by including five additional surface measurement points within the same area to better capture local variability in snow surface properties. Only the topmost snow layer was analysed, as it exerts the greatest influence on optical measurements and surface roughness characteristics. The spatial extent of the measurements was also significantly broader than in many earlier campaigns, encompassing areas from the Riiser-Larsen shelf-ice to the surroundings of the Basen and Plogen nunataks.
This field campaign marked the first use of drone-based laser scanning in the region, including subsequent point cloud processing of the collected data. The study also presents the first hyperspectral imaging acquired from a drone platform in the area. Furthermore, this campaign demonstrated the successful large-scale application of drone-based pyranometer measurements in the region. The combination of these methods, detailed snow pit measurements using IceCube and SnowFork instruments, together with drone-based laser scanning and optical observations, represents a novel and innovative approach. To our knowledge, no comparable dataset exists elsewhere within Dronning Maud Land, making this study a unique and valuable contribution to the field.
This paper presents a description of a novel data set collected during Antarctic summer 2022–2023 from the AWS5 station site and IceSat-2 and CryoSat-2 overpass locations in the vicinity of Finnish Antarctic station Aboa in Dronning Maud Land. In addition to the long-term automatic weather observations at AWS5 site, the measurement campaign included detailed measurements of snow surface roughness, reflectance, and physical snow properties. Innovative combination of drone-based observations enabled covering extent area with laser scanner, hyperspectral camera and pyranometer. Spatial variability of snow surface properties was measured from five locations in addition to the snow pit. Total eight sets of data were collected from the AWS5 site and 16 data sets in the vicinity of Aboa station in satellite overpass locations. The presented results in this paper are from the AWS5 site, where seasonal snow evolution was monitored. The field campaign provided extensive data set for studying impact of surface roughness derived from the laser scanner data on surface albedo and satellite altimetry -based retrieval of snow elevation. Surface roughness is one of the most important parameters affecting retrieval of satellite data from Antarctica but it is still studied little and typically only over small areas. The collected data can be used for improving satellite observations as well as for understanding better connection between albedo, surface roughness, and physical snow properties.
Snow pit data, AWS5 meteorological data, Eppley and CM14 albedo data, and RGB drone mosaics are available at https://doi.org/10.57707/fmi-b2share.900cf0c74c1c45efb396b910a841bb3c (Leppänen et al., 2025).
LL, AK and AR participated in the field measurements. LL prepared the manuscript with contributions from all co-authors.
The contact author has declared that none of the authors has any competing interests.
Publisher's note: Copernicus Publications remains neutral with regard to jurisdictional claims made in the text, published maps, institutional affiliations, or any other geographical representation in this paper. While Copernicus Publications makes every effort to include appropriate place names, the final responsibility lies with the authors. Views expressed in the text are those of the authors and do not necessarily reflect the views of the publisher.
The authors acknowledge that AI was used to check the language and create some of the plotting codes.
This research has been supported by the Research Council of Finland (grant nos. 335986, 335987, 359249, and 346382), the NextGenerationEU (grant no. 246162), and the EU Horizon 2020 (grant no. 869471).
This paper was edited by Mehrez Zribi and reviewed by two anonymous referees.
Fierz, C., Armstrong, R. L., Durand, Y., Etchevers, P., Greene, E., McClung, D. M., Nishimura, K., Satyawali, P. K., and Sokratov, S. A.: The International Classification for Seasonal Snow on the Ground, IHP-VII Technical Documents in Hydrology No 83, IACS Contribution No 1, UNESCO-IHP, Paris, 2009.
FINNARP: Field operations 2018–2019, https://assets.ctfassets.net/hli0qi7fbbos/3X4EyCfSIaz0v46TQUDG1o/e57a3c4418f558fd295a1619c1ebc705/FINNARP_2018_web.pdf (last access: 30 April 2025), 2019.
Gallet, J.-C., Domine, F., Zender, C. S., and Picard, G.: Measurement of the specific surface area of snow using infrared reflectance in an integrating sphere at 1310 and 1550 nm, The Cryosphere, 3, 167–182, https://doi.org/10.5194/tc-3-167-2009, 2009.
Goodwin, I. D.: Snow-accumulation variability from seasonal surface observations and firn-core stratigraphy, eastern Wilkes Land, Antarctica, J. Glaciol., 37, 383–387, https://doi.org/10.3189/S0022143000005815, 1991.
Ingvander, S., Jansson, P., Brown, I. A., Fujita, S., Sugyama, S., Surdyk, S., Enomoto, H., Hansson, M., and Holmlund, P.: Snow particle sizes and their distributions in Dronning Maud Land, Antarctica, at sample, local and regional scales, Antarctic Science, 28, 219–231, https://doi.org/10.1017/S0954102015000589, 2016.
Isaksson, E. and Karlén, W.: Spatial and temporal patterns in snow accumulation, western Dronning Maud Land, Antarctica, J. Glaciol., 40, 399–409, https://doi.org/10.3189/S0022143000007486, 1994.
Järvinen, O. and Leppäranta, M.: Solar radiation transfer in the surface snow layer in Dronning Maud Land, Antarctica, Polar Science, 7, 1–17, https://doi.org/10.1016/j.polar.2013.03.002, 2013.
Kärkäs, E., Granberg, H. B., Kanto, K., Rasmus, K., Lavoie, C., and Leppäranta, M.: Physical properties of the seasonal snow cover in Dronning Maud Land, East Antarctica, Ann. Glaciol, 34, 89–94, https://doi.org/10.3189/172756402781817554, 2002.
Kärkäs, E., Martma, T., and Sonninen, E.: Physical properties and stratigraphy of surface snow in western Dronning Maud Land, Antarctica, Polar Research, 24, 55–67, https://doi.org/10.3402/polar.v24i1.6253, 2005.
Leppänen, L., Kontu, A., Hannula, H.-R., Sjöblom, H., and Pulliainen, J.: Sodankylä manual snow survey program, Geosci. Instrum. Method. Data Syst., 5, 163–179, https://doi.org/10.5194/gi-5-163-2016, 2016.
Leppänen, L., Kukko, A., Rimali, A., Riihelä, A., and Tisler., P.: LAS3R field campaign, Aboa, Antarctica, 2022-23: Snow pit, AWS5, albedo, RGB drone mosaics, surface roughness and elevation, B2SHARE [data set], https://doi.org/10.57707/fmi-b2share.900cf0c74c1c45efb396b910a841bb3c, 2025.
Mosley-Thompson, E., Kruss, P. D., Thompson, L. G., Pourchet, M., and Grootes, P.: Snow stratigraphic record at South Pole: potential for paleoclimatic reconstruction, Ann. Glaciol., 7, 26–33, https://doi.org/10.3189/S0260305500005863, 1985.
Picard, G. and Libois, Q.: Simulation of snow albedo and solar irradiance profile with the Two-streAm Radiative TransfEr in Snow (TARTES) v2.0 model, Geosci. Model Dev., 17, 8927–8953, https://doi.org/10.5194/gmd-17-8927-2024, 2024.
Picard, G., Libois, Q., Arnaud, L., Verin, G., and Dumont, M.: Development and calibration of an automatic spectral albedometer to estimate near-surface snow SSA time series, The Cryosphere, 10, 1297–1316, https://doi.org/10.5194/tc-10-1297-2016, 2016.
Pirazzini, R., Räisänen, P., Vihma, T., Johansson, M., and Tastula, E.-M.: Measurements and modelling of snow particle size and shortwave infrared albedo over a melting Antarctic ice sheet, The Cryosphere, 9, 2357–2381, https://doi.org/10.5194/tc-9-2357-2015, 2015.
Rasmus, K.: Field measurements of the total and spectral albedo of snow and ice in Dronning Maud Land, Antarctica, Geophysica, 42, 17–34, 2006.
Reijmer, C. H. and Van Den Broeke, M. R.: Temporal and spatial variability of the surface mass balance in Dronning Maud Land, Antarctica, as derived from automatic weather stations, J. Glaciol., 49, 512–520, https://doi.org/10.3189/172756503781830494, 2003.
Sihvola, A. and Tiuri, M.: Snow fork for field determination of the density and wetness profiles of a snow pack, IEEE T. Geosci. Remote, GE-24, 717–721, https://doi.org/10.1109/TGRS.1986.289619, 1986.
Sinisalo, A., Grinsted, A., Moore, J. C., Kärkäs, E., and Pettersson, R.: Snow-accumulation studies in Antarctica with ground-penetrating radar using 50, 100 and 800 MHz antenna frequencies, Ann. Glaciol, 37, 194–198, https://doi.org/10.3189/172756403781815825, 2003.
Vihma, T., Mattila, O.-P., Pirazzini, R., and Johansson, M. M.: Spatial and temporal variability in summer snow pack in Dronning Maud Land, Antarctica, The Cryosphere, 5, 187–201, https://doi.org/10.5194/tc-5-187-2011, 2011.
Zuanon, N.: IceCube, a portable and reliable instruments for snow specific surface area measurement in the field, in: International Snow Science Workshop Grenoble-Chamonix Mont Blance-2013 proceedings, 1020–1023, 2013.