the Creative Commons Attribution 4.0 License.
the Creative Commons Attribution 4.0 License.
 | 05 May 2025
A multiplexing system for quantifying oxygen fractionation factors in closed chambers
Clémence Paul
Clément Piel
Joana Sauze
Olivier Jossoud
Arnaud Dapoigny
Daniele Romanini
Frédéric Prié
Sébastien Devidal
Roxanne Jacob
Alexandru Milcu
Amaëlle Landais
The study of isotopic ratios of atmospheric oxygen in fossilized air trapped in ice core bubbles provides information on variations in the hydrological cycle at low latitudes and productivity in the past. However, to refine these interpretations, it is necessary to better quantify the fractionation of oxygen in biological processes such as photosynthesis and respiration. We set up a system of closed biological chambers in which we studied the evolution of the elemental and isotopic composition of O2 due to biological processes. To easily replicate experiments, we developed a multiplexing system which we describe here. We compared measurements of the elemental and isotopic composition of O2 using two different measurement techniques: optical spectrometry (optical-feedback cavity-enhanced absorption spectroscopy, i.e., OF-CEAS technique), which enables higher temporal resolution and continuous data collection, and isotopic ratio mass spectrometry (IRMS) with a flanged air recovery system, thus validating the data analysis conducted through the OF-CEAS technique. As a first application, we investigated isotopic discrimination during respiration and photosynthesis. We conducted a 5 d experiment using maize (Zea mays L.) as the model species. The 18O discrimination value for maize during dark plant respiration was determined as −17.8 ± 0.9 ‰ by IRMS and −16.1 ± 1.1 ‰ by optical spectrometer. We also found a value attributed to the isotopic discrimination of terrestrial photosynthesis equal to +3.2 ± 2.6 ‰ and by IRMS and +6.7 ± 3.8 ‰ by optical spectrometry. These findings were consistent with a previous study by Paul et al. (2023).
- Article
(4267 KB) - Full-text XML
- BibTeX
- EndNote


Oxygen, the most abundant chemical element on Earth, is present in all the geological layers, both internally and externally. In the surface layers of the Earth (atmosphere, biosphere, ocean), it is produced from water through the well-known biological process of photosynthesis. Consumption of O2 is mainly due to respiration. The photosynthesis and respiration fluxes are responsible for the seasonal variations in dioxygen concentration in the atmosphere (Keeling and Shertz, 1992) and play a role in the longer-term evolution of O2 (Stolper et al., 2016). Oxygen consists of three stable isotopes: 16O, 17O, and 18O. By measuring the ratios of these isotopes, we can document the physicochemical and biological processes involved in the oxygen cycle. We use the δ18O notation to express the isotopic signal of oxygen compared to a reference isotopic ratio (Eq. 1):
Oxygen isotopes do not have the same thermodynamic properties. Thus, during phase changes, fractionation occurs and is measured by the fractionation factor α (Eq. 2):
where 18R is the ratio of the concentration and n is the number of moles of O2 containing 18O or 16O.
The isotopic discrimination is related to the isotopic fractionation factor through
The isotopic composition of dioxygen in the atmosphere, δ18O of O2 in air, is often noted as δ18Oatm. This signal, measured in the air bubbles in ice cores, can be used for ice core dating, related to the past variations in the hydrological cycle of water in the low latitudes and the relative proportion of oceanic vs. terrestrial productivity. Firstly, using the analyses of isotopic composition of dioxygen in the air trapped in ice cores, Bender et al. (1994) demonstrated that δ18Oatm varies synchronously with precession, a discovery that has been instrumental in using this proxy for dating ice cores (Petit et al., 1999; Dreyfus et al., 2007). This influence of precession on δ18Oatm is possibly due to changes in the low-latitude hydrological cycle driven by precession (Bender et al., 1994; Severinghaus et al., 2009; Landais et al., 2010; Seltzer et al., 2017). Such variations in the low-latitude hydrological cycle influence the δ18O of meteoric water, which is then transmitted to the δ18Oatm through terrestrial photosynthesis. Supporting this, over the past 650 000 years, δ18Oatm has shown a strong correlation with δ18Ocalcite variations in eastern Asian speleothems (Wang et al., 2008; Cheng et al., 2016), which are largely controlled by shifts in the low-latitude water cycle, particularly monsoonal activity.
The interpretation of δ18Oatm as an indicator for reconstructing oceanic and terrestrial productivity relies on the definition of the Dole effect (DE), calculated as the difference between δ18Oatm and δ18Osw (sw referring to seawater). The present Dole effect has a value which is estimated at 24 ‰ (Bender et al., 1994; Hoffmann et al., 2004; Luz and Barkan, 2011).
Bender et al. (1994), Malaizé et al. (1999), and Hoffmann et al. (2004) proposed that changes in the Dole effect are driven by the relative contribution of terrestrial and oceanic productivity. This conclusion arises from the fact that the terrestrial Dole effect defined as the enrichment of atmospheric O2δ18O relative to δ18Osw due to terrestrial biosphere fluxes is estimated to be several parts per thousand higher than the oceanic Dole effect, which results from oceanic biosphere fluxes. This conclusion is based on the available determinations of O2 fractionation coefficients associated with biological processes, including terrestrial and oceanic respiration and photosynthesis (Guy et al., 1993; Angert et al., 2001; Hendricks et al., 2004; Helman et al., 2005). In contrast, Luz and Barkan (2011) used updated estimates of O2 fractionation coefficients and arrived at a different conclusion: both the terrestrial and oceanic Dole effects are approximately 24 ‰. It is thus of primary importance to determine robust values of fractionation coefficients of O2 during biological processes.
Previous studies conducted over previous decades at the cell or organism level (Guy et al., 1993; Angert et al., 2001; Helman et al., 2005; Eisenstadt et al., 2010; Stolper et al., 2018) have already revealed variations in oxygen fractionation among different biological species and methods employed. Guy et al. (1993) conducted investigations on spinach thylakoids, cyanobacteria (Anacystis nidulans), and diatoms (Phaeodactylum tricornutum) and estimated a respiratory discrimination of oxygen by about 21 ‰. Kroopnick and Craig (1972) measured this effect on plankton incubated in natural seawater and obtained a similar value. Luz and Barkan (2002) found a respiratory fractionation of 21.6 ‰ on incubation experiments with natural plankton in Lake Kinneret. Finally, the global average oceanic respiratory fractionation value given by Luz and Barkan (2011) is 19.7 ‰ on samples from the Celtic Sea, the Southern Ocean, the North Atlantic, and the Red Sea. For terrestrial respiration, using a compilation of values from previous experiments, Bender et al. (1994) gave a global respiratory fractionation value of 18 ‰. Angert et al. (2001) focused on soil samples and gave a soil respiratory fractionation (roots and micro-organisms) of around 12 ‰. This lower value is the result of the role of roots in limiting oxygen diffusion in the consumption site.
Guy et al. (1993) showed that photosynthesis does not fractionate oxygen between the water consumed and the dioxygen produced by the organism. However, Eisenstadt et al. (2010) later found a discrimination of up to 6 ‰ for oceanic photosynthesis on a study on oceanic phytoplankton, whereas Paul et al. (2023) found a discrimination of 3.7±1.3 ‰ for terrestrial photosynthesis with an experiment performed at the scale of a terrarium with Festuca arundinacea. Such different contributions lead to different interpretation of past variations in δ18Oatm or the Dole effect.
The variety of values found for the different studies can be attributed to the different setup used, the different environment, or the different species. To determine robust values of fractionation coefficients, it is necessary to proceed in a systematic way and use the same setup for a large variety of plants and environments, which is the goal of the setup detailed in this study.
Finally, note that the isotopic composition of O2 can be used to quantify global biosphere productivity (Bender et al., 1994; Luz et al., 1999; Severinghaus et al., 2009; Brandon et al., 2020; Yang et al., 2022). Such reconstruction relies on the observation that biological productivity processes (respiration and photosynthesis) fractionate oxygen in a mass-dependent manner (i.e., there is a consistent relationship between changes in δ17O and δ18O, approximately equal to 0.5), while dioxygen originating from exchanges with the stratosphere has an isotopic composition affected by mass-independent fractionation (hence a relationship between changes in δ17O and δ18O significantly different from 0.5, i.e., between 1 and 2). The relative proportion of biosphere productivity vs. stratospheric exchange fluxes sets the value of the relationship between δ17O vs. δ18O in the troposphere, which is often described as (Luz et al., 1999). In parallel, the same parameter Δ17O measured in the air dissolved in the ocean permits to constrain the gross biosphere productivity when combined with the concentration of O2 measured as the ratio (Luz and Barkan, 2000).
Although our system can in theory enable the determination of the triple isotopic composition of O2 (through IRMS, isotopic ratio mass spectrometry), we will focus on δ18O of O2 in the present study. We thus concentrate on the fractionation coefficients needed to interpret δ18Oatm records only.
In this study, we present an automated setup which can be used to perform numerous systematic studies of the fractionation factor of oxygen during biological processes. Similarly to the study of Paul et al. (2023), we used closed growth chambers to quantify oxygen fractionation factors associated with the respiration and photosynthesis of Festuca arundinacea. The novelty is that we worked with up to three closed chambers simultaneously in an automated way, which allows an exploration of numerous different plant species and climatic conditions. Moreover, the isotopic analyses are now performed with an optical spectrometer (optical-feedback cavity-enhanced absorption spectroscopy, i.e. OF-CEAS technique) in addition to IRMS. This spectrometer allows us to study the concentration and the isotopic composition of O2 in the different chambers in a continuous way.
This paper is organized as follows. Firstly, we will present new developments on closed biological chambers compared to the study of Paul et al. (2023) and on the multiplexing system integrating continuous measurements of elemental and isotopic composition of O2. Then, we will present the results of a biological experiment where photosynthesis and respiration took place. Finally, we will provide an estimate of fractionation factors through two analytical techniques: optical spectrometry and IRMS.
2.1 Growth chamber and closed system
A set of three airtight transparent welded polycarbonate chambers (120 L volume) was adapted from the chamber described in Paul et al. (2023) and Milcu et al. (2013). The main controlled environmental parameters inside the closed chambers were temperature, light intensity, CO2 concentration, relative humidity, and differential pressure.
The CO2 mixing ratio during the light period (dominated by photosynthesis) was regulated with short (30 s) pulses of pure CO2 provided at regular intervals (90 s for a sequence with three chambers) to each chamber using a mass flow controller (F-200CV, Bronkhorst, the Netherlands) and a Valco selector (EUTF-SD12MWE, VICI AG International, Switzerland). During the dark period (dominated by plant and soil respiration), the CO2 was trapped through a 0.5 L cylinder filled with soda lime and was connected to a NMS020B KNF micropump.
Unlike the system described in Paul et al. (2023) (Fig. 1), relative humidity in each chamber was controlled using a thermoelectric cooler (100 W, ET-161-12-08-E Adaptive). The cooled side of the cooler was in thermal contact with an aluminum rod (1.5 cm diameter) connected to a heat exchanger acting as a condenser inside the chamber. The temperature of the condenser block was monitored with a thermistor, and the condensed water was directed to the plastic tray containing the plant using an 8 mm plastic tube.
Each chamber was used as a closed gas exchange system and placed in a separate controlled environment growth chamber in the Microcosms experimental platform of the Montpellier European Ecotron. The temperature of the growth chamber was automatically adjusted in order to keep the temperature constant at 20 °C inside the closed chamber (growth chamber usually set between 20 and 21 °C during the dark period and around 18 °C during the light period because of the greenhouse effect in the chamber). Air and soil temperature were monitored using four NTC probes (CTN 35, Carel). Air relative humidity and temperature were monitored with a capacitive humidity sensor and a PT100 (PFmini72, Michell Instruments, USA). The air CO2 mixing ratio was monitored using a K30 probe (K30, Senseair).
To find potential leaks in each chamber, helium tests were performed before each experiment.
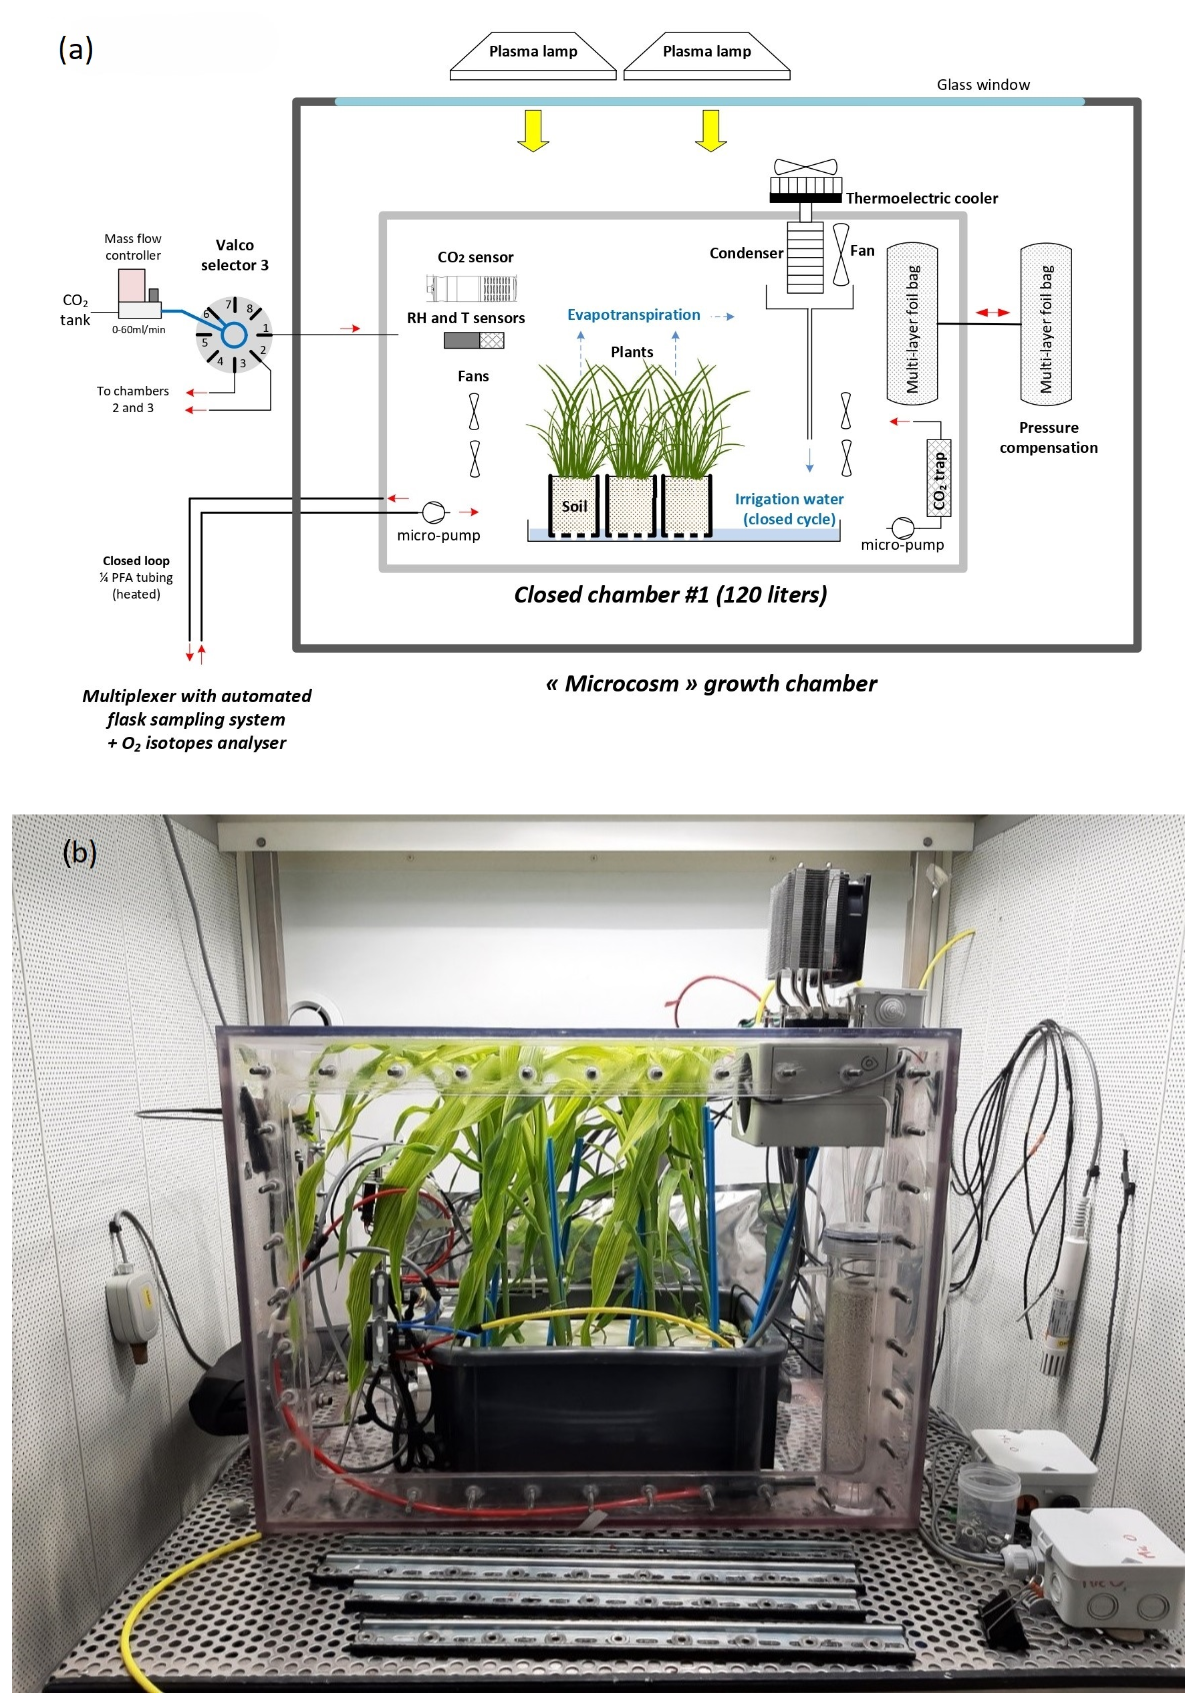
Figure 1The setup of the closed chamber system hosting a vegetation–soil–atmosphere analogue of the terrestrial biosphere. (a) Schematic of the closed chamber setup used for the terrestrial biosphere model. The closed chamber was enclosed in a larger growth chamber. The main environmental parameters inside the closed chamber were actively controlled and monitored: temperature (T), light intensity, CO2, relative humidity (RH), and pressure differential (ΔP). The water cycle in the closed chamber is shown in blue. (b) Photograph of the closed chamber used in the experiment with Zea mays.
2.2 Multiplexing system
With this setup, we continuously measured the isotopic composition of O2 using an online optical spectroscopy instrument, hereafter the isotopic analyzer. For each chamber, air circulated through two external closed loops connected by a tee. The first loop is made of 1/8-in. (0.3175 cm) PFA tubing and used a Valco selector (12 positions 1/8 in., EUTF-SD12MWE, VICI AG International, Switzerland) to enable the air to circulate from one closed chamber through the isotopic analyzer and back to the closed chamber (Fig. 2). The Valco valve selected the origin of the air to be sent to the isotopic analyzer. Five different origins can be selected (but more can be added): three different closed system chambers and two reference gases ((1) dried atmospheric air (with a magnesium perchlorate trap); (2) synthetic air (ALPHAGAZ 2, Air Liquide, France) or dry natural air with 23 % O2 (Natural Air, Air Liquide, Spain)). Air at the entrance of the isotopic analyzer was dried with a 20 cm long trap (6 mm PFA tube filled with magnesium perchlorate, renewed daily) and filtered (Millex-FH 0.45 µm 50 mm−1 PTFE hydrophobic filter, Merck, Germany).
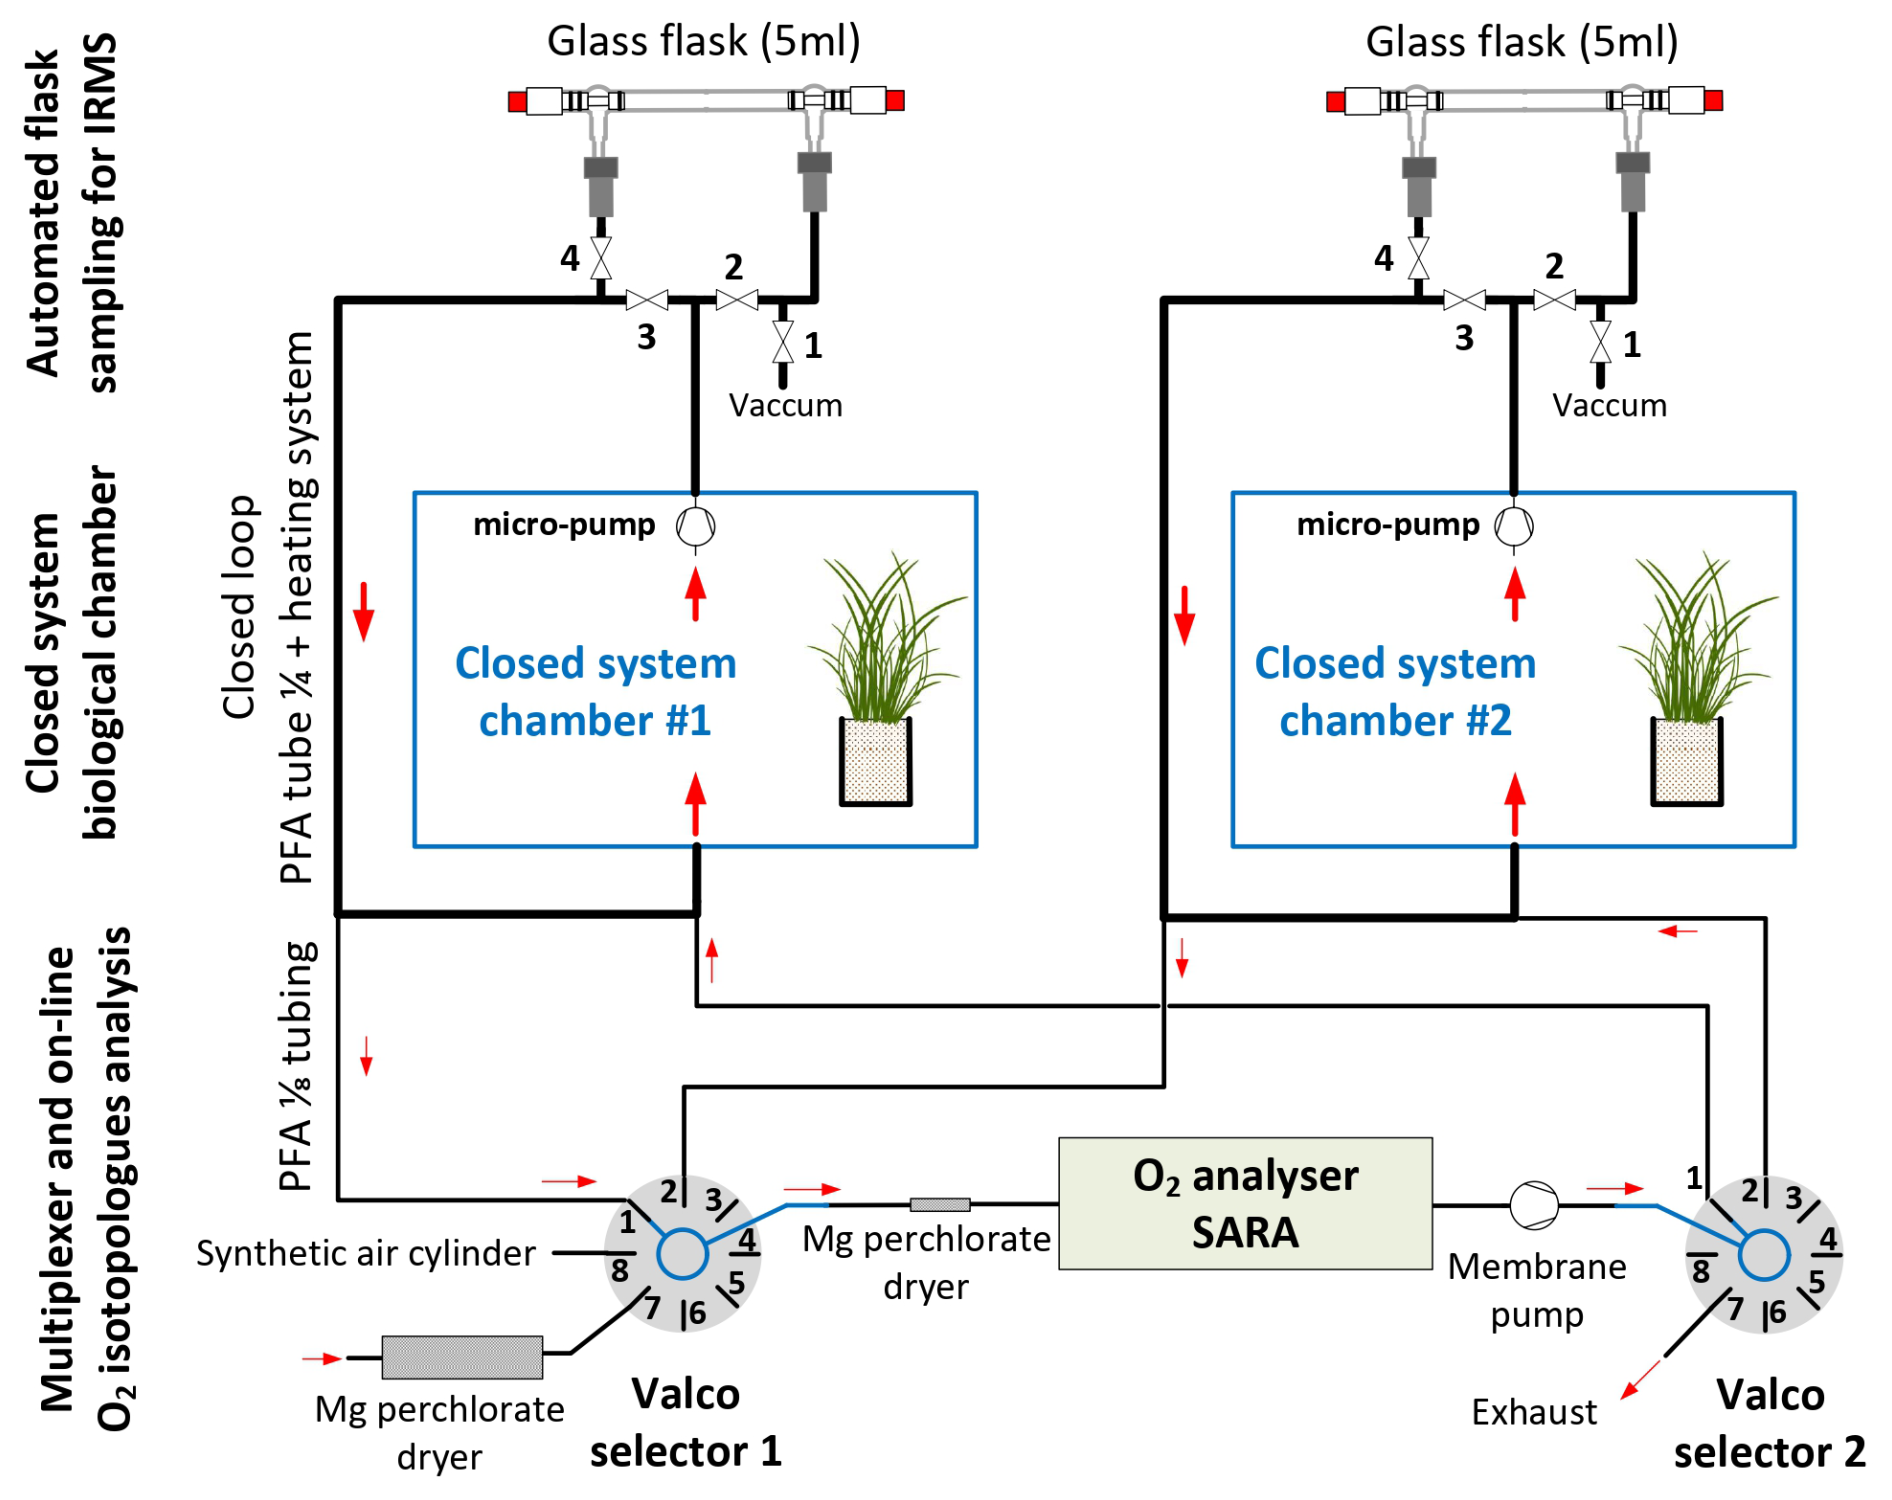
Figure 2Diagram of the multiplexing system: the enclosed atmosphere of three biological system chambers circulates through automated flask sampling systems using loops employing 1/4” PFA tubing and micropumps. Subsequently, air from these loops is sub-sampled using 1/8-inch PFA tubes and Valco selectors and analyzed with an isotope analyzer.
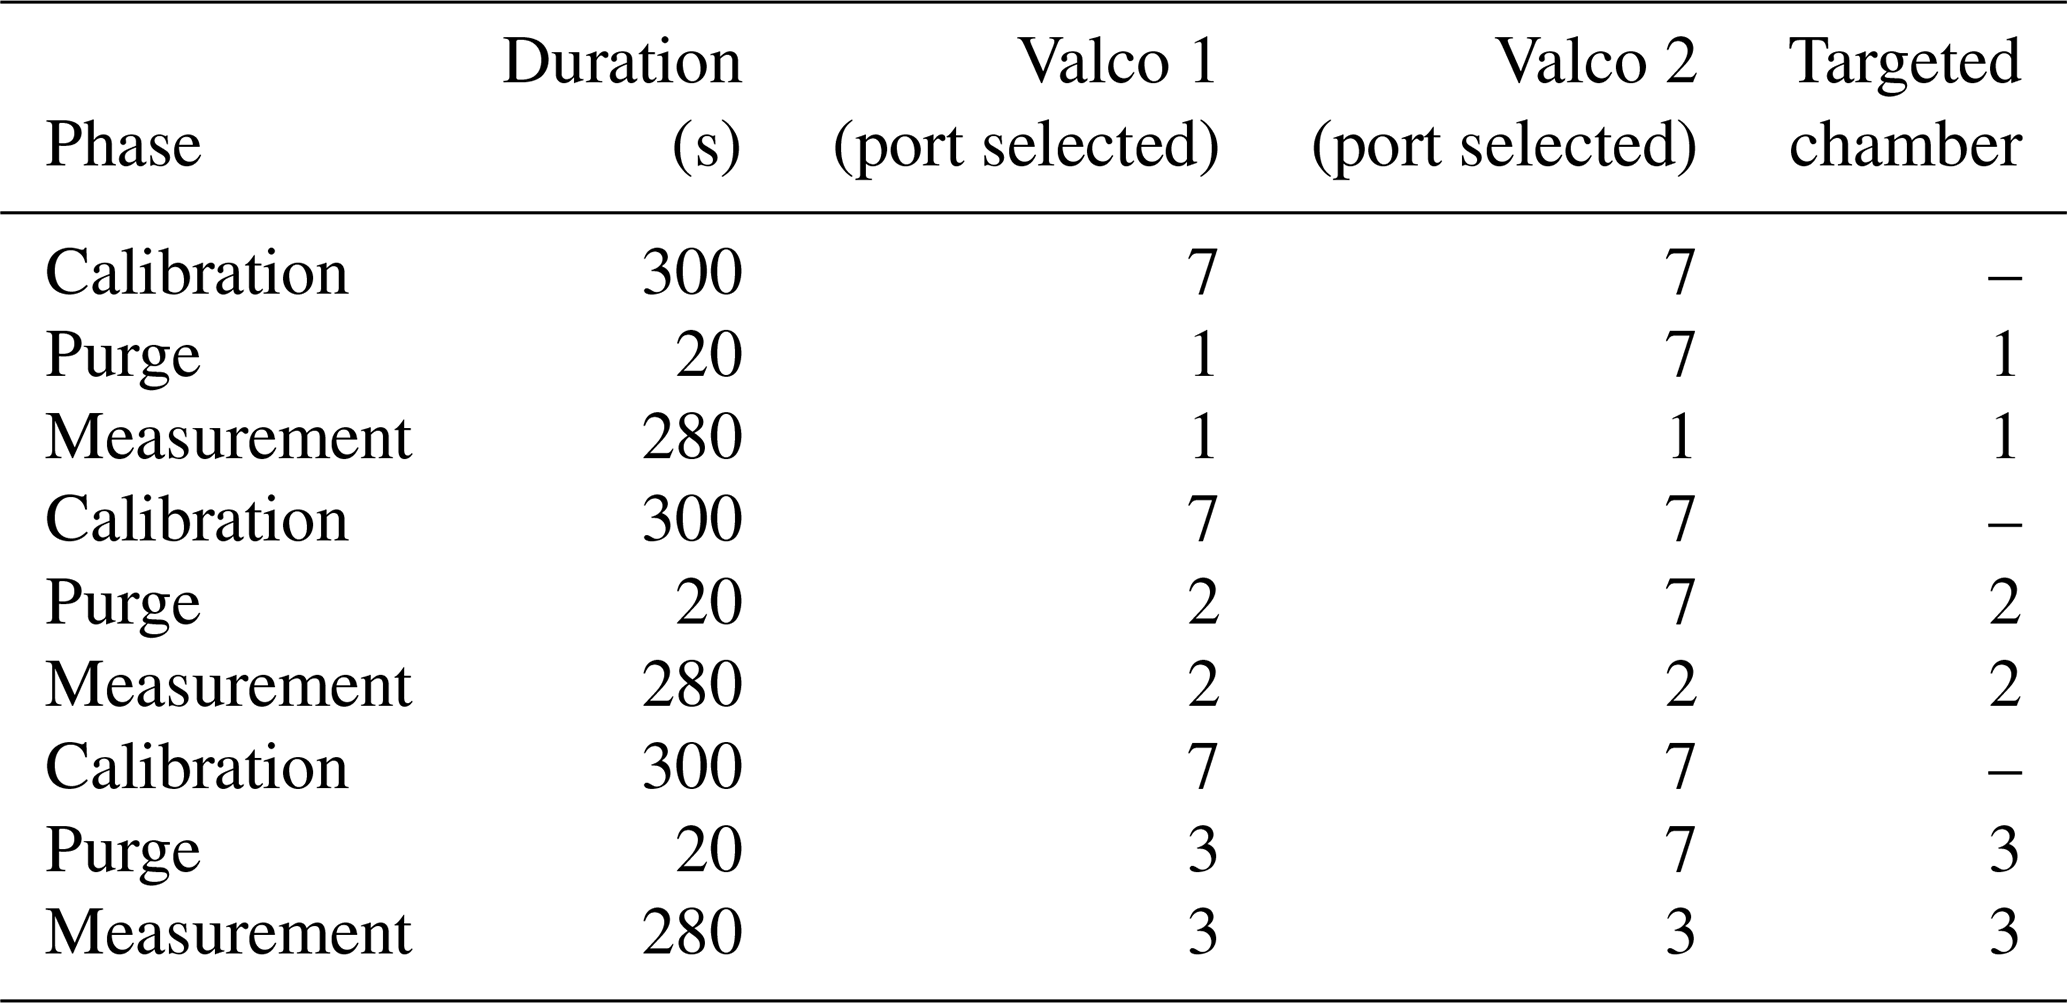
Once analyzed, the air stream entered a membrane pump (N811KN.18, KNF, Germany) and, subsequently, the common port of a second Valco selector (12 positions 1/8 inch, EUTF-SD12MWE, VICI AG International, Switzerland). The air was then either redirected to its chamber of origin (closed circuit) or vented outside of the chamber through an exhaust port for the calibration gases. The multiplexer composed of two Valco valves ensures three functions: (1) “calibration”, where dried ambient air or synthetic air is provided to the spectrometer and the outlet is vented to the atmosphere; (2) “purge”, where the remaining air still present inside the spectrometer is vented to the atmosphere, until it is fully replaced by the new stream of air (in order to avoid cross-contamination of the air between chambers or contamination of a given chamber with the calibration stream); and (3) “measurement”, where the air sub-sampled from a given chamber flows through the spectrometer and then back to the chamber. A typical sequence is described in Table 1.
Table 1Typical measurement sequence with the optical spectrometer. Note that a small amount (around 5 mL) of air sampled from the chamber is wasted (Valco 2 exhausts to atmosphere) during the purging phase.
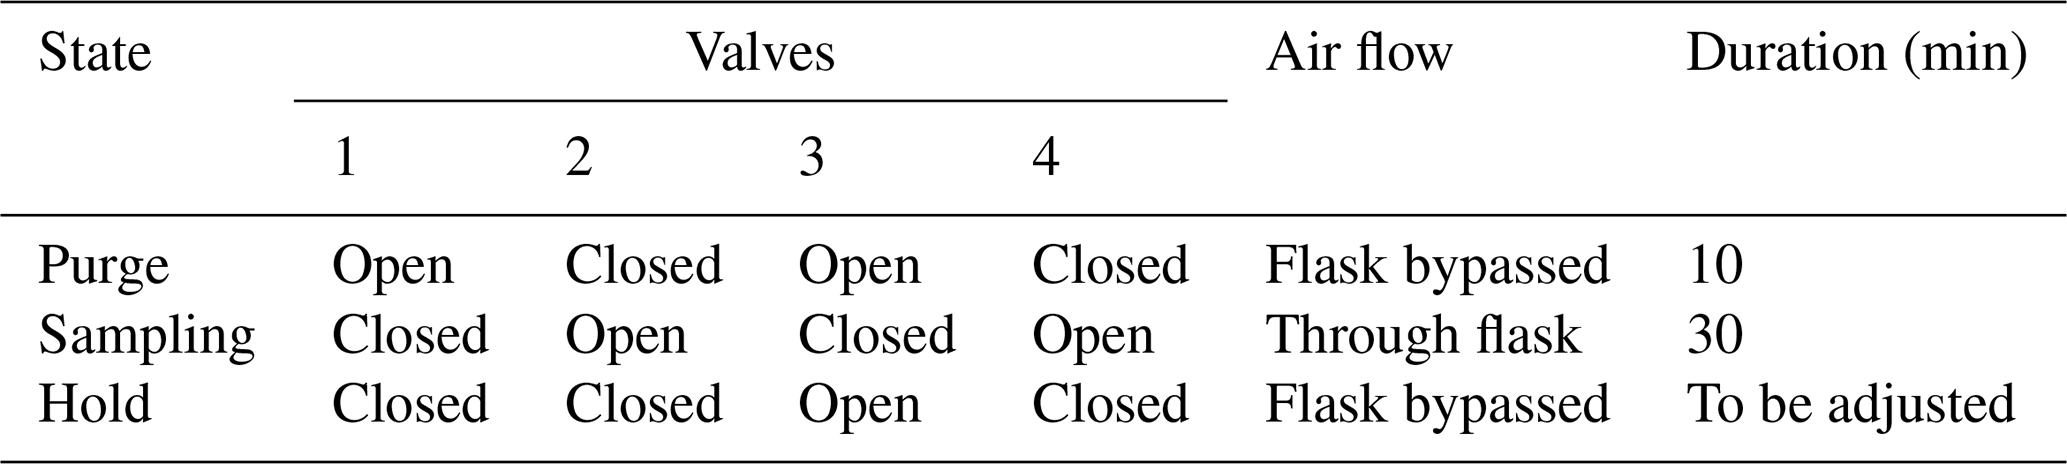
The second loop, used in parallel to the first one described above, is dedicated to the sampling of air for further analysis by IRMS, as already done in Paul et al. (2023) (Fig. 2). Air sampled from each chamber circulated continuously in a closed loop (PFA tubing, 1/4-inch, total length between 5 and 10 m depending on the chamber location relative to the measurement system) using a micropump with a flow rate of approximatively 1 L min−1 (NMS020B, KNF, Germany), through an automated flask sampling system. All tubes were heated using self-regulating heating cable (15 W m−1, Technitrace, France), and the sampling system was located in a temperature-regulated enclosure (25 to 30 °C). The sampling system was made of two three-way pneumatic valves for each chamber (M8.1 VBV, Rotarex) connected to a glass flask (5 mL, as described in Paul et al., 2023) with two Ultra-Torr fittings (SS-4-UT-9, Swagelok, USA) and ensured three functions as described in Table 1: (1) “purge”, where the flask is isolated from the closed loop and connected to a vacuum pump (1 to 5 mbar); (2) “sampling”, where the air from the loop flows through the sampling flask and back to the loop; and (3) “hold”, where the flask is isolated from the closed loop in order to be manually closed and collected. During a typical sequence, each flask was evacuated (“purge”) for 10 min, then the “sampling” was activated for at least 30 min, and “hold” was triggered at a time selected by the user using a computer-controlled system (Table 2).
2.2.1 Description of control commands
The control software was developed using open-source Python libraries (PyQt5 for the GUI) and homemade drivers to interact with the various elements (valves, sensors, regulators, etc.) through serial connections. It included a user interface displaying the state of relevant components and the value of the different sensors. The software had three main functions:
-
controlling the chamber's CO2 injection rate. The desired CO2 rate target can be set and the automatic regulation can be turned on or off using the graphical user interface (GUI). The CO2 trap state and the CO2 injection flow rate were also displayed. Real-time plots showed the CO2 in parts per million (ppm) of each chamber for quick and easy visual control.
-
controlling the flow path of the optical spectrometry analyzer, by sending commands to the upstream and downstream valves. A sequencer can be used to define how long and in which order the chambers or calibration gases should be measured by the optical spectrometer.
-
controlling the flask sampling. This part controls the pneumatic valves which create the flow path for purging, filling, or holding the content of the flask. The duration of the purge and the absolute timestamp of the sampling can be set individually for each chamber, for automatic sampling, while manual operation is still possible.
Furthermore, the control software retrieved concentration data from the optical spectrometer via an Ethernet connection and merged it with the flow path data into a unified, time-consistent file for convenient future analysis.
2.2.2 Mass spectrometry and optical spectrometry analyses
Mass spectrometry analysis technique
In order to be able to compare the evolutions of δ18O of O2 and δO2N2 measured by the mass spectrometer and the optical spectrometer during light and dark periods, we collected the air in the chamber via the flask sampling system during one dark period (night 1) and one light period (day 2). We collected six flasks for the dark period and five flasks for the light period.
The air sampled by the flask system of the second loop was transported to LSCE. The air collected was purified by a semi-automatic separation line (Capron et al., 2010) and analyzed by a Delta V Plus dual-inlet mass spectrometer (Thermo Fisher Scientific). One run consists of two series of 16 measurements for each sample and measures the isotopic composition of the air: δ18O of O2 and δO2N2 (Extier et al., 2018).
Optical spectrometry analysis (OF-CEAS technique)
The description of the OF-CEAS instrument is detailed in Piel et al. (2024). The spectrometer measured δ18O of O2 and the O2 mixing ratio simultaneously. In our case, because of an experimental problem during the experiment, the instrument worked with a slightly deteriorated precision. Liquid water entered the instrument due to condensation in the piping connected to the instrument.
In order to estimate the instrument overall precision versus raw measurement integration time, we used Allan deviation, which is the square root of Allan variance (Werle, 2011). The minimum of the curve can be interpreted as the best precision the instrument can achieve and the optimum integration time. In our case (Fig. 3), the best precision was 0.08 ‰ and 22 ppm for δ18O and the O2 mixing ratio, respectively, with an optimum integration time of 10 min. Furthermore, the δ18O of O2 level remains consistently below 0.1 ‰ for a duration of 20 min. Based on this trend, we can infer that calibrating the instrument every 20 min would prevent any drift-related issues.
For our sequence of measurements, we choose two calibration gases: the atmospheric air, which is the reference gas, and a synthetic gas, which had an isotopic signature of −60 ‰ for the δ18O of O2 and an O2 concentration of 23 %. The sequence of measurements experiments was then 6 min of measurement of synthetic air, 6 min of measurement of atmospheric air, and 6 min of measurement of air in the chamber. This sequence was then applied to each of the three chambers, and a full sequence lasted 18 min (Fig. 4).
We had a clear memory effect when switching from one gas to another (Fig. 4). As a consequence, we removed the data of the first 2 min before averaging the measurements over the last 4 min (the instrument provided measurements at a frequency of 3 Hz) to obtain one averaged value. Finally, there was a dependence of δ18O of O2 on the concentration of O2 for the spectrometry analyzer, and, for this study, the correction for the influence of O2 concentration on δ18O of O2 is given by δ18Ocorr=δ18Omeasured – (0.3736× [O2] + 0.0165) (details in Piel et al., 2024).
2.2.3 Experimental run
We present here the results of one experiment performed on growing maize (Zea mays L.) on a typical compost soil (Terreau universel, Botanic, France. Composition: black and blond peat, wood fiber, green compost and vermicompost manure, organic and organo-mineral fertilizers, and micronutrient fertilizers) in three closed chambers in parallel. The experiment lasted 5 d, with alternating dark and light periods as follows: day 1 (6 h light) and night 1 (37 h dark), day 2 (6 h light) and night 2 (56 h dark), and day 3 (10 h light). The dark periods were imposed to be longer than the light periods because the production rate of oxygen during photosynthesis was much stronger than the consumption rate of oxygen by respiration. Maize was chosen as the preferred option, as it is a C4 model plant and enables photosynthetic fluxes to be clearly differentiated from respiratory fluxes (no photorespiration for C4 plants), so biological fractionation factors can be calculated easily.
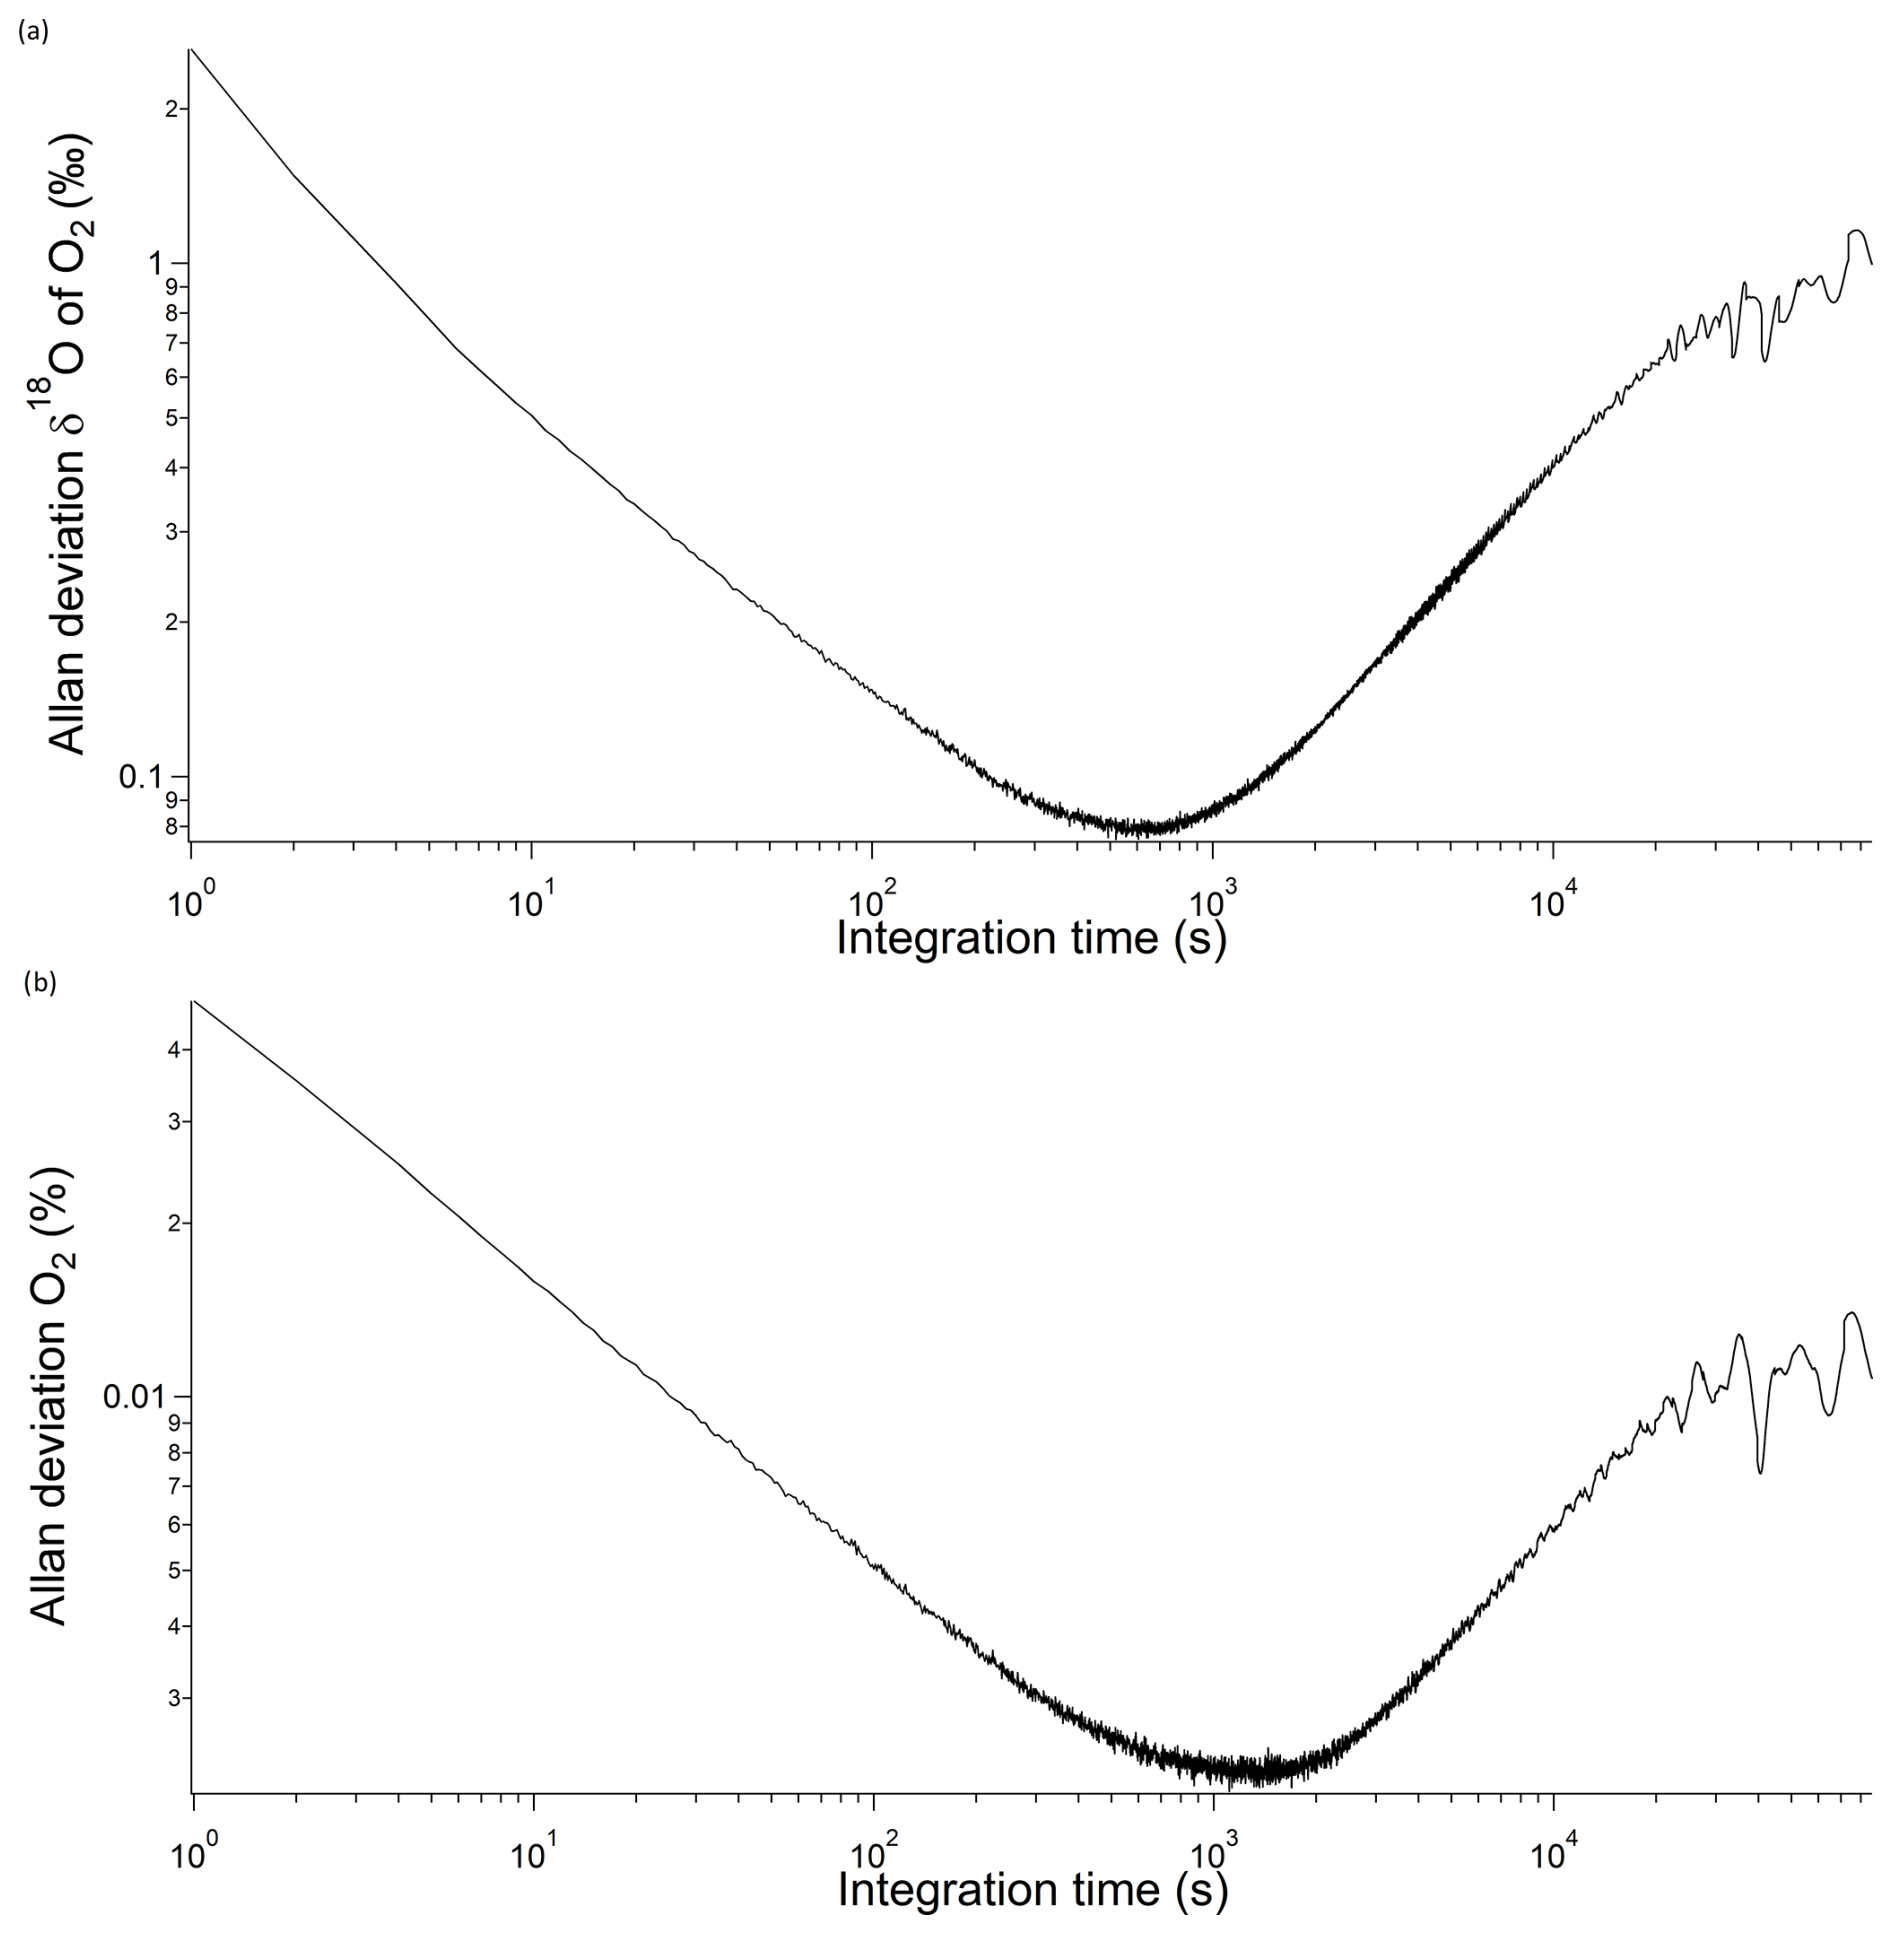
Figure 3Allan deviation for (a) δ18O of O2 and (b) O2 concentration from optical spectrometry during our studies (i.e. deteriorated mode).
2.2.4 Quantification of fractionation factors associated with the respiration and photosynthesis process
In order to calculate the fractionation factors associated with dark respiration and photosynthesis of soil and maize, we used Eqs. (4) and (5) (for details, refer to Paul et al., 2023).
The isotopic discrimination for dark respiration, 18εdark_respi, is given by
where 18αdark_respi is the dark respiration fractionation factor, t0 is the starting time of each dark period, and t is the time of the experiment.
is linked to as
The photosynthesis fractionation factor, 18αphotosynthesis, is calculated as
where during the light period; Fphotosynthesis and Fdark_respi are, respectively, photosynthesis and dark respiration fluxes of oxygen; and lw stands for leaf water.
Note that, because maize is a C4 plant, we regard photorespiration and the Mehler reaction as not being involved in the O2 consumption by the plant.
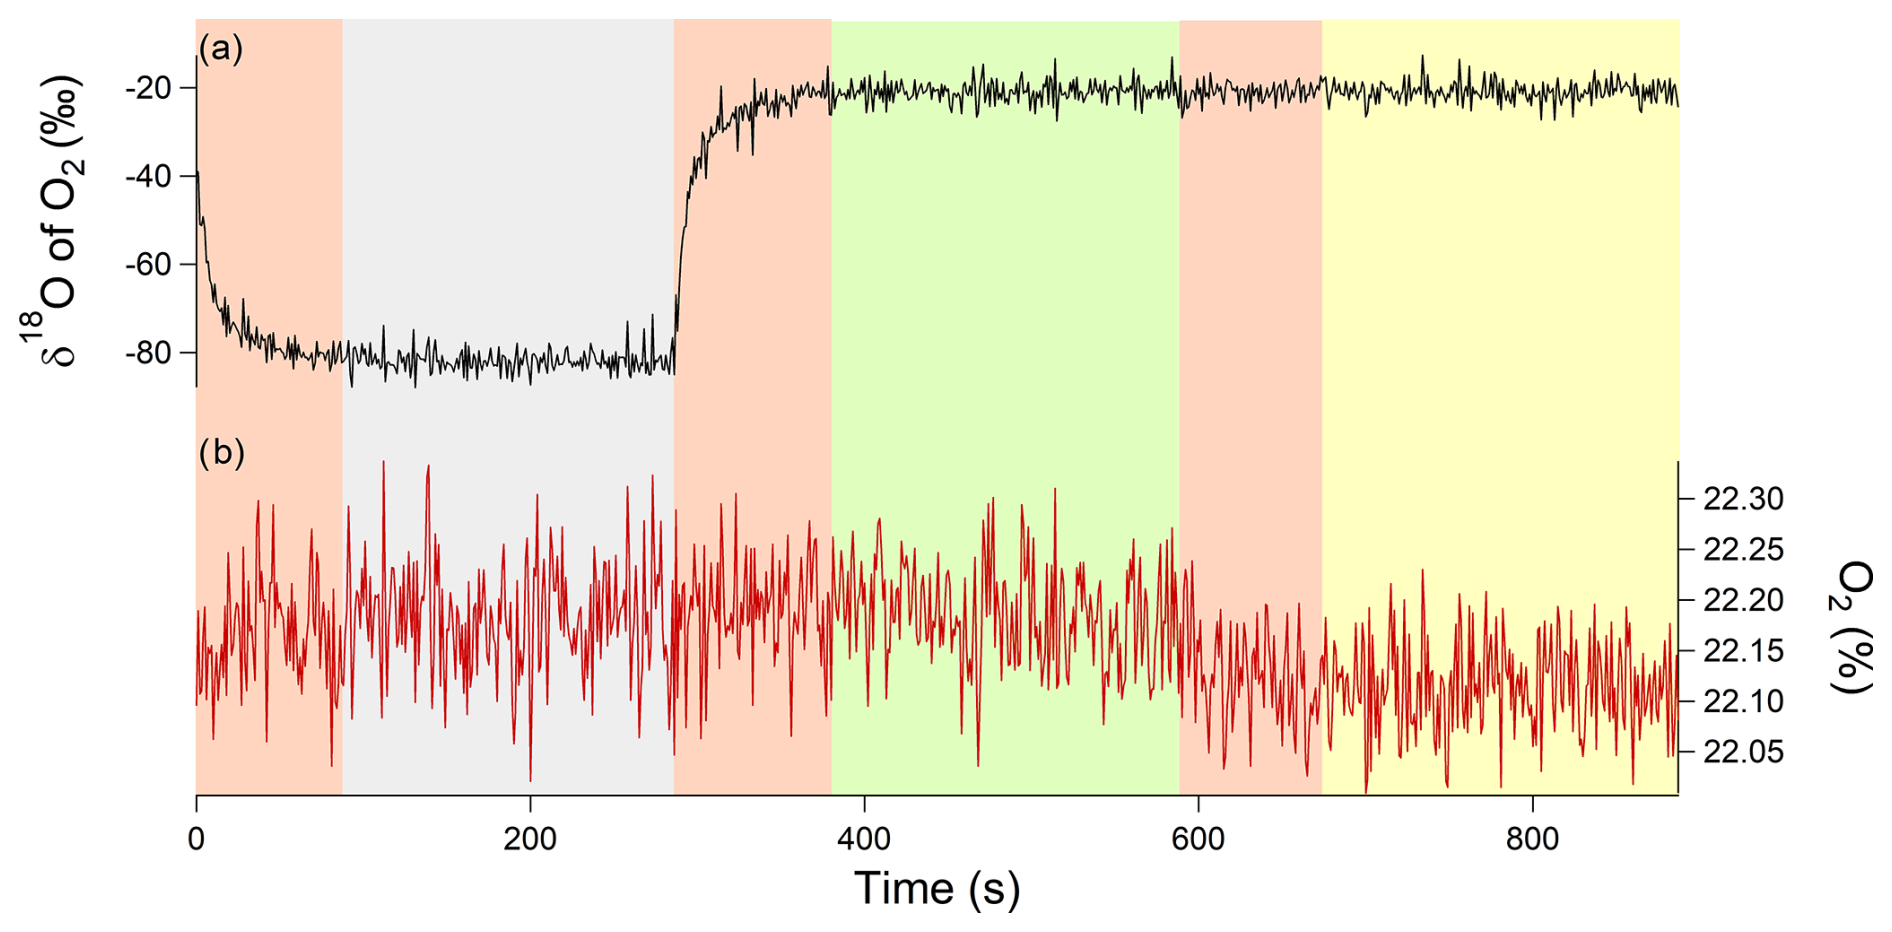
Figure 4Example of an 18 min measurement sequence for a closed chamber with two calibrations. The gray rectangle corresponds to calibration 1, i.e., synthetic air (with a δ18O of O2 value of −60 ‰ measured by IRMS and with an O2 concentration of 20.9 %), measured for 6 min. The green rectangle corresponds to calibration 2, i.e., atmospheric air (with a δ18O of O2 value equal to 0 ‰ and O2 concentration 21 %), measured for 6 min. The yellow rectangle corresponds to the air measurement of the closed chamber measured for 6 min. All the pink rectangles represent the memory effect of the analyzer, and those measurement points were removed from the processed and analyzed data (i.e., first 2 min removed). (a) δ18O of O2 in black and (b) O2 concentration in red.
Comparison between mass spectrometry and optical spectrometry analysis
Figure 5 presents the evolution of the elemental concentration and isotopic composition of dioxygen in the biological chambers during the experiment described in the previous section. Because of the calibration, averaging, and switch from one chamber to another every 18 min, the optical spectrometry analyzer provides only one δ18O of O2 and O2 concentration value every 54 min in each chamber.
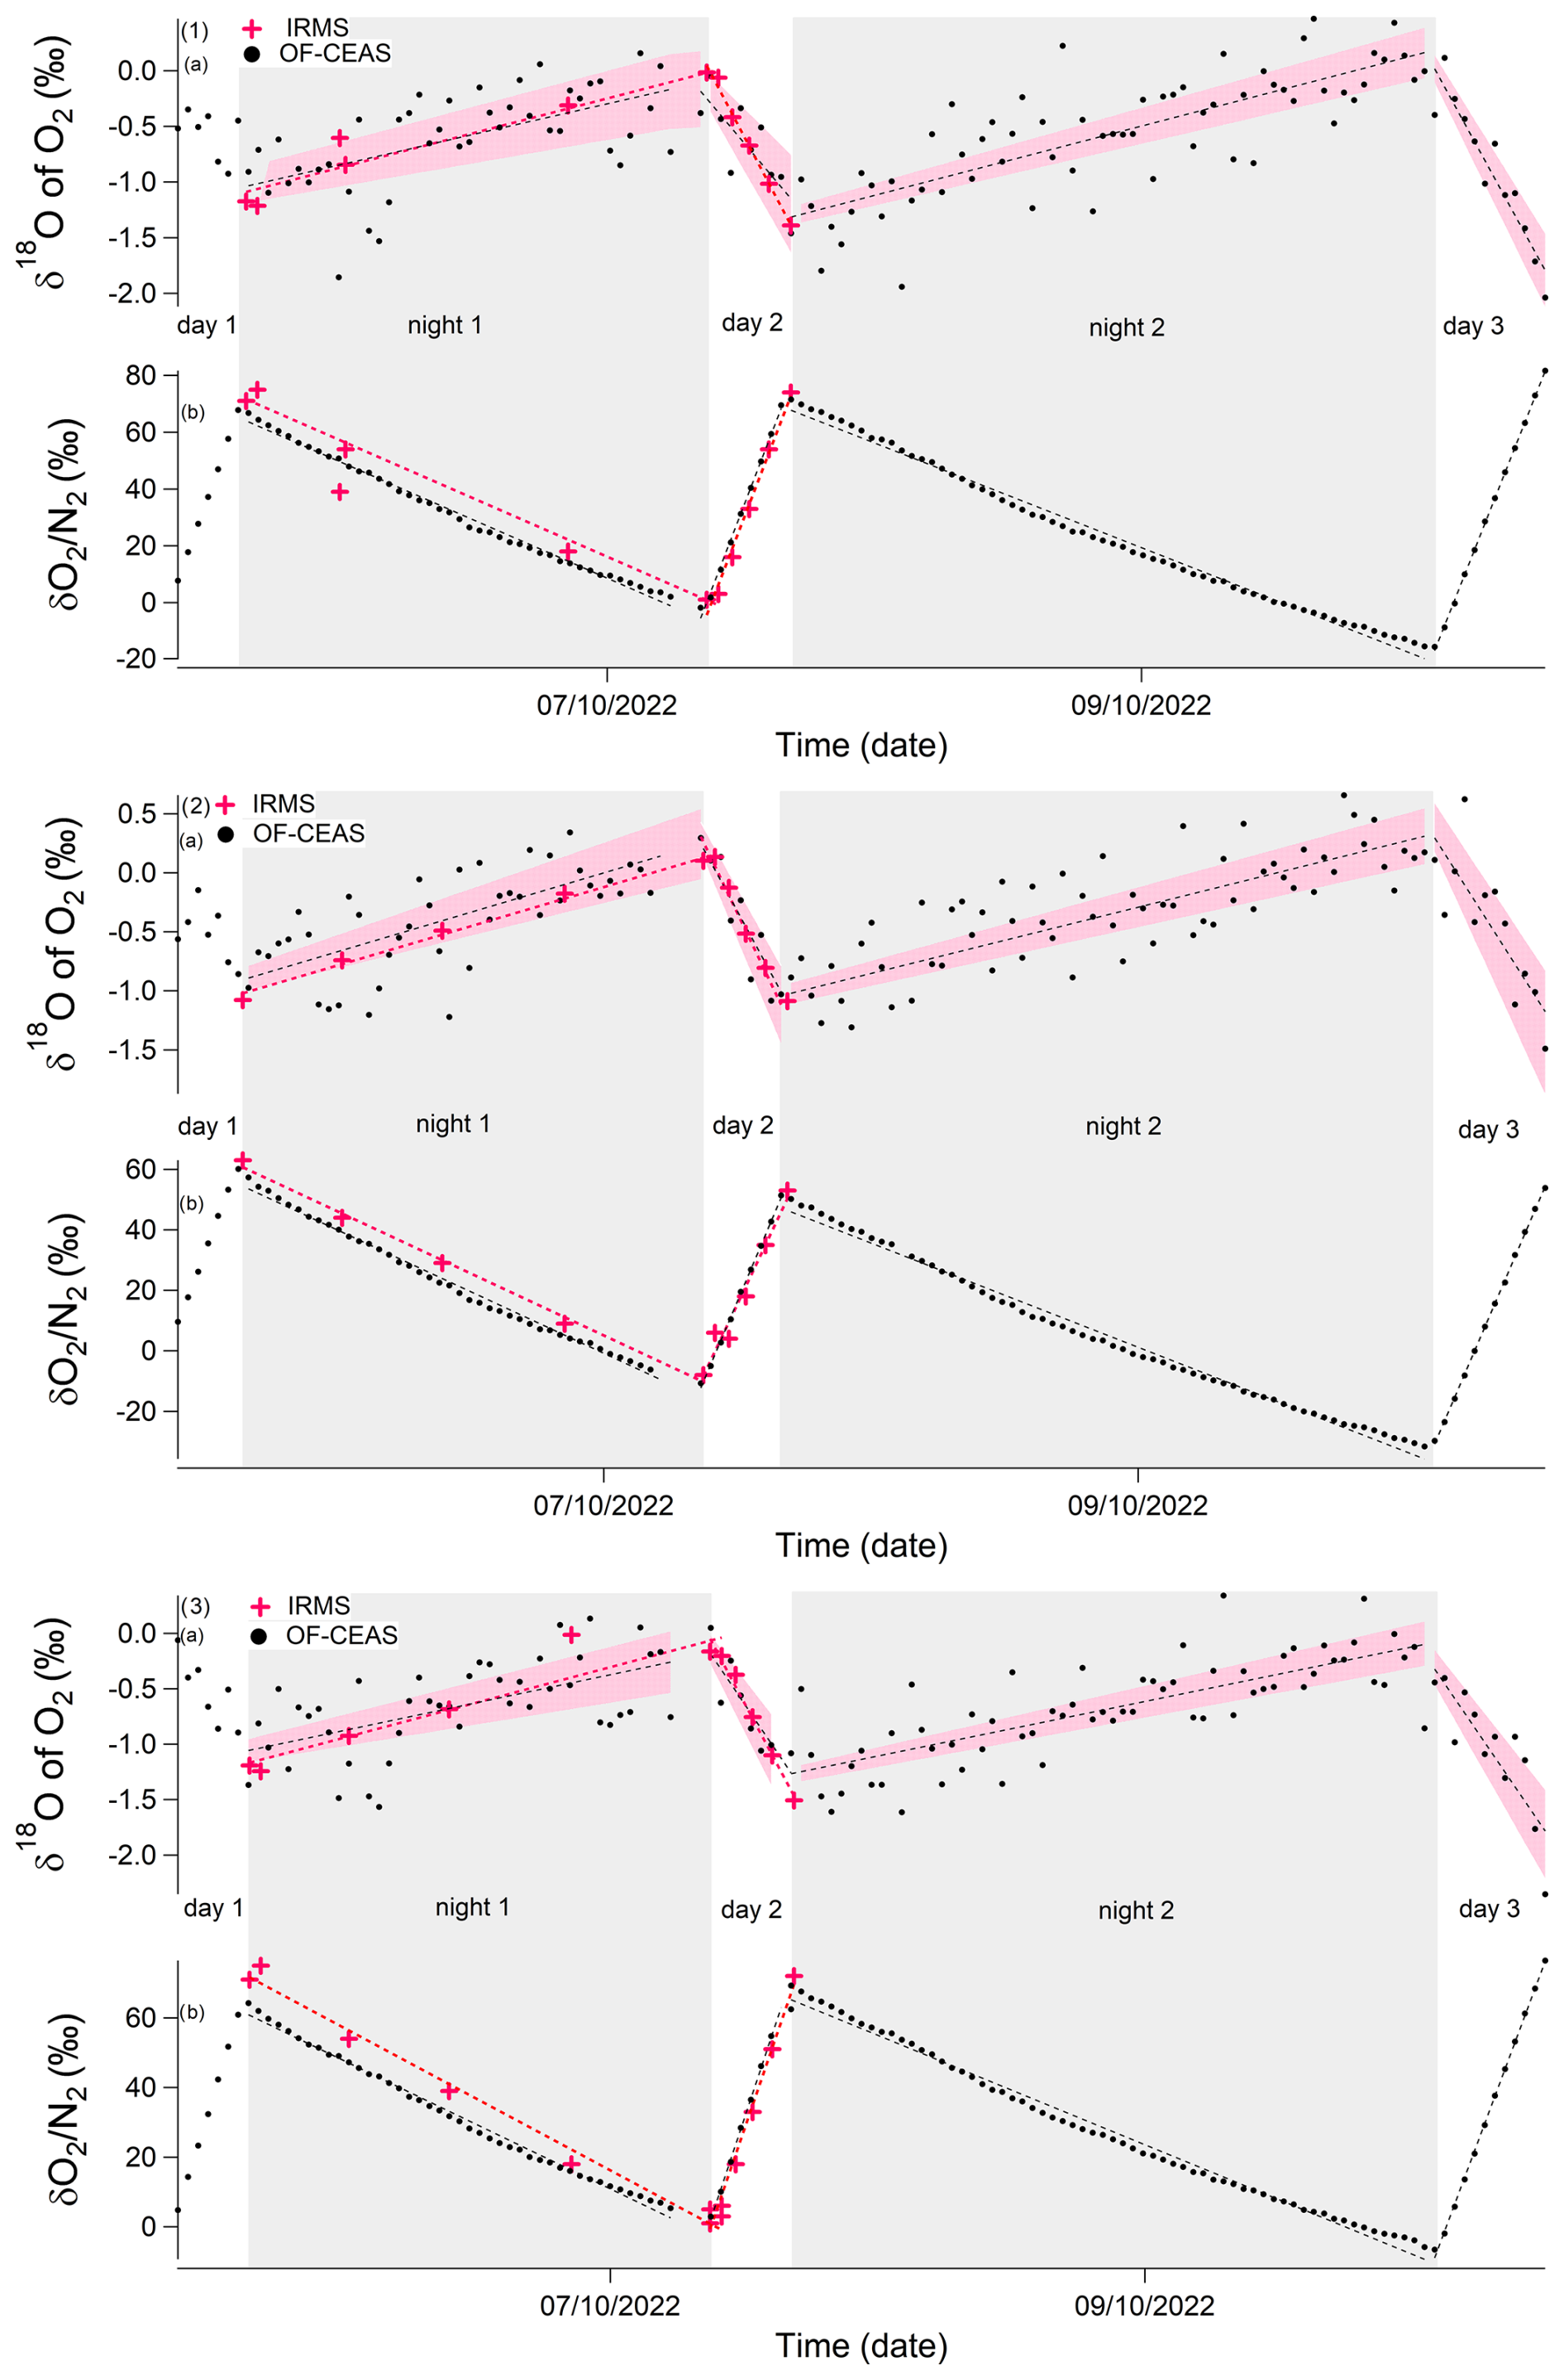
Figure 5Evolution of the different isotopic ratios of the soil and maize experiment due to dark respiration and photosynthesis (starting 5 October and ending 10 October 2022) in closed chambers over 5 d. Gray rectangles correspond to dark periods, and white rectangles correspond to light periods. Labeling denotes the following: (1) chamber 1, (2) chamber 2, (3) chamber 3. (a) δ18O of O2 variations. (b) δO2/N2 variations. Black points: optical spectrometer data (OF-CEAS). Red stars: data obtained by IRMS. Dashed red line: linear regression of optical spectrometer data for one period (dark or light). Dashed black line: linear regression of IRMS data for one period (dark or light). Pink envelopes represent uncertainty envelopes associated with linear regression slopes and the intercept of optical spectrometer data for δ18O of O2. Note that the first period of light is not considered because the system is not stable at that stage.
During dark periods, when there was only soil and plant respiration, δ18O of O2 increased by 1 ‰ and δON2 decreased by 50 ‰–60 ‰ (Fig. 5). During the light period, when both photosynthesis of the plant and respiration in the plant and soil occurred, the δ18O of O2 decreased by 1 ‰ and δON2 increased by around 50 ‰ at a rate twice as fast as the decrease in respiration rate observed during night periods.
In Fig. 5, the optical-spectrometer-derived δ18O of O2 data displayed a higher degree of scattering compared to the data obtained through the use of IRMS. Nonetheless, the regression slopes computed for each period (dark and light period) demonstrate a general comparability, regardless of whether they are derived from the IRMS or optical spectrometer data (see Table 3). This finding holds significant importance, as the fractionation factors were determined based on the values of these regression slopes.
Table 3Average and standard deviation of the isotopic discriminations of maize and the number of determinations of the isotopic discrimination for all the experiments (with data of the three chambers) on which they were calculated.
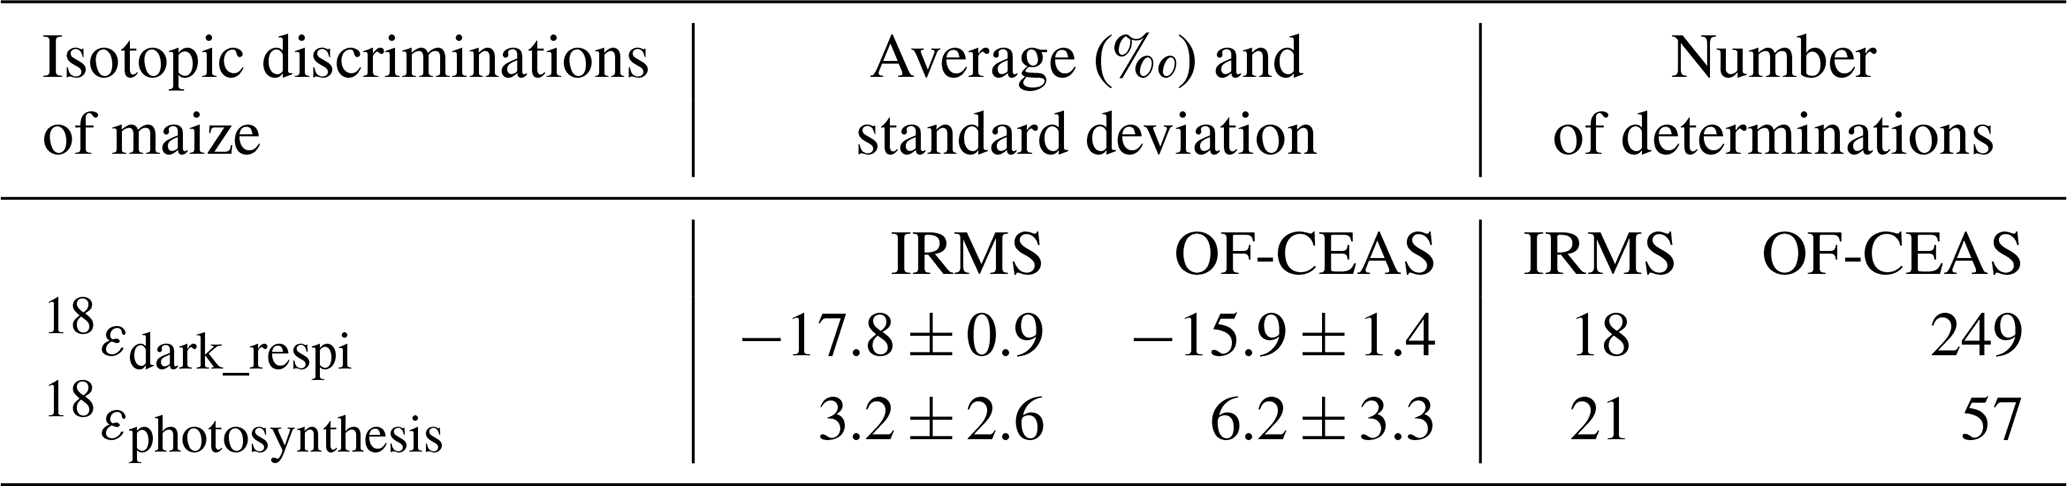
From the results displayed in Fig. 5, it was possible to calculate the isotopic discrimination found for dark respiration as 18εdark_respi17.8 ± 0.9 ‰ and −15.9 ± 1.4 ‰ for IRMS and optical spectrometer, respectively (Table 4). For photosynthesis, the isotopic discrimination found for 18εphotosynthesis is +3.2 ± 2.6 ‰ and +6.2 ± 3.3 ‰ for IRMS and optical spectrometer, respectively.
The value of isotopic discrimination, 18εdark_respi, associated with maize growing on soil, agreed with the literature. Guy et al. (1989) found values equal to −17 and −19 ‰ for 18εdark_respi for Phaeodactylum tricornutum and terrestrial plants. Helman et al. (2005) found a value of 18εdark_respi equal to −17.1 ‰ for bacteria from Lake Kinneret and a value of −19.4 ‰ for Synechocystis. Paul et al. (2023) found a value equal to −19.1 ± 2.4 ‰ for Festuca arundinacea.
Our value of 18εphotosynthesis for maize is also close to the value determined by Paul et al. (2023): +3.7 ± 1.3 ‰ for Festuca arundinacea. In both cases we observe a positive value, which contradicts the classically used value of 0 ‰ from Guy et al. (1993). Our value hence confirms the existence of an apparent isotopic discrimination for terrestrial photosynthesis. This leads to an increase in the δ18O of O2 value associated with the terrestrial biosphere compared to the latest study of Luz and Barkan (2011). As a consequence, it is still an open question as to whether δ18Oatm and Dole effect variations should be interpreted solely as a change in the low-latitude atmospheric water cycle or if the relative change in the marine vs. terrestrial biological productivity also plays a role. Future studies should hence use a setup similar to ours to systematically study the O2 fractionation coefficients associated with biological processes.
We have developed and presented a new automated multiplexing system that facilitates the study of gas exchange between plants and the atmosphere. This system offers several key advantages. Firstly, it allows continuous measurements of the isotopic and elemental composition of dioxygen in the biological chamber, removing the need for manual sampling. Secondly, it provides near-real-time monitoring of δ18O of O2 and O2 concentration during experiments, enabling adjustments to environmental conditions, such as dark and light cycles, in real time. Finally, it supports the convenient replication of experiments, enabling systematic studies across a wide range of environmental conditions, plant species, and soil types.
In the application of this system to maize, the fractionation factors for dark respiration (18εdark_respi: −17 ± 2 ‰) and photosynthesis (18εphotosynthesis: +6.7 ± 3.3 ‰) are consistent with literature values, though the relatively large uncertainties highlight some current limitations, including suboptimal performance of the optical spectrometry and excessive calibration time. Stability tests of the calibration gases indicated that less frequent calibrations (e.g., measuring both gases twice daily and one calibration gas every 15–20 min) would be sufficient to ensure accuracy.
Our automated system has significant potential for broader applications. Firstly, its open-code design and use of relatively low-cost sensors (excluding the optical spectrometry analyzer) make it easily adaptable to other biological experiments. Secondly, coupling this system with other optical spectrometers, such as Picarro or Los Gatos Research (LGR) trace gas instruments, could enable the quantification of trace gas exchanges, including N2O and CH4 (and their isotopologues), between the plant–soil system and the atmosphere.
Future studies should focus on upgrading the instrumentation to enhance performance and reduce uncertainties in isotopic fractionation measurements. Additionally, optimizing calibration frequency will improve experimental efficiency and reliability. This system paves the way for more comprehensive and systematic investigations into gas exchange processes under diverse conditions.
This study has been conducted using this code at https://gitlab.in2p3.fr/olivier.jossoud/aquaoxy (Jossoud, 2022).
The supplementary data supporting the findings of this study are available in a ZENODO database at https://doi.org/10.5281/zenodo.15182356.
AL and CPi designed the project. CPi, JS, SD, and CPa carried out experiments at the Ecotron of Montpellier, and FP, CPa, RJ, AD, and OJ carried out experiments at LSCE. CPa, CPi, and AL analyzed the data from the optical spectrometer, and CPa and AL analyzed the data from IRMS. CPa, CPi, and AL prepared the article with contributions from AM.
The contact author has declared that none of the authors has any competing interests.
Publisher's note: Copernicus Publications remains neutral with regard to jurisdictional claims made in the text, published maps, institutional affiliations, or any other geographical representation in this paper. While Copernicus Publications makes every effort to include appropriate place names, the final responsibility lies with the authors.
The authors acknowledge the scientific and technical support of Plateforme ANalytique géOsciences Paris-sacLaY (PANOPLY), Paris-Saclay University, France. We also extend our thanks to AQUA-OXY (CNRS IIT project). This study benefited from the CNRS resources allocated to the French Ecotron Research Infrastructure, from the Occitanie Region and FEDER investments, and from the state allocation “Investissement d'Avenir” AnaEE France (grant no. ANR-11-INBS-0001). We would also like to thank Abdelaziz Faez and Olivier Ravel from the Ecotron of Montpellier and Emeritus Prof. Phil Ineson from the University of York for their help.
The research leading to these results has received funding from the European Research Council under the European Union H2020 program (H2020/20192024)/ERC grant agreement no. 817493 (ERC ICORDA) and ANR HUMI17.
This paper was edited by Ciro Apollonio and reviewed by two anonymous referees.
Angert, A., Luz, B., and Yakir, D.: Fractionation of oxygen isotopes by respiration and diffusion in soils and its implications for the isotopic composition of atmospheric O2, Global Biogeochem. Cy., 15, 871–880, https://doi.org/10.1029/2000GB001371, 2001.
Bender, M., Sowers, T., Dickson, M-L., Orchardo, J., Grootes, P., Mayewski, P. A., and Meese, D. A.: Climate correlations between Greenland and Antarctica during the past 100,000 years, Nature, 372, 663–666, https://doi.org/10.1038/372663a0, 1994.
Brandon, M., Landais, A., Duchamp-Alphonse, S., Favre, V., Schmitz, L., Abrial, H., Prié, F., Extier, T., and Blunier, T.: Exceptionally high biosphere productivity at the beginning of Marine Isotopic Stage 11, Nat. Commun., 11, 1–10, https://doi.org/10.1038/s41467-020-15739-2, 2020.
Capron, E., Landais, A., Lemieux-Dudon, B., Schilt, A., Loulergue, L., Buiron, D., Chappellaz, J., Masson-Delmotte, V., Dahl-Jensen, D., Johnsen, S., Leuenberger, M., and Oerter, S., H.: Synchronising EDML and NorthGRIP ice cores using δ18O of atmospheric oxygen (δ18Oatm) and CH4 measurements over MIS 5 (80–123 ka), Quaternary Sci. Rev., 29, 235–246, https://doi.org/10.1016/j.quascirev.2009.07.014, 2010.
Cheng, H., Sinha, A., Verheyden, S., Nader, F. H., Li, X., Zhang, P., Yin, J., Hadi, S., and Ning, Y.: The Asian monsoon over the past 640,000 years and ice age terminations, Nature, 534, 640–646, https://doi.org/10.1038/nature18591, 2016.
Dreyfus, G. B., Parrenin, F., Lemieux-Dudon, B., Durand, G., Masson-Delmotte, V., Jouzel, J., Barnola, J.-M., Panno, L., Spahni, R., Tisserand, A., Siegenthaler, U., and Leuenberger, M.: Anomalous flow below 2700 m in the EPICA Dome C ice core detected using δ18O of atmospheric oxygen measurements, Clim. Past, 3, 341–353, https://doi.org/10.5194/cp-3-341-2007, 2007.
Eisenstadt, D., Barkan, E., Luz, B., and Kaplan, A.: Enrichment of oxygen heavy isotopes during photosynthesis in phytoplankton, Photosynth. Res., 103, 97–103, https://doi.org/10.1007/s11120-009-9518-z, 2010.
Extier, T., Landais, A., Bréant, C., Prié, F., Bazin, L., Dreyfus, G., Roche, D. M., and Leuenberger, M.: On the use of δ18Oatm for ice core dating, Quaternary Sci. Rev., 185, 244–257, https://doi.org/10.1016/j.quascirev.2018.02.008, 2018.
Guy, R. D., Berry, J. A., Fogel, M. L., and Hoering, T. C.: Differential fractionation of oxygen isotopes by cyanide-resistant and cyanide-sensitive respiration in plants, Planta, 177, 483–491, https://doi.org/10.1007/BF00392616, 1989.
Guy, R. D., Fogel, M. L., and Berry, J. A.: Photosynthetic fractionation of the stable isotopes of oxygen and carbon, Plant Physiol., 101, 37–47, https://doi.org/10.1104/pp.101.1.37, 1993.
Helman, Y., Barkan, E., Eisenstadt, D., Luz, B., and Kaplan, A.: Fractionation of the three stables oxygen isotopes by oxygen-producing and oxygen-consuming reactions in photosynthetic organisms, Plant Physiol., 138, 2292–2298, https://doi.org/10.1104/pp.105.063768, 2005.
Hendricks, M. B., Bender, M. L., and Barnett, B. A.: Net and gross O2 production in the Southern Ocean from measurements of biological O2 saturation and its triple isotope composition, Deep Sea Res. I, 51, 1541–1561, https://doi.org/10.1016/j.dsr.2004.06.006, 2004.
Hoffmann, G., Cuntz, M., Weber, C., Ciais, P., Friedlingstein, P., Heimann, M., Jouzel, J., Kaduk, J., Maier Reimer, E., Seibt, U., and Six, K.: A model of the Earth’s Dole effect, Global Biogeochem. Cy., 18, 1–15, https://doi.org/10.1029/2003GB002059, 2004.
Jossoud, O.: aquaoxy, Firebeetle chamber. Misc., Gitlab [code], https://gitlab.in2p3.fr/olivier.jossoud/aquaoxy, 2022.
Keeling, R. F. and Shertz, S. R.: seasonal and interannual variations in atmospheric oxygen and implications for the global carbon cycle, Nature, 358, 723–727, https://doi.org/10.1038/358723a0, 1992.
Kroopnick, P. and Craig, H.: Atmospheric Oxygen: Isotopic Composition and Solubility Fractionation, Science, 175, 54–55, https://doi.org/10.1126/science.175.4017.54, 1972.
Landais, A., Dreyfus, G., Capron, E., Masson-Delmotte, V., Sanchez-Goñi, M. F., Desprat, S., Hoffmann, G., Jouzel, J., Leuenberger M., and Johnsen, S.: What drives the orbital and millennial variations of d18Oatm?, Quaternary Sci. Rev., 29, 235–246, https://doi.org/10.1016/j.quascirev.2009.07.005, 2010.
Luz, B. and Barkan, E.: Assessment of Oceanic Productivity with the Triple-Isotope Composition of Dissolved Oxygen, Science, 288, 2028–2031, https://doi.org/10.1126/science.288.5473.2028, 2000.
Luz, B. and Barkan, E.: The isotopic ratios 18O/16O and 17O/16O in molecular oxygen and their significance in biogeochemistry, Geochim. Cosmochim. Acta, 66, 11, 2001–2011, https://doi.org/10.1016/S0016-7037(02)00890-1, 2002.
Luz, B. and Barkan, E.: The isotopic composition of atmospheric oxygen, Global Biogeochem. Cy., 25, GB3001, https://doi.org/10.1029/2010GB003883, 2011.
Luz, B., Barkan, E., Bender, M. L., Thiemens, M. H., and Boering, K. A.: Triple-isotope composition of atmospheric oxygen as a tracer of biosphere productivity, Nature, 400, 547–550, https://doi.org/10.1038/22987, 1999.
Malaizé, B., Paillard, D., Jouzel, J., and Raynaud, D.: The Dole effect over the Last two glacial-interglacial cycles, J. Geophys. Res., 104, 14199–14208, https://doi.org/10.1029/1999JD900116, 1999.
Milcu, A., Allan, E., Roscher, C., Jenkins, T., Meyer, S. T., Flynn, D., Bessler, H., Buscot, F., Engels, C., Gubsch, M., König, S., Lipowsky, A., Loranger, J., Renker, C., Scherber, C., Schmid, B., Thébault, E., Wubet, T., Weisser, W. W., Scheu, S., and Eisenhauer, N.: Functionally and phylogenetically diverse plant communities key to soil biota, Ecology, 94, 1878–1885, https://doi.org/10.1890/12-1936.1, 2013.
Paul, C., Piel, C., Sauze, J., Pasquier, N., Prié, F., Devidal, S., Jacob, R., Dapoigny, A., Jossoud, O., Milcu, A., and Landais, A.: Determination of respiration and photosynthesis fractionation factors for atmospheric dioxygen inferred from a vegetation–soil–atmosphere analogue of the terrestrial biosphere in closed chambers, Biogeosciences, 20, 1047–1062, https://doi.org/10.5194/bg-20-1047-2023, 2023.
Paul, C.: Evolution of the different isotopic ratios (δ18O of O2 and δO2/N2) analyzed on IRMS of the soil and maize experiment due to dark respiration (lighting off) and photosynthesis (lighting on) in 3 closed chambers over the days, in: Geoscientific Instrumentation, Methods and Data Systems, Zenodo [data set], https://doi.org/10.5281/zenodo.15182356, 2025.
Petit, J. R., Jouzel, J., Raynaud, D., Barkov, N. I., Barnola, J.-M., Basile, I., Bender, M., Chappellaz, J., Davis, M., Delaygue, G., Delmotte, M., Kotlyakov, V. M., Legrand, M., Lipenkov, V. Y., Lorius, C., Pépin, L., Ritz, C., Saltzman, E., and Stievenard, M.: Climate and atmospheric history of the past 420,000 years from the Vostok ice core, Antarctica, Nature, 399, 429–436, https://doi.org/10.1038/20859, 1999.
Piel, C., Romanini, D., Farradèche, M., Chaillot, J., Paul, C., Bienville, N., Lauwers, T., Sauze, J., Jaulin, K., Prié, F., and Landais, A.: High-precision oxygen isotope (δ18O) measurements of atmospheric dioxygen using optical-feedback cavity-enhanced absorption spectroscopy (OF-CEAS), Atmos. Meas. Tech., 17, 6647–6658, https://doi.org/10.5194/amt-17-6647-2024, 2024.
Seltzer, A. M., Severinghaus, J. P., Andraski, B. J., and Stonestrom, D. A.: Steady state fractionation of heavy noble gas isotopes in a deep unsaturated zone, Water Resour. Res., 53, 2716–2732, https://doi.org/10.1002/2016WR019655, 2017.
Severinghaus, J. P., Beaudette, R., Headly, M. A., Taylor, K., and Brook, E. J.: Oxygen-18 of O2 records the impact of abrupt climate change on the terrestrial biosphere, Science, 324, 1431–1434, https://doi.org/10.1126/science.1169473, 2009.
Stolper, D. A., Bender, M. L., Dreyfus, G. B., Yan, Y., and Higgins, J. A.: A Pleistocene ice core record of atmospheric O2 concentrations, Science, 353, 1427–1430, https://doi.org/10.1126/science.aaf5445, 2016.
Stolper, D. A., Fischer, W. W., and Bender, M. L.: Effects of temperature and carbon source on the isotopic fractionations associated with O2 respiration for 17O/16O and 18O/16O ratios in E. coli, Geochim. Cosmochim. Ac., 240, 152–172, https://doi.org/10.1016/j.gca.2018.07.039, 2018.
Wang, Y., Cheng, H., Lawrence Edwards, R., Kong, X., Shao, X., Chen, S., Wu, J., Jiang, X., Wang, X., and An, Z.: Millenial- and orbital-scale changes in the East Asian monsoon over the past 24,000 years, Nature, 451, 1090–1093, https://doi.org/10.1038/nature06692, 2008.
Werle, P.: Accuracy and precision of laser spectrometers for trace gas sensing in the presence of optical fringes and atmospheric turbulence, Appl. Phys. B, 102, 313–329, https://doi.org/10.1007/s00340-010-4165-9, 2011.
Yang, J., Rousseau, D.-D., Antoine, P., Moine, O., Steffensen, J. P., Kristensen, M., and Seidenkrantz, M.-S.: Northward shift of the westerlies during Dansgaard–Oeschger events revealed by Greenland dust provenance, Science, 375, 1196–1200, https://doi.org/10.1126/science.abj8826, 2022.