
the Creative Commons Attribution 4.0 License.
the Creative Commons Attribution 4.0 License.
 | 17 Sep 2026
A low-cost surface ablation monitoring system using wind-induced motion of mass-balance stakes
Felix St-Amour

Hsin Cynthia Chiang
Jamie Cox
Eamon Egan
Ian Hendricksen
Jacob Rodrigo
Jonathan Sievers
Laura Thomson
Surface ablation measurements are critical for understanding glacier mass change over time. Mass-balance stakes are commonly used for localized measurements, with the exposed length typically measured manually at infrequent intervals. This paper presents the design and validation of new instrumentation that automates mass-balance stake readings, thus enabling continuous measurements with high temporal resolution. The instrumentation comprises readout electronics that are mounted on mass-balance stakes to measure wind-induced vibrations. The stake vibrational frequency depends sensitively on their exposed length, and changes in the measured frequency therefore are indicative of glacier surface melt and accumulation. Initial instrumentation field tests conducted at Colour Lake on Umingmat Nunaat (Axel Heiberg Island), Nunavut, demonstrate centimeter-level precision on length measurements. The instrumentation can be attached to existing mass-balance stakes and is low-cost (∼ USD 50) in comparison to many other systems that perform automated surface ablation measurements. The accessibility of this instrumentation opens new possibilities for localized, high temporal resolution measurements of glacier surface activity at any location where mass balance stakes are deployed.
- Article
(3252 KB) - Full-text XML
- BibTeX
- EndNote


Glaciers and ice caps, recognized indicators of a changing climate, have exhibited continued and often accelerated mass loss through the early 21st century (e.g., Hugonnet et al., 2021). These changes have strong implications for sea level rise, and for communities and ecosystems impacted by runoff (Immerzeel et al., 2020). The glaciological mass balance method (e.g., Østrem and Stanley, 1966) is one approach used to quantify annual changes within a glacier system, using an input-output approach that interpolates and extrapolates measurements of mass gain (primarily snow accumulation) and mass loss (primarily ice melt and iceberg calving) across the glacier to gain a glacier-wide mass change commonly reported in meters of water equivalent (Cogley et al., 2010). Point measurements of accumulation are made from measurements of snow thickness and density in snow pits, while ice melt is most commonly determined from measuring the exposure of mass-balance stakes drilled into the ice. Measurements for mass balance are most generally made only once or twice per year, representing annual or seasonal (summer and winter) balances, respectively (Cogley et al., 2010). While this observation frequency is sufficient for standardized mass balance reporting, there is an increasing demand for data with higher temporal resolution to support and improve mass balance projections and runoff models. For most glacierized regions in the world, including the Canadian Arctic, ice melt is the dominant control on annual mass balance (Sharp et al., 2011). Therefore, continuous melt monitoring can serve as a valuable, real-time, indicator of mass balance conditions and can support timely runoff projections for downstream environments and communities.
Continuous ice melt monitoring has previously been demonstrated by several systems employing a wide range of technologies. Wickert et al. (2023) developed an ablation stake system with a downward-looking ultrasonic rangefinder to measure the distance to the glacier surface, with an estimated cost of USD 700 per instrument. Landmann et al. (2021) present a camera-based pole monitoring system, which was later upgraded to use computer vision to automate melt measurements (Cremona et al., 2023). While the camera system is able to determine surface height changes with millimeter-level precision, high ablation rates can cause misreadings. Carturan et al. (2019) used a string of thermistors to directly measure melt activity, with linear resolution (±3 cm) determined by the spacing between thermistors. Hulth (2010) presents a draw-wire method, although the measurement is sensitive only to surface lowering. Bøggild et al. (2004) created a pressure transducer ice melt monitoring system that is well suited for high ablation regions, although snow accumulation complicates the measurements. Existing automated ice melt monitoring systems cost upwards of USD 100, while manual ablation stake measurements carry centimeter-scale uncertainties and local ice surface roughness introduces variations up to 10 cm. We therefore aim to build an instrument costing under USD 100 with measurement uncertainty below 5 cm.
This study, inspired by the resonating rainfall and evaporation recorder developed by Stewart et al. (2012), presents the development of new instrumentation that continuously monitors mass-balance stake exposure by recording wind-induced vibrational frequency. The frequency depends sensitively on the exposed length, allowing centimeter-level measurement precision (and sometimes better, depending on operating conditions). The instrumentation is designed to run autonomously in Arctic environmental conditions for up to several years while taking hourly measurements. In comparison to other existing technologies for automated measurements, the system presented here is low-cost and can be attached to mass-balance stakes that are already installed in the field. This paper describes the instrument design, the derivation of exposed stake length from vibrational frequency, data analysis methods, lab tests, and initial Arctic field tests.
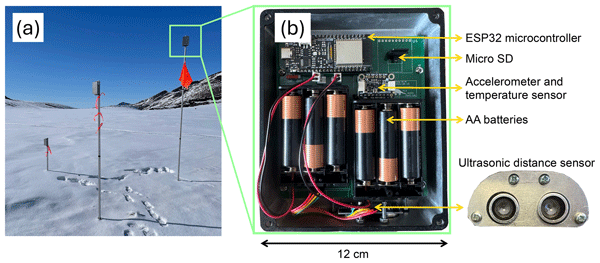
The Boxed Recorder Analyzing the Change in Height of Ice with On-Site Accelerometer and Ultrasonic Readers Utilizing Support (BRACHIOSAURUS, or BRACHI for short) consists of an electronics box that is attached to the top of a mass-balance stake, as shown in Fig. 1a. A microcontroller receives the data from an accelerometer, a temperature sensor, and a distance sensor (Fig. 1b). The hardware design files, control code, analysis software, and data used for this paper are all open source and available online at the following DOI: https://doi.org/10.5281/zenodo.18292185 (St-Amour et al., 2026). Each of the BRACHI components are described in detail below.
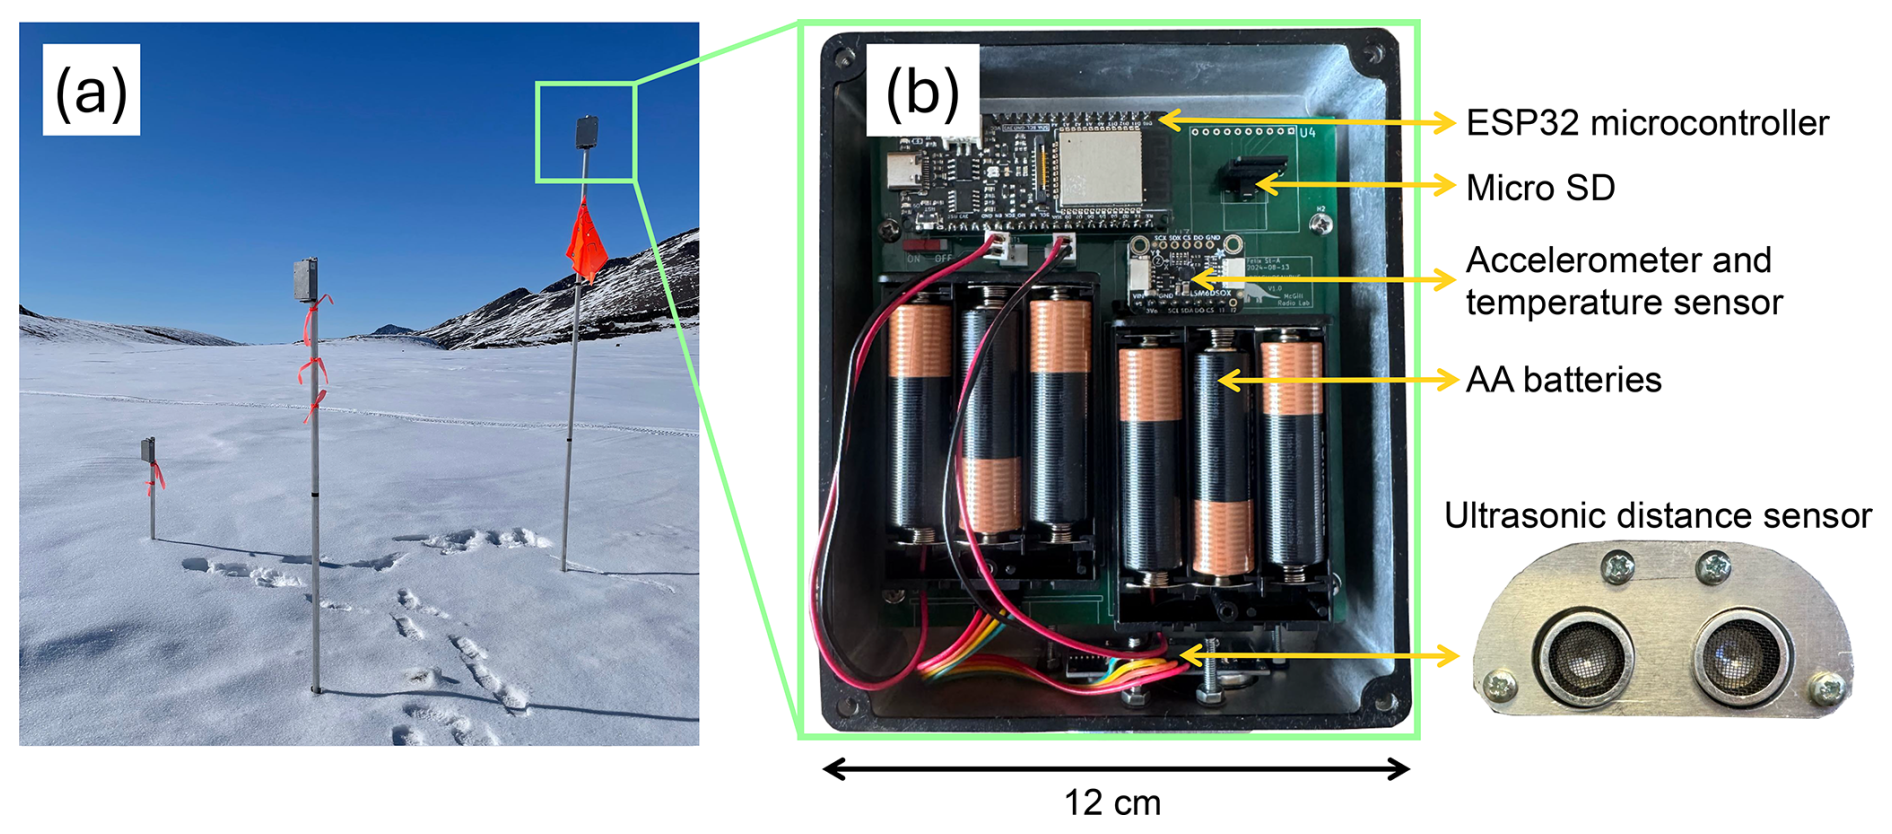
Figure 1(a) The BRACHI electronics box attaches to the top of a mass-balance stake. The three units in this photo were tested at Colour Lake on Axel Heiberg Island in May 2025, using stakes frozen into the lake surface at varying exposed lengths (1, 2, and 3 m). (b) The BRACHI electronics include an accelerometer with an integrated temperature sensor, downward-facing distance sensor, microcontroller, micro-SD card, and AA batteries. The components are mounted on a custom circuit board and housed inside a weatherproof enclosure.
2.1 Accelerometer and temperature sensor
The vibrations of the mass-balance stake are measured by an LSM6DSOX (STMicroelectronics) inertial measurement unit that has a three-axis accelerometer and a temperature sensor. The unit's accelerometer has a full-scale range of ±16 g and a specified operating temperature range of −40 to 85 °C. The temperature sensor data are saved by BRACHI, and the readings are also used internally by the LSM6DSOX to correct for accelerometer drift. The temperature readings are typically 0 to 5 °C higher than ambient since the sensor is sheltered inside the enclosure with powered electronics. Temperature readings can also be used to correct changes in the stiffness of the metal stake; however, these corrections are negligible for typical operating conditions (for aluminum, the stiffness varies by 3 % between −40 and 20 °C, which corresponds to a difference of 1 % on derived stake length).
2.2 Distance sensor
An HC-SR04 ultrasonic sensor is affixed to a custom metal cutout and mounted at the bottom of the enclosure, facing downward to measure the distance to the top surface of the glacier. Although the HC-SR04 is rated to only −20 °C and has a limited range of 4 m, it costs only ∼ USD 3. Other ultrasonic sensors with wider temperature ratings and longer distance sensing are typically at least ∼ 10 times more expensive and would nearly double the total BRACHI cost. The HC-SR04 is therefore used intentionally in an opportunistic manner, rather than providing a primary source of data. When operating conditions permit, the ultrasonic sensor provides an affordable and valuable cross-check against stake lengths derived from the accelerometer data.
2.3 Microcontroller and data storage
BRACHI employs an ESP32 microcontroller module, model DFR0654, to read and process sensor data. The raw data are saved to a micro SD card. The ESP32 was chosen for its −40 °C rating, computational power for the required onboard data processing, ability to enter a low power state while drawing only tens of µA, and embedded wireless capability. The wireless access point enables users to remotely download data, rather than directly accessing the micro SD. The micro SD is a 4-GB Delkin Devices Utility+ (S304GSEMC-U3000-3) and is rated to −40 °C. The BRACHI control code is written in the Arduino programming language.
2.4 Batteries
BRACHI is powered by six AA batteries connected in two parallel strings of three cells each. With the power draw of the readout electronics under normal operations, a set of six 3000 mAh lithium batteries will last for a minimum of 1 year (details in Appendix A). Lithium batteries are used for their survivability at subzero temperatures.
2.5 Circuit board and enclosure
The BRACHI electronics are mounted on a custom printed circuit board, which is rigidly attached to the surrounding enclosure. The enclosure is an aluminum box that is made waterproof with a rubber gasket under the lid, o-rings beneath each screw, and additional o-rings surrounding the distance sensor transducers. The enclosure is attached to the stake with U-bolts. The total weight of the BRACHI system (including U-bolts and batteries) is approximately 0.68 kg.
The relationship between vibrational frequency and length is obtained by modeling a BRACHI-equipped stake as a hollow cylindrical Euler–Bernoulli beam with a point mass at its free end, as illustrated in Fig. 2. The basic equations that govern this system are available in engineering textbooks, e.g., Blevins (1979, Chap. 8) and Stokey (2002, Chap. 7). The first, or fundamental, vibrational mode of the stake corresponds to back-and-forth swaying motion along the entire length. A simplified expression for the associated vibrational frequency, assuming a point mass at the end of the stake, is given by
Here L is the exposed stake length, E is the Young's modulus of the stake material, R and r are the respective outer and inner stake radii, m is the mass of BRACHI (assumed here to be a point mass at the end of the beam), and ρ is the density of the stake material. The numerical constants present in the formula are dimensionless. The treatment of m as an extended mass is discussed in Appendix B, and the solution for F1 must be obtained numerically.
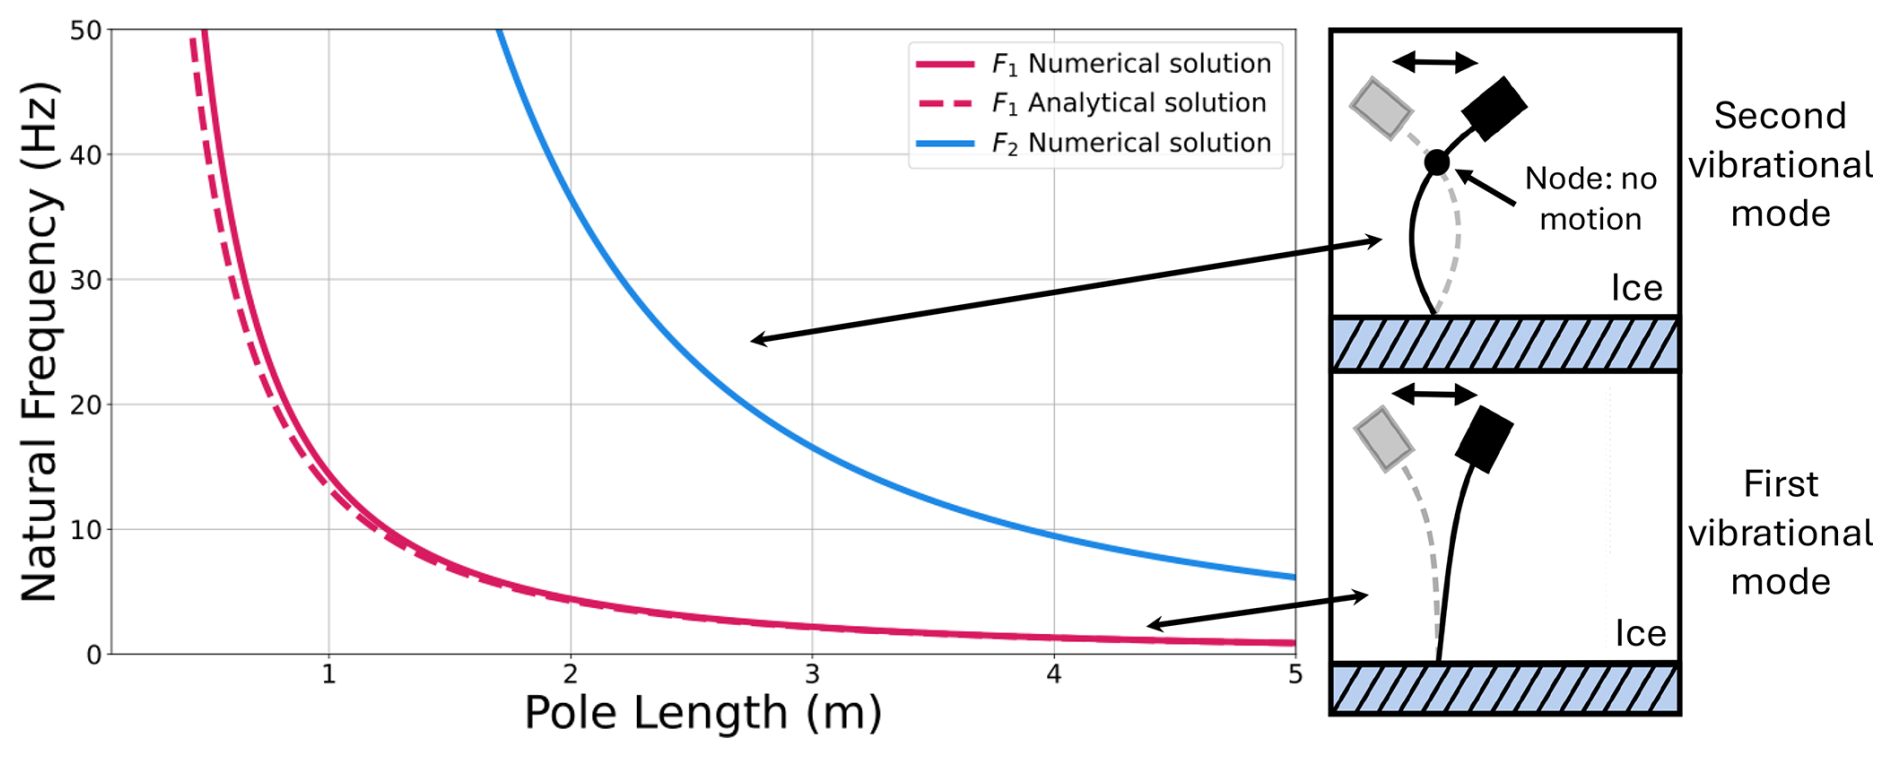
Figure 2A BRACHI-equipped stake is modeled as a vertical beam with a mass on the top end. Vibrational frequency as a function of exposed stake length is plotted for the first and second vibrational modes, and the corresponding stake motions are illustrated in the insets. The slight difference between the numerical and analytic solutions for F1 arises from treating BRACHI as an extended or point mass, respectively.
In principle, the stake can also support higher-order vibrational modes. We have found that the second mode is often excited in our particular setups; this motion corresponds to bending of the stake with one stationary node near the top. The frequencies of the second and higher-order modes do not have analytic expressions but can be obtained numerically (Erturk and Inman, 2011), with details given in Appendix B. Both the analytical and numerical calculations can be applied to hollow cylindrical ablation stakes with any dimensions and that are made of any material with known Young's modulus and density. Any visible damage or deformations to the stake will invalidate the relation between the length and frequency modes. Intact stakes have self-consistent length measurements across all modes, whereas damaged stakes have different length measurements between frequency modes.
Figure 2 shows the numerically computed frequency–length relationship for the first two vibrational modes of an example BRACHI-equipped stake, along with the analytic prediction from Eq. (1). (The detailed stake parameters are given in Sect. 6.) A small discrepancy between the analytic and numerical solutions for F1 is visible at ≲ 1 m and arises from the differences in assuming an extended (numerical solution) or point mass (analytical solution) for BRACHI. In the remainder of this work, numerical solutions including an extended mass will be used for computing lengths from vibrational frequency measurements.
The BRACHI firmware is configurable to allow user-defined data collection schedules. For the tests presented in this paper, data are recorded for 120 s every hour. The three-axis accelerometer is sampled at 200 Hz, and to reduce data volume, the acceleration is squared and summed across all three axes before being saved to the micro SD card. The acceleration data are processed offline to determine the stake length as a function of time. Processing of each 120 s timestream begins with dividing the data into 10 equal-length chunks of 12 s each. Analyzing these chunks enables identification of low-amplitude vibrational modes that may fluctuate above and below the noise floor across chunks, where the noise floor is defined as the median spectrum amplitude. Each chunk is Fourier transformed and squared to obtain a power spectrum, where the vibrational frequencies of the stake appear as narrow peaks.
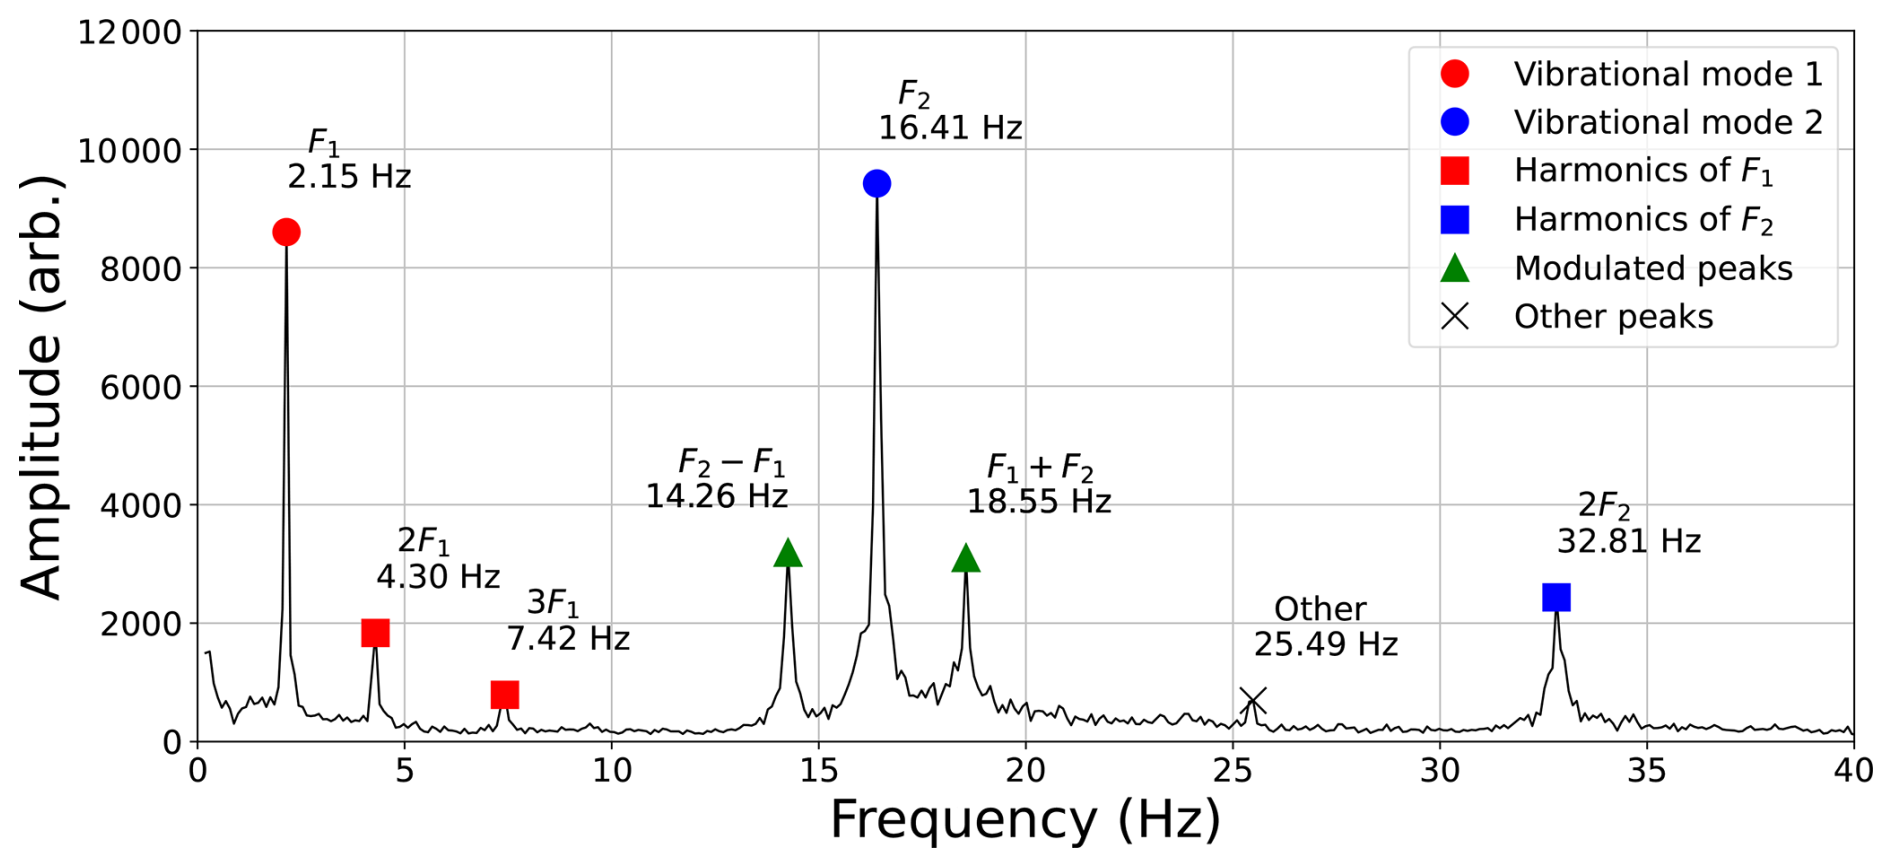
Figure 3An example power spectrum of accelerometer data from a BRACHI unit on a 3 m stake installed on a frozen lake. The first and second vibrational modes appear as the largest peaks in the spectrum at F1 and F2. Additional spectral lines are visible at 2F1, 3F1, 2F2, and F2±F1. Other peaks without a harmonic relationship to F1 and F2 are considered spurious and are excluded from analysis.
Figure 3 shows all of the frequency peaks that can be present, although for some measurements under different conditions, only a subset of these frequencies may be excited at detectable levels. The peaks in the power spectrum include the first and second vibrational modes (F1 and F2) and other spectral lines at 2F1, 2F2, 3F1, and F2±F1. The peaks at 2F1, 2F2, 3F1, and F2±F1 arise from Fourier transforming the squared magnitude of the acceleration. The spurious peak at 25.49 Hz in Fig. 3 is caused by electronic noise of the accelerometer. Future BRACHI instruments will employ larger micro SD cards that can store data from all accelerometer axes; treating each axis separately, rather than using the squared magnitude, will simplify the spectral structure and the associated analysis.
The peak at F1 is usually present for nearly all accelerometer spectra, and the F2 peak typically appears for longer stakes and stronger wind conditions. The signal to noise ratio (SNR) of the peaks is determined by the wind speed and the stake geometry, with stiffer stakes requiring stronger winds to achieve a good SNR. As a rough benchmark, the field tests presented in Sect. 6 employ a 2 m stake that recorded data over a week. The F2 peak is present during approximately 25 % of the measurements, and roughly 70 % of the measurements (both F1 and F2) have SNR greater than three.
The process of finding F1 begins with identifying all peaks in the spectrum, defined as local maxima that are at least five times the global noise level and at least three times the local noise level. From this list of candidate peak frequencies f, the location of F1 is determined by finding the lowest-frequency peak fi for which the corresponding amplitude is the highest between 0 and 2fi. Then, F2 is identified by searching for a set of three peaks from f located at F2−F1, F2, and F2+F1. Candidate F1 and F2 frequencies are computed for all chunks, and the values that are most consistent across the chunks are averaged together for the data recording period. The error on each averaged frequency measurement is taken to be the larger of the computed error on the mean, or the frequency resolution of the spectrum. The averaged F1 and F2 values are each used to compute L, and a weighted average of those L values yields the final length measurement of the stake. The error on L is obtained by numerically propagating the errors from F1 and F2 via the variance propagation formula.
BRACHI was initially tested by clamping a mass-balance stake at various points along its length against a table and manually inducing vibration. Length measurements were calculated from accelerometer data using the methods described in Sect. 4. The stake used for initial testing was a hollow tube made of aluminum T6061 with assumed values of E=69 GPa and ρ=2.7 g cm−3 (Summers et al., 2015). The outer and inner radii were measured respectively as 1.28±0.02 and 1.02±0.02 cm with calipers. The BRACHI mass was measured as 677±1 g with a scale.
5.1 Accelerometer tests
Figure 4 shows the measured frequencies of the first vibrational mode against the derived lengths, compared with the physical prediction. The measured and predicted frequencies agree within ∼ 0.1 Hz for lengths above 1.2 m, but the differences increase at shorter lengths. This discrepancy likely arises from limitations of the lab setup such as non-rigidity in the clamping point, which effectively increases the stake length and lowers the vibrational frequency. A perfect lab setup would enforce zero displacement and bending at the stake clamping point. Below 1.2 m, the differences between measured and predicted frequencies correspond to errors in derived length that span roughly 2–4 cm. This level of error lies below the target accuracy of 5 cm. Nevertheless, to minimize these systematic uncertainties, we recommend using stakes that support a first vibrational mode with a frequency below ∼ 7 Hz (which corresponds to a length of 1.2 m for the stakes described here).
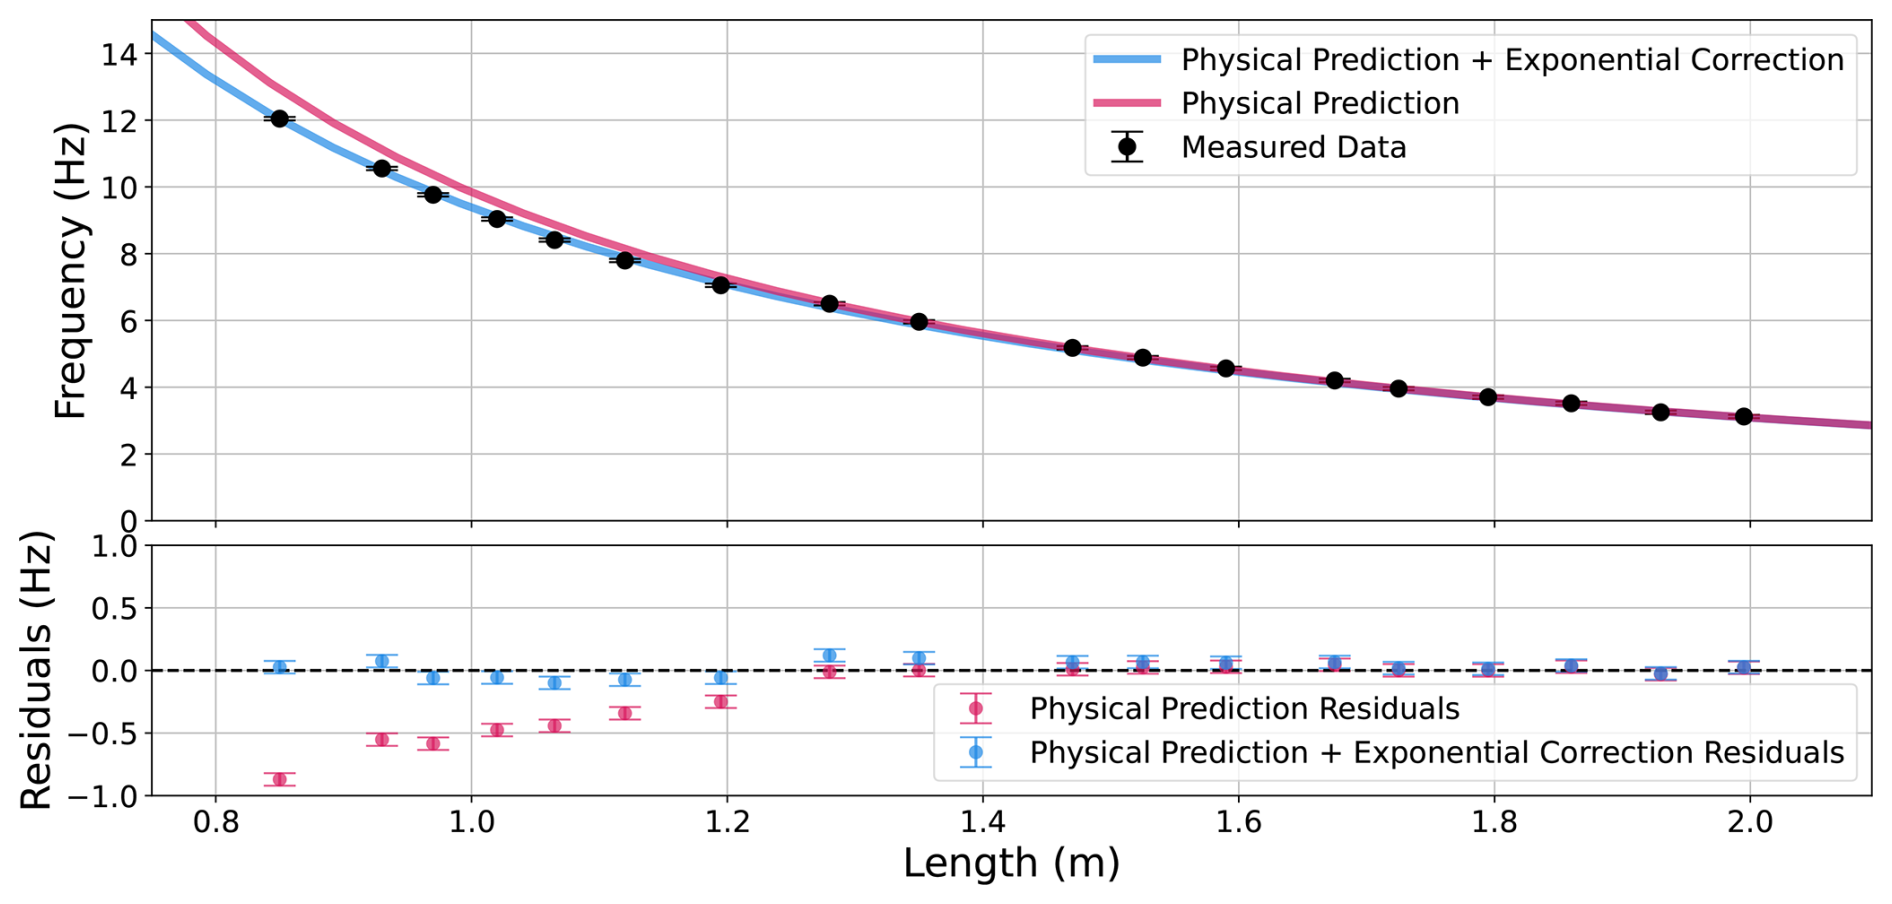
Figure 4Frequency versus length for the first vibrational mode of a BRACHI-equipped mass-balance stake that was tested in the lab. The stake was clamped at varying points to change the effective length, and vibrations were induced manually. Lengths derived from BRACHI accelerometer data agree well with the physical prediction at ≳ 1.2 m. At shorter lengths, an exponential correction can be applied to improve the fit and quantify systematic errors.
The difference between the data and prediction can be characterized using an additive exponential correction of the form AeBL, where A and B are nuisance parameters. Including this correction improves the agreement at shorter stake lengths, and the fitted exponential can be used to quantify systematic errors. Although we demonstrate the improved fit with lab data, we find that the correction is unnecessary for our field data (Sect. 6) because the stake is seated more rigidly when embedded in ice, and most of the measurements use stakes with an exposed length of > 1 m.
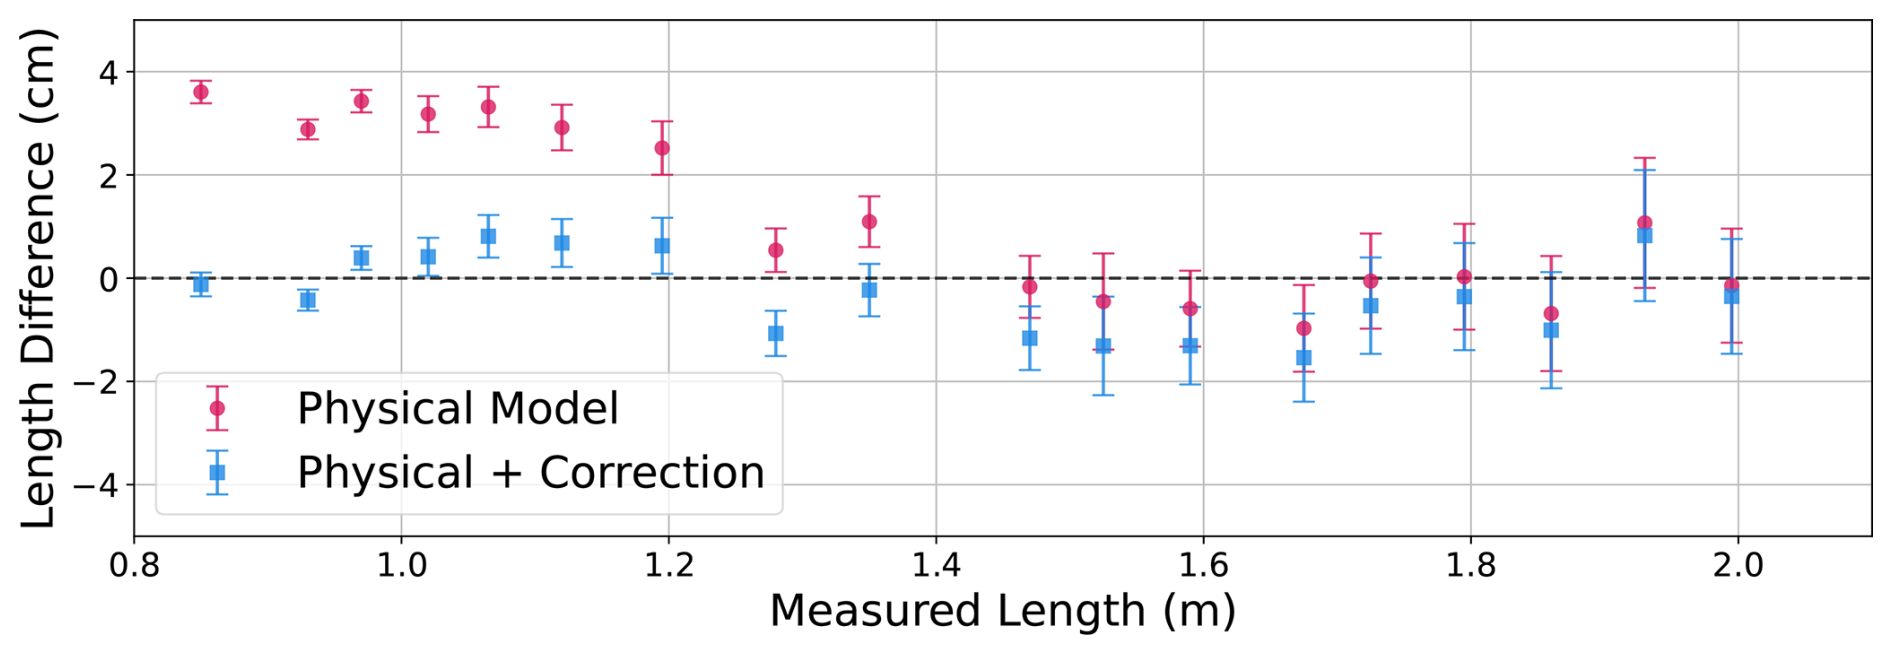
Figure 5Differences between lengths derived from accelerometer data and lengths obtained directly with a tape measure for a BRACHI-equipped mass-balance stake in the lab. The length measurements agree with a maximum absolute error of 0.5 cm at ≳ 1.2 m, and including an exponential correction yields similar errors at shorter lengths.
Figure 5 shows the difference between BRACHI-derived lengths and direct length measurements obtained with a tape measure. The length measurements agree well above ∼ 1.2 m, with no systematic offset, a mean absolute error of 0.5 cm, and root mean square (RMS) error of 0.7 cm. Including the exponential correction term yields similar accuracy below 1.2 m. As the stake length increases, the error bars widen because the frequency–length relation for the first vibrational mode flattens, making the derived length more sensitive to small deviations in the estimated frequency. Analysis of higher-order modes, if present in the data, may help improve the errors because of the steeper frequency–length relation. Overall, the lab measurements demonstrate that BRACHI data constrain stake length with sub-centimeter accuracy and centimeter-level precision. These estimates are slightly conservative because they include the error of the tape measure (with an estimated precision of 0.25 cm, given length reading to the nearest 0.5 cm).
To test the temperature dependence of the accelerometer, a BRACHI unit was frozen to −20 °C and allowed to warm back to room temperature (20 °C) while oscillating on a stake of constant length and temperature. No temperature dependence was observed in the accelerometer data: throughout the test, the recorded frequency was stable within 0.1 Hz, which is consistent with statistical uncertainties at constant temperature.
5.2 Distance sensor tests
The HC-SR04 distance sensor was tested in laboratory conditions by placing the sensor along a measuring tape and evaluating the distance to a flat wall. The standard deviation of repeated measurements at fixed length was 0.21 cm, which is slightly better than the quoted specification of 0.3 cm. The distance sensor differed systematically from the measuring tape by −1.6 cm m−1 with a standard deviation of 0.5 cm m−1. These effects are included in the distance sensor calibration and error computation for field data. Distance sensor measurements are also adjusted to compensate for the temperature dependence of the speed of sound, which is given by
In this expression, the sound speed vs has units of m s−1, the temperature T has units of Kelvin, and 331 m s−1 is the speed of sound in air at 273 K (Wong, 1986). Throughout the lab tests of the distance sensor, there were no indications of errors caused by reflections from the stake.
In May 2025, the BRACHI system was tested on three mass-balance stakes that were frozen into the ice of Colour Lake at the McGill Arctic Research Station (Pollard et al., 2009) on Umingmat Nunaat (Axel Heiberg Island), Nunavut. The purpose of this test was to validate BRACHI performance in Arctic field conditions, using a controlled ice surface that would stay at a nearly constant level over a week-long observation period. The stakes were embedded in the ice with nominal exposed lengths of 1, 2, and 3 m, with the 1 m pole having a 10 cm layer of snow at its base.
6.1 BRACHI comparison against direct length measurements
To assess the accuracy of BRACHI, lengths derived from accelerometer data and the distance sensor were compared against lengths obtained directly with a tape measure. This test was conducted over a 2 h period when the ambient temperature was below freezing and at a minimum over a 24 h diurnal cycle. The short period of data collection ensures a stable operating environment while probing instrument accuracy, and the low temperature ensures that the ice surrounding the stake is not actively melting. For this test, BRACHI was configured to record 120 s of data every 15 min, rather than every hour. Table 1 presents the comparison of measured lengths. The first and second vibrational modes of the accelerometer data are analyzed separately to assess consistency in derived lengths. During this short test, not all BRACHI length measurements were successfully recorded. The wind at the time did not excite the second vibrational mode in the 1 m stake, so the corresponding derived length is absent. The distance sensors on the 2 and 3 m stakes failed to detect the ice surface. A possible explanation is a combination of degraded performance at low temperatures near the specified operational limits, the roughness of the ice surface returning a diffuse echo, and sound damping from the snow layer before reaching the solid ice.
Table 1Comparison of stake lengths obtained with a measuring tape, accelerometer data (with the first and second vibrational modes analyzed separately), and distance sensor data. Measurements are presented for three different stakes over a 2 h test window.
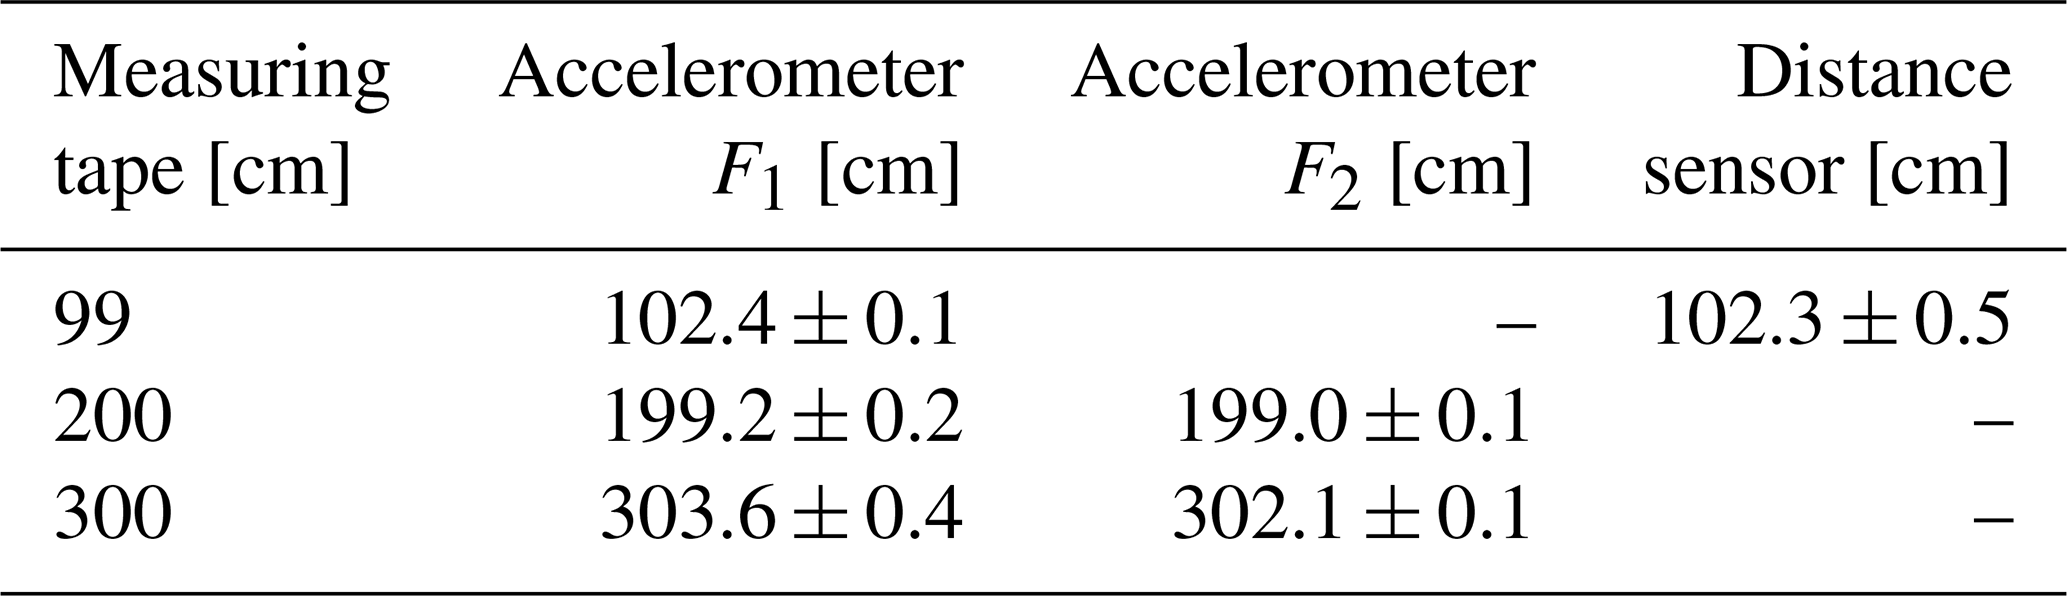
The frequency-derived lengths are broadly consistent with the tape measure, with differences up to ∼ 3 cm. These systematic differences are somewhat higher than those observed in lab tests and may be partially attributed to environmental sources of uncertainty, e.g., ice being an imperfect boundary condition for clamping the stake, uneven ice surfaces, and lower-amplitude vibrational excitations from the wind. The length measurements from the 1 m stake also suggest that the 10 cm layer of snow at the base did not constrain the vibrational motion, indicating that the ice layer determines the effective exposed stake length. Since this snow was loosely packed, further tests are required to understand the impact of other snow conditions. The BRACHI measurements from F1 and F2 are self-consistent within the mean value errors, which are sub-centimeter over the 2 h observation. The errors derived from F2 are slightly smaller than those derived from F1 because of the steeper frequency–length relation of the second mode.
6.2 Temporal variation of measured length
Figure 6 shows BRACHI data obtained from the 2 m stake over seven days. (Limited data are available for the 1 m stake because of low wind speeds at the test site, and the batteries on the 3 m stake were inadvertently drained by repeated wireless access attempts.) Accelerometer-derived lengths computed from the first and second vibrational modes are shown separately to assess consistency and to illustrate how often each mode is excited under these particular test conditions. When both vibrational modes are present, the corresponding length calculations agree within errors. The typical uncertainties on lengths derived from F1 and F2 are 1.3 and 0.14 cm, respectively. In the measurement period before 19 May 2025, the internal BRACHI temperature (which is a few degrees higher than ambient) was below freezing for the majority of the time. During this period, the stake lengths display variations at the level of 1–2 cm. These variations are not statistically significant in the length data derived from F1. Although the length data from F2 have significantly smaller statistical errors, the apparent temporal variation may include temperature-dependent systematic errors caused by environmental effects. For example, solar warming of the stake may partially heat the ice at the base, altering the boundary condition and the frequency of oscillation. The BRACHI electronics are excluded from causing this systematic effect, since the accelerometer measurements vary by ≲ 0.1 Hz over the full operating temperature range (Sect. 5), corresponding to an error that is roughly 25 times smaller than the observed temporal variation in frequency. The temperature dependence of the stake stiffness is also excluded as a cause since the effect is already included in the calculations. Although further testing is required to fully explain the apparent changes in length, the 1–2 cm level of variation is well below the target accuracy for BRACHI.
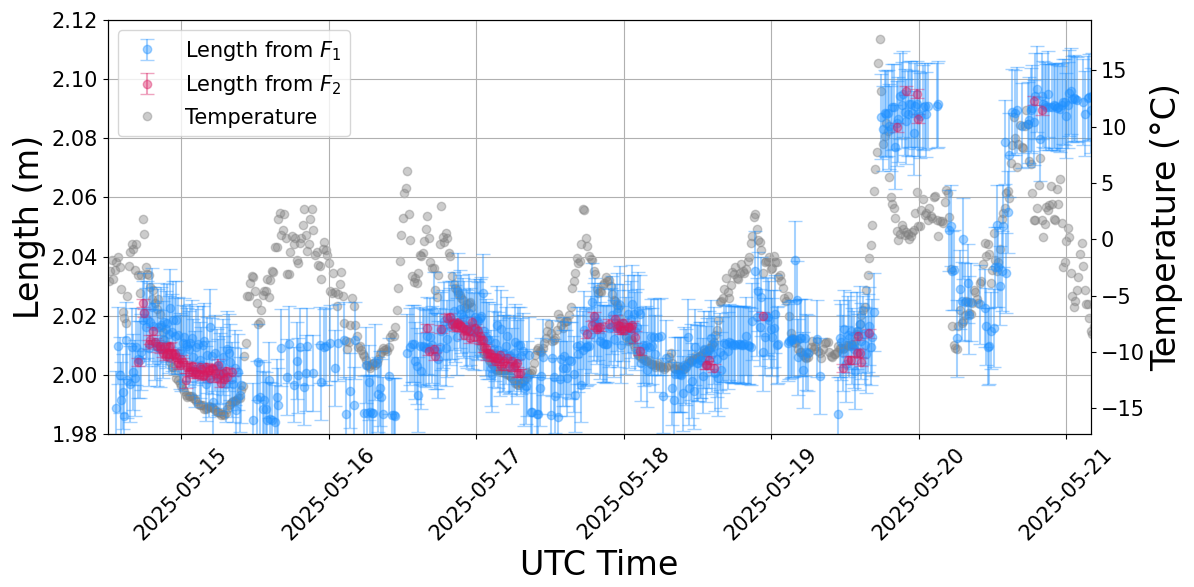
Figure 6Lengths derived from accelerometer measurements for the 2 m stake over a week-long observation, with the first and second vibrational modes analyzed separately. The length measurements vary over time, tracking the changes in temperature.
After 19 May 2025, the recorded temperature rose above freezing for longer stretches of time, and the measured stake lengths have larger temporal variations that track the temperature changes. A possible explanation is that when the temperature rose above freezing, a thin layer of localized ice melt was created near the base of the stake. Visual inspections of the stake at the time were not performed at this level of detail, and more careful visual confirmations will be included as part of future tests.
Although the distance sensor on the 2 m stake failed to report measurements for most of the observing time, the distance sensor on the 1 m stake was largely functional and reported length measurements that qualitatively track temperature changes. The distance sensor obtained readings that were consistent with the nominal 1 m stake length, thus suggesting that the sensor detected the ice at the base of the stake, rather than the 10 cm layer of loosely packed snow. The limited accelerometer data from the 1 m stake are insufficient to perform a robust comparison against the distance sensor. However, this test demonstrates that when environmental conditions allow the distance sensor to operate, the measurements serve as a valuable fallback when insufficient vibrations are excited in the stake.
We have conducted initial Arctic field tests with BRACHI and have shown that the system is capable of autonomously measuring the exposed lengths of mass-balance stakes via wind-induced vibrations. The system recorded data continuously over a week-long period during Arctic spring, and the accelerometer data yielded length measurements with centimeter-level precision, derived from the first vibrational mode. In some observing conditions when the second vibrational mode is excited, the measurement precision can improve to sub-centimeter. The main sources of systematic errors in the field are related to uncertainties in boundary conditions where the base of the stake is embedded in the ice. For example, localized melt can lower the point at which the ice meets the stake, thus increasing the effective length of the stake that supports vibrational motion. Further studies are needed to understand the types of boundary condition imperfections that arise in a wider range of field scenarios. Possible actions that can be taken to mitigate these imperfections include backfilling stake installation holes with water to allow the full volume to refreeze solid, and applying reflective coatings to stakes to minimize localized melt from solar warming. Nevertheless, the length measurements from accelerometer data demonstrate the successful proof of concept of BRACHI. This system is capable of continuous monitoring over extended periods of time and complements other automated measurement techniques of glacier surface melt by employing low-cost hardware while achieving comparable precision. Each BRACHI unit costs approximately USD 50, and the open-source hardware is fully serviceable.
The BRACHI distance sensor, a low-cost unit that is not rated for the full range of operating conditions, provided occasional readings that qualitatively agreed with results from the accelerometer data. We anticipate that the distance sensor will operate more reliably during the warmer Arctic summer months. This work will be the subject of a future publication that will discuss results from several BRACHI units that were installed on White Glacier during the 2025 melt season. We are currently revising the BRACHI design to incorporate an improved accelerometer and clock, reduce power consumption, increase sampling rates, and further lower the cost. Future work will include validating the new design, including more detailed tests of temperature dependence, and additional field tests with more robust distance sensors.
BRACHI's energy consumption can be estimated by the sum of its passive and active energy usage. When BRACHI is in low-power mode between data recording sessions, it consumes a constant 30 µA. While taking data, BRACHI consumes a maximum of 70 mA for a time period of
in units of seconds, where Nchunks is the number of data chunks requested from the accelerometer (typically 10), Nsamples is the number of accelerometer samples per data chunk (typically 2048), fsampling is the accelerometer sampling frequency (typically 200 Hz), and the added 2 s represents the measured time that BRACHI requires for computations and saving the data. Assuming that BRACHI records data every 4 h and uses nominal sampling parameters, the resulting daily energy consumption is 14.3 mAh while active and 0.7 mAh while passive, yielding a total of 15 mAh. Using 6 Energizer L91 AA lithium batteries in two parallel sets of three cells in series, each with a specified capacity of 3000 mAh at −30 °C, BRACHI can operate for 1.1 years.
A BRACHI-equipped mass-balance stake is modeled as an extended mass at the top end of a vertical hollow cylinder, using the Euler–Bernoulli beam model. Erturk and Inman (2011) show that the exact solution for the motion of the stake yields a partial differential equation with an infinite number of vibrational eigenmodes. The corresponding eigenvalues λn solve the equation
where Meff is the effective mass of BRACHI, L the exposed length of the stake that is free to move, ρ the density of the stake material, and R and r are the outer and inner stake radii, respectively. The effective mass is defined as
as given in Stokey (2002, Chap. 29). Here, μ(x) is the linear density of the box as a function of vertical position x, and ϕn(x) is the mode shape of the stake for the nth mode. The mode shape describes the displacement of the stake from equilibrium; the full expression is omitted here for brevity but is available in Erturk and Inman (2011). Since ϕn(x) and Meff depend on each other, solutions for each must be obtained iteratively. Starting with Meff=mBRACHI, a trial mode shape is determined and used to compute a new effective mass. This process is repeated until the effective mass converges to the desired precision. The Meff solution is used to solve for λn in Eq. (B1). The eigenvalues are related to the oscillation frequencies through the expression
where fn is the frequency of the nth vibrational mode of the stake and E is the temperature-dependent Young's modulus.
The BRACHI design files, control code, analysis code, and data gathered at MARS and in the lab are available on GitHub: https://github.com/FelixStA52/BRACHIOSAURUS (last access: 4 May 2026) or under the following DOI: https://doi.org/10.5281/zenodo.18292185 (St-Amour et al., 2026).
FS led the development of the BRACHI hardware and software, lab tests, data analysis, and manuscript writing. HCC provided guidance on hardware implementation, analysis and interpretation of the results, and assisted with writing. JC contributed to the design and testing of the first BRACHI prototype. EE contributed to the design of the electronics and circuit board. IH provided guidance on design requirements and assisted with writing. JR performed the measurements for the distance sensor calibration and wrote the associated analysis code. JS provided guidance on data analysis. LT conceived the BRACHI concept, provided guidance on system requirements and glaciology applications, led the Arctic field tests, and assisted with writing.
The contact author has declared that none of the authors has any competing interests.
Publisher's note: Copernicus Publications remains neutral with regard to jurisdictional claims made in the text, published maps, institutional affiliations, or any other geographical representation in this paper. The authors bear the ultimate responsibility for providing appropriate place names. Views expressed in the text are those of the authors and do not necessarily reflect the views of the publisher.
We are extremely grateful to Brandon Ruffolo, who provided test equipment and machined the BRACHI metal cutouts late in the day right before Christmas; Ben Cheung, who helped drill the holes in several of the BRACHI enclosures; Bo Curtis, who assisted with the Arctic deployment and tests; and Maya Smith, who provided feedback on the BRACHI documentation and GitHub resources. We extend our deepest thanks to Chris Omelon for supporting our work at the McGill Arctic Research Station. We acknowledge the Polar Continental Shelf Program for providing funding and logistical support, and we extend our sincere gratitude to the Resolute staff for their generous assistance and bottomless cookie jars. We thank McGill Branches for support through the IMPRESS program.
This research has been supported by the Natural Sciences and Engineering Research Council of Canada (grant nos. RGPIN-2019-04506 and RGPNS 534549-19), the New Frontiers Initiative (grant no. NFRFE-2021-00409), the National Geographic Society (grant no. NGS-94983T-22), the Canada 150 Research Chairs Program, and the Natural Sciences and Engineering Research Council of Canada Undergraduate Student Research Awards.
This paper was edited by Xabier Blanch Gorriz and reviewed by two anonymous referees.
Blevins, R.: Formulas for natural frequency and mode shape, Van Nostrand Reinhold Co., New York, https://doi.org/10.1121/1.384246, 1979. a
Bøggild, C. E., Olesen, O. B., Andreas, P. A., and Jørgensen, P.: Automatic glacier ablation measurements using pressure transducers, J. Glaciol., 50, 303–304, https://doi.org/10.3189/172756504781830097, 2004. a
Carturan, L., Cazorzi, F., Dalla Fontana, G., and Zanoner, T.: Automatic measurement of glacier ice ablation using thermistor strings, J. Glaciol., 65, 188–194, https://doi.org/10.1017/jog.2018.103, 2019. a
Cogley, J., Arendt, A., Bauder, A., Braithwaite, R., Hock, R., Jansson, P., Kaser, G., Möller, M., Nicholson, L., Rasmussen, L., and Zemp, M.: Glossary of glacier mass balance and related terms, vol. 86 of IHP-VII Technical Documents in Hydrology, International Hydrological Programme, Paris, France, https://doi.org/10.1017/S0032247411000805, 2010. a, b
Cremona, A., Huss, M., Landmann, J. M., Borner, J., and Farinotti, D.: European heat waves 2022: contribution to extreme glacier melt in Switzerland inferred from automated ablation readings, The Cryosphere, 17, 1895–1912, https://doi.org/10.5194/tc-17-1895-2023, 2023. a
Erturk, A. and Inman, D. J.: Appendix C: Modal Analysis of a Uniform Cantilever with a Tip Mass, in: Piezoelectric Energy Harvesting, John Wiley & Sons, Ltd, ISBN 9781119991151, https://doi.org/10.1002/9781119991151.app3, 2011. a, b, c
Hugonnet, R., McNabb, R., Berthier, E., Menounos, B., Nuth, C., Girod, L., Farinotti, D., Huss, M., Dussaillant, I., Brun, F., and Kääb, A.: Accelerated global glacier mass loss in the early twenty-first century, Nature, 592, 726–731, https://doi.org/10.1038/s41586-021-03436-z, 2021. a
Hulth, J.: Using a draw-wire sensor to continuously monitor glacier melt, J. Glaciol., 56, 922–924, https://doi.org/10.3189/002214310794457290, 2010. a
Immerzeel, W., Lutz, A., Andrade, M., Bahl, A., Biemans, H., Bolch, T., Hyde, S., Brumby, S., Davies, B., Elmore, A., Emmer, A., Feng, M., Fernández, A., Haritashya, U., Kargel, J., Koppes, M., Kraaijenbrink, P., Kulkarni, A., Mayewski, P., and Baillie, J.: Importance and vulnerability of the world's water towers, Nature, 577, https://doi.org/10.1038/s41586-019-1822-y, 2020. a
Landmann, J. M., Künsch, H. R., Huss, M., Ogier, C., Kalisch, M., and Farinotti, D.: Assimilating near-real-time mass balance stake readings into a model ensemble using a particle filter, The Cryosphere, 15, 5017–5040, https://doi.org/10.5194/tc-15-5017-2021, 2021. a
Østrem, G. and Stanley, A.: Glacier mass-balance measurements: a manual for field and office work, Canadian Department of Energy, Mines and Resources, http://publications.gc.ca/pub?id=9.608459&sl=0 (last access: 12 December 2025), 1966. a
Pollard, W., Haltigin, T., Whyte, L., Niederberger, T., Andersen, D., Omelon, C., Nadeau, J., Ecclestone, M., and Lebeuf, M.: Overview of analogue science activities at the McGill Arctic research station, Axel Heiberg Island, Canadian High Arctic, Planet. Space Sci., 57, 646–659, https://doi.org/10.1016/j.pss.2009.01.008, 2009. a
Sharp, M., Burgess, D. O., Cogley, J. G., Ecclestone, M., Labine, C., and Wolken, G. J.: Extreme melt on Canada's Arctic ice caps in the 21st century, Geophys. Res. Lett., 38, https://doi.org/10.1029/2011GL047381, 2011. a
St-Amour, F., Chiang, H. C., and Egan, E.: FelixStA52/BRACHIOSAURUS: v1.0.2 (Version v1.0.2), Zenodo [code], https://doi.org/10.5281/zenodo.18292185, 2026. a, b
Stewart, R. D., Hut, R., Rupp, D. E., Gupta, H., and Selker, J. S.: A resonating rainfall and evaporation recorder, Water Resour. Res., 48, https://doi.org/10.1029/2011WR011529, 2012. a
Stokey, R.: Vibration of Systems Having Distributed Mass and Elasticity, in: Harris' Shock and Vibration Handbook, 5th edn., edited by: Piersol, A. G. and Paez, T. L., McGraw-Hill, ISBN 978-0071370813, 2002. a, b
Summers, P. T., Chen, Y., Rippe, C. M., Allen, B., Mouritz, A. P., Case, S. W., and Lattimer, B. Y.: Overview of aluminum alloy mechanical properties during and after fires, Fire Science Reviews, 4, 3, https://doi.org/10.1186/s40038-015-0007-5, 2015. a
Wickert, A. D., Barnhart, K. R., Armstrong, W. H., Romero, M., Schulz, B., Ng, G.-H. C., Sandell, C. T., La Frenierre, J., Penprase, S. B., de Vries, M. V. W., and MacGregor, K. R.: Automated ablation stakes to constrain temperature-index melt models, Ann. Glaciol., 64, 425–438, https://doi.org/10.1017/aog.2024.21, 2023. a
Wong, G. S.: Speed of sound in standard air, J. Acoust. Soc. Am., 79, 1359–1366, https://doi.org/10.1121/1.393664, 1986. a
- Abstract
- Introduction
- BRACHIOSAURUS design
- Vibrational frequency and exposed stake length
- Data acquisition and analysis methods
- Laboratory measurements
- Arctic field tests
- Conclusions
- Appendix A: Detailed calculations of BRACHI power draw
- Appendix B: Detailed calculations of vibrational frequency as a function of length
- Code and data availability
- Author contributions
- Competing interests
- Disclaimer
- Acknowledgements
- Financial support
- Review statement
- References
- Abstract
- Introduction
- BRACHIOSAURUS design
- Vibrational frequency and exposed stake length
- Data acquisition and analysis methods
- Laboratory measurements
- Arctic field tests
- Conclusions
- Appendix A: Detailed calculations of BRACHI power draw
- Appendix B: Detailed calculations of vibrational frequency as a function of length
- Code and data availability
- Author contributions
- Competing interests
- Disclaimer
- Acknowledgements
- Financial support
- Review statement
- References