
the Creative Commons Attribution 4.0 License.
the Creative Commons Attribution 4.0 License.
 | 28 Oct 2026
Signal response of bare and moderated cosmic-ray neutron sensors to varying soil and biomass conditions

Cosimo Brogi
Markus Köhli
David McJannet
Jannis Weimar
Martin Schrön
Theresa Blume
Andreas Güntner
Since the first development of hectometre-scale soil moisture estimation using the epithermal(-dominated) neutron intensity from moderated Cosmic-Ray Neutron Sensing (CRNS) detectors, researchers have hypothesised that concurrent lower-energy, thermal(-dominated) neutron measurements with bare (unmoderated) detectors could also be useful for environmental sensing. Early studies in this field have highlighted the potential of neutrons observed with bare detectors for monitoring biomass, plant traits, and snow water equivalent, while others underlined a soil moisture dependence that can adversely affect their usability. Similarly, varying estimates of the radius and depth of the measurement footprint of thermal neutron observations compared to that of the standard epithermal CRNS observations have been proposed. However, a generalised simulation-based assessment of the signal response and of the footprint of bare detectors is currently lacking. Against this background, this study aims to generate an improved understanding of neutron signals recorded by bare and moderated detectors through the simulation of generalised environmental scenarios using a Monte Carlo neutron transport model. The results emphasise the complex and differing response of thermal-dominated, bare and epithermal-dominated, moderated neutron detectors over a range of environmental conditions with respect to their signal response and their sensitive measurement footprint. Following these results, we conclude that a paradigm shift is necessary on how we interpret these two types of neutron signals. Moderated and bare detector signals should not be treated as being independent from specific hydrogen pools due to a complex and sometimes counter-intuitive response to changes in soil moisture, biomass or snow water equivalents. For example, we confirm a partially opposing response of bare and moderated detector signals to biomass changes and a generally smaller horizontal measurement footprint of the bare detector. At the same time, the simulation results shed further light on empirical findings made in previous studies, set a baseline for an improved interpretation of locally observed neutron signals in future studies, and support the future exploration of potential environmental monitoring applications of bare and moderated detectors in the context of CRNS.
- Article
(8618 KB) - Full-text XML
- BibTeX
- EndNote


While a few earlier studies identified the potential for using low-energy secondary neutrons from cosmic rays to monitor changes in environmental hydrogen such as soil moisture and snow water equivalent (e.g., Kodama et al., 1979, 1985; Dorman, 2004), the method started gaining popularity since Zreda et al. (2008) and Desilets et al. (2010) introduced Cosmic-Ray Neutron Sensing (CRNS) as a methodological framework for estimating hectometre-scale soil moisture using cosmic-ray neutrons. Since the introduction of CRNS, numerous soil moisture observation networks based on this methodology have been established (e.g., Zreda et al., 2012; Hawdon et al., 2014; Evans et al., 2016; Bogena et al., 2022). At the same time, the understanding of the CRNS method has evolved and new mathematical approaches have been introduced for correcting observed neutron intensities for variations in air pressure, absolute air humidity, incoming high-energy cosmic radiation and biomass (Rosolem et al., 2013; Hawdon et al., 2014; Baatz et al., 2015; Köhli et al., 2021; McJannet and Desilets, 2023). Similarly, more accurate conversions of neutron intensities to soil moisture (Franz et al., 2013; Köhli et al., 2021) and snow water equivalent (e.g., Schattan et al., 2017, 2019; Bogena et al., 2020) have been developed and weighting schemes reflecting the spatial sensitivity of the CRNS technique enabled an improved comparability with independent soil moisture information from soil sampling campaigns or electromagnetic in-situ sensors (e.g., Franz et al., 2012; Köhli et al., 2015; Schrön et al., 2017, 2024). A recent review of the CRNS method can be found in Köhli (2026).
The CRNS method for estimating soil moisture and snow water equivalents relies on the measurement of low-energy cosmic-ray neutrons in the epithermal energy range (>0.25 eV to 100 keV) (e.g., Köhli et al., 2015) which are typically measured using a moderated detector, which is a neutron detector shielded with 25 mm thick high-density polyethylene (HDPE). Epithermal neutrons are highly sensitive to energy losses through elastic scattering processes with hydrogen until reaching thermal energies (≤0.25 eV) and eventually being absorbed. This leads to an inverse non-linear relationship between observed epithermal neutron intensities and environmental hydrogen stored in soil moisture and snow but also in soil organic matter as well as below and above-ground biomass. Early in the development of the CRNS methodological framework, Desilets et al. (2010) hypothesised that there could be some additional value in observing thermal energy range neutrons using an identical neutron detector but without the HDPE moderator (i.e. the bare detector). For neutrons in the thermal energy range, two key processes are relevant: elastic scattering, which slows down epithermal neutrons to thermal energies, and absorption of thermal neutrons by nuclei which reduces the abundance of these neutrons. These two processes lead to a different response of thermal neutrons to changes in environmental hydrogen and a difference in this response depending on soil chemical composition (Zreda et al., 2008). Compared to epithermal neutrons observed with moderated detectors, only a few studies have so far focused on thermal neutrons observed by bare detectors for CRNS applications. These studies have empirically demonstrated the potential for using thermal neutrons to estimate changes in biomass (Jakobi et al., 2018, 2022), leaf area index (LAI), plant height, plant area index (PAI) (Brogi et al., 2025; Al-Mashharawi et al., 2026) and snow water equivalent (e.g., Desilets et al., 2010; Bogena et al., 2020). Empirical findings were supported by simulation-based studies like that of Andreasen et al. (2017) who confirmed a different response of thermal and epithermal neutrons to changes in forest biomass and soil moisture with neutron transport modelling. Other simulation studies also found a different response of thermal compared to epithermal neutrons to changes in soil moisture (Zreda et al., 2008; Rasche et al., 2021).
As shown by Andreasen et al. (2016), the study of thermal neutrons and bare detectors is complicated by the fact that the signal of bare detectors also contains a fraction of epithermal neutrons. Similarly, the moderated detector signal also contains a fraction of lower-energy thermal neutrons. This mixed contribution complicates the comparison with findings derived from neutron transport modelling. One way to increase comparability, as proposed by Andreasen et al. (2016), is the derivation of site-specific linear correction functions for moderated and bare detectors to extract pure thermal and epithermal neutron signals. This is done through campaigns of simultaneous measurements with identical bare and moderated detectors with and without a cadmium shielding. The latter removes most of the thermal signal contribution of the individual detector and purer thermal and epithermal signals can be derived from measurements. Alternatively, simulations can be tailored to real detectors in post-processing by using detector-specific response functions (Köhli et al., 2018). This method employs an energy-dependent weighting of simulated signals from neutron transport simulations which does not require additional detectors, shielding equipment or measurement campaigns. Also, the same simulation can be used for multiple detector specifications (e.g., Köhli et al., 2021; Brogi et al., 2022) which reduces computational efforts.
While neutron transport simulations have helped us understand low-energy epithermal and thermal neutron fluxes in the context of CRNS, differences in evaluation approaches have occasionally resulted in inconsistent interpretations across the CRNS community. For example, Bogena et al. (2020) and Jakobi et al. (2021) focused solely on interactions in the thermal energy range when they estimated a horizontal measurement footprint for thermal neutrons of around 40 m from neutron transport simulations. These calculations were based on the position at which an epithermal neutron enters the thermal energy range before it reaches the detector. The study showed that soil moisture has little effect on thermal neutrons as the thermal footprint was rather insensitive to soil moisture changes. An alternative footprint definition was developed by Rasche et al. (2021) who used the point of first soil contact for simulated neutrons that reached the detector in the thermal energy range, consistent with the footprint calculation for epithermal neutrons. They found that this revised footprint definition led to more than double the size. An explanation is the sensitivity to soil moisture changes that predominantly affects the epithermal stage of the life of a neutron, which later reaches the detector as a lower-energy thermal neutron. The authors argued that this definition is more appropriate for the study of thermal neutrons and bare detector signals as it includes the entire life of a neutron after first soil contact. While both definitions are mathematically valid, their specific use cases and interpretations differ substantially. Additionally, both simulation approaches rely on specific energy windows that do not account for all neutrons measured by a bare detector, which is instead accounted for when using detector-specific response functions. Thus, the use of response functions could result in key differences for practical CRNS applications that have not yet been addressed.
Despite a growing number of empirical and theoretical studies highlighting the potential uses of thermal-dominated neutron signals from bare detectors, a thorough simulation-based assessment and comparison between the actual response of bare and moderated detector signals is still missing. Therefore, the objective of this study was to simulate the response of bare and moderated detector signals under a broad range of environmental conditions and explore the repercussions on real-world measurements. These conditions included different soil chemical compositions, soil bulk densities, biomass amounts and water layers on top of the soil. Detector response functions were used in place of energy windows to mimic the response of real-world detectors for enhanced comparability and transferability of the simulation results. With the results of this simulation-based study, we aim to set a baseline for the current understanding of neutron signals and CRNS measurements under varying environmental conditions which allows for (1) an improved interpretation of locally observed neutron signals from bare and moderated detectors in future studies, (2) a better understanding and validation of findings reported in previous studies and (3) a support for future exploration of the potential of bare and moderated detectors in the context of CRNS.
This simulation-based study used the URANOS v1.27 model (Ultra-Rapid Adaptable Neutron Only Simulation) (Köhli et al., 2015, 2023) to simulate the response of bare and moderated detectors under different environmental conditions as outlined in the following sections.
2.1 Simulation of detector response functions
Firstly, detector response functions (DRF) were simulated for bare and moderated detectors with HDPE moderator widths of 5 to 40 mm by placing individual detectors in a small model domain depending on the size of the individual detector setup and irradiating the virtual detector with source neutrons with individual energy levels using the detectorBatchRun2-command in URANOS (Köhli et al., 2018, 2023). For each detector model a DRF was simulated for different views (top or side) of the virtual detector. The final DRF per detector was then calculated as the average from the different views weighted by their contribution to the total surface area of the detector. Potential differences arising from the angular distribution of neutrons hitting the detector as well as due to a real detector being installed either vertically or horizontally are not fully represented by the use of DRF and pose a limitation of this approach. Also, all DRF were simulated using the same default boundary conditions (soil moisture =0.01 cm3 cm−3, bulk density =1.43 g cm−3, cutoff rigidity =5 GV, absolute humidity = 2.33 g m−3 and shielding depth = 1013 g cm−2) to ensure comparability between the DRF of the individual detector setups. These boundary conditions were kept constant because their variation would have negligible impacts given the fixed location of the neutron source and its short distance to the detector. The reference detector model for this study was the type CRS1000 (Hydroinnova LLC, USA) (Zreda et al., 2012) where the bare detector has a length of 35 cm and a width of 5 cm. The tube wall is composed of stainless steel with a thickness of 1 mm and the detector gas is 3He with a pressure of p=1.5 bar. Note that in the simulation setup, for simplicity, the detector tube was implemented as a rectangular feature and not as a cylinder. To account for the rectangular shape, the pressure of the 3He gas was internally scaled to an effective pressure of . The CRS1000 detector system is usually composed of a bare and a moderated detector with a 25 mm HDPE shield which is considered the standard moderated detector in the context of CRNS. However, in this study, the bare and moderated detector were simulated as solitary instruments and not in a co-located setup. This allows for more generalised results that can be valid for similar instruments like the CRS1000/B, in which the distance between the two detectors can potentially be modified. Nonetheless, a simplified comparison of bare detector response functions illustrating the influence of the co-located placement of a HDPE shielding of a moderated detector in 10 cm distance (same as the CRS1000) will also be presented.
2.2 Simulation of homogeneous setups
For investigating the response of both the bare and the moderated detector under different environmental conditions, we conducted simulations of 0.5 million source neutrons in a larger, 1000 m by 1000 m sized model domain with a cutoff rigidity of 3 GV, absolute air humidity of 10 g m−3 and shielding depth of 1032.9 g cm−2. For all simulation setups or unless otherwise stated, the standard soil matrix (75 % SiO2 and 25 % Al2O3) (Köhli et al., 2023) with a bulk density of 1.43 g cm−3 was used. The setups comprised simulation scenarios with soil moisture values of 0.01, 0.04, 0.08, 0.10, 0.12, 0.16, 0.20, 0.30, 0.40, 0.50 cm3 cm−3 in the 5 m soil column. If the soil porosity was lower than the simulated soil moisture value, e.g. in scenarios with higher soil bulk density, the maximum simulated soil moisture content was 0.40 cm3 cm−3. The denser distribution of soil moisture values around 0.10 cm3 cm−3 is related to findings in previous studies (e.g., Rasche et al., 2021) which found an increase of thermal neutron intensities in this range prior to a decrease for low soil moisture contents. The detector is implemented as a layer of dry air from 1 to 1.5 m height above the ground. All neutrons passing this layer are extracted and subsequently weighted according to the previously simulated DRF for bare and moderated detectors. Weights (detector sensitivity, see Fig. 2) for each neutron energy level from the simulated DRF were assigned by binning neutrons passing the virtual detector according to their energy and the specific energy levels modelled in the DRF simulations. For each simulation scenario, the assigned weights were subsequently summed to derive the DRF-weighted neutron counts. In all these simulation setups, different soil moisture contents, amounts of biomass, soil chemical compositions, water layers and soil bulk densities are implemented homogeneously throughout the model domain. A detailed description of the different homogeneous setups is given in the following sections. The vertical structure of the simulation setups is schematically shown in Fig. 1a–c for setups with biomass/vegetation and water layers on the soil surface.
2.2.1 Soil chemistry
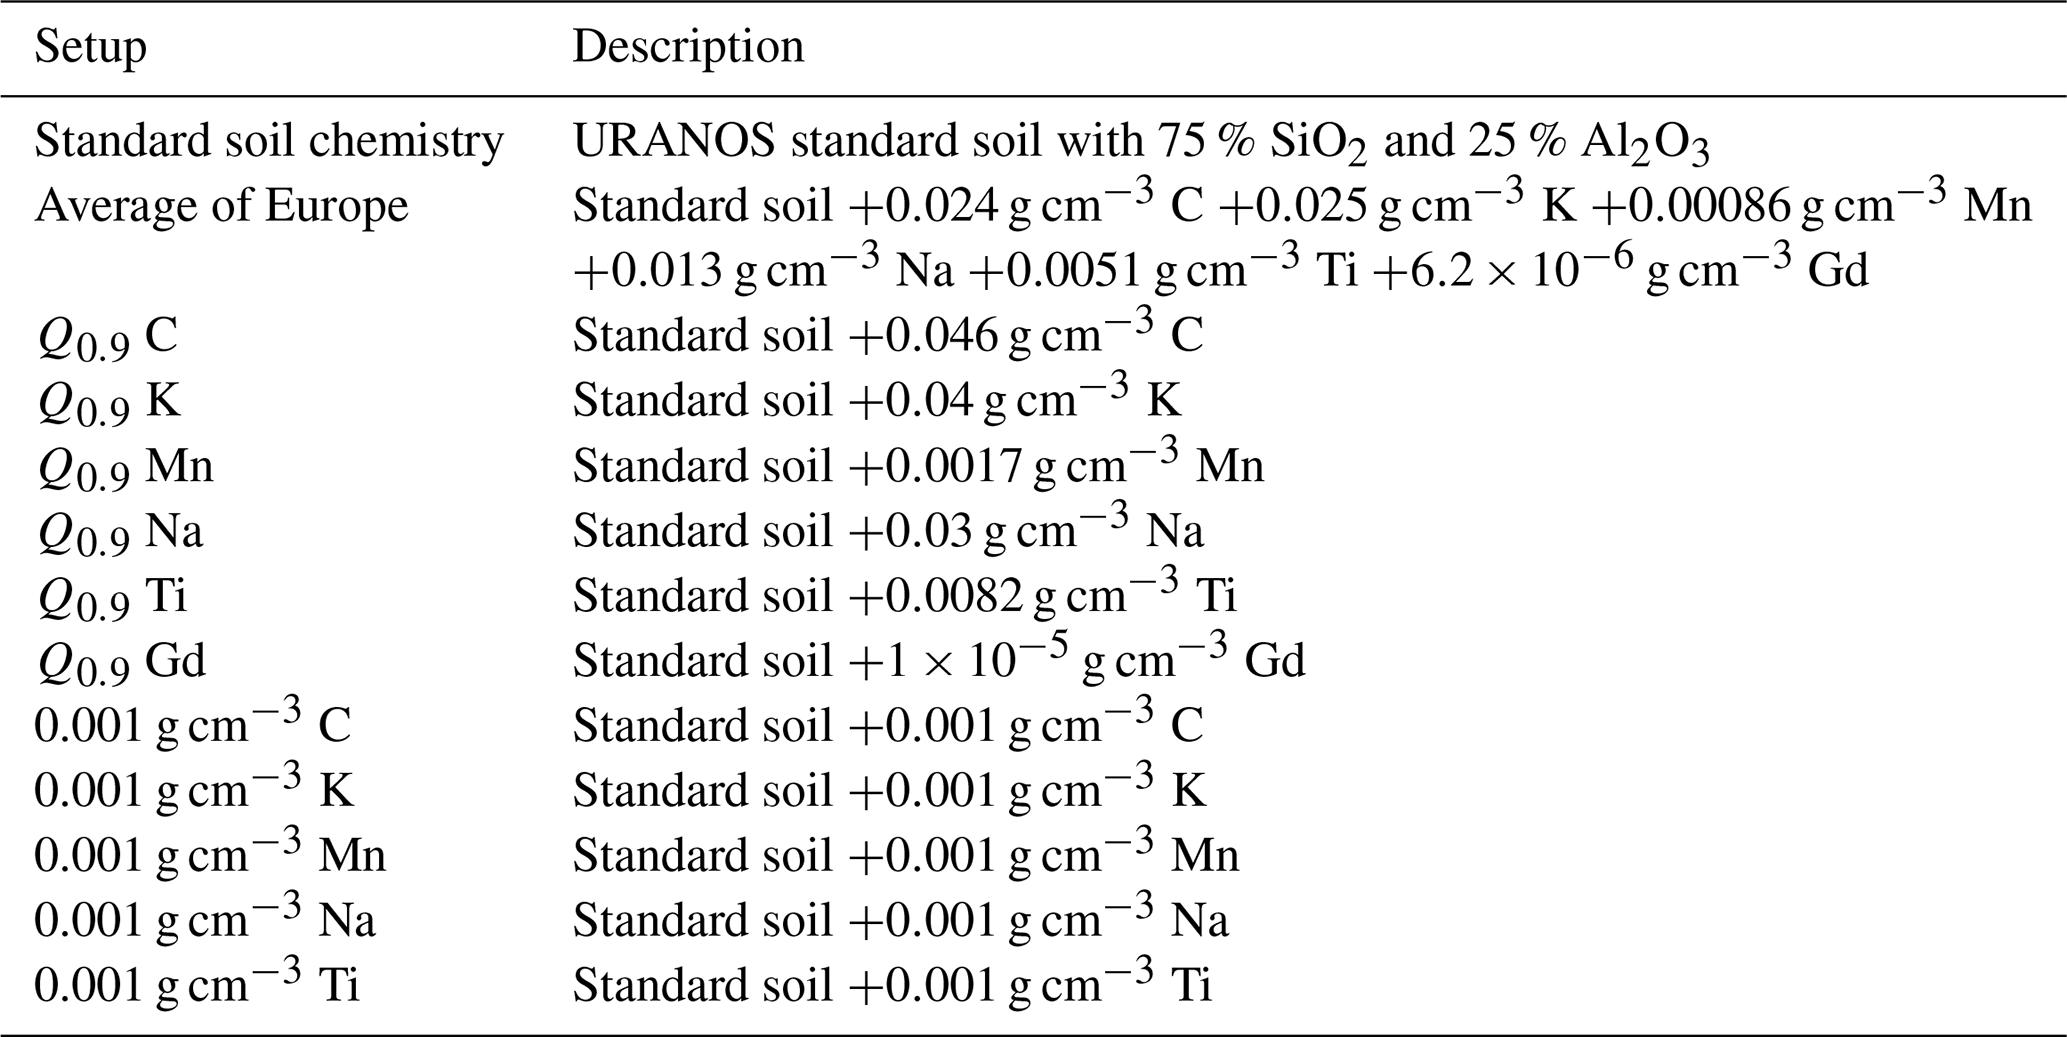
The first set of simulation scenarios focussed on the effect of variation in soil chemical composition. URANOS allows adding selected chemical elements to the standard soil. For this study we added C, K, Mn, Na, Ti and Gd to the standard soil. Here, we chose the average 90 %-quantile (Q0.9) for top and subsoil as well as the overall average of these elements reported in the Geochemical Atlas of Europe (Salminen et al., 2005). In addition, we simulated 6 setups by adding 0.001 g cm−3 of one element (C, K, Mn, Na and Ti) to the standard soil. Adding chemical elements to the standard soil in URANOS is designed for trace amounts up to 0.001 g cm−3. For adding larger amounts as reported in Salminen et al. (2005), we rescaled the bulk density of the soil in the simulation scenarios to maintain the same amount of solid soil material in the model domain. An overview of all soil chemistry scenarios can be found in Table 1.
Table 1Overview of the homogeneous simulation setups with different soil chemical compositions.
2.2.2 Biomass
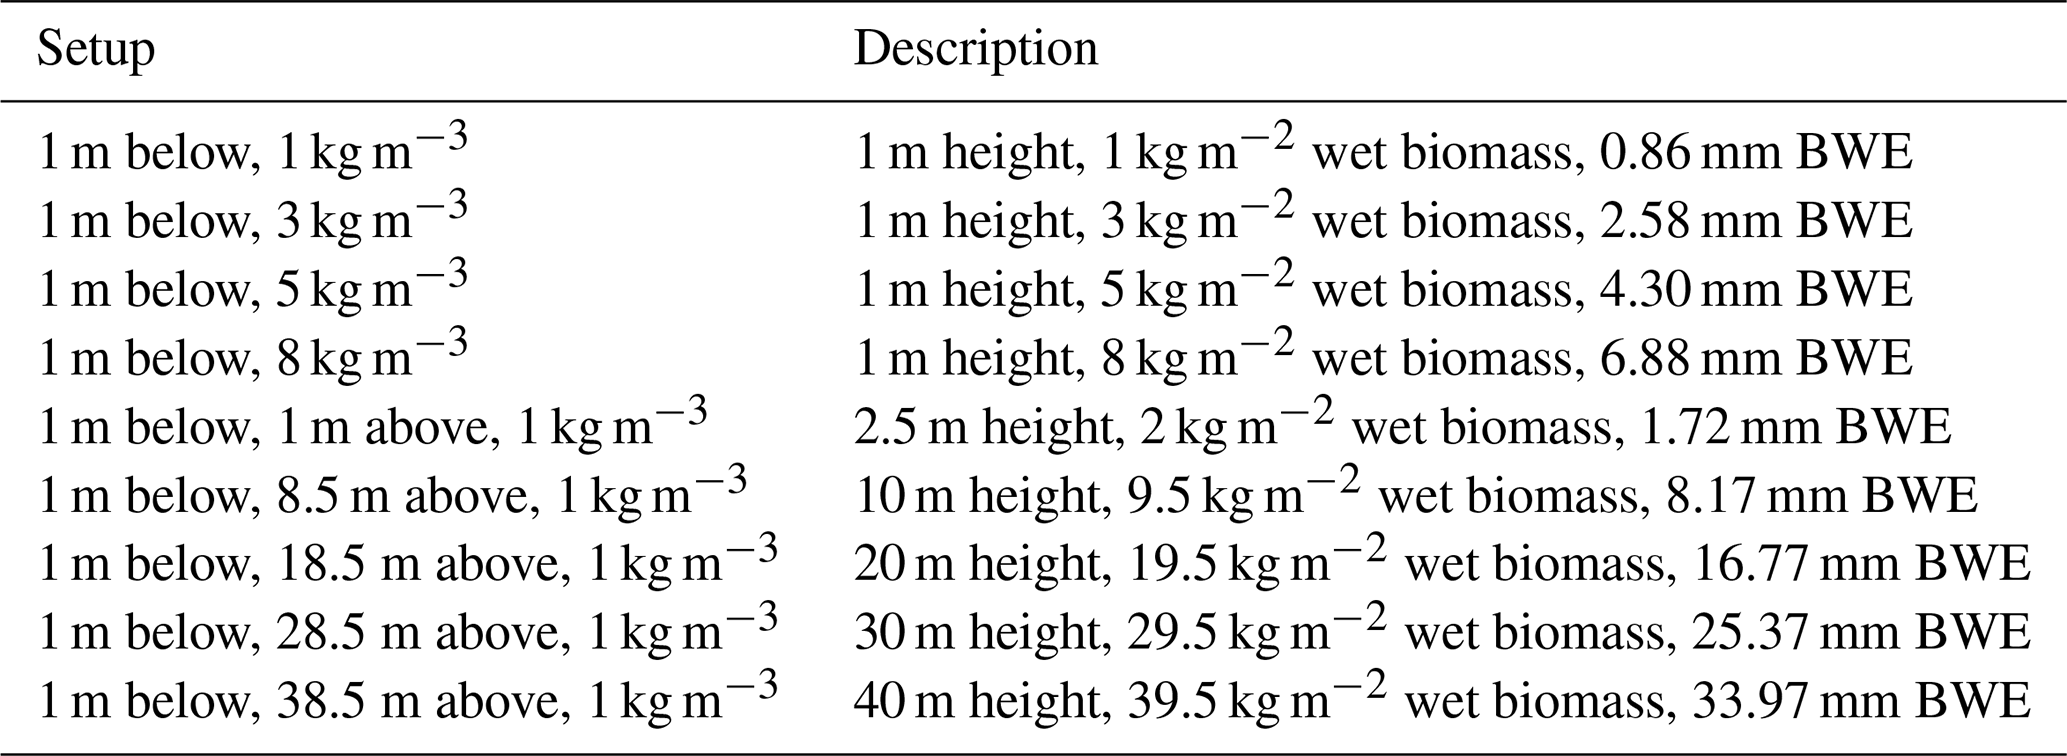
The second set of simulation setups involved the simulation of different amounts of above-ground biomass. Therefore, we added plant gas layers of different heights and densities below and above the detector layer within the model domain. The plant gas in URANOS (≥v1.0) consists of air plus a defined amount of C (14 %), O (72 %) and H (14 %) in kg m−3 representing biomass (Köhli et al., 2023). Hence, biomass water equivalents (BWE, in kg m−2 or mm) can be estimated from wet biomass (BM, in kg m−2) by multiplication with a conversion factor of 0.86. The use of homogeneous material layers to represent biomass in neutron transport models has been shown by Andreasen et al. (2017) to be sufficient for epithermal neutrons and is therefore adapted for this study. An overview of all biomass scenarios can be found in Table 2.
Table 2Overview of the homogeneous simulation setups with different amounts of above-ground biomass below and above the detector layer.
2.2.3 Water layers and soil bulk density variations
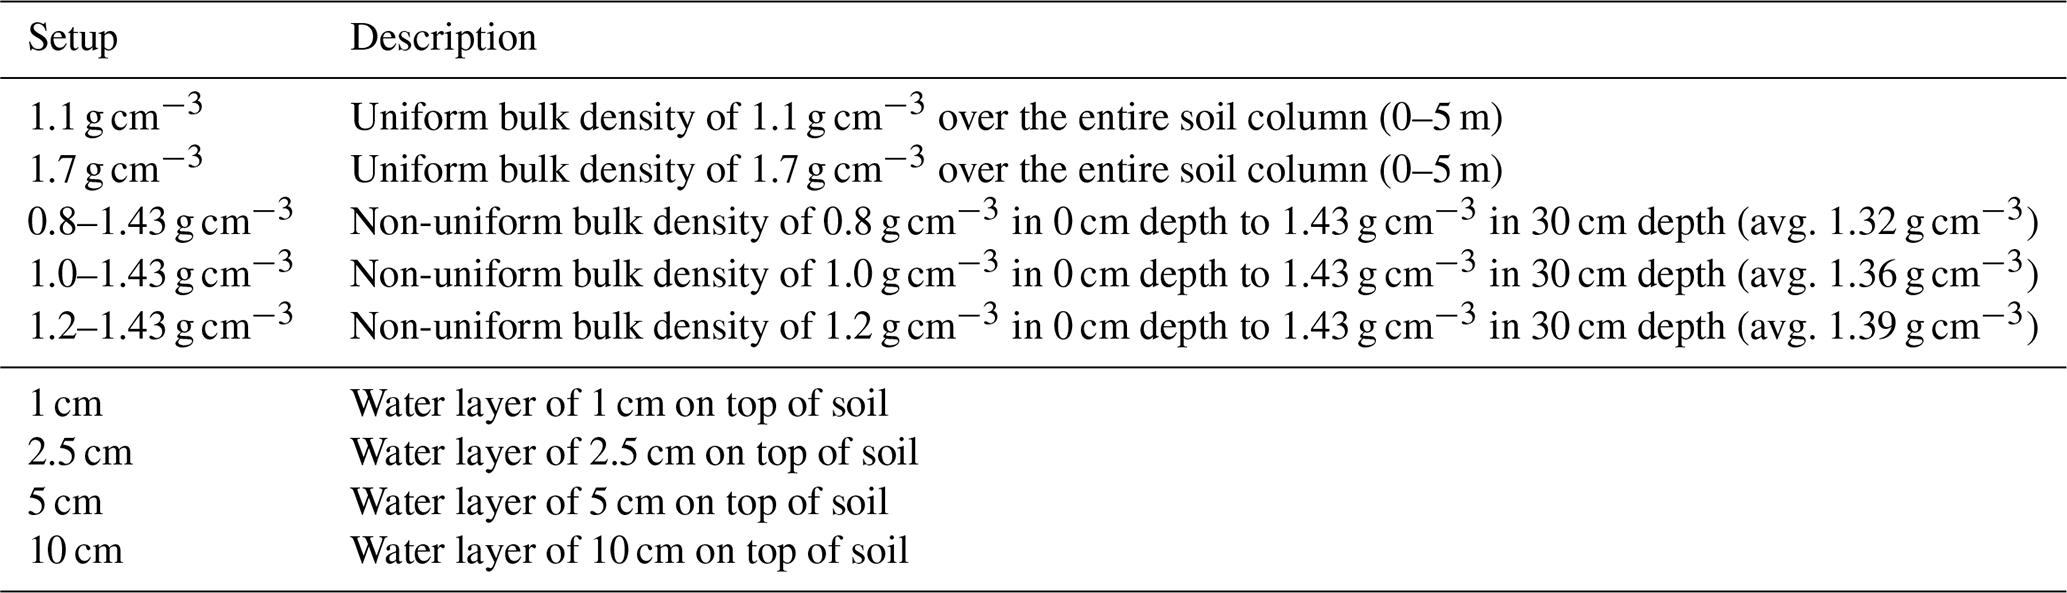
The last two sets of homogeneous simulation setups involved the variation of soil bulk density compared to the 1.43 g cm−3 of the standard soil and the addition of water layers on top of the soil to mimic snow and ponding water. For the soil bulk density scenarios, the bulk density was either changed in the entire soil column or as a more realistic gradual linear increase in soil bulk density from the surface to 30 cm depth in 5 cm increments. An overview can be found in Table 3. For the water-layer setups, an additional subset of different water layers above a soil with 0.04 cm3 cm−3 and an above-ground BWE of 33.9 kg m−2 was simulated, in order to investigate the impact of above-ground biomass on the response to snow and ponding water.
Table 3Overview of the homogeneous simulation setups with different soil bulk densities and added water layers on top of the soil.
2.3 Non-homogeneous setups: Simulation of the sensitive depth and radius
Established methods for defining the measurement footprint in CRNS research utilise the quantification of the terms D86 and R86 to quantify the measurement depth and radius, i.e., the depth and radius from which 86 % of detected neutrons originate. In neutron transport simulations these can be calculated from the point of first soil contact of a neutron to the location of the virtual neutron detector and the maximum depth reached during its lifetime (e.g., Köhli et al., 2015; Rasche et al., 2021) or by taking all neutron interactions in the model domain into account. It should be noted that when DRF are used to evaluate model simulations, the neutrons passing the virtual detector (see Sect. 2.2) as well as the calculated distances have to be weighted according to the DRF. Therefore, weighted quantiles are derived following the approach in Akinshin (2023) in order to determine D86 and R86.
While there is some consensus for epithermal neutrons, different approaches have been used for thermal neutrons and bare detectors. For example, Jakobi et al. (2021) use the point where a simulated neutron first reaches thermal energies which results in smaller footprints and shallower interaction depths than those for epithermal neutrons. Rasche et al. (2021) found that this definition would not explain the complete variability of thermal neutrons under heterogeneous soil moisture distributions and recommended using the same definition for epithermal and thermal neutrons. However, neither approach has yet been further evaluated.
Against this background, instead of using D86 and R86 for which we pre-define the quantile (e.g., 86 %-quantile) and the calculation parameters (e.g., calculated using the point of first soil contact or maximum soil depth), we conducted additional simulations to investigate the measurement footprint depth and radius without a pre-selected point to which distances are calculated. For investigating the footprint depth, we simulated multiple scenarios with a soil layer on top of a water layer. In each scenario the soil layer expands further downwards replacing more of the water layer underneath: in each scenario we sequentially replaced 10 cm of the water layer with soil.
The soil depth at which changes have less than 1 % impact on measured neutrons in the detector layer is used as a threshold for the definition of the footprint depth. In a similar manner, for the footprint radius, a soil island surrounded by water is simulated with a 10 m-radius virtual detector in the centre of the model domain. The smallest island has a radius of 20 m and with each additional simulation scenario, the soil island expands its radius by 20 m. The island radius at which changes have less than 1 % impact on measured neutrons in the virtual detector is used as a threshold for the definition of the footprint radius. Additionally, we simulated the radial expansion of clearing surrounding the virtual detector in a forest (vegetation height =15 m, BWE =38.7 mm) and shrub (vegetation height =2 m, BWE =5.2 mm) environment in 20 m increments to investigate potential differences compared to the scenarios with a soil island surrounded by water. A schematic illustration of the three non-homogeneous simulation setups is given in Fig. 1d–f.
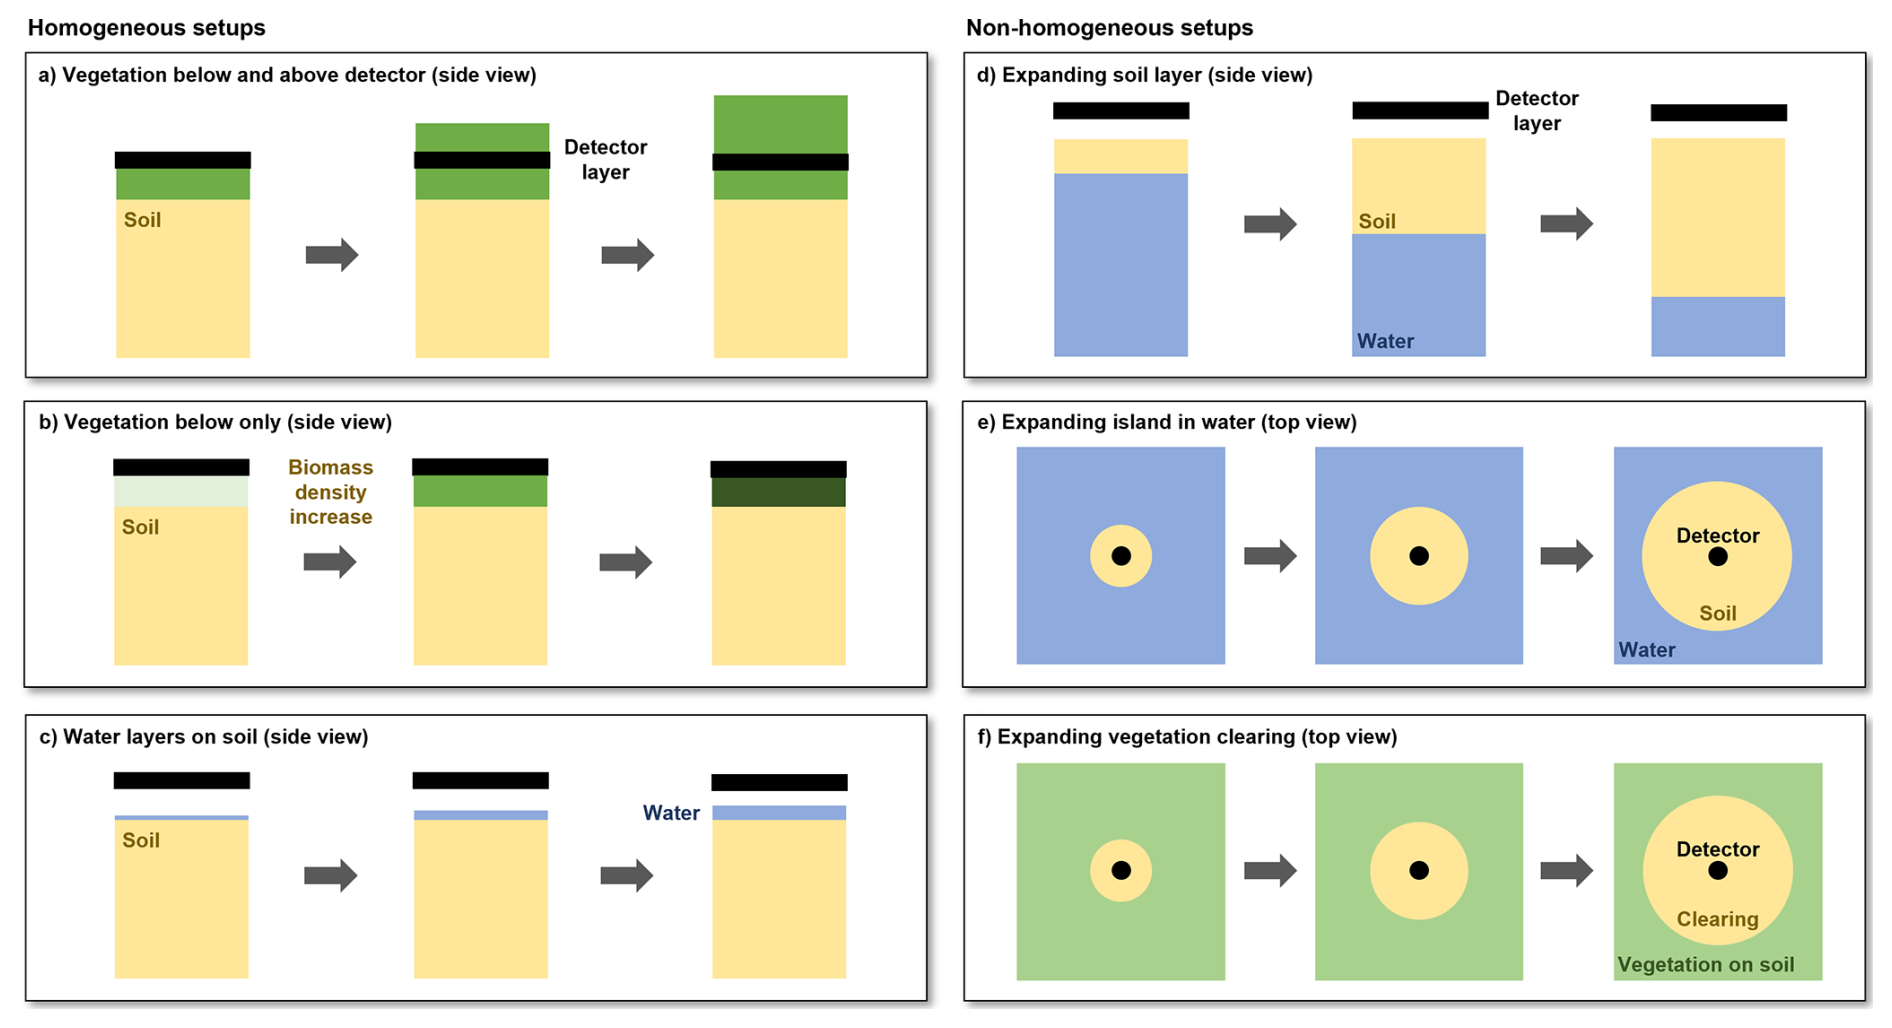
Figure 1Schematic illustration of selected homogeneous simulation setups with biomass and water layers on the soil (a–c) and of the non-homogeneous simulation setups with a vertically expanding soil layer (d), horizontally expanding soil island (e) and horizontal radial expansion of a clearing in a vegetated area (f).
3.1 Response functions of bare and moderated detectors
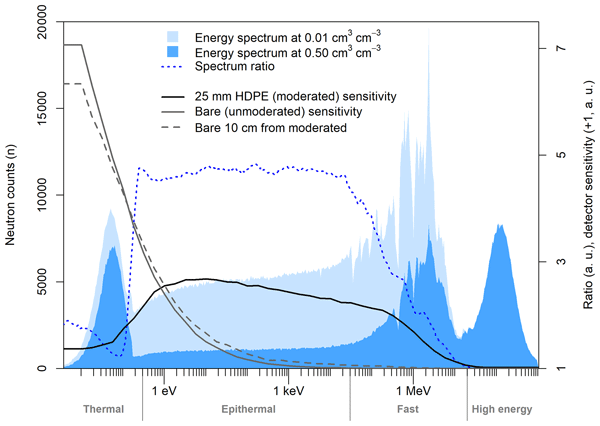
The simulated detector response functions for a bare and a moderated detector are shown in Fig. 2. The simulated detector response function of the moderated detector with a HDPE shielding of 25 mm is very similar to those simulated in previous studies (Köhli et al., 2018; Weimar et al., 2020; McJannet et al., 2025): it is most sensitive to neutrons in the epithermal energy range but also showing some sensitivity to lower-energy thermal and higher-energy fast neutrons. In contrast, the bare detector is most sensitive to neutrons in the thermal energy range. Despite its exponential sensitivity decrease towards higher energies, its signal also contains a fraction of epithermal neutrons, as shown by Andreasen et al. (2016). Depending on the CRNS detector setup, a bare detector may be installed in close vicinity to a moderated detector (Zreda et al., 2012). Due to the co-location with the HDPE shielding of the moderated detector, some impact of the neighbouring moderated detector on the bare detector signal can be expected. Figure 2 shows the impact of a co-located moderated detector with HDPE shielding (without 3He-filled detector inside) positioned 10 cm from the bare detector. Its sensitivity shifts slightly towards higher energies being less sensitive to the thermal and more sensitive to the epithermal energy range.
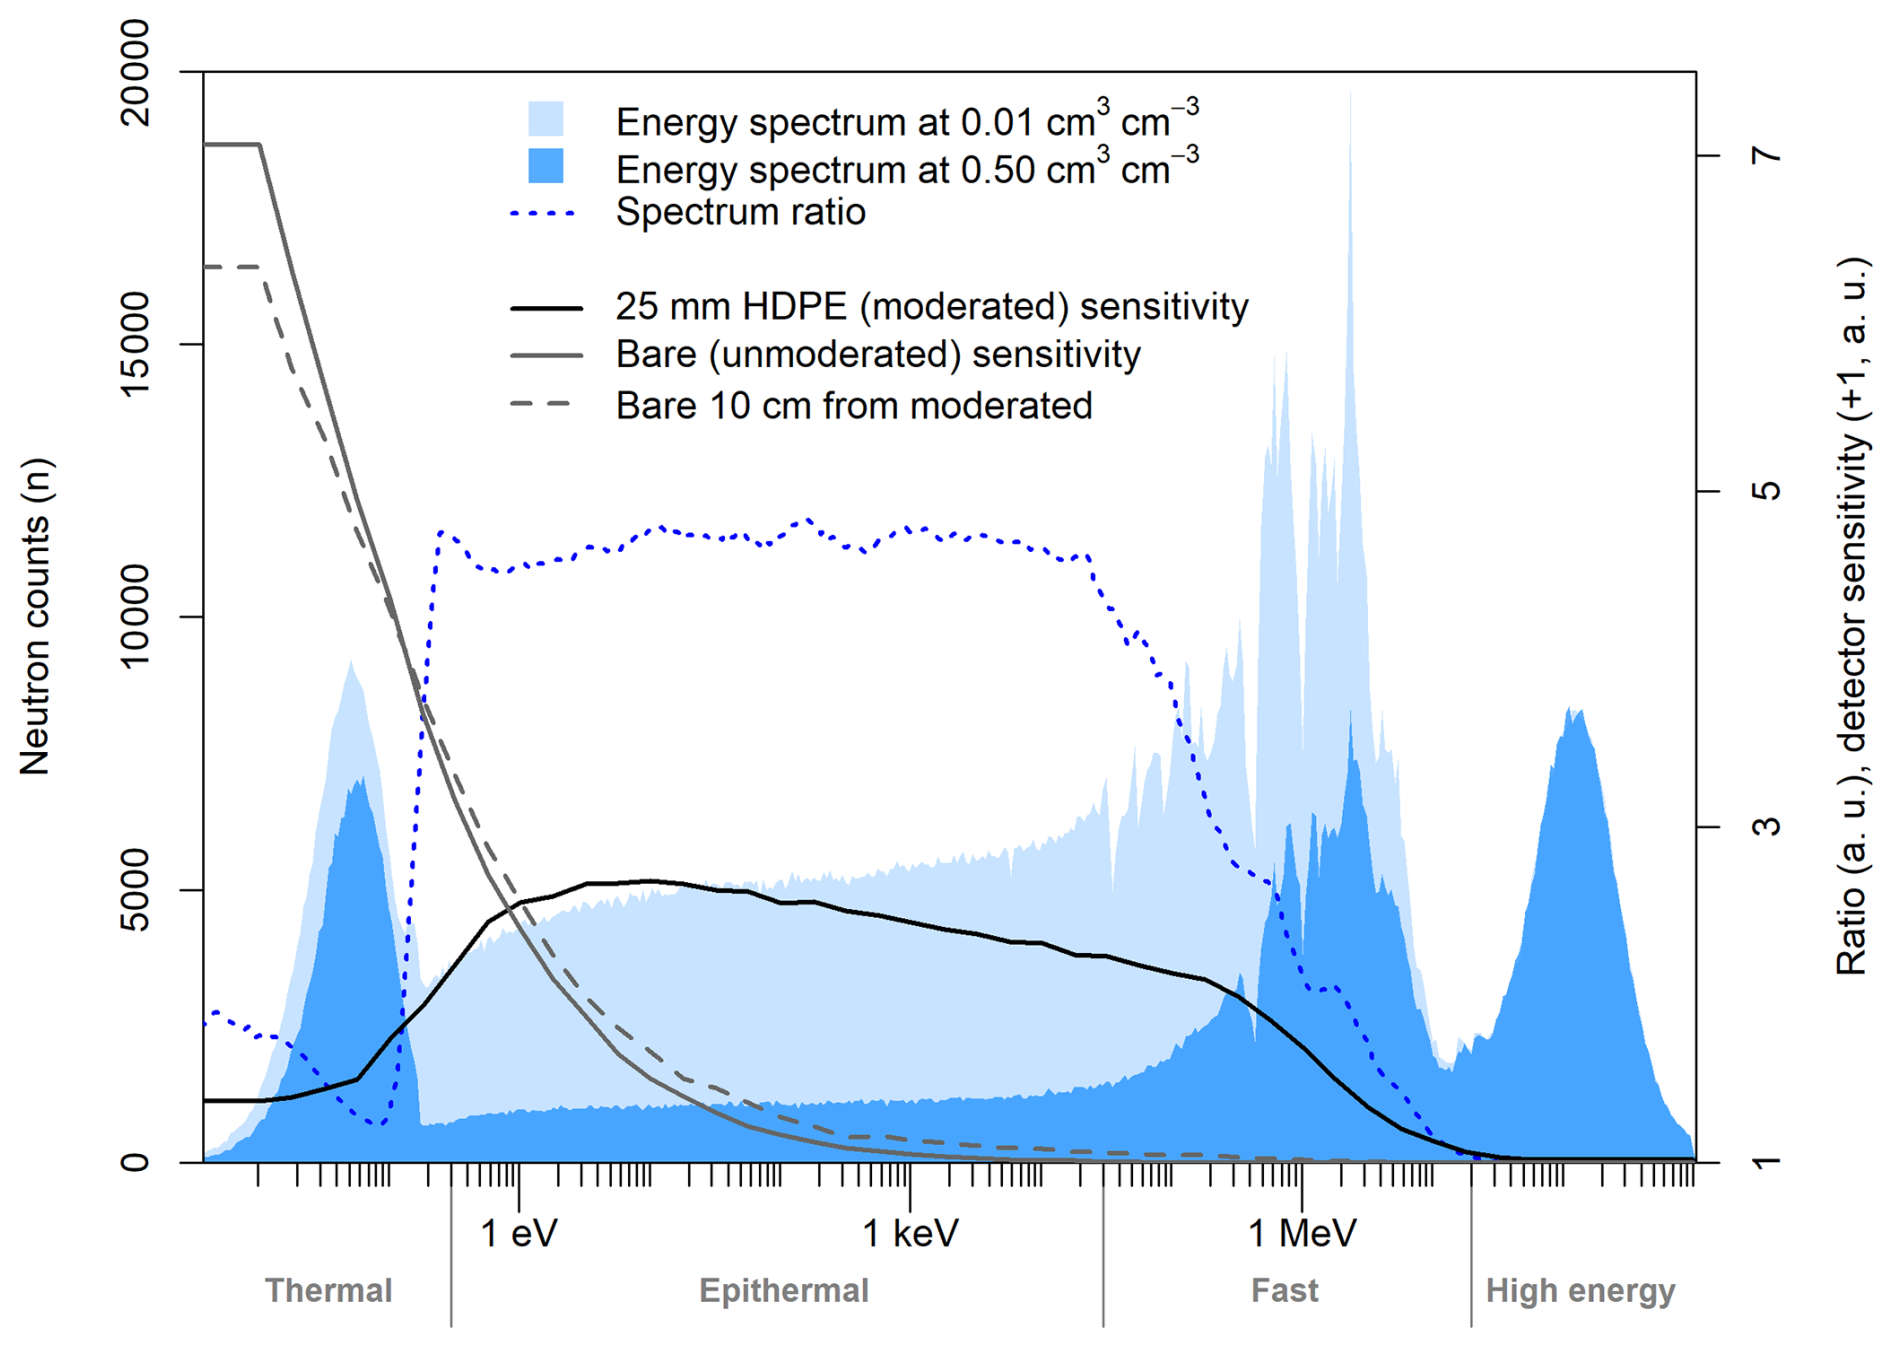
Figure 2Neutron energy spectrum for a standard soil with different soil moisture contents and their ratio. The detector response functions (detector sensitivity) are shown for a moderated detector (25 mm HDPE shielding), a bare detector and a bare detector placed in 10 cm distance from a moderated detector with 25 mm of HDPE shielding. Note that the step in the displayed detector sensitivity is due to the lowest simulated neutron energy in the simulation setups for deriving the DRF. For simplicity, the sensitivity is assumed constant for all lower neutron energies. The general classification of energy ranges follows Weimar et al. (2020).
The impact of using detector response functions to evaluate neutron transport simulations, instead of thermal or epithermal energy ranges, is illustrated in Fig. 3. The figure shows the signal response to changes in soil moisture. It is apparent how using a specific energy range (0.2 eV to 10 keV), also referred to as an energy window in some studies (e.g., Köhli et al., 2021), leads to a steeper response of the simulated neutron signal with increasing soil moisture compared to the use of a moderated detector response function (Köhli et al., 2021). Hence and as shown in Köhli et al. (2021), neutron-to-soil moisture conversion functions derived from neutron transport simulations differ if the simulations were evaluated with an energy window approach or DRF. This also means that energy-window based conversion functions are less accurate, since they do not account for the energy-dependent sensitivity of a real detector. In the case of thermal neutrons (below 0.2 eV) and of a bare detector response function, this difference in response to soil moisture changes becomes even more apparent. By using a thermal energy window, the neutron intensity first increases with increasing soil moisture and peaks at soil moisture values of 0.04 cm3 cm−3. This is followed by a continuous decrease with increasing soil moisture. Similar modelling results have been reported by Rasche et al. (2021) and Desilets et al. (2010). This moderation optimum is caused by the competing processes of slowing down (moderation) of epithermal neutrons to thermal energies and the absorption of thermal neutrons. From the soil moisture content where the moderation optimum occurs, absorption of thermal neutrons through the additional hydrogen in soil water exceeds their production through the slowing down of higher-energy epithermal neutrons. This moderation optimum is not present when a bare detector response function is applied as this results in a monotonic decrease of neutron intensity with increasing soil moisture. This can be explained with the contribution of hydrogen-sensitive epithermal neutrons to the bare detector signal and underlines the differences in modelling results when evaluating the simulations with a thermal energy window or a bare detector response function. As a consequence and depending on the simulation setup, conclusions which are drawn from neutron transport simulations may be different if a detector response function is applied or an energy window is used. The application of a detector response function further illustrates that the response of a bare detector located 10 cm distance from a HDPE shielded moderated detector becomes steeper compared to a solitary bare detector. This is related to some epithermal neutrons being slowed-down to thermal energies in the co-located HDPE moderator but are then back-scattered and subsequently detected in the bare detector. Additionally, the absolute intensity observed by the bare detector next to the HDPE shielding increases by ≈7 % averaged over all simulation scenarios shown in Fig. 3 compared to a solitary bare detector (not shown). This is in a similar range of experimental findings by Brogi et al. (2025) who report an increase of ≈8 % in periods where moderated detectors were placed in close vicinity to bare detectors in their study. However, it should be noted that, in the present study, the co-located HDPE shielding was simulated without a 3He-filled detector tube inside which reduces the comparability with a real setup where a moderated and bare detector are co-located. Furthermore, the angular distribution of neutrons, the orientation of the detector (vertical or horizontal) as well as where the additional HDPE is located are likely to have an effect on whether the bare detector counts more (due to more neutrons being slowed down by HDPE to thermal energies) or less neutrons (increased shielding). For practical applications, bare detectors should therefore be placed at sufficient distance (e.g. ≥30 cm) to the moderated detector or other hydrogen-rich objects such as tree stems to avoid large changes in the absolute intensity and changes of the response to e.g. soil moisture changes. If the object is much larger than the detector itself, this distance needs to be increased. The influence of co-located instruments on each other should also be kept in mind when comparing observations with results from this study, where both detector types were simulated as solitary instruments. Despite showing the potential effect of additional moderating material close to the bare detector, the DRF approach remains a simplification and a detector-specific analysis with more detailed detector geometries is required when assessing absolute detector count rates. Nevertheless, the described findings underline the importance of using a detector response function to evaluate neutron transport simulations for an improved comparison between neutron transport simulations and observed neutron data if other approaches such as the cadmium difference method used in Andreasen et al. (2016, 2020, 2023) are not suitable. Although it can be expected that some differences in the DRF will stem from the varying working principles, designs and geometries of different detectors, this is a smaller difference compared to the difference between using a DRF or an energy window when evaluating results from neutron transport simulations.
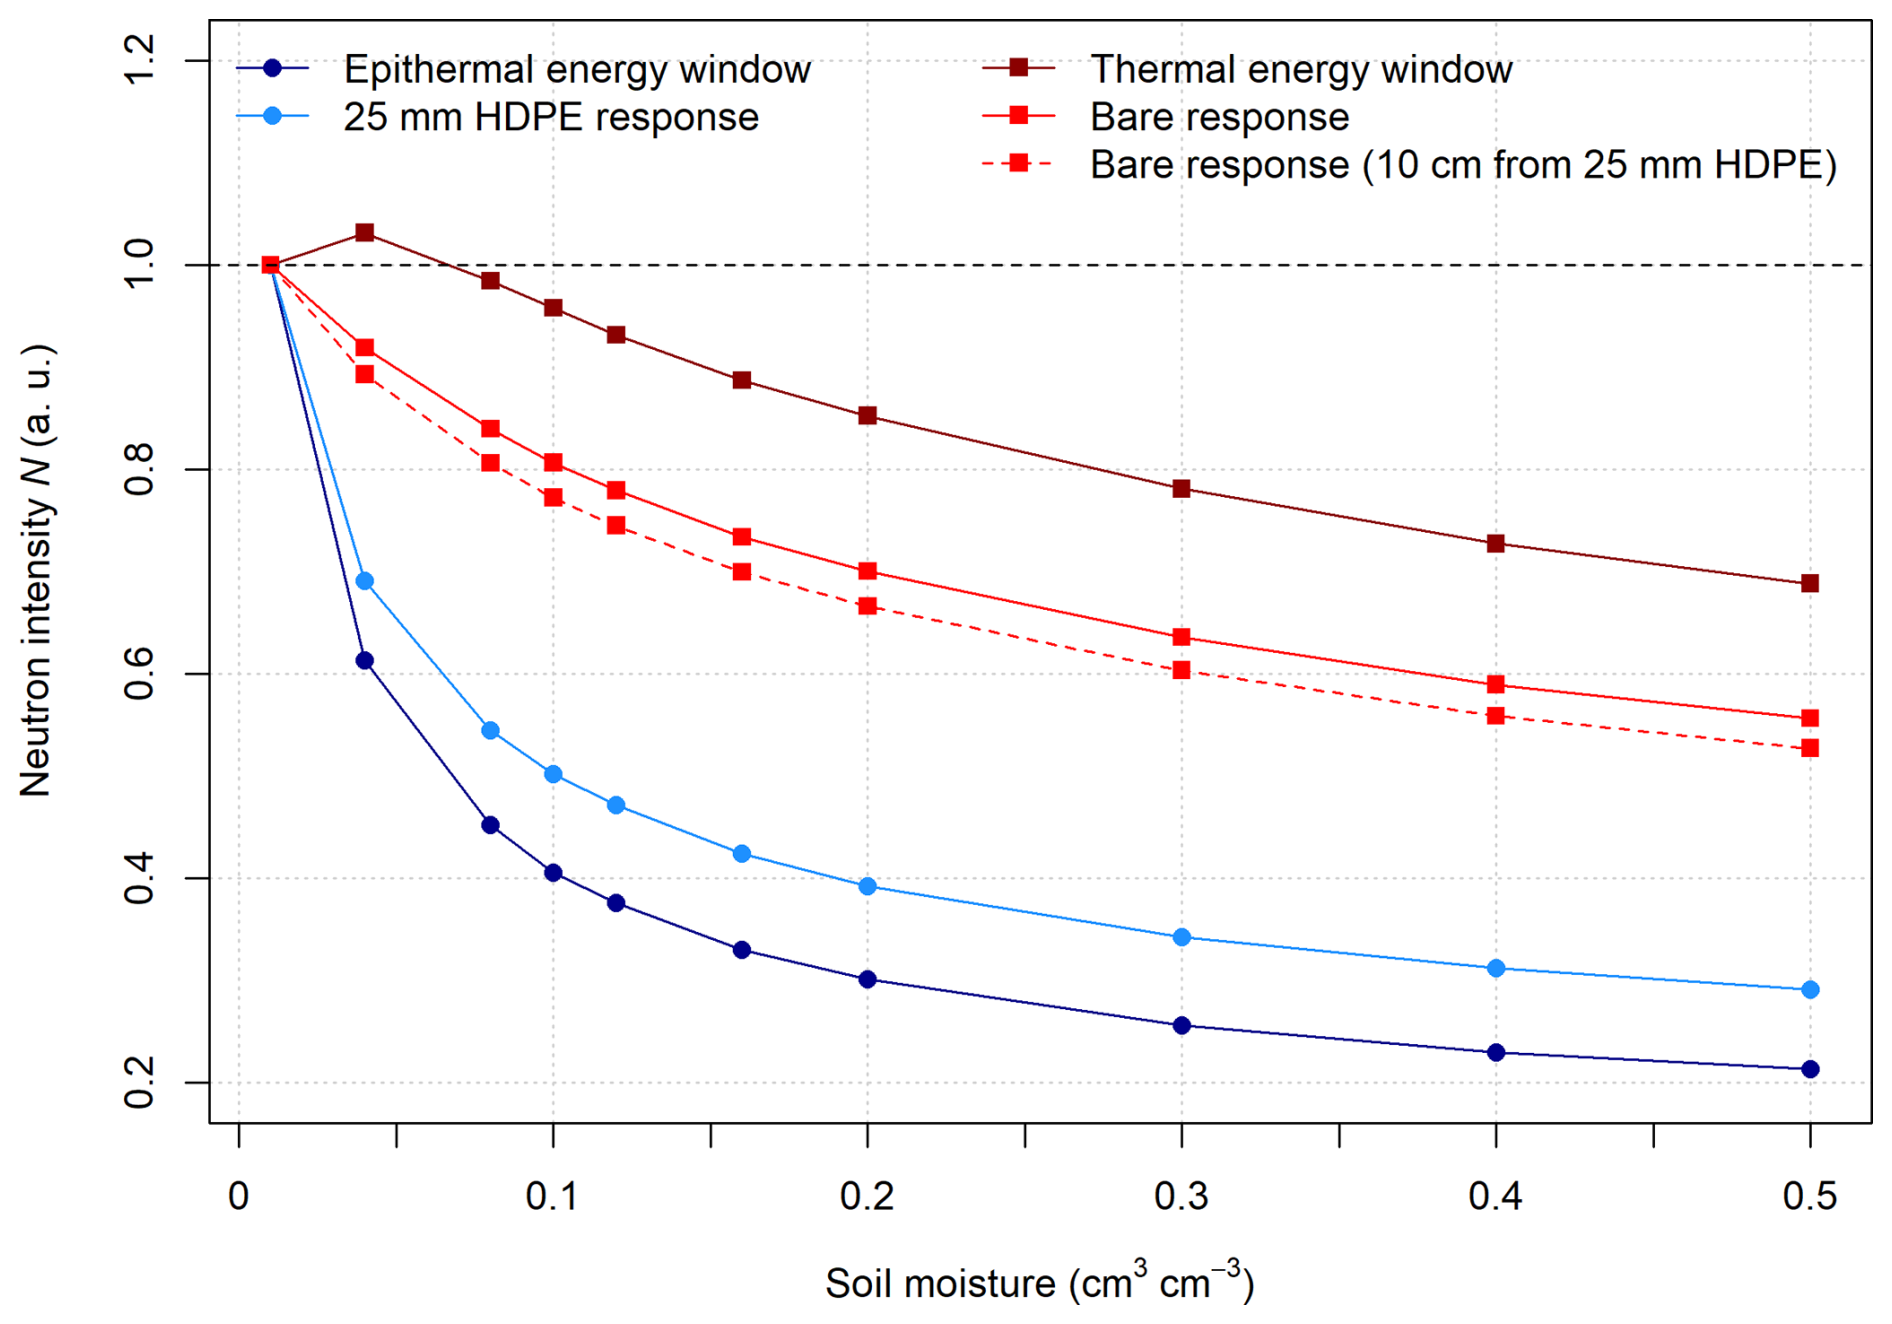
Figure 3Response of the relative neutron intensity to changes in soil moisture in a standard soil if a detector response function or the energy window approach are used.
3.2 Response to soil moisture changes under different environmental conditions
3.2.1 Neutron intensity response
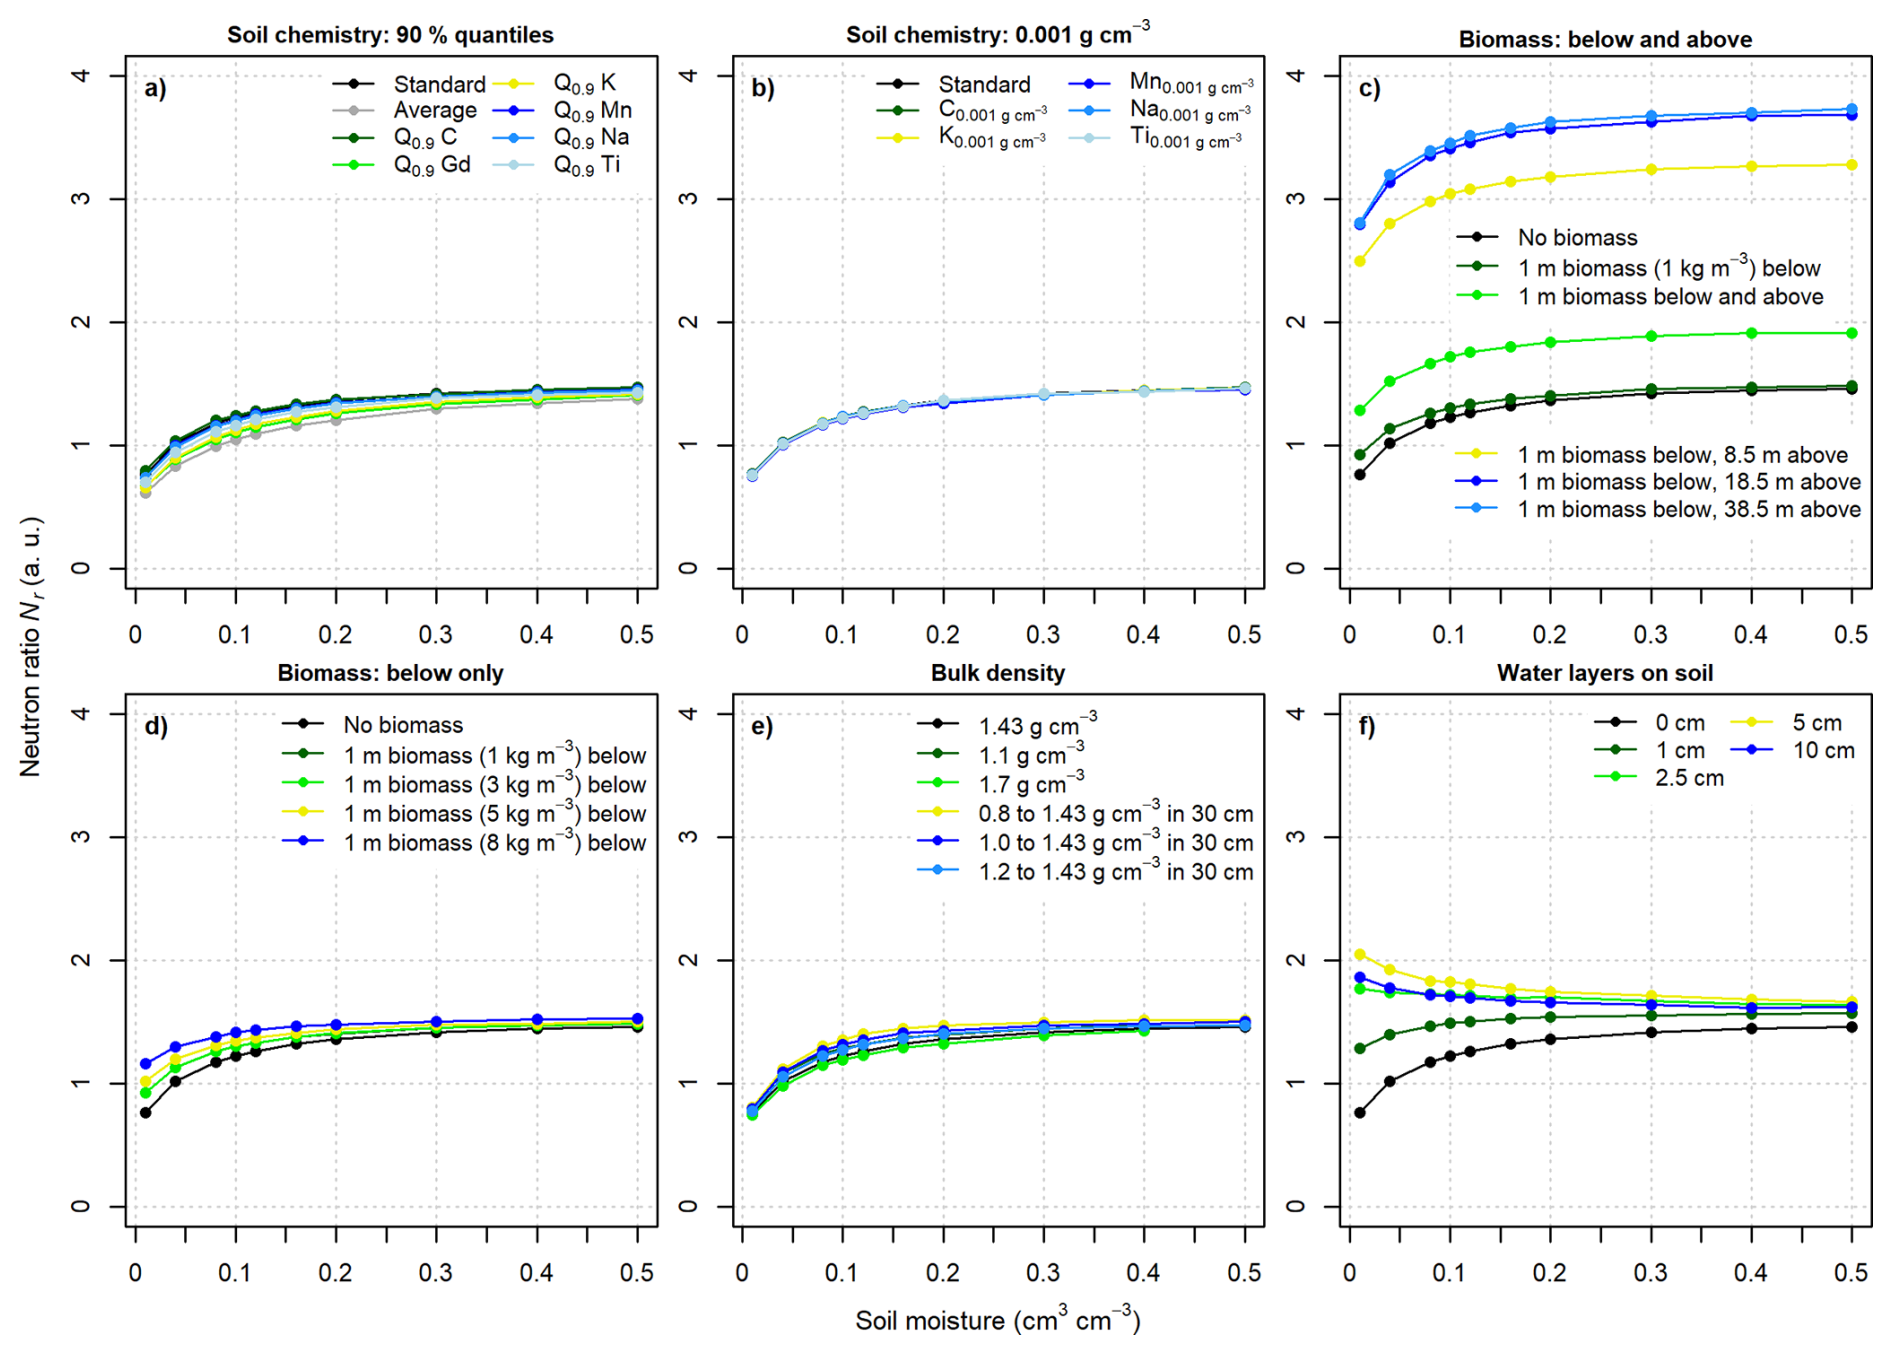
The response of a bare and moderated detector signal relative to the simulated intensity at a soil moisture content of 0.01 cm3 cm−3 in the individual setup (Tab. 1–3) is shown in Fig. 4 and relative to the individual average intensity in Fig. A1 for the homogeneous simulation setups. It can be seen that in all simulation setups, both the moderated and bare detector respond to changes in soil moisture. However, the bare detector response is less steep compared to the moderated detector and thus exhibits a lower signal-to-noise ratio, making it less favourable for the estimation of soil moisture, which is in line with simulation results from previous studies (e.g., Zreda et al., 2008; Andreasen et al., 2017; Rasche et al., 2021). As shown in Fig. 4a and b, the bare detector signal response to changes in soil moisture reveals a higher variability between simulation scenarios with different soil chemical compositions compared to the moderated detector with a 25 mm HDPE shielding. As a consequence, differences in soil chemical composition alter the response of the bare detector to changes in soil moisture while the moderated detector is much less affected. Although these results are in line with findings from previous studies (e.g., Zreda et al., 2008), it should be noted that the total amount of additional chemical elements added to the standard soil in the simulation scenarios partly exceeds the trace amounts (0.001 g cm−3) for which the respective URANOS functionality was designed and, hence, these results come with additional uncertainty.
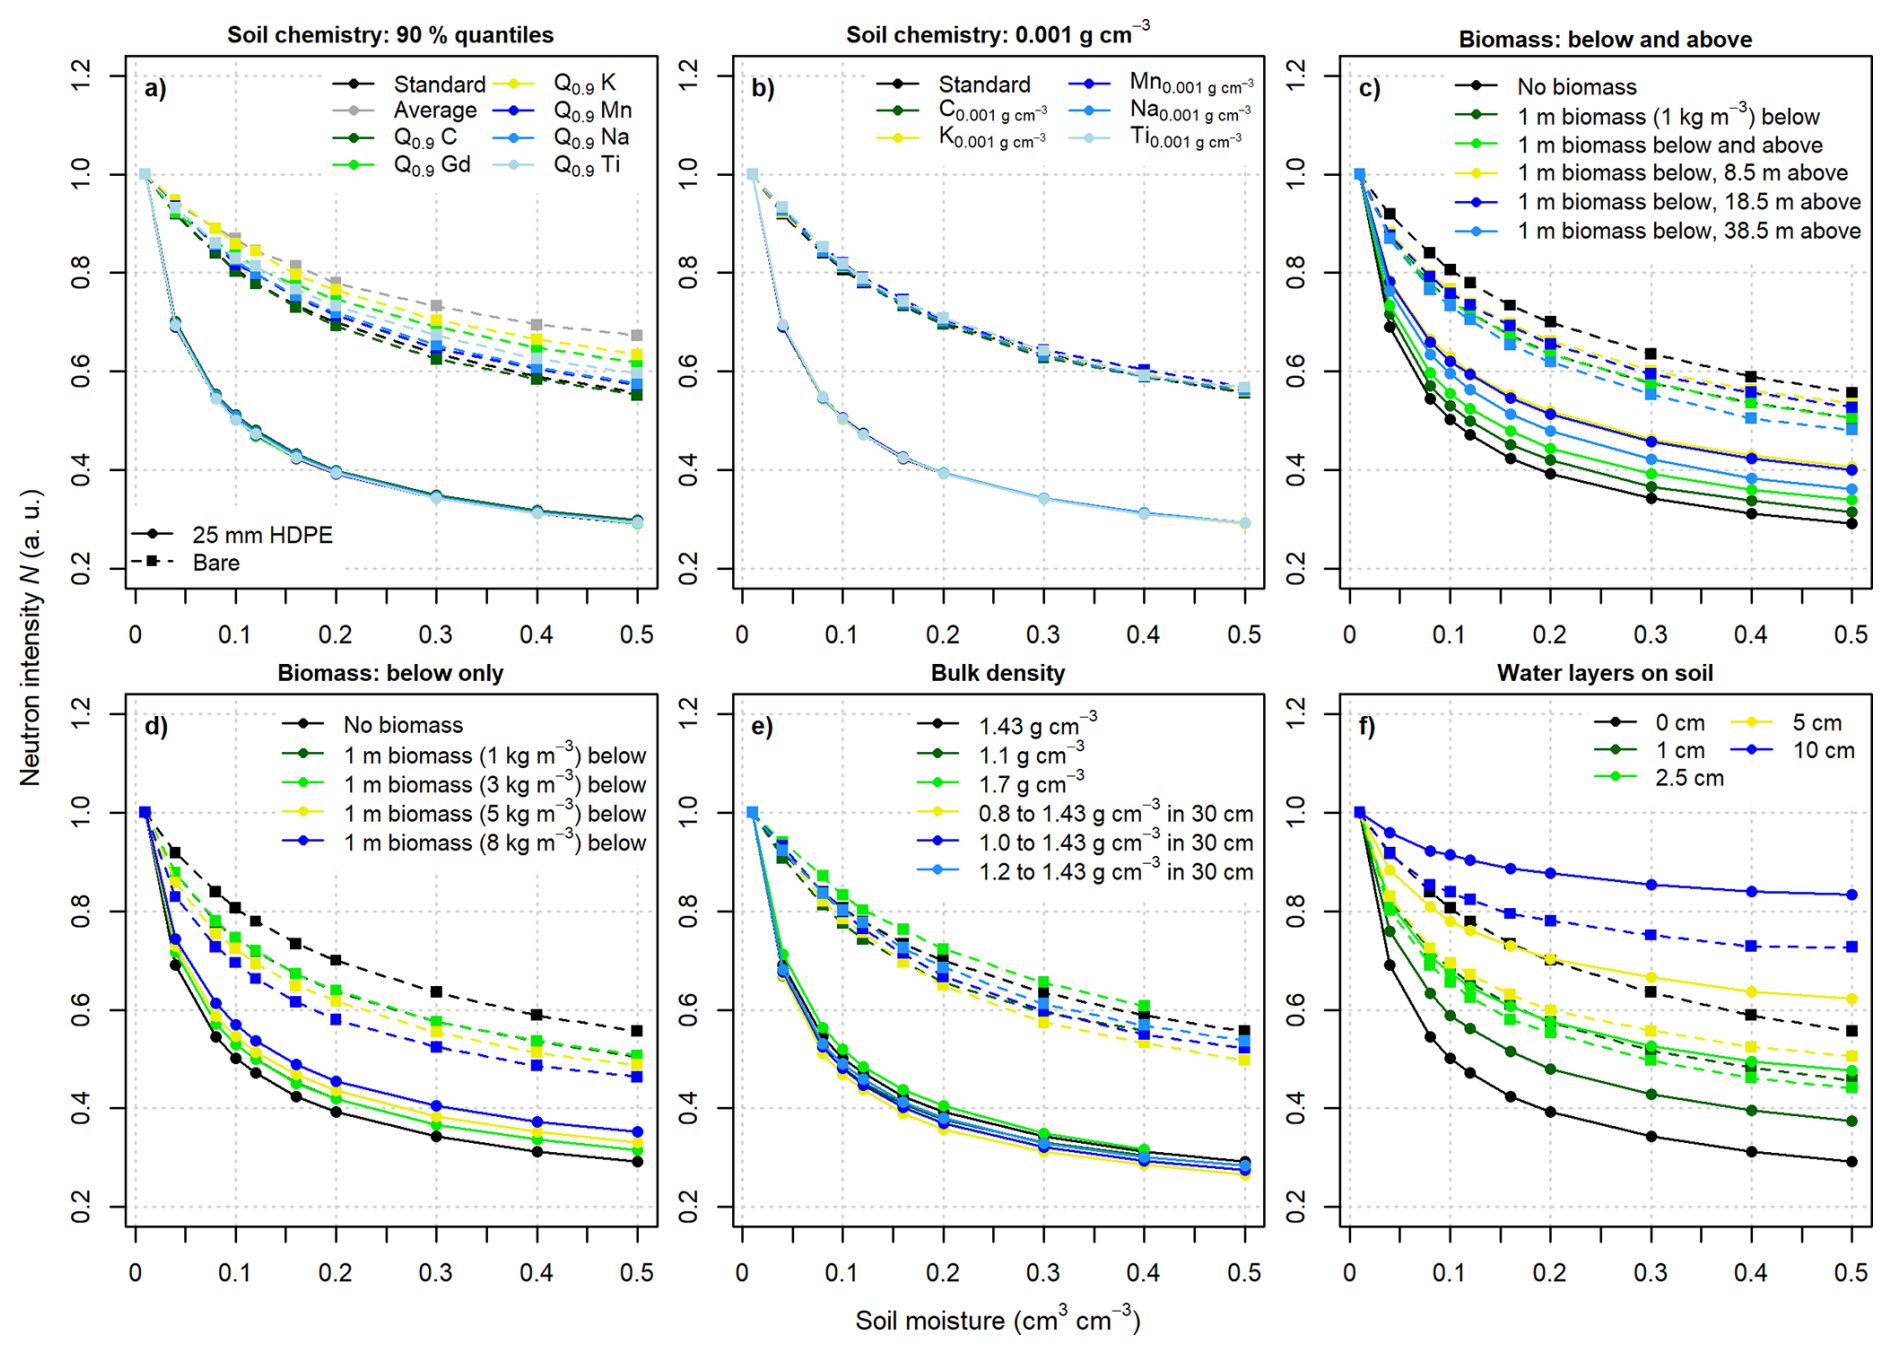
Figure 4Neutron response relative to the respective scenario with 0.01 cm3 cm−3 soil moisture in each simulation setup. Dashed lines with squares represent bare detector intensities while solid lines with dots represent moderated detector (25 mm HDPE shielding) intensities. The colours refer to the individual selected simulation setups listed in Tables 1–3.
In this study, we not only derived detector response functions for a bare and a standard moderated detector with a HDPE shielding of 25 mm thickness but also for a HDPE thickness ranging from 5 to 40 mm in order to investigate the impact of soil chemistry depending on the thickness of the HDPE shielding. The results are shown in Fig. 5. The average range of relative simulated values per moderator thickness over all simulation setups including different soil chemical composition serves as an indicator for chemistry dependence (Fig. 5a). It can be seen that soil chemistry sensitivity decreases exponentially with increasing thickness of the HDPE moderator detector. A shielding with 5 and 10 mm HDPE already reduces the dependence by 45 % and 69 %, respectively, compared to the reduction of 80 % for 25 mm. For thicker HDPE shieldings, the reduction is comparably small. As shown in Fig. 5b for the standard soil and compared to a bare detector, the reduction of simulated neutron intensities with increasing soil moisture becomes larger with increasing moderator thickness. The strongest decrease with soil moisture is simulated for a moderated detector with a HDPE shielding of 20 mm, indicating that a slightly thinner moderator may also be used for estimating soil moisture with CRNS. However, due to different detector surface areas and volumes caused by the different moderator sizes as well as individual DRF, different average absolute neutron intensities can be expected. This leads to different levels of statistical uncertainty and such considerations should be included in the detector design (e.g., Weimar et al., 2020).
For changes in above-ground wet biomass, both the moderated and bare detector responses to soil moisture changes deviate from the scenario without above-ground biomass (Fig. 4c–d). Hence, in contrast to differences in soil chemistry, biomass changes not only change the absolute neutron intensities observed by bare and moderated detectors but also the response to soil moisture changes. Here, it can be seen, that the bare detector response to soil moisture increases with increasing biomass below the detector while the response of the moderated detector decreases (Fig. 4d). However, the response of both detectors does not change monotonically if biomass changes occur above the detector (Fig. 4c). While the bare detector response becomes generally steeper with increasing biomass, the steepness increases with 1 m biomass added but then decreases slightly with more biomass added until it increases again for the scenario with highest biomass. The response of the moderated detector to changes in soil moisture becomes smaller up to the scenario with 1 m below and 8.5 m biomass above the detector. The response then increases again with increasing biomass. The point where this response changes its behaviour is consistent with the maximum intensity of the bare detector response with increasing biomass (Fig. 7a) underlining a complex behaviour of both, moderated and bare detector signals with changes in both biomass and soil moisture at vegetated observation sites. Despite this non-monotonic behaviour, the presented results also reveal that in many vegetated setups like a forest, the responses of a bare and moderated detector to changes in soil moisture generally tend to become more similar than under conditions with little or no vegetation (see also Fig. A2c).
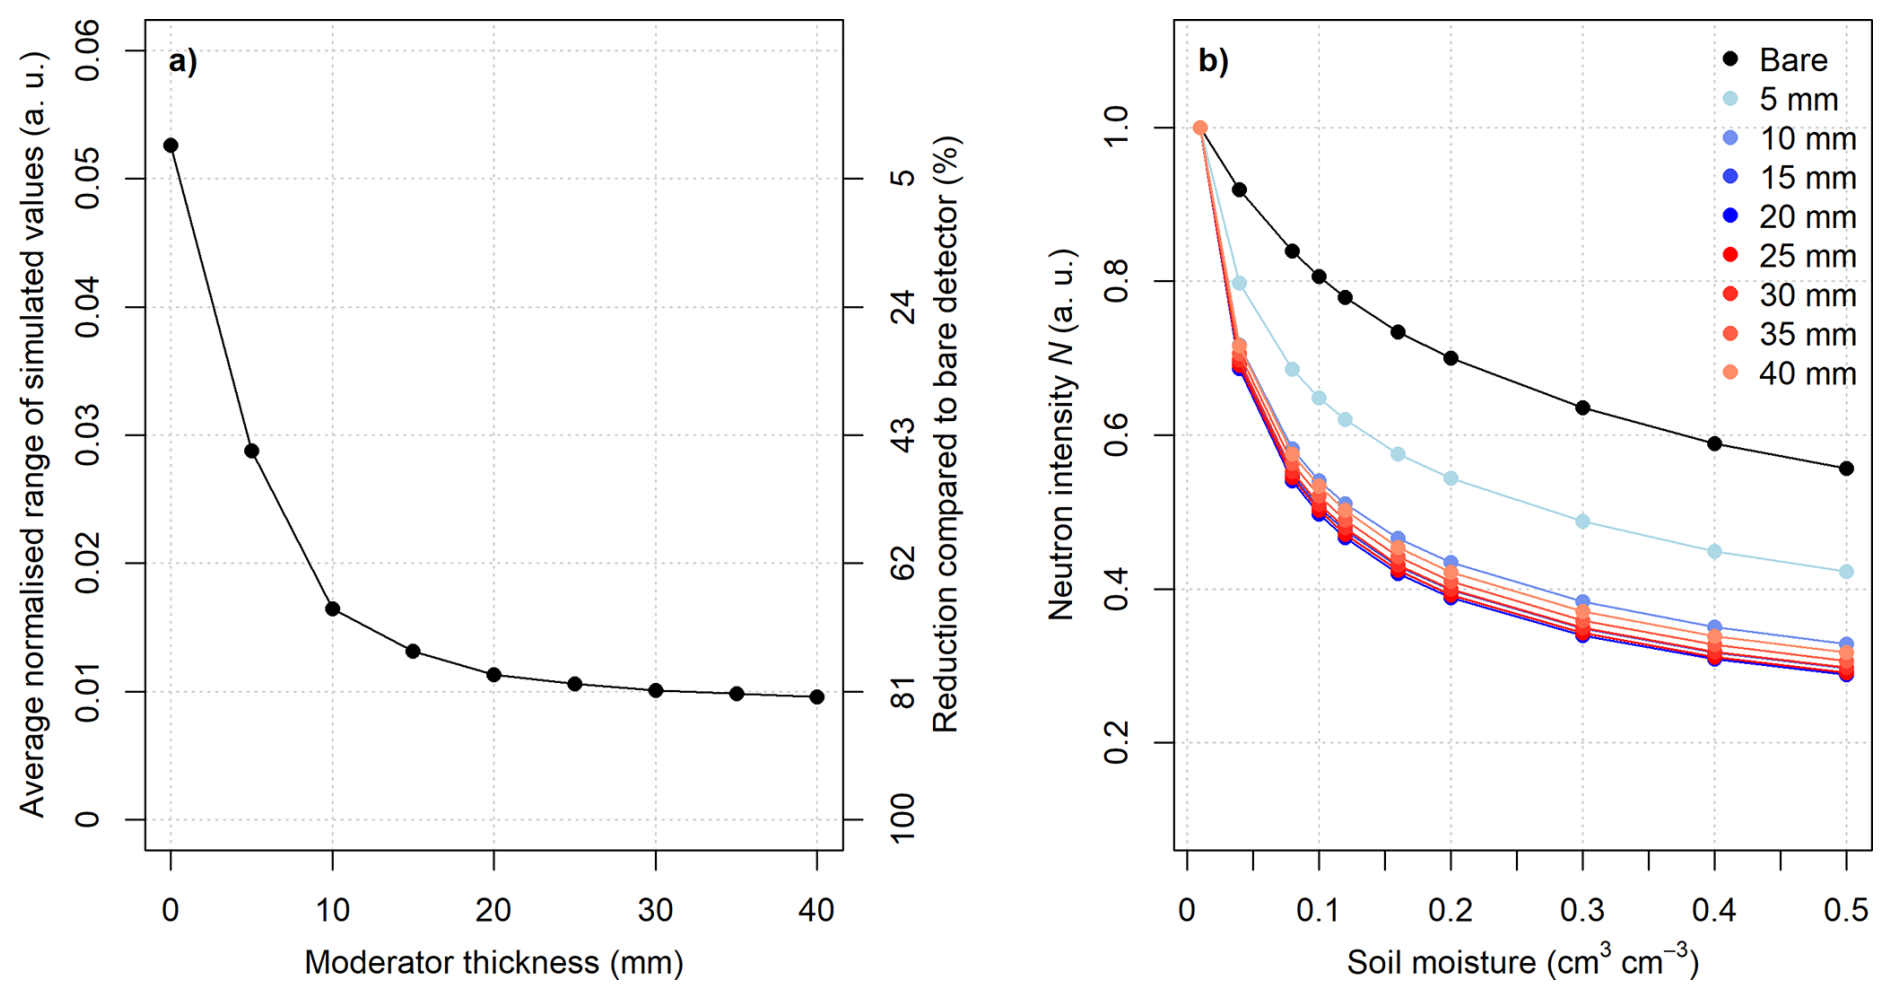
Figure 5Decreasing sensitivity to soil chemistry with increasing moderator thickness: Relative range of simulated neutron intensities per HDPE moderator thickness averaged over all simulation setups with varying soil chemical composition (Table 1) and its reduction relative to the bare detector without HDPE shielding (a). Neutron signal response relative to the scenario with 0.01 cm3 cm−3 per HDPE thickness for the standard soil chemistry (b).
Different soil bulk densities also change the response to soil moisture for moderated and bare detectors with a somewhat stronger effect on the bare detector (Fig. 4e). Nevertheless, in this case, the direction of the effect is similar leading to an general increase in the response with decreasing soil bulk density over the scenarios with uniform bulk density in the soil column and increasing bulk density from the surface down to 30 cm depth. This is in line with what has been reported for epithermal neutrons in previous studies (e.g., Kasner et al., 2022) and recently introduced transfer functions to convert soil moisture to neutron intensities and vice versa include a scaling approach to account for the effect of different bulk densities (Köhli et al., 2021). A water layer on top of the soil surface, representing ponding water or a layer of snow, leads to a decreased response of the moderated detector signal to changes in soil moisture below the water layer (Fig. 4f). The water layer also affects the bare detector signal, although here this trend is not monotonic. Compared to a scenario without water layer, the decrease in neutron intensity with increasing soil moisture becomes stronger with a thin water layer of 1 and 2.5 cm. Then, with a water depth of 10 cm, the response decreases and becomes smaller than that without a water layer. This illustrates that although a moderation optimum in absolute neutron intensities occurring in the thermal energy range and under very dry soil conditions may not be visible in the bare detector signal due to the contribution of epithermal neutrons, other moderation optimum features can still be present under specific environmental conditions. This makes the interpretation of observed bare detector signals more complicated than those observed with moderated detectors.
3.2.2 Transfer function for neutron signals measured with bare detectors
While different transfer functions to derive soil moisture from moderated detector signals have been introduced in the last 15 years (Desilets et al., 2010; Franz et al., 2013; Köhli et al., 2021), a transfer function for the bare detector is currently lacking, largely because of the decreased response to soil moisture changes and because the higher complexity and variability of the bare detector response to changes in soil moisture hampers the development of a generalised transfer function. However, mathematically characterising the response of bare detector signals to changes in soil moisture is a prerequisite for a future exploration of potential applications of bare detectors for environmental monitoring, e.g. for estimating uncertainties of biomass products from bare detector signals which originate from underlying soil moisture dependencies. Based on the homogeneous simulation scenarios listed in Tables 1–3, we found that the change in the bare detector signal with soil moisture relative to the intensity observed above a freshwater surface (e.g., a lake) where θtotal=∞ is well represented by the same hyperbolic relationship:
where
and
Solved for θtotal, Eq. (1) becomes:
In Eq. (2), Nphi is the observed bare detector intensity corrected for variations in air pressure, high-energy cosmic radiation and absolute air humidity. Note that the correction for absolute air humidity variations for neutrons observed with a bare detector is different to those measured with a moderated detector as simulated in Rasche et al. (2023) and supported by empirical evidence given in Schrön et al. (2024) and Baatz et al. (2025). is the intensity of the same detector above a freshwater surface. In Eq. (3), the total soil water content θtotal in cm3 cm−3 is the sum of the soil moisture content θSM, the water equivalent of soil organic matter θSOM and the amount of lattice water θLW. The fitted shape-giving parameters p1…3 show a distinct variability between the simulation setups which resembles the changing relationship between the bare detector signal and soil moisture depending on soil chemistry, above-ground biomass, bulk density and water layers on the soil surface. Individually fitted for all setups listed in Tables 1, 2, 3 using non-linear least squares, the parameter p1 ranges from 0.06623 to 0.2712 (average = 0.1655, median = 0.1936), p2 ranges from 0.2676 to 0.6473 (average = 0.3718, median = 0.3594) and p3 ranges from 1.638 to 6.267 (average = 3.166, median = 2.767). The fitted parameters for each individual scenario can be found in Table A1. The variability in fitted parameters indicates a change of the relationship between neutron intensity and soil moisture depending on the environment.
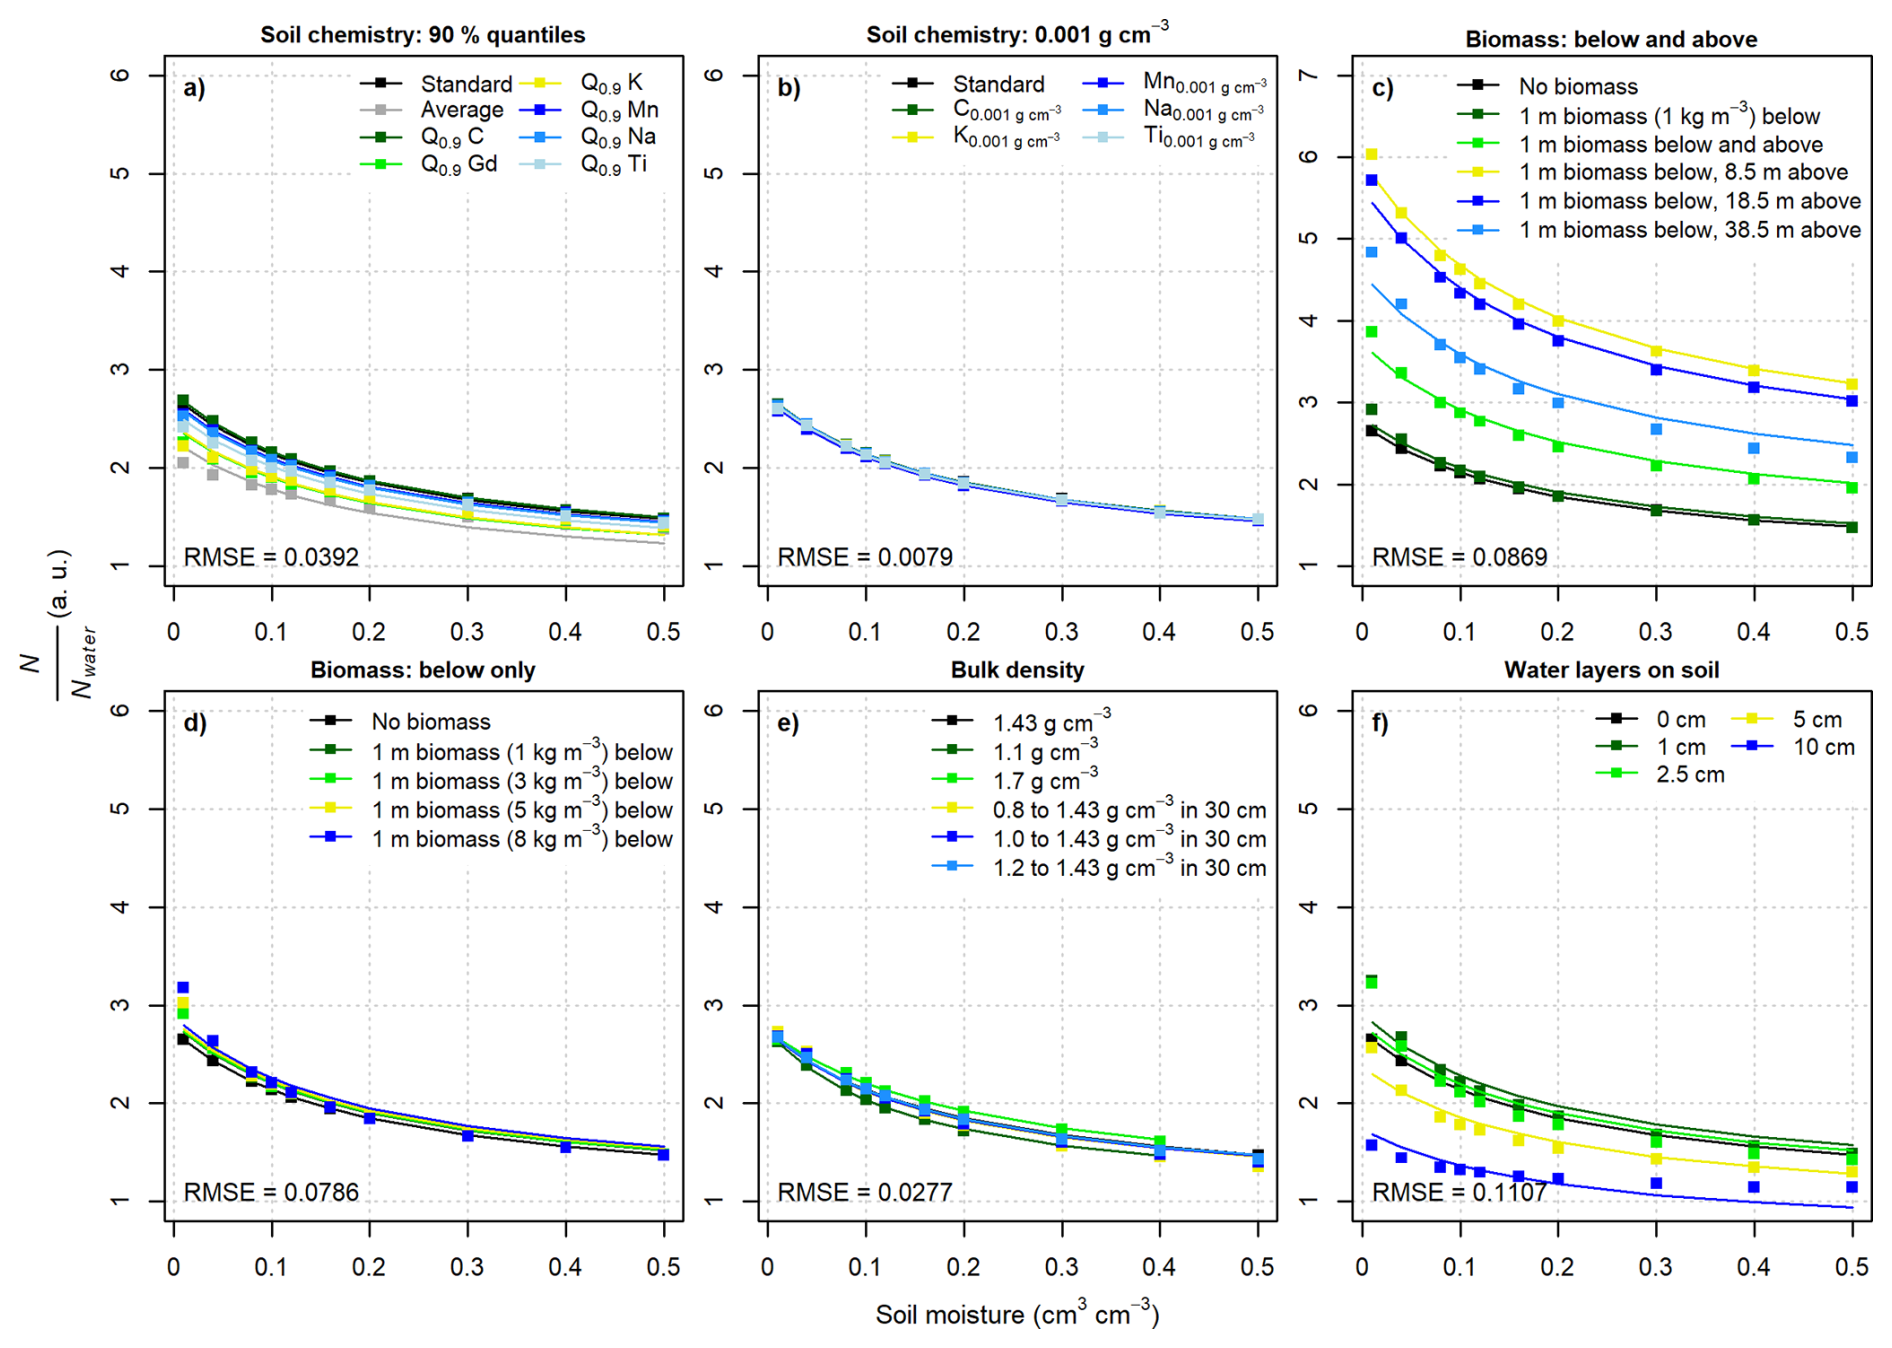
Figure 6Simulated neutron intensities N of the bare detector relative to the simulated intensity above water Nwater (dots). Lines represent the prediction from Eq. (1)–(3) with and calibrated intensity above water. Root mean squared errors (RMSE) are calculated over all setups shown in each individual subplot.
For the simulation setup with standard soil chemistry and standard bulk density (1.43 g cm−3) but without biomass or water layer, the fitted parameters p1…3 become 0.1936, 0.3639 and 2.733, respectively. If this standard parameter set is used for Eq. (1) in conjunction with replacing θtotal by to account for differences in actual bulk density ρsoil and simulated standard bulk density (see e.g., Köhli et al., 2021) and is calibrated for each setup, the fits shown in Fig. 6 can be derived. Larger deviations become apparent for some soil chemistry, biomass and water layer setups which is also reflected by the RMSE values shown in Table A1. All RMSE values derived with the standard parameter set (RMSEcalibrated) are considerably higher compared to individually fitted parameters (RMSEindividual). Especially, water layers on top of the soil and increasing biomass cause increasing RMSE values. This again underlines a change of the relationship between the neutron intensity of bare detectors and soil moisture. However, given that variations of the relationship between neutron intensity and soil moisture can also be observed for epithermal neutron signals from moderated detectors (see e.g., Fig. 4d and f), the fit with the standard parameter set may be considered acceptable over a range of environmental conditions. Acknowledging that deviations remain and that further research on transfer functions for bare detector intensities is required, this shows that the same shape-giving parameters in Eq. (1) may be used as a first model to predict local neutron intensities of bare detectors if calibrated to the local conditions using reference soil moisture measurements in cm3 cm−3. It should be noted that this calibrated intensity above water () then represents a mere calibration parameter which compensates for local site characteristics such as soil chemistry and above-ground biomass. Hence, if these influences have not been otherwise corrected for, the calibrated is not directly comparable with the intensity measured with the same detector above water. This also applies for existing transfer functions developed for pure epithermal neutrons and neutrons measured with moderated detectors. A correction of observed neutron intensities for, e.g., total biomass and its temporal changes, would improve the comparability between the measured and locally calibrated intensity above water of the same neutron detector and is discussed in Sect. 3.3.
It should further be noted that Köhli et al. (2021) found a dependence of the response to soil moisture with absolute air humidity for neutrons measured with moderated detectors. Even though the humidity dependence for bare detector signals is likely to be reduced (Rasche et al., 2023; Schrön et al., 2024; Baatz et al., 2025), it may still have an impact on derived neutron intensities and soil moisture estimates from bare detector signals. Applying existing correction approaches for variations in air humidity developed for neutron intensities from bare detectors (e.g., Rasche et al., 2023) in conjunction with Eqs. (1)–(4) may therefore only be seen as a first-order approximation and remains to be tested against measured data in future studies.
3.3 Response of neutron intensities to changes in biomass and water layers above the soil
In Figs. 4 and A1, a different response to soil moisture is illustrated if biomass or water layers mimicking snow or ponding water are present. Our simulations further show how the absolute neutron intensities of bare and moderated detectors change if these environmental boundary conditions change. As shown in Fig. 7, the neutron intensities of bare and moderated detectors change differently with increasing biomass and water layer thickness on top of the soil surface. While the moderated intensities decrease in a monotonic way, we see again moderation optimum features for bare detector intensities. This is expressed by an intensity increase before the optimum, followed by a decrease, as thermal neutron absorption begins to dominate over epithermal neutron moderation.
3.3.1 Influence of biomass
Figure 7a shows the response of the bare and moderated detector signals to increasing biomass below and above the detector (maximum vegetation height of 40 m above ground) under different soil moisture conditions. For all simulated soil moisture conditions, the response changes with increasing biomass but the overall trends are somewhat different. For biomass above and below the detector (Fig. 7a), moderated detector intensities continuously decrease with increasing biomass. On the contrary, bare detector intensities increase up to a biomass water equivalent of around 8 mm, and then decrease for higher values. These simulation results support findings from Baatz et al. (2015) and Vather et al. (2020) who observed an increase in neutrons observed with the moderated detector after a forest clear-cut. At the same time, this clear-cut caused a decrease of neutrons from the bare detector (Vather et al., 2020). For biomass water equivalents with changes below the virtual detector only (Fig. 7b), the bare and moderated detector signal changes are highly similar and inversely linearly correlated. Compared to the case of biomass above and below the detector (Fig. 7b vs. a), the response of a moderated detector is very similar whereas bare detector response is strongly reduced in the case of biomass confined below the detector. This supports conclusions drawn by Jakobi et al. (2022) from experimental data suggesting the use of bare detector signals to directly correct moderated detector signals for changes in biomass. However, the simulation results of this study suggest that the applicability of this approach is limited to biomass changes that occur below the neutron detector.
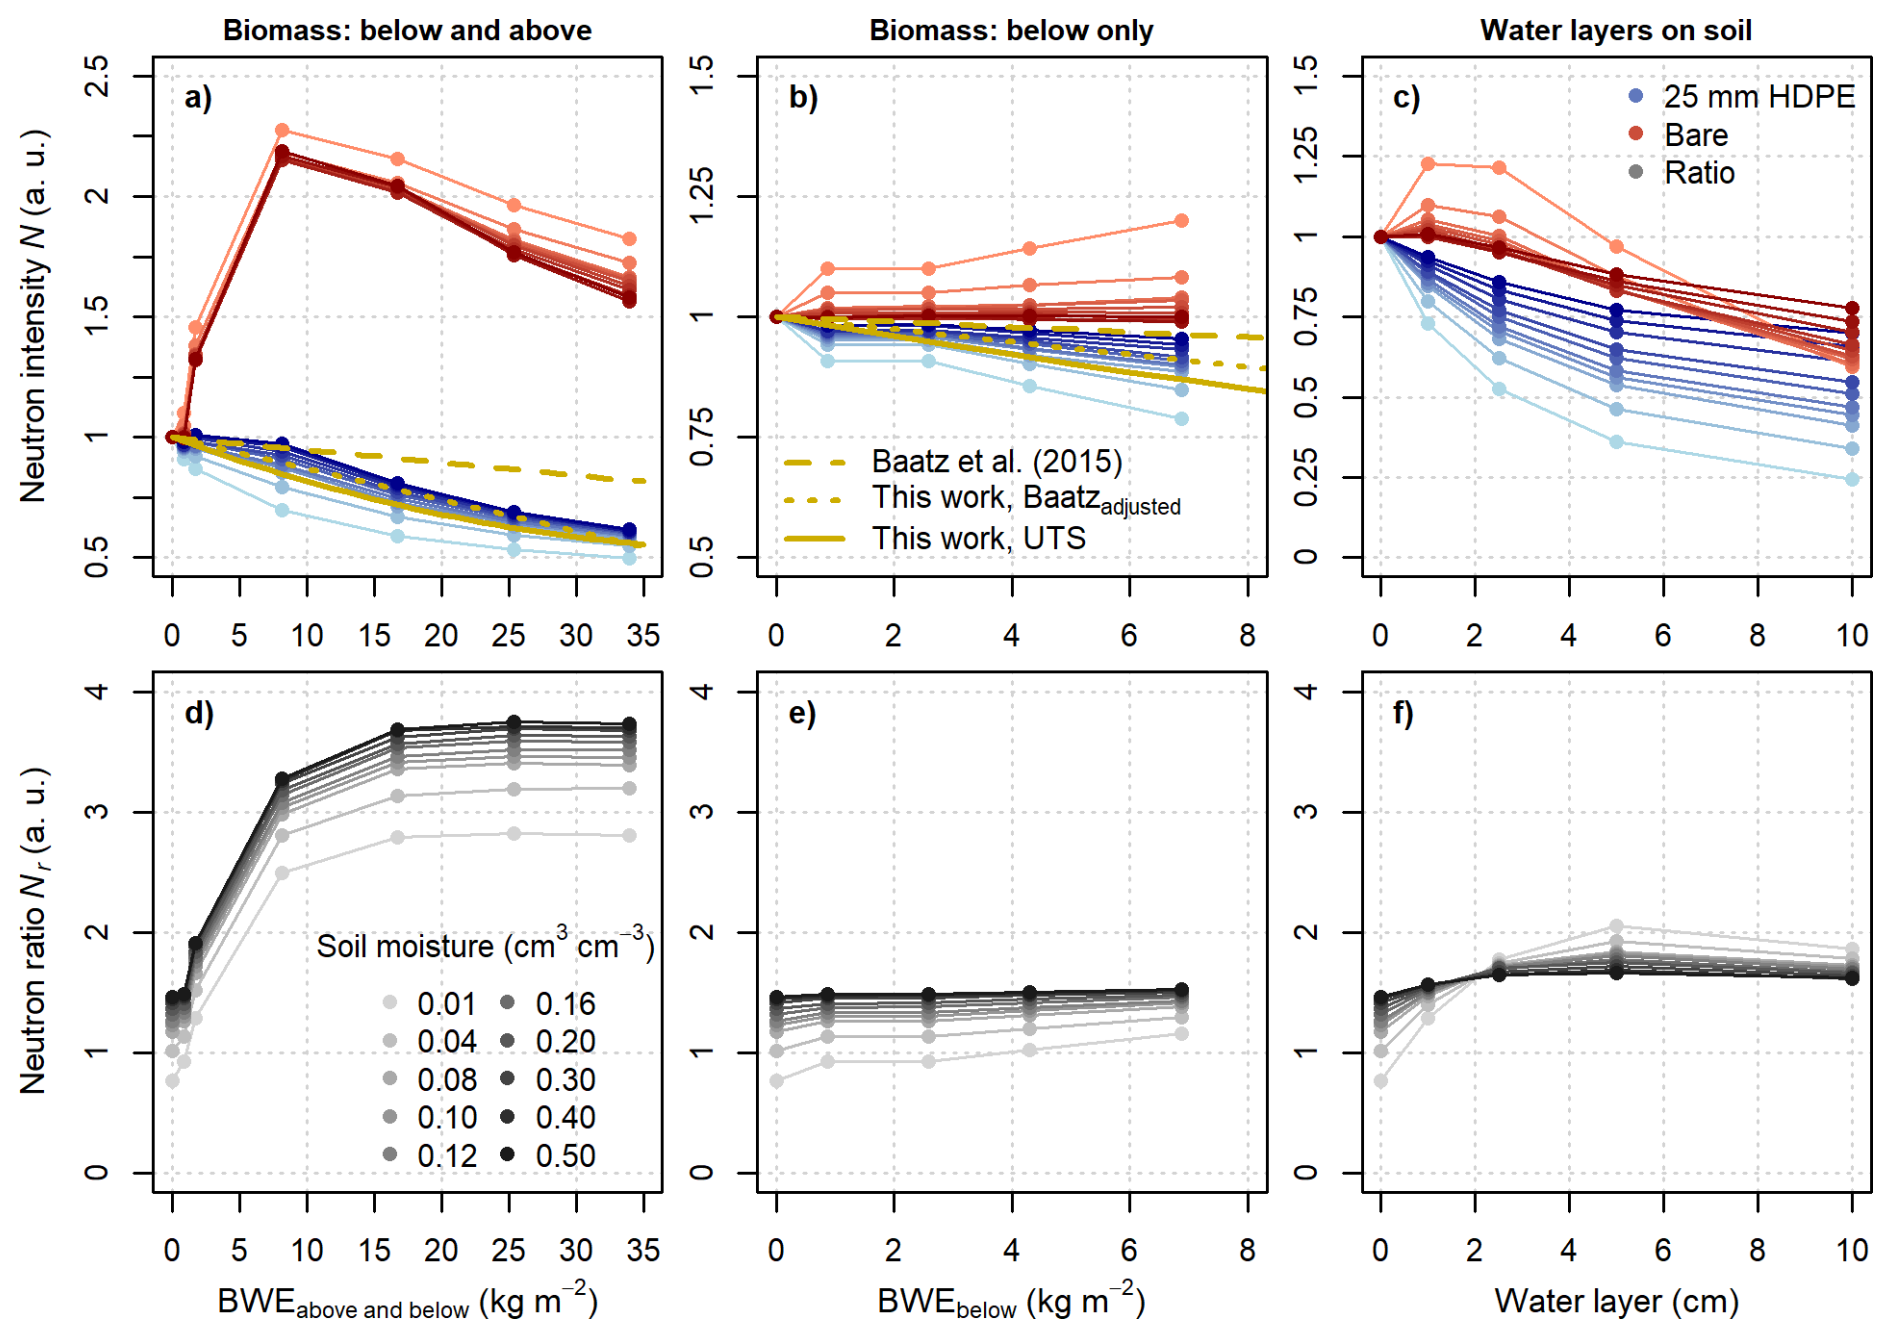
Figure 7Neutron response to changes in above-ground biomass water equivalents (BWE) above and below the virtual detector (a) and below the virtual detector only (b) as well as water layers on top of the soil (c). For the scenarios with above-ground BWE, predicted responses based on the inverted approach after Baatz et al. (2015), its adjustment based on this study (Eq. 5) and the modification of the UTS (Eq. 6) after Köhli et al. (2021) are shown as well. The different colour shades represent the different simulated soil moisture contents. For the same simulation scenarios, the ratios between intensities simulated for the bare and moderated detector Nr (Eqs. 8–9) are shown (d–f).
In general, findings from this simulation-based study are in line with conceptual ideas and experimental findings in Jakobi et al. (2022) and Brogi et al. (2025): above-ground BWE increases intensities measured by the bare detector through an increased slowing-down (moderation) of epithermal neutrons and thereby reduces moderated detector intensities. Although small and only occurring during higher simulated soil moisture contents, an increase in moderated detector intensities is visible between the simulation scenario with wet biomass 1 m below as well as 1 m below and 1 m above the detector (Fig. A3a) which further supports the conclusions from Jakobi et al. (2022) that tall vegetation growing at the installation height of the detector increases neutron intensities measured by the moderated detector but once it overgrows the detector, moderated intensities start to decrease again. This increase in moderated intensities is much smaller compared to the maximum reached by the bare detector signal with the latter being reached at higher amounts of biomass.
The reduction in moderated neutron intensities with increasing BWE in the majority of scenarios shown in Fig. 7a and b is visibly higher compared to what has been derived empirically in Baatz et al. (2015). Being one of the accepted approaches to correct epithermal neutron intensities from moderated detectors for changes in BWE, the Baatz correction factor CBWE can be calculated as follows, where BWE is in units of mm:
In their empirical work, Baatz et al. (2015) found β to be 0.005 which is less than half of the average value of 0.013 derived from the neutron transport simulations in this work, which is well in line with findings from empirical studies (Jakobi et al., 2022; Morris et al., 2024). Values of β of −0.005, 0.011 and 0.015 have been reported by Jakobi et al. (2022) and Morris et al. (2024) derived values between 0.006 and 0.017 with an average β of 0.011. Furthermore, the simulation results shed further light on potential reasons for the differences between the empirically derived values. As empirically shown in Jakobi et al. (2022) and simulated in this study, vegetation growing at the height of the detector can influence the relationship between BWE and neutron intensity. At the same time, different soil moisture states may result in different estimates of β due to a dependence of the response to changing BWE on soil moisture (Fig. 7a and b) which also includes a non-linearity in the relationship. For correcting the inverse behaviour of thermal neutron signals from bare detectors, β in Eq. (5) becomes −0.0055 if only biomass changes below the detector are considered (Fig. 7b), while β reaches −0.14 if BWE below and above the detector up to 8.17 mm are taken into account (Fig. 7a, fit not shown). Due to biomass being implemented with a constant height of 1 m below the detector in the simulation setups of this study, the influence of increasing vegetation height below the detector in addition to a higher biomass density cannot be assessed. For the bare detector with an overall higher sensitivity to above-ground biomass, a change of vegetation height below the detector could lead to a stronger signal response than suggested by the results shown in Fig. 7b. It should be noted here that vegetation is implemented as a homogeneous plant gas layer, which poses a further limitation. In fact, Andreasen et al. (2017) show different neutron responses and that a homogeneous vegetation layer well represents epithermal neutron observations while more complex vegetation structures best fit thermal neutron observations. Hence, additional research on the joint influences of biomass, vegetation height and geometries as well as soil moisture on bare detector signals, rather than thermal neutron intensities, is required to further explore their usability in biomass estimation and monitoring.
Given the non-linearity in the relationship between epithermal neutron signals from moderated detectors found in this study, the recently introduced UTS (parameter set MCNP drf) by Köhli et al. (2021) is used to include the non-linear effect of BWE on soil moisture estimates as follows:
where
This modified UTS predicts the neutron intensity based on total soil water content and absolute air humidity and therefore, the predicted neutron intensity represents the intensity corrected for variations in atmospheric pressure and incoming primary neutron flux Npi. The parameter ND represents the average neutron intensity of the same neutron detector under the boundary conditions defined in the neutron transport simulations for deriving the UTS. θtotal is the total water content in cm3 cm−3 comprising soil moisture content θSM, soil moisture equivalent from soil organic matter θS0M and lattice water content θLW which is then scaled by the local soil bulk density at the study site ρsoil (Köhli et al., 2021). The shape-giving parameters p1…8 have been derived by Köhli et al. (2021) while have been derived from the simulations in this study. The BWE is the above-ground biomass water equivalent in kg m−2 (or mm) and Eq. (6) may be used with BWE values ≤40 kg m−2. Note that p9…11 are only valid in conjunction with p1…8= (0.0280, 0.254, 1.094, −0.0088, 0.0001150, 3.537, 0.139, −0.00140). A comparison of the different biomass correction approaches can be found in Fig. 8. Compared to no biomass correction or the original approach after Baatz et al. (2015), an improved representation of the simulated moderated neutron intensities can be achieved by using the UTS if the adjusted coefficient of 0.013 mm−1 BWE is used in Eq. (5) or by using the modified UTS (Eq. 6). While these results confirm findings of previous studies that an adjustment of the original β derived by Baatz et al. (2015) may be necessary, a thorough assessment of the modified UTS in Eq. (6) with integrated correction for BWE is beyond the scope of this study. Nevertheless, from a practical point of view, the findings from this study suggest that Eq. (5) with a β of 0.013 instead of 0.005 mm−1 BWE should be used for correcting neutron signals from moderated detectors for variations in above-ground biomass.
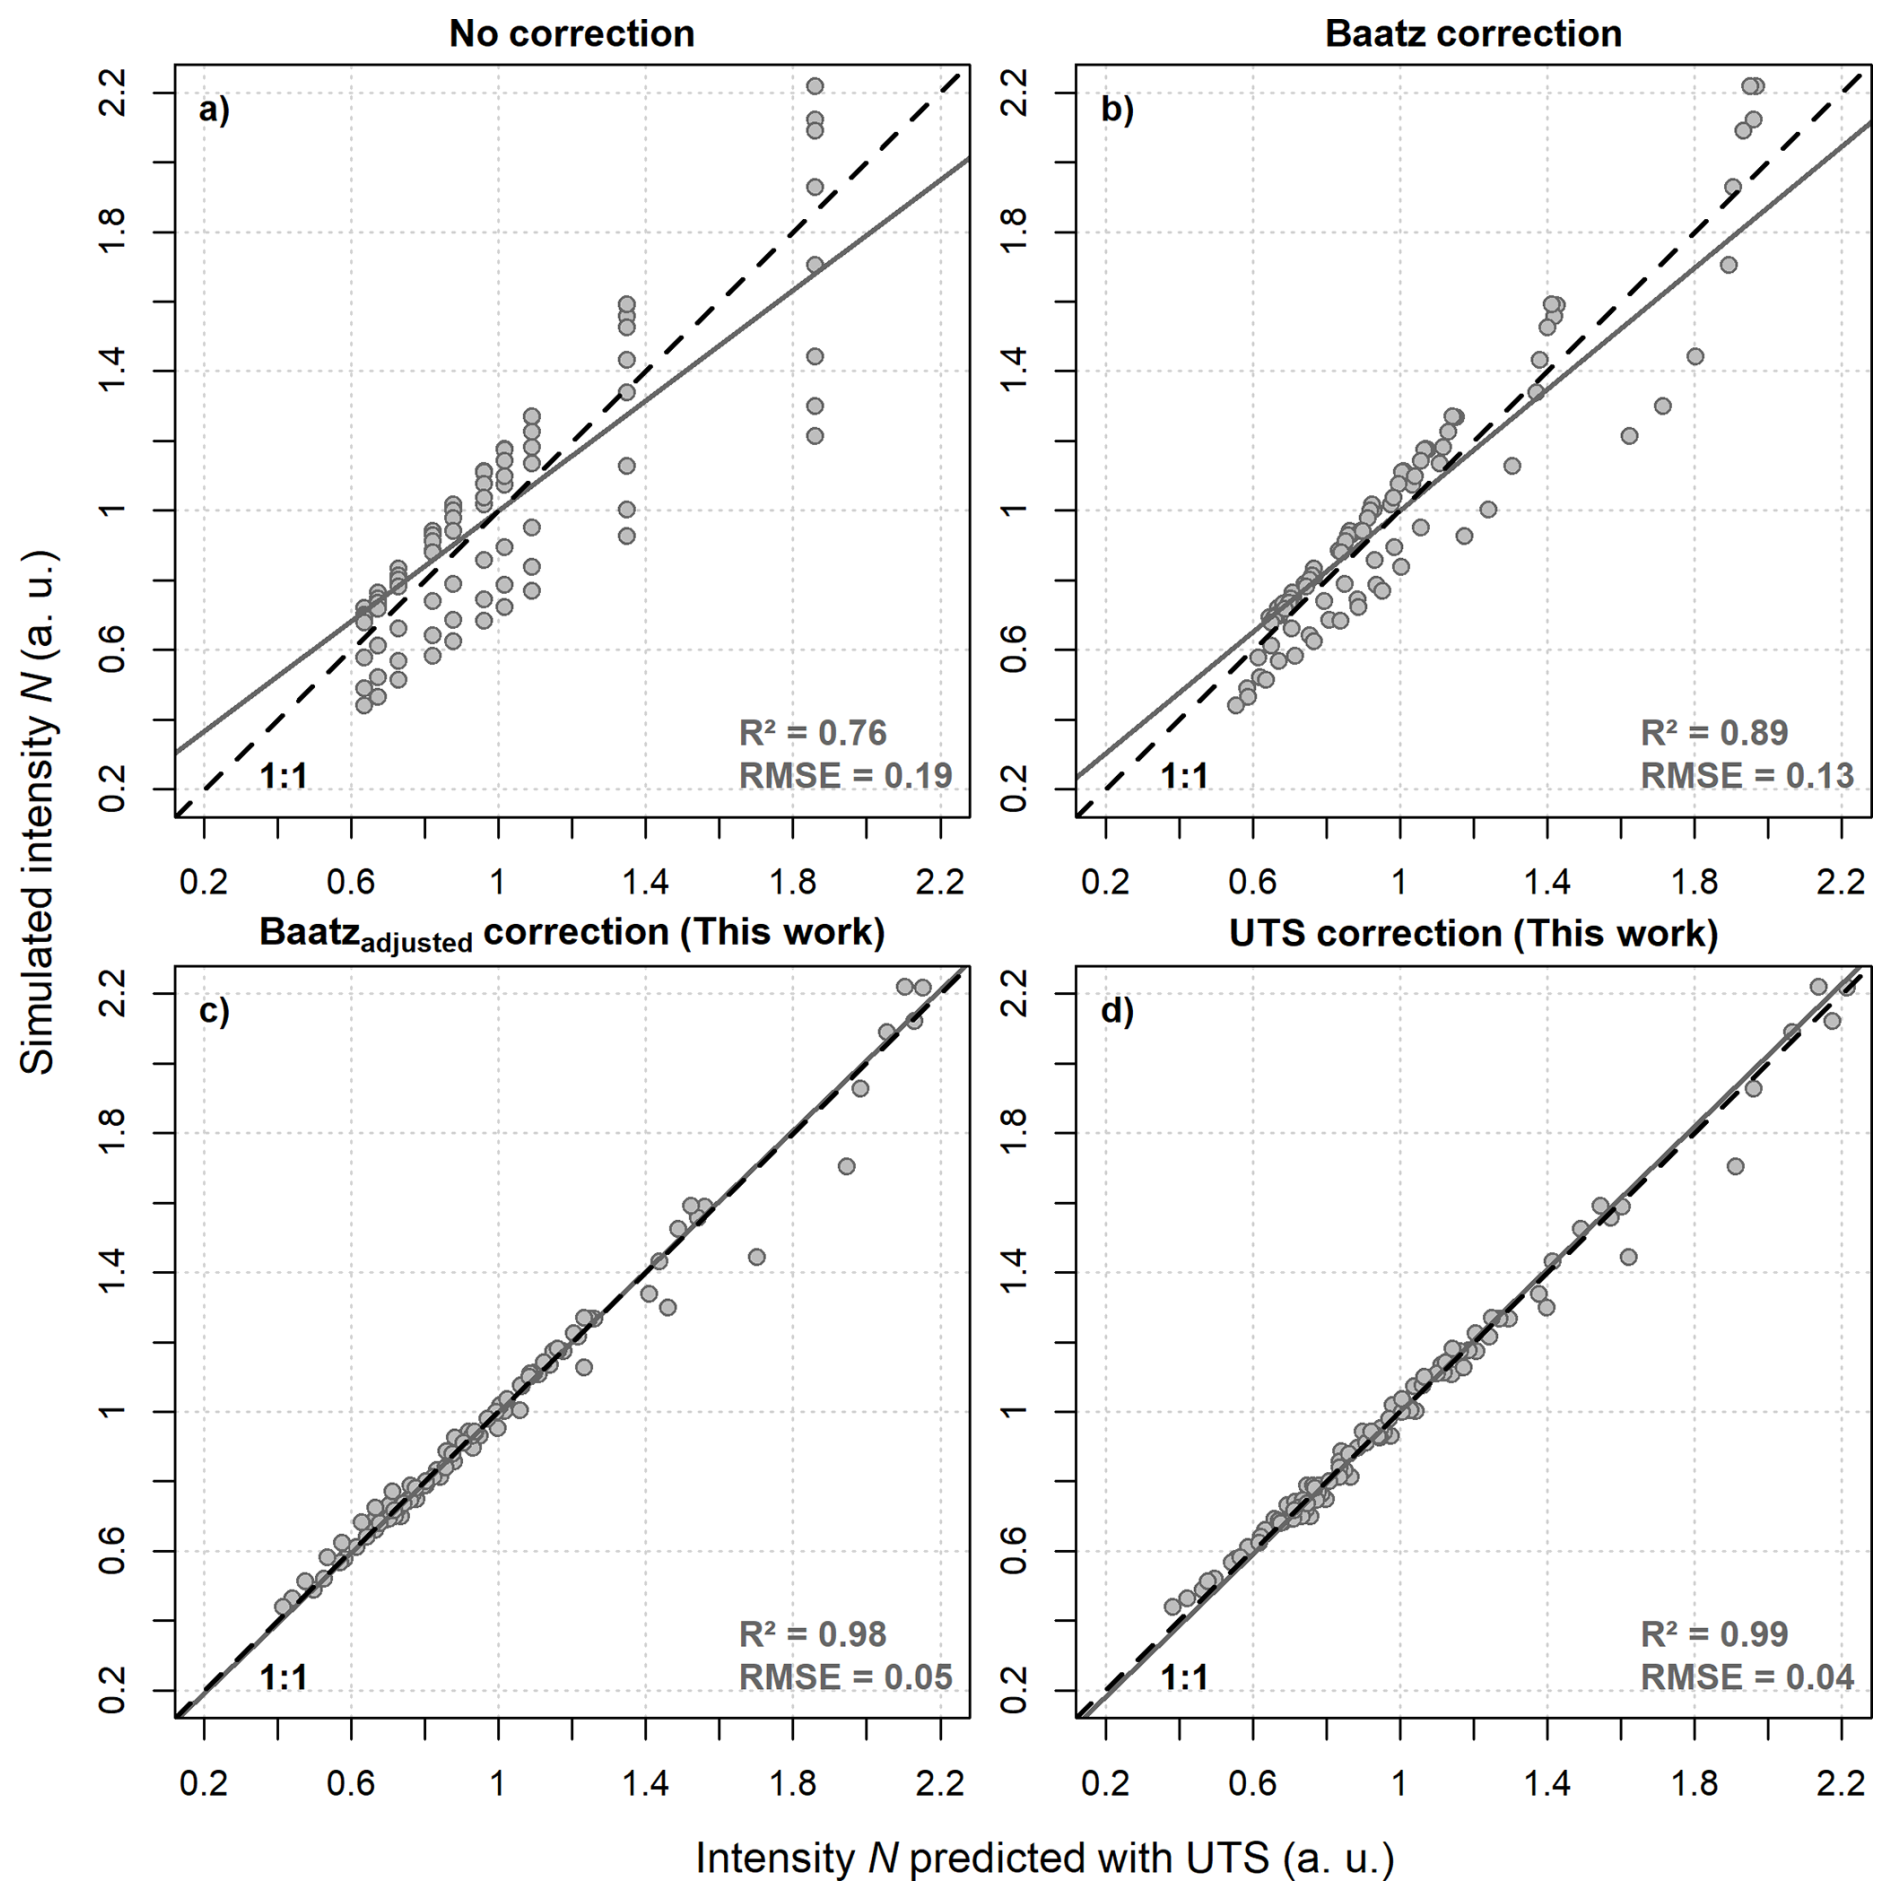
Figure 8Comparison between the different approaches to predict simulated neutron intensities from the scenarios with biomass water equivalents (BWE) in Table 2 using the UTS in its original form without accounting for BWE, with accounting for BWE using the inverted BWE correction after Baatz et al. (2015), the adjusted Baatz approach (β=0.013) and the modification of the UTS which are both based on the neutron transport simulations of this study. At the significance level of α=5 %, the mean absolute difference between simulated and predicted values of both adjusted methods (Fig. 8c and d) is significantly lower than the original approach shown in Fig. 8b.
3.3.2 Influence of water layers on the soil
For water layers on the soil surface (Fig. 7c), a moderation optimum for bare detector intensities can be found between a water layer thickness of 1 and 2.5 cm which is in line with findings from e.g., Brall et al. (2021) for thermal neutrons. In addition, Bogena et al. (2020) showed in measured data that bare detector intensities increase for thin snow layers but decrease for thicker snow layers. In contrast, intensities measured with moderated detectors always decreased with snow height. The simulation scenarios in this study representing all above-surface water as a liquid water layer support these observations. Although this has been done in previous studies (e.g., Brall et al., 2021), representing snow as a water layer remains a simplification which does not fully account for the lower density of snow. For example, similar to layers of biomass, snow layers with heights approaching or exceeding the height of the detector are likely to lead to a different response despite containing the same amount of a water layer with lower height. Therefore, the results of the simulations conducted in the scope of this study are only valid for snow layers of heights up to approx. 30 cm (at a snow density of 0.3 g cm−3).
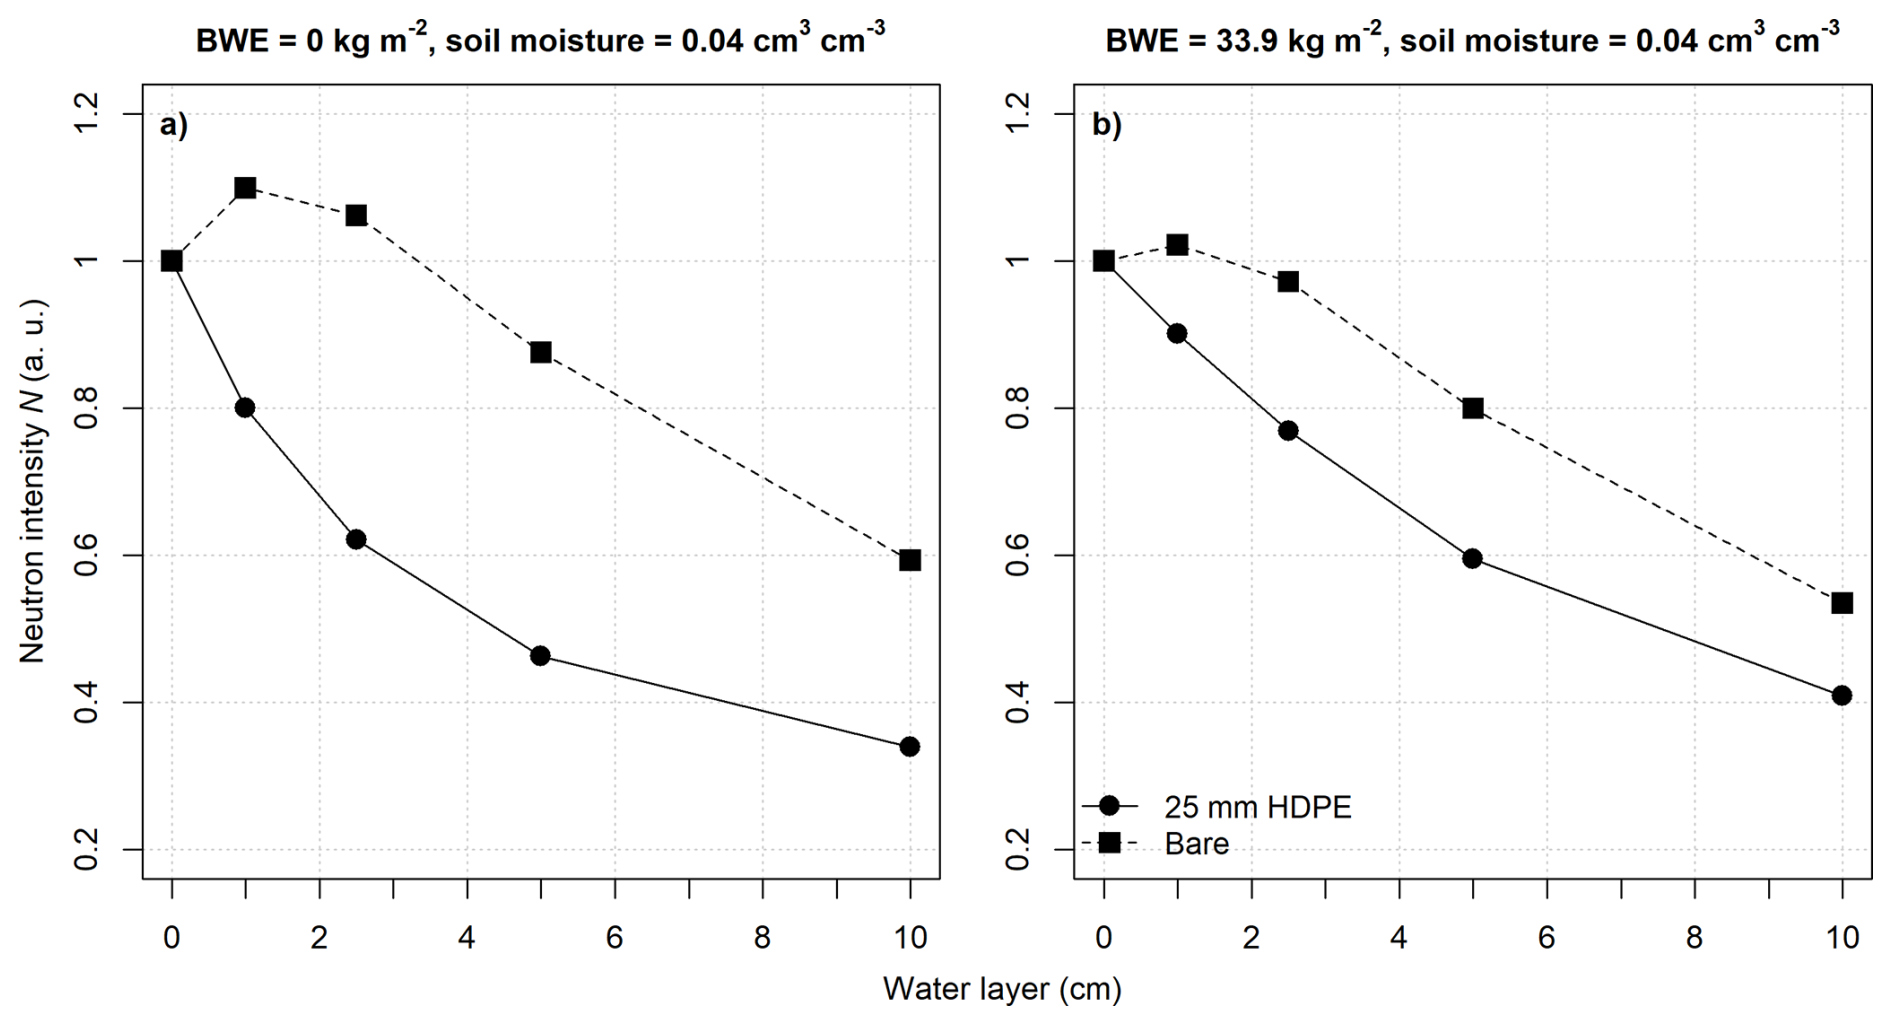
Figure 9Neutron response of a bare and moderated detector to water layers on top of the soil without (a) and with biomass b for an exemplary soil moisture content of 0.04 cm3 cm−3. Note the smaller increase (moderation optimum) of bare intensities for thin water layers in the simulation scenarios with above-ground BWE.
For bare detector signals, the neutron intensity increase for thin water layers depends on the soil moisture content with a stronger increase being visible for low soil moisture contents. Furthermore, additional simulation results for a soil moisture content of 0.04 cm3 cm−3 show that the response of a moderated and a bare detector to water layers above the soil changes when above-ground biomass is added to the simulation setup (Fig. 9). The moderation optimum in the bare detector signal becomes smaller and also the moderated detector signal responds less to changes in water layer thickness. Hence, for estimating snow heights and water equivalents by utilising the different response of bare and moderated detector signals one may need to include the site-specific amount of above-ground biomass as well as other hydrogen pools such as soil organic matter present in addition to soil moisture. This is supported by measured data from a CRNS observation in north-eastern Germany (site Serrahn, Bogena et al., 2022) shown in the appendix (Fig. C2). The site is located in a forest and during periods with estimated maximum snow heights of ≈15 cm no distinct increase of the bare detector signal is visible. Yet, the small size of the dataset and missing information of measured snow water equivalents need to be considered when interpreting the observation data shown. This underlines the need for further research using field measurements such as the study by Bogena et al. (2020) at sites with different amounts of BWE and average soil moisture and to evaluate findings from simulation-based studies.
At very dry sites without dense vegetation cover and if only the top few centimetres of the soil are getting wetted during small rainfall events, this distinct vertical heterogeneity of soil moisture may act similar to a thin water (or snow) layer on top of the soil surface. This explains observed neutron intensities shown in Fig. C1 from an observation site in northern Australia (Oak Valley, (McJannet et al., 2025)) where bare detector intensities increase during small but not during larger rainfall events in periods with low soil moisture, while moderated detector intensities show a decrease in all cases. On the one hand, this needs to be considered when using e.g., Eqs. (1)–(4) to derive soil moisture from neutrons observed with bare detectors. On the other hand, this suggests that bare detector signals could be used to derive information on the vertical distribution of soil moisture during dry periods. However, the visibility of a bare detector signal increase due to a vertically heterogeneous wetting of the soil or thin layers of water and snow on the soil surface also depends on the temporal aggregation and smoothing of observed neutron intensities as well as simultaneously changing soil moisture contents underneath a water (or snow) layer.
3.4 Neutron ratio and the relationship between bare and moderated signals
Previous studies investigating the potential of neutrons observed with bare detectors in the context of CRNS often refer to the neutron ratio Nr, i.e., the ratio of the corrected bare and moderated detector signal for estimating snow heights (Bogena et al., 2020) and biomass water equivalents (e.g., Tian et al., 2016; Jakobi et al., 2018, 2022). The neutron ratio may be defined as follows by using the corrected neutron intensities directly or by using intensities relative to their respective average and :
or
For the purpose of estimating BWE, snow heights and snow water equivalents, Nr would be most advantageous if it removes the dependence on soil moisture present in the bare and moderated detector signal and only preserves a residual signal originating from changes in above-ground biomass or from the accumulation of water or snow on the soil surface. However, unlike Andreasen et al. (2017) who only found a dependence of neutron ratios on soil moisture from observation data but not from neutron transport simulations, the simulations conducted in this current study reveal a clear dependence of neutron ratios on soil moisture as shown in Fig. 10. Due to the different response of bare and moderated detector signals to soil moisture, the effect does not cancel over the entire simulated soil moisture range and hence, the neutron ratio remains soil moisture dependent. This also explains the soil moisture dependence of the neutron ratios visible in observation data (Figs. C1 and C2). This suggests that soil moisture variations need to be considered when neutron ratios are used for the direct estimation of snow and biomass water equivalents. Tian et al. (2016) show an increase of Nr with increasing BWE and snow water equivalents which is in line with the findings in this study (Fig. 7d–f). However, Jakobi et al. (2018, 2022) only find a clear relationship between Nr and BWE for sugar beets but not for other crops. Based on our generalised neutron transport simulations, this could be linked to changing soil moisture conditions affecting Nr as well as a weaker relationship between Nr and BWE when the latter changes below the detector, only. As defined in Eqs. (8) and (9), Nr is positively correlated with soil moisture and BWE. As a consequence, for example, decreasing soil moisture contents during the growing season may lead to a decrease in Nr which then strongly reduces or even cancels out the increase of Nr caused by increasing BWE. As described in the previous chapter, this is likely to be further influenced by species-dependent plant traits such as plant height. The dependence of Nr on soil moisture, BWE and snow water equivalents (or water layers on top of the soil) reduces the practical applicability of Nr for estimating BWE or snow water equivalents. Nevertheless, the knowledge of these dependencies gained from simulations presented in this study may facilitate an improved analysis of the potential and limitations of Nr for future CRNS studies.
In addition to Nr, the potential of a combination of bare and moderated detector signals has been explored by Rasche et al. (2021) who used Spearman's rank correlation coefficient between the relative intensities of both detectors to derive information on heterogeneous soil moisture distributions around the instruments. Some initial simulation results showed that heterogeneous soil moisture distributions can affect the relationship between bare and moderated detector signals (Rasche et al., 2021). However, in this study, the simulation results from various scenarios and setups with a uniform soil moisture content throughout the model domain (Fig. A2) revealed that this relationship is also influenced by changing amounts of above-ground BWE and water on top of the soil surface. As a consequence, the proposed approach by Rasche et al. (2021) may only be applicable at sites where the amount of above-ground biomass and other hydrogen pools can be assumed to be (quasi-) static. Nevertheless, Fig. A2 also shows that the relationship tends to be closer to a 1:1 relationship when the soil moisture is high and deviates if the soil moisture is low. This tends also to be the case for higher amounts of above-ground BWE and SWE. The former is somewhat in line with the observed data shown in Rasche et al. (2021) which indicates that the relationship between bare and moderated detector signals could yield some yet unexplored use of CRNS.
3.5 Sensitive measurement radius and depth
3.5.1 Homogeneous simulation setups
In this study, the footprint radius R86 and footprint depth D86 are calculated as the 86 %-quantile of distances to the point of first soil contact of all detected neutrons in the model domain and their maximum depth in the model domain, respectively. R86 and D86 for the different, homogeneous simulation scenarios using the detector response function are shown in Figs. B1 and B2. The values lie in a comparable range to what has been stated in Köhli et al. (2015). For a moderated detector and over all scenarios, the derived average R86 is 154 m (median =168 m) if a detector response function is applied and weighted quantiles are calculated, or 163 m (median =178 m) using the energy window approach (not shown). Similarly, an average D86 of 33 cm (median =29 cm) and 31 cm (median =27 cm) can be derived, respectively, which shows that the impact of the moderated detector response function on the derived sensitive footprint is rather small. Similarly, for the bare detector, the average R86 is 135 m (median =145 m) using the detector response function and 130 m (median =141 m) for the energy window approach, respectively. On average, R86 of the bare detector is 12.5 % and 19.8 % smaller than that of a moderated detector, depending on if a detector response function is applied to evaluate the neutron transport simulations or if the simplified energy window thresholds are used. In contrast to a smaller R86, the D86 of a bare detector is on average 34 % and 43 % deeper with values of 44 cm (median =38 cm) and 45 cm (median =39 cm), respectively. These results indicate that the use of DRF is important for simulating the response of neutron intensities to changes in e.g., soil moisture but might be less important for determining R86 and D86 based on the point of first soil contact and maximum depth, respectively. Interestingly, changes in BWE amounts strongly affected R86 and, in the scenarios with high BWE (Fig. B1c), the measurement radius of bare and moderated detectors reached values of less than 30 m, with slightly larger values for the bare compared to the moderated detector. For epithermal neutrons, similar findings have been described by Köhli et al. (2015). Although the implementation of vegetation is rather simplified in these setups, the results may be a first indicator that the footprint at densely vegetated measurement sites such as forests could be much smaller than the range of 100–200 m currently accepted in the community.
Although the slightly smaller footprint radius but larger footprint depth of the bare detector is in line with simulation-based findings from Rasche et al. (2021), the derived radius and depth strongly depend on how the footprints are calculated from neutron transport simulations. This has been underlined by Rasche et al. (2021) who show the differences if the point of first soil contact or the point of thermalisation are used to calculate the sensitive depth and radius of thermal neutrons. If the latter is used, R86 and D86 are less dependent on soil moisture, R86 is relatively constant between 40 and 50 m and D86 is slightly smaller compared to epithermal neutrons. These calculated values are similar to those reported by Jakobi et al. (2021) who used the same definition to estimate the sensitive footprint for thermal neutrons from neutron transport simulations.
3.5.2 Non-homogeneous simulation setups
In order to shed more light on how to estimate the footprint radius and depth for bare detector signals, we conducted additional and non-homogeneous simulation setups. First, we conducted a vertically expanding soil setup to gain more information on the sensitive depth (Fig. 1a). In Fig. 11, it can be seen that the signals of a bare and moderated detector increase when more water is replaced with soil. This occurs for both simulated soil moisture contents. The threshold at which the simulated intensity changes less than 1 % to the previous scenario is reached later for the bare detector compared to the moderated detector. Also, a dependence of this threshold on soil moisture content can be observed. Without previous assumptions on how to calculate the footprint depth, these simulation-based results confirm findings from Rasche et al. (2021) that neutron signals observed with a bare detector have a larger measurement depth compared to moderated detector signals. Thus, for both moderated and bare detectors, the use of a DRF and of the maximum depth reached by all detected neutrons should be applied when calculating D86 from neutron transport simulations.
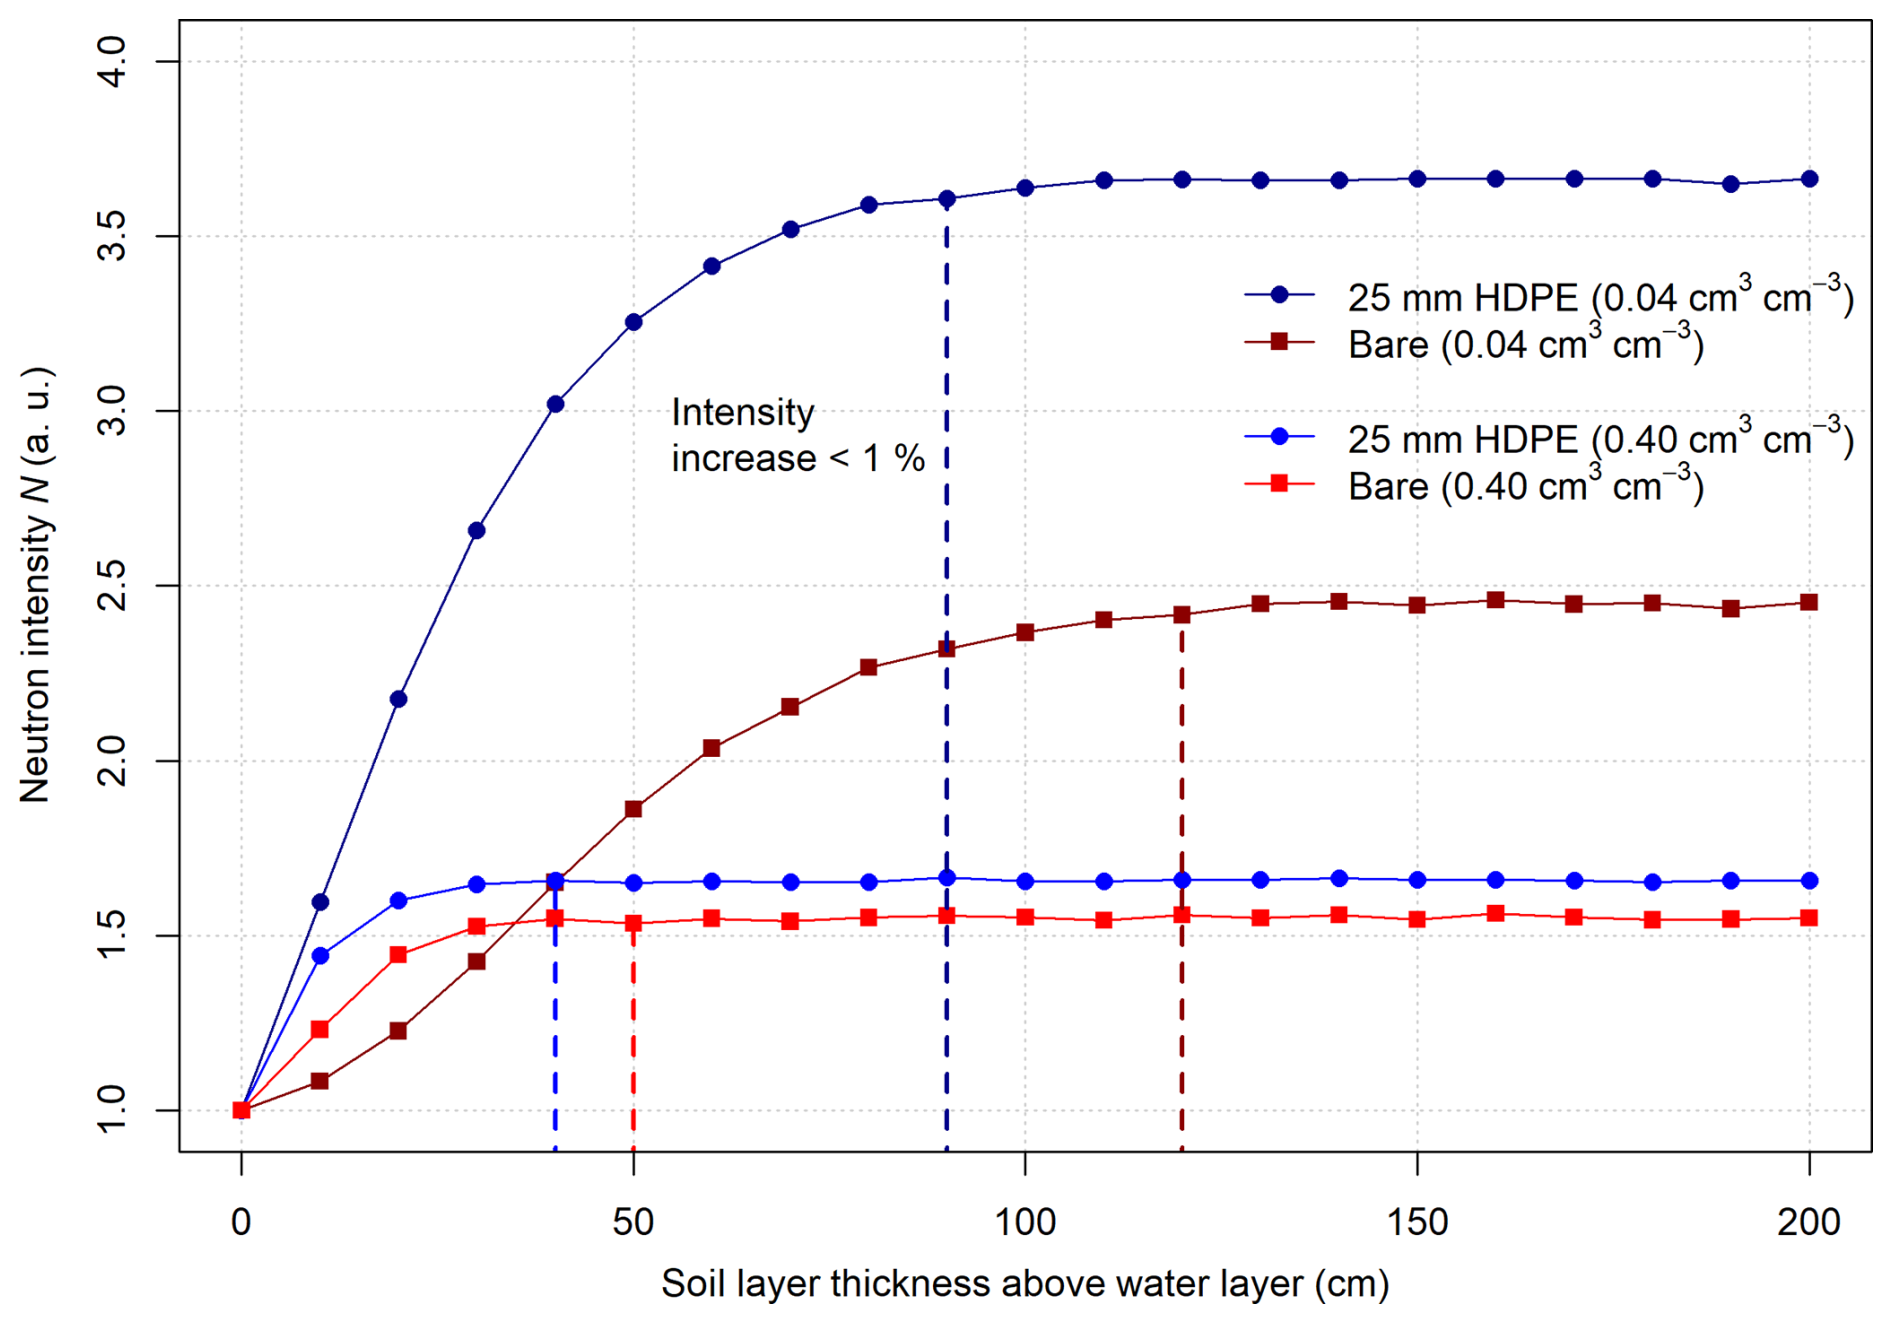
Figure 11Simulation results for the simulation experiment with a vertically expanding soil layer in 10 cm increments for a bare and a moderated detector and two different soil moisture contents. Dashed vertical lines indicate when the threshold of a change (increase) less than 1 % to the previous scenario is reached.
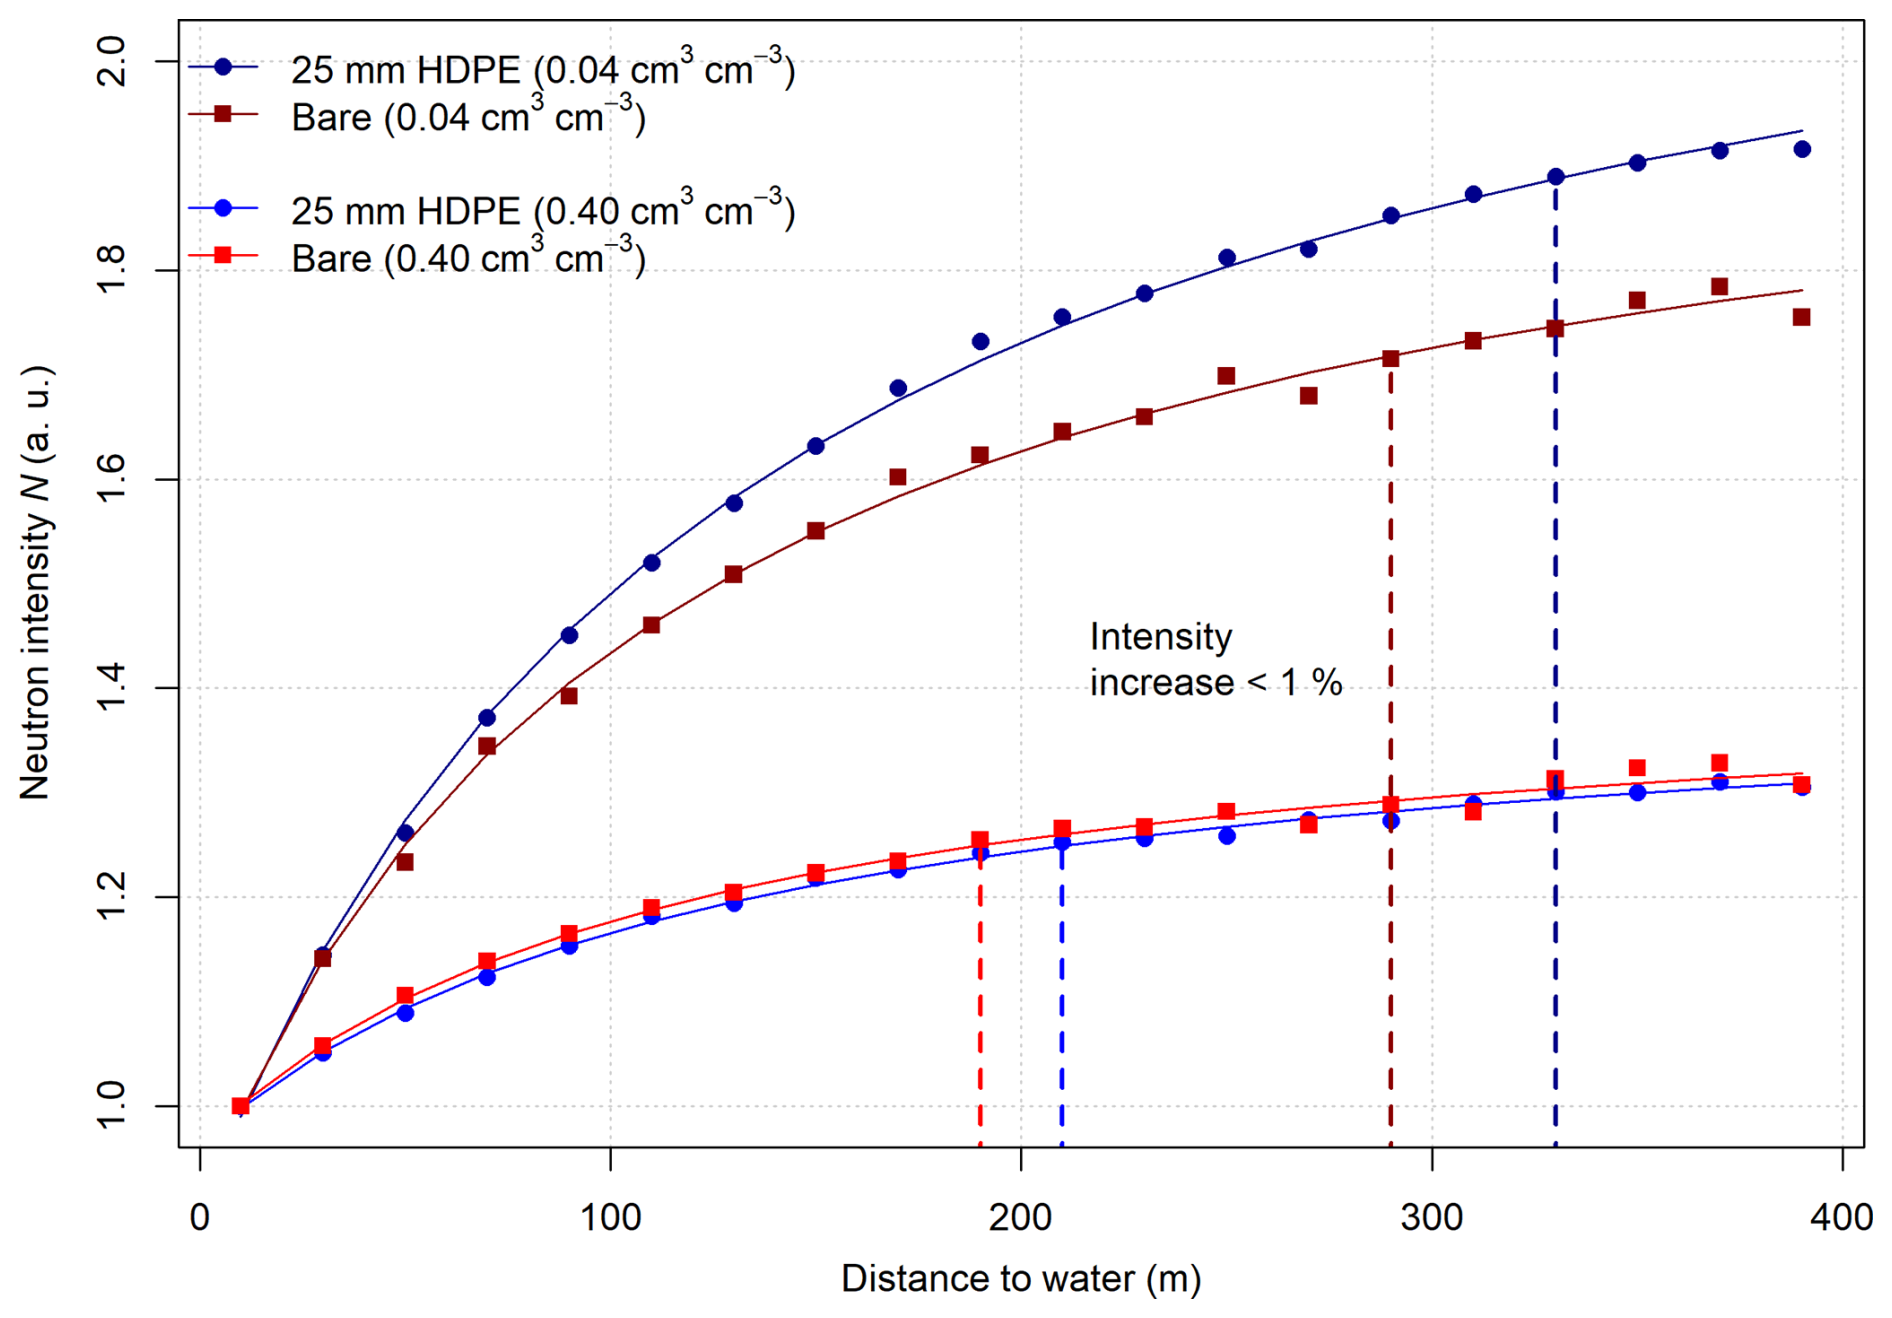
Figure 12Simulation results for the simulation experiment with a horizontally expanding soil island in 20 m increments for a bare and a moderated detector (10 m radius) and different soil moisture contents. A hyperbolic function of the same type as Eq. (1) is fitted to the data (lines). Dashed vertical lines indicate when the fitted data reach a threshold of a change (increase) less than 1 % to the previous scenario.
A similar simulation experiment was conducted for R86 (Fig. 1b). Here, an expanding soil island with different soil moisture contents was simulated to investigate the signal response of a bare and a moderated detector. In contrast to the vertically expanding soil thickness scenarios used to investigate D86, the 1 %-threshold is reached earlier for the bare detector compared to the moderated detector and a dependence on soil water content is also seen here (Fig. 12). This again confirms findings by Rasche et al. (2021) that the same definition (i.e., point of first soil contact) should be used with DRFs to estimate the footprints of bare and moderated detector signals. It also underlines that the results shown in Figs. B1 and B2 provide reasonable estimates of the measurement radius and depth of bare and moderated detectors under various environmental conditions.
Due to the distinct difference in response between bare and moderated detector signals to changes in above-ground BWE, we also set up horizontally heterogeneous simulation scenarios with an expanding clearing of vegetation instead of an expanding soil island in a water-filled model domain (Fig. 1c). Figure 13 shows the results for two setups with higher (panel a) and lower (panel b) vegetation height and BWE. It is apparent that the bare and moderated detector signals behave differently in these scenarios, and that such difference is larger when soil moisture is lower (Fig. 13a). In general, the moderated detector intensities increase continuously with increasing distance to vegetation and the response is stronger with higher vegetation. The bare detector intensities, instead, decrease rapidly up to around 40–50 m distance before a rather constant behaviour up to 100 m distance and a later increase. The increase beyond 100 m is similar to that of the moderated neutron intensities. This behaviour is seen for both simulated soil moisture contents in the forest setup (Fig. 13a) but only for the lower simulated soil moisture of 0.04 cm3 cm−3 when less vegetation is present (Fig. 13b). These bare detector responses are different compared to those of an expanding soil island (shown in Fig. 12). Also, they indicate that a large fraction of the difference between moderated and bare detector signal responses shown in Fig. 7 is likely to arise from the first ≈50 m around the neutron detector. This is also the distance in which detected neutrons reach thermal energies prior to reaching the virtual detector (Jakobi et al., 2021; Rasche et al., 2021). As a consequence, the weighting functions derived by Jakobi et al. (2021) for neutrons in the thermal energy range, could be used to describe the sub-footprint of the bare detector in which sensitivity to BWE, snow water equivalents and soil chemistry is highest. Nevertheless, if BWE changes occur in distances ⪆50 m and beyond, the response of bare detector signals to changes in BWE will be different to what is shown in Fig. 7 and can be expected to become more similar to the response of moderated detector signals. When taken to real-world measurements, these findings suggest that bare detectors may only be used to monitor BWE changes up to the 40–50 m distance of thermalisation found by Jakobi et al. (2021) and Rasche et al. (2021). Beyond such distance and especially if BWE changes are non-homogeneous in space, monitoring of BWE with bare detectors may not be possible. This can also be expected to hold true for non-homogeneous distributions of snow water equivalents around the instrument with an increase in bare but a decrease in moderated intensities when snow is located within ≈50 m radius, only.
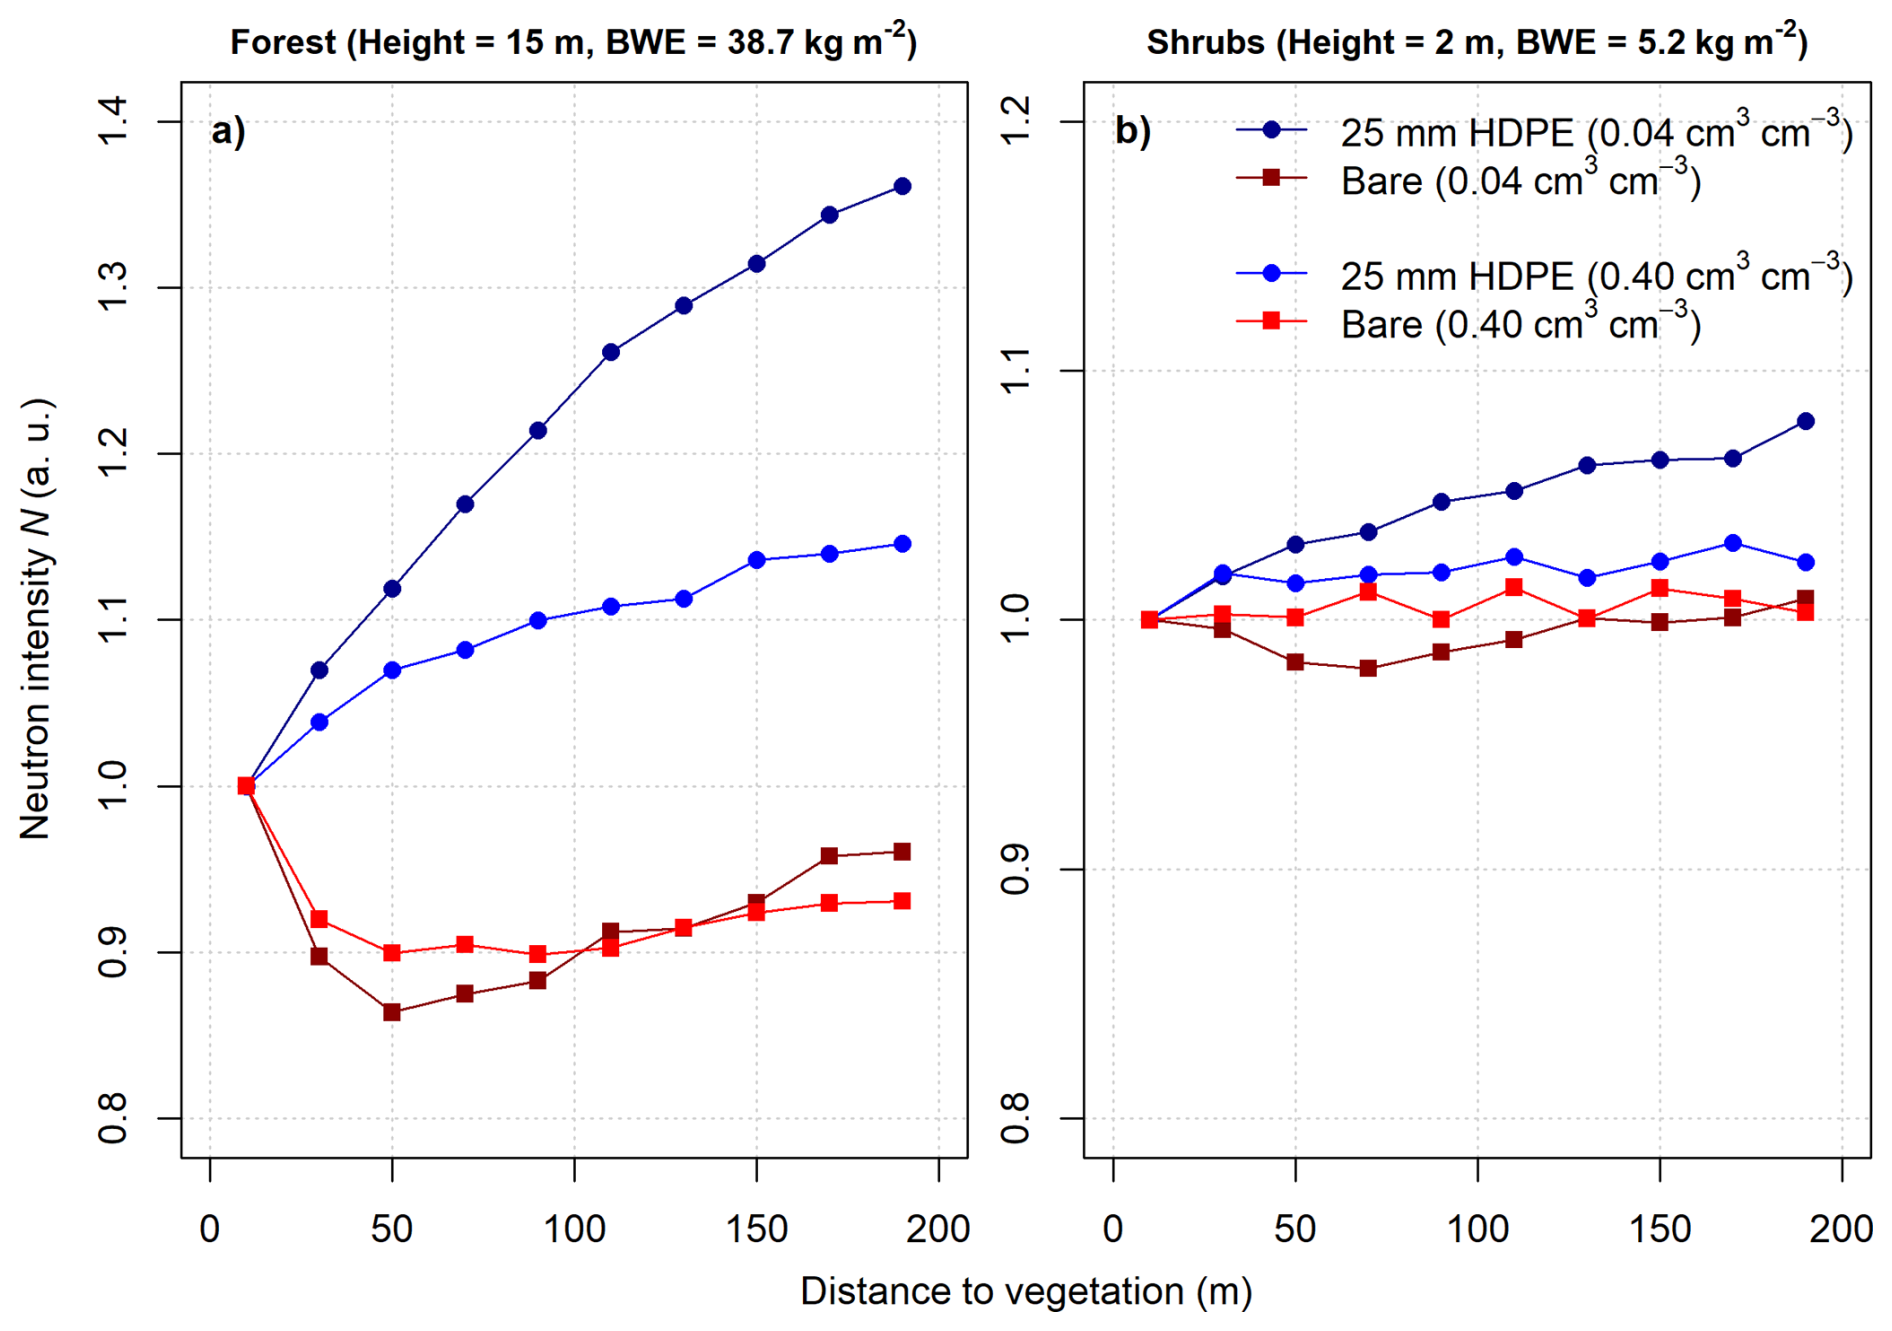
Figure 13Simulation results for the simulation experiment with a horizontally expanding clearing in a vegetated area with higher (a) and lower (b) BWE representing forest and shrubs. The clearing expands in 20 m increments with a constant virtual detector radius of 10 m.
The larger footprint radius and deeper measurement depth of the bare detector also has practical implications when reference soil moisture information are weighted for calibrating neutron-to-soil moisture transfer functions using observation data. Although the first set of weighting functions developed by Jakobi et al. (2021) can be expected to be valid for the thermal part of the life of a detected neutron only, it may pose a valuable tool for describing the soil moisture sensitivity of bare detectors in their near-field (≈50 m) radius where their signals are also most sensitive to e.g., changes in BWE. However, following the results of the present study, these first weighting functions are not sufficient to describe the entire footprint of bare detector signals in terms of soil moisture sensitivity. As a consequence, a set of weighting functions similar to those developed in Köhli et al. (2015) and Schrön et al. (2017) for epithermal neutrons are required which include the entire life of a detected thermal neutron as well as a different sensitivity to BWE and absolute air humidity. Different soil chemical compositions may also need to be considered. Despite the average differences in R86 and D86 between neutrons from moderated detectors and neutrons from bare detectors, a much larger horizontal footprint radius than derived by Jakobi et al. (2021) as well as a stronger soil moisture dependency was found in this study. This is further amplified by the use of detector response functions instead of selected energy windows. Therefore, using the same weighting functions developed by Schrön et al. (2017) for epithermal neutrons also for thermal neutrons and thus, bare detectors may be a more suitable first-order approach to represent the entire sensitive footprint. Nevertheless, designated weighting approaches for neutrons from bare detectors remain an important knowledge gap and should be investigated in future studies to further increase the applicability of bare detector signals in the scope of CRNS.
This study provides the first generalised comparison of the complex response of bare and moderated low-energy neutron detector signals to changes in soil moisture under a broad range of environmental conditions. Based on our results, we conclude that a paradigm shift is necessary on how we interpret these two types of neutron signals. Moderated and bare detector signals can no longer be treated as being independent from single environmental variables nor be used for independently estimating soil moisture, biomass or snow water equivalents since we revealed that neutron signals respond to different hydrogen pools in a complex, sometimes counter-intuitive manner.
Neutrons observed with bare (unmoderated) detectors respond differently to the environment compared to neutrons observed with moderated detectors. Furthermore, the simulated response of both bare and moderated detectors, is sensitive to the choice of energy thresholds (energy windows) and detector response function used in the model to mimic the sensitivity of real neutron detectors. This study showed the benefit of using detector response functions for enhancing the comparability between simulation results and observations. However, it should be noted that the main results of this study were derived for solitary bare and moderated detectors, while many operational CRNS stations use co-located detector setups. As shown in Sect. 3.1, co-location with HDPE shielding can shift the bare detector response function and increase absolute count rates which means that the quantitative transfer of the presented results to specific co-located detector configurations may require additional site- and setup-specific assessments.
While bare detector signals always respond to soil moisture changes, this response is less intense than the response of moderated detectors. In contrast, the response of bare detectors to changes in biomass (i.e. BWE) and water layers on top of the soil (e.g., as snow) is distinctly different from that of moderated detectors. Nevertheless, our simulations also highlight the dependence of epithermal neutron signals from moderated detectors to changes in water layers on top of the soil (e.g., snow), BWE and biomass height and provide new, simulation-based correction approaches. Due to the different sensitivity of bare and moderated detectors to soil moisture, the often used neutron ratios for deriving BWE or snow are likewise influenced by soil moisture. Consequently, their use for these purposes is limited and care needs to be taken when neutron ratios are used to derive snow or biomass changes from CRNS.
Baatz et al. (2015)Morris et al. (2024)Table 4Key implications for practical applications of CRNS derived from this study.
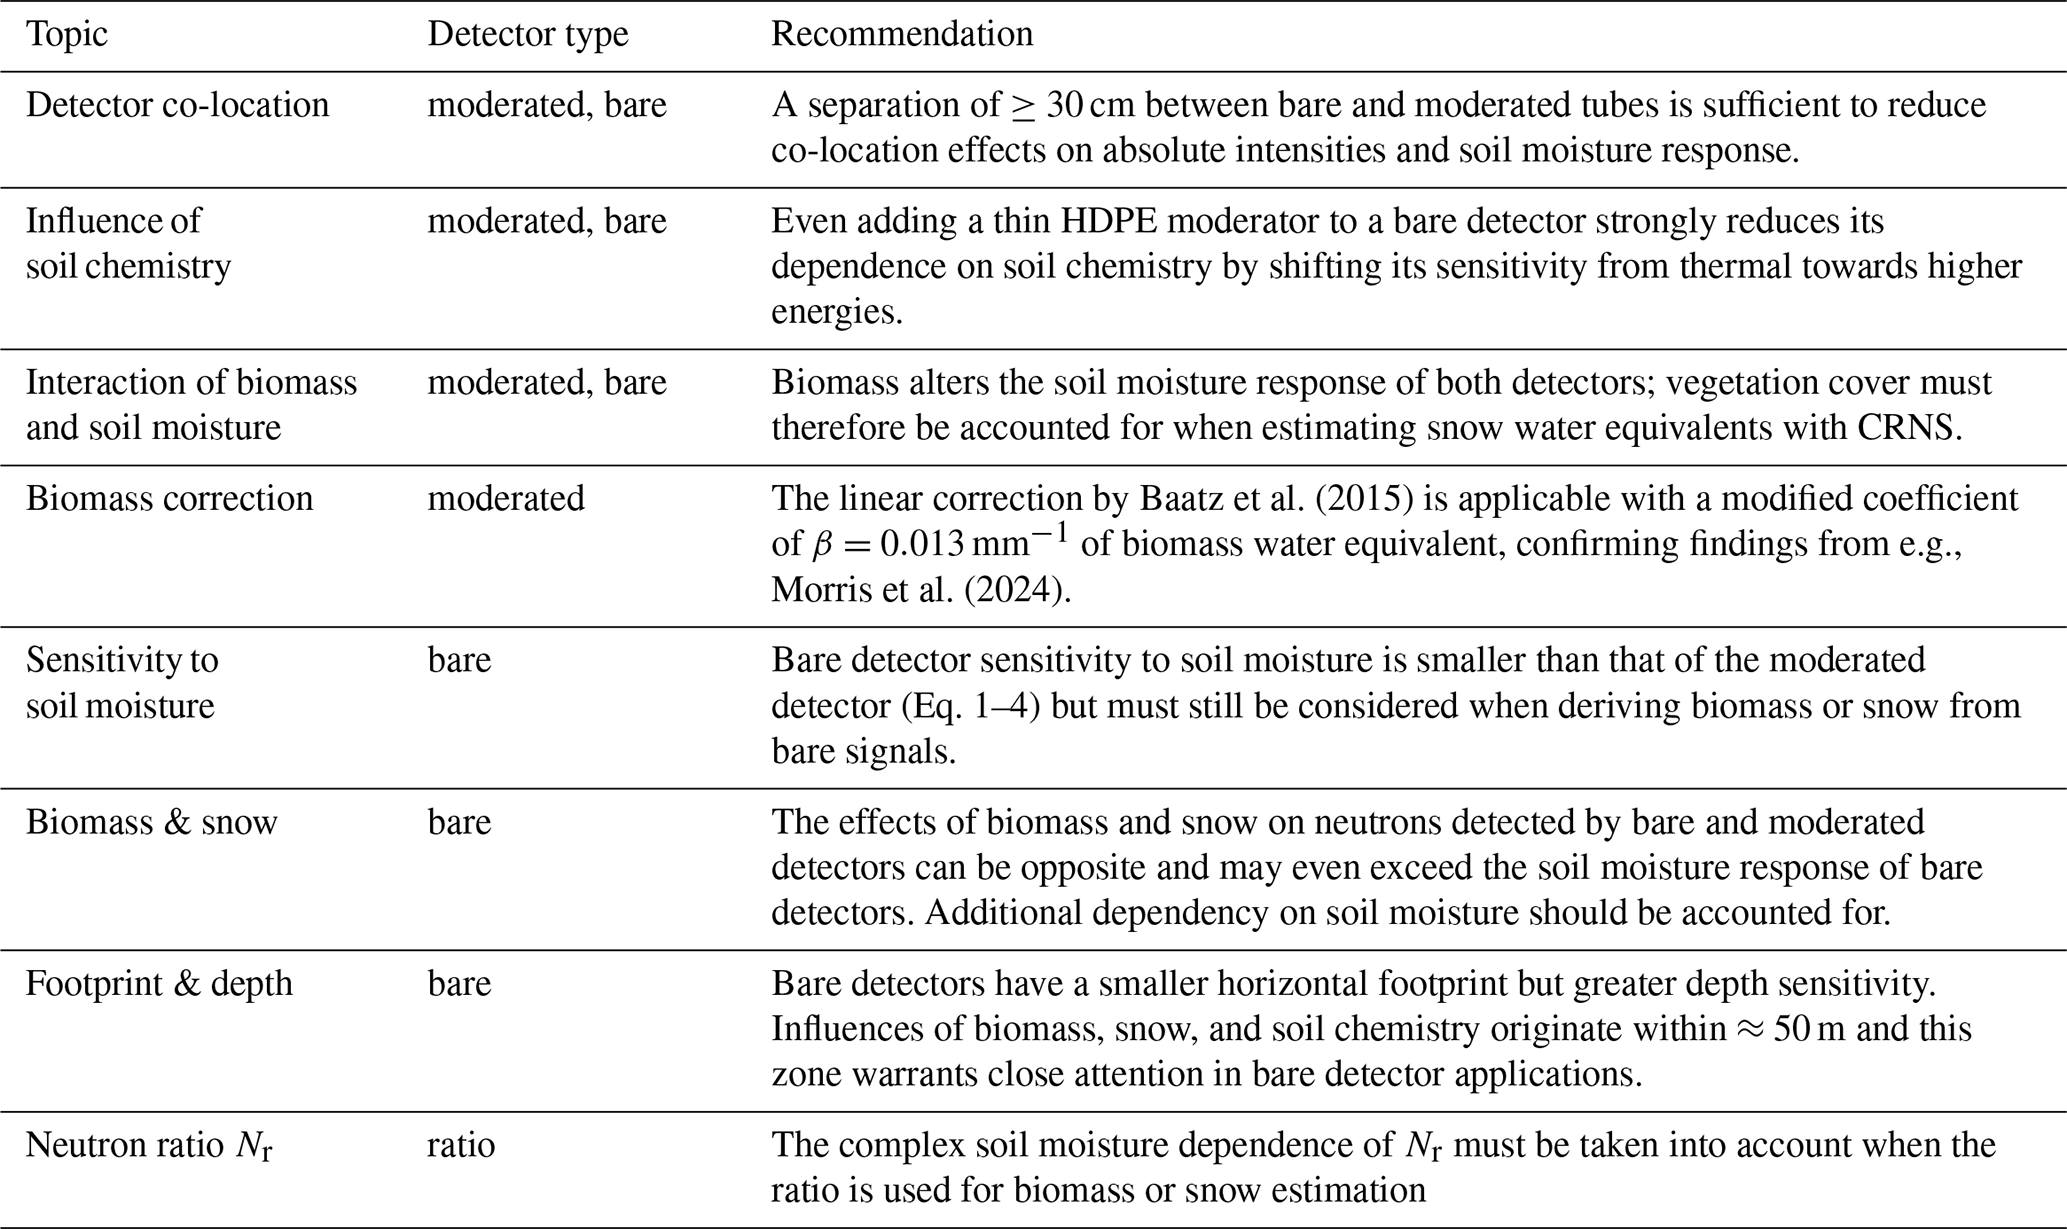
The results of this study also highlight that the footprint depth and radius for bare detectors with respect to soil moisture is larger than assumed in previous studies. While this holds true for both using an energy window or applying a detector response function to mimic a bare detector, some clarification for real-world CRNS applications is necessary. For example, while biomass changes within ≈50 m radius are responsible for the contrasting response of bare and moderated detector signals, changes occurring beyond this distance will lead to a rather similar, monotonic response for both bare and moderated detectors. This is due to the fact that detected thermal neutrons reach thermal energies within ≈50 m radius around the detector, and thus this distance represents the sensitive radius of their thermal life stage before detection. Here, their response can be expected to differ most from epithermal neutrons. However, our results also highlight that measured thermal neutron intensities carry information on environmental variables beyond ≈50 m distance and thus, originating from the life stage as higher-energy epithermal neutrons. This is the case, for example, for soil moisture variations at larger distances that influence the number of epithermal neutrons that can reach the ≈50 m radius from the instrument and thus have a chance of being thermalised and detected. However, the characteristic dependencies of thermal neutron signals (that are absent or contrary for epithermal neutron signals) with soil chemistry, biomass and snow can be expected to originate largely from distances ⪅50 m. This leads to the conclusion that estimating changes and monitoring BWE or snow water equivalents with bare detectors is most effective within the thermalisation radius. Beyond such distance, changes in these environmental variables will likely have a minor and different effect on bare detector count rates which may well prevent their estimation. It should be noted that these conclusions are not limited to neutron signals observed with bare detectors which also contain fractions of higher-energy neutrons, but affect detected thermal neutrons in general.
Despite using simplified simulation setups, the results in this study are generally in line with empirical findings from observation data and support the theoretical concepts derived in previous studies concerning the response and potential applications of bare and moderated detectors. While the limited comparability of these generalised simulations with complex and heterogeneous real-world conditions is apparent, this study is of value for better understanding and interpreting observed neutron signals at specific real-world observation sites with key implications for practical applications being summarised in Table 4. Finally, the presented results and findings may serve as a starting point for the design of site-specific simulation studies as well as generalised but more detailed neutron transport simulations to investigate neutron signal responses to changes in biomass and snow water equivalents, their geometry, and spatio-temporal distribution around the neutron detector.
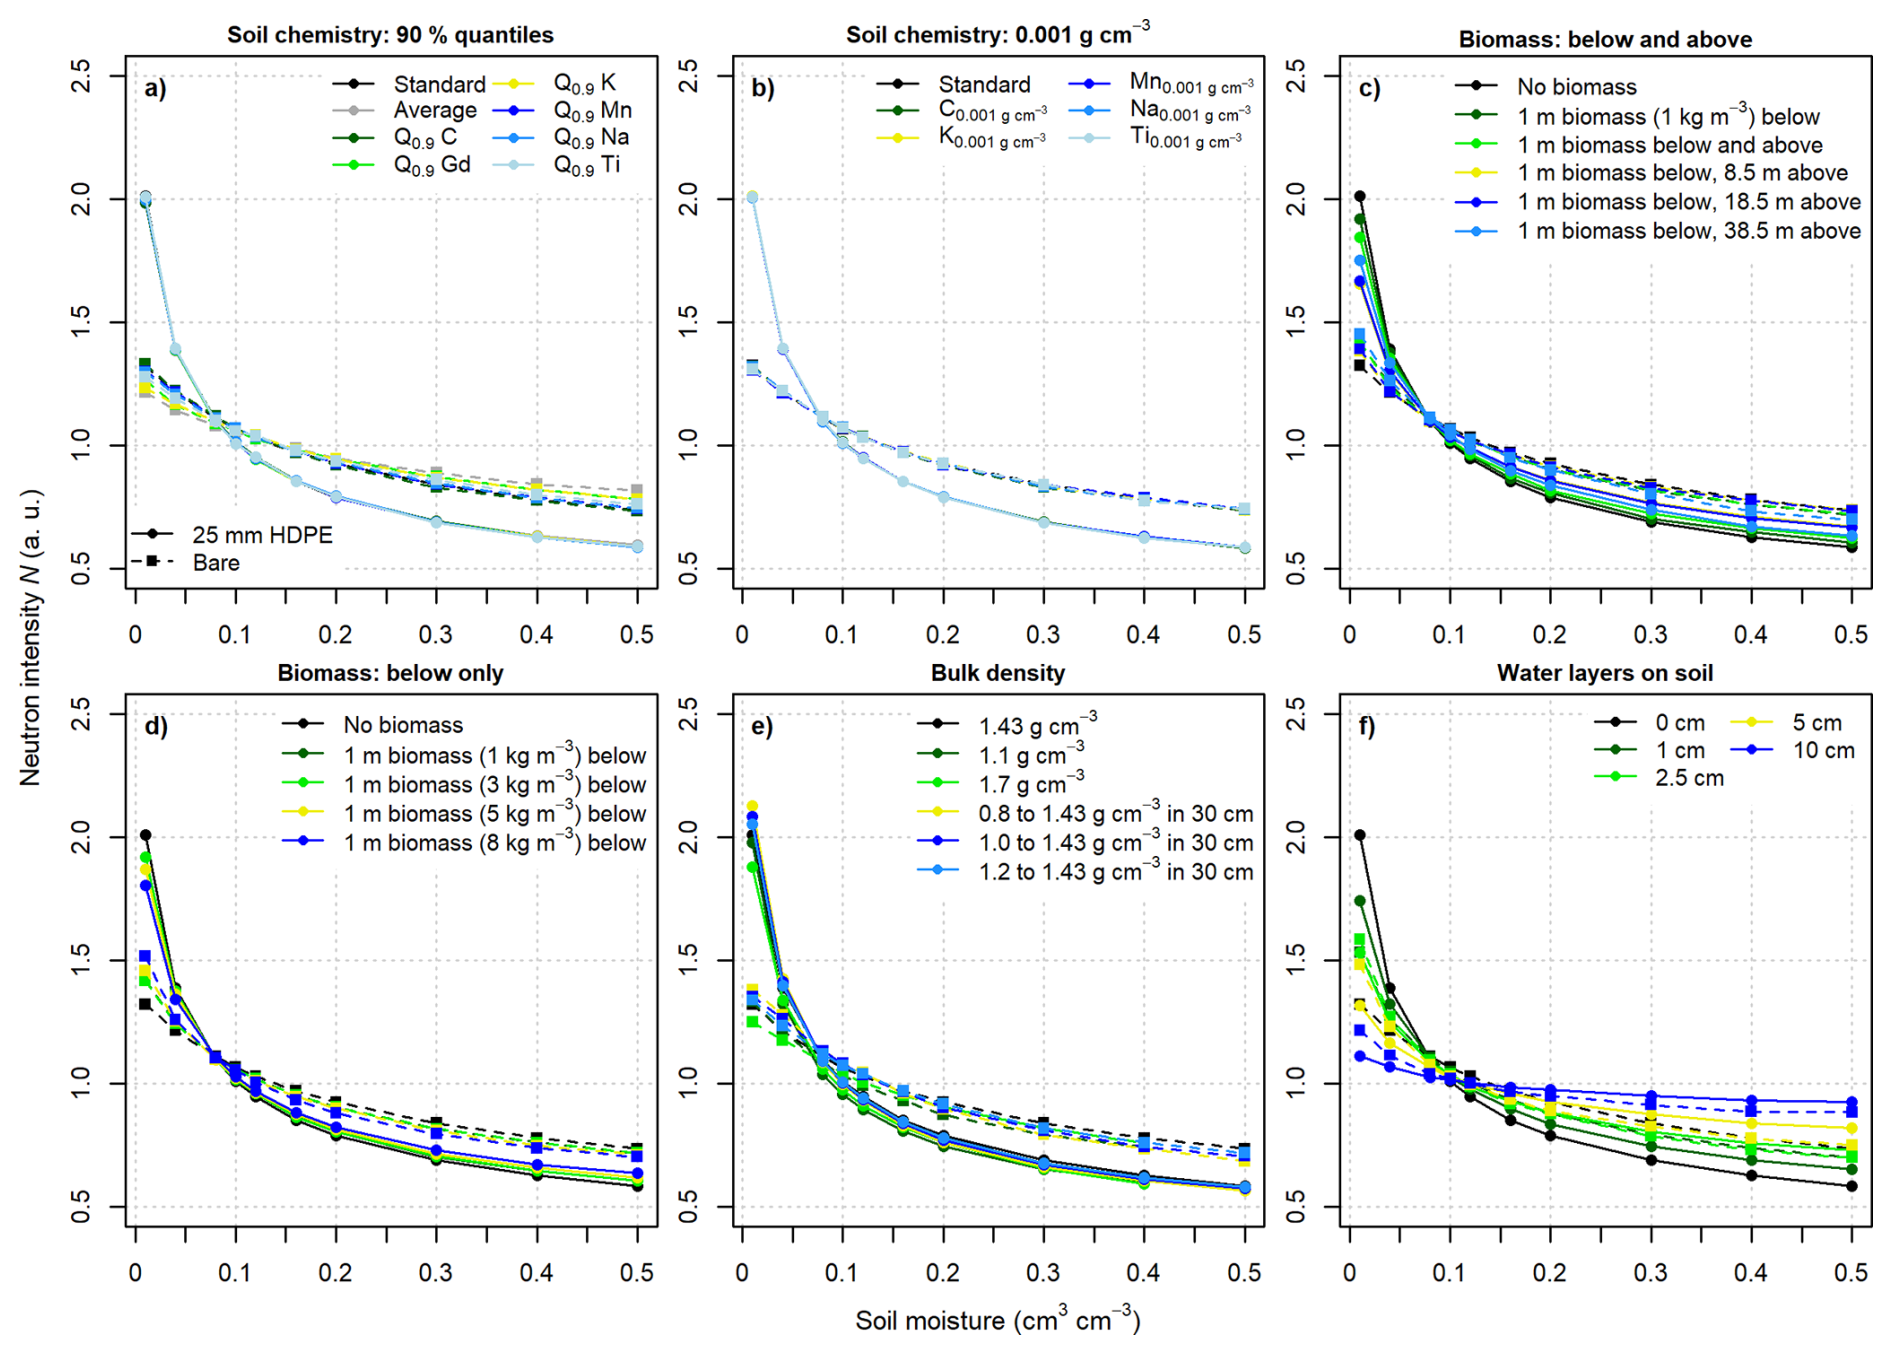
Figure A1Neutron response relative to the respective average in each simulation setup. Dashed lines with squares represent bare detector intensities while solid lines with dots represent moderated detector (25 mm HDPE shielding) intensities. The colours refer to the individual selected simulation setups listed in Tables 1–3.
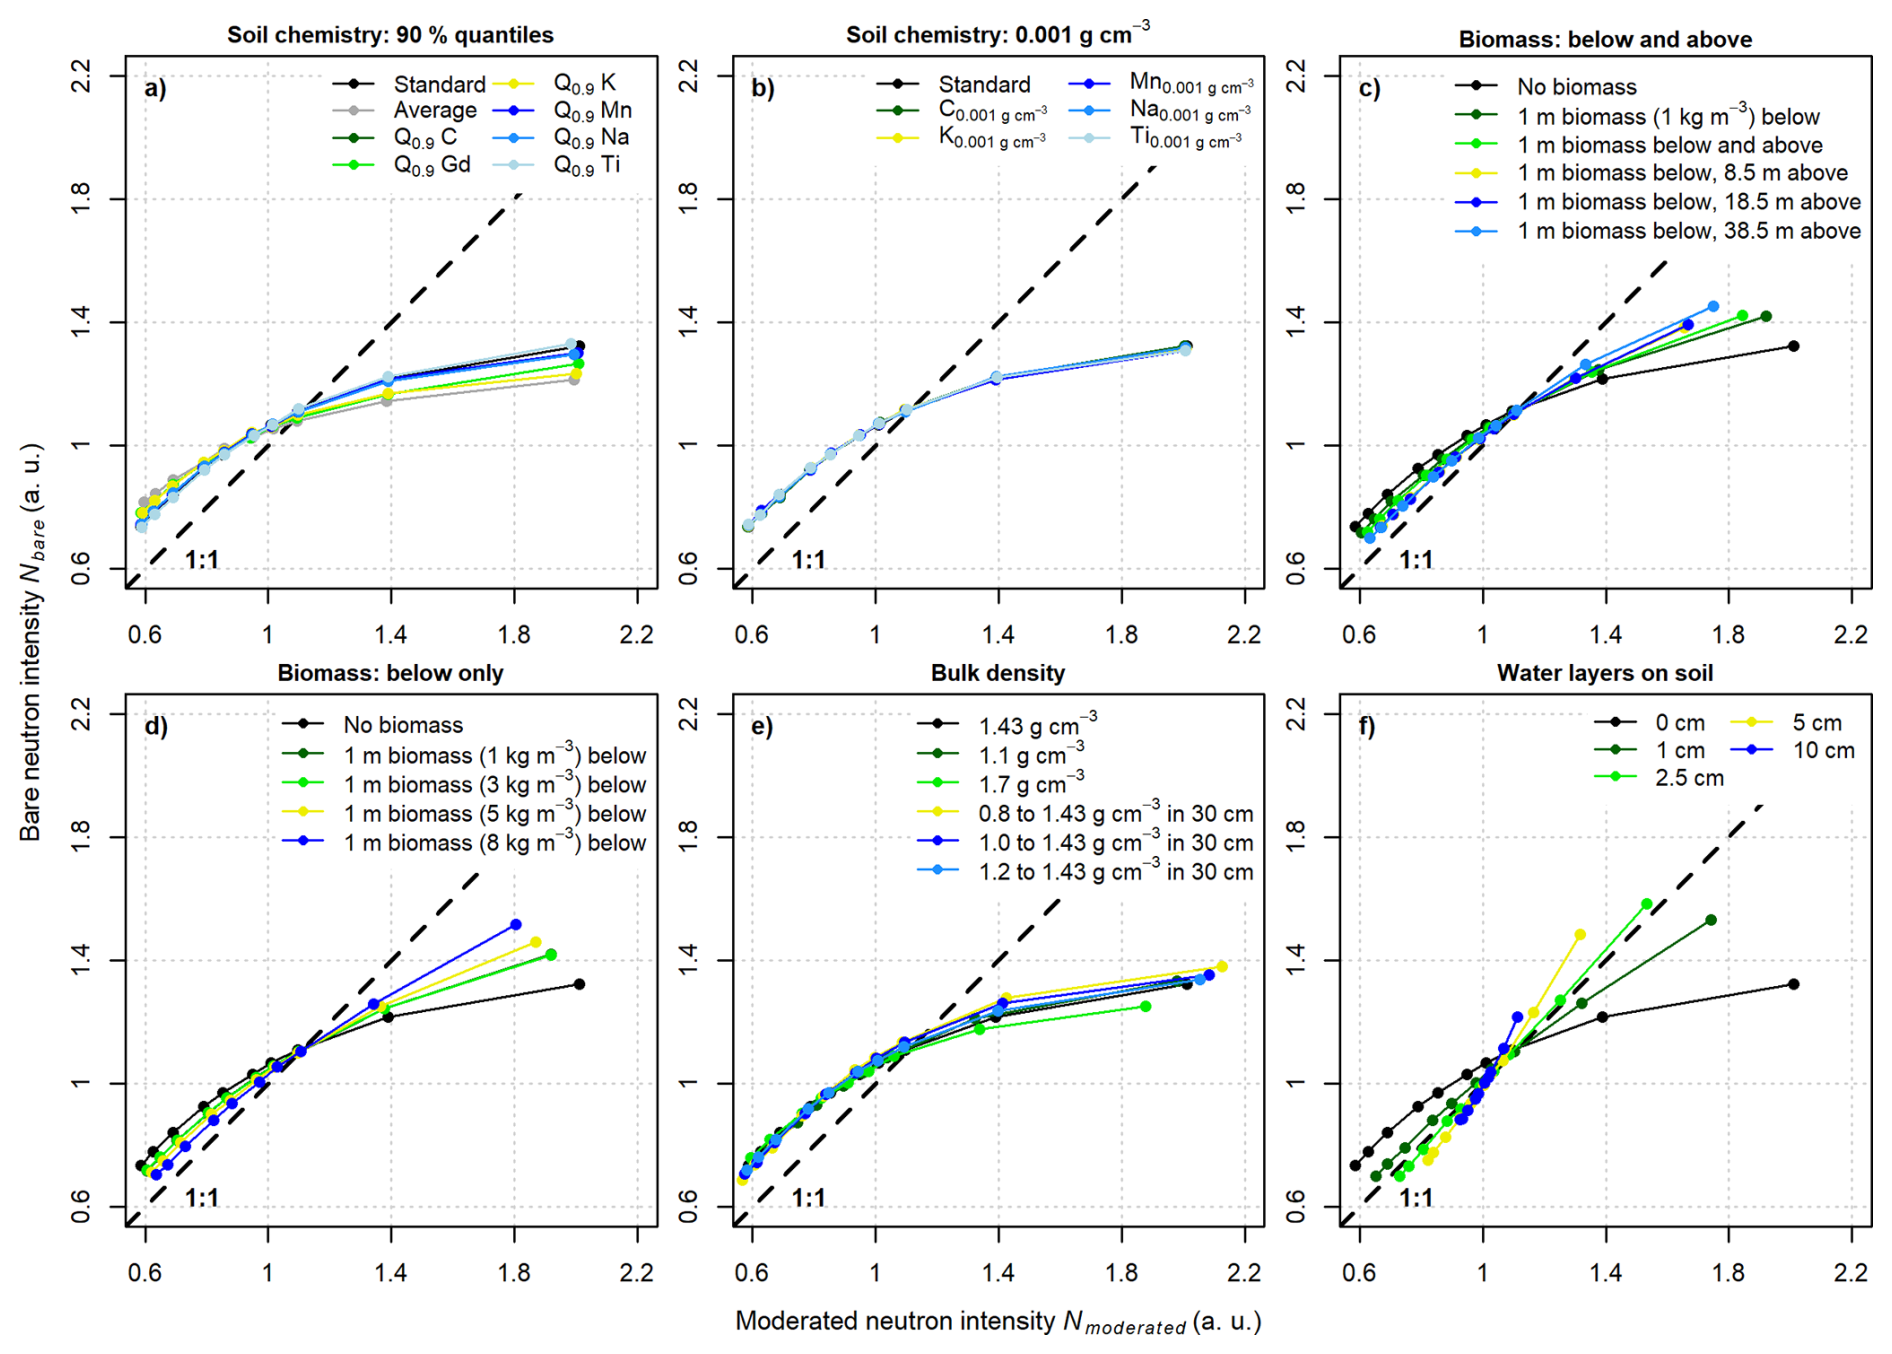
Table A1Parameters p1…3 in Eqs. (1) and (4) fitted for the individual simulation setups. RMSE values are shown per setup for individually fitted parameters p1…3 (RMSEindividual) and for the parameters of the standard soil chemistry but with calibrated reference intensity above water Nwater and rescaled soil bulk density (RMSEcalibrated) as displayed in Fig. 6.
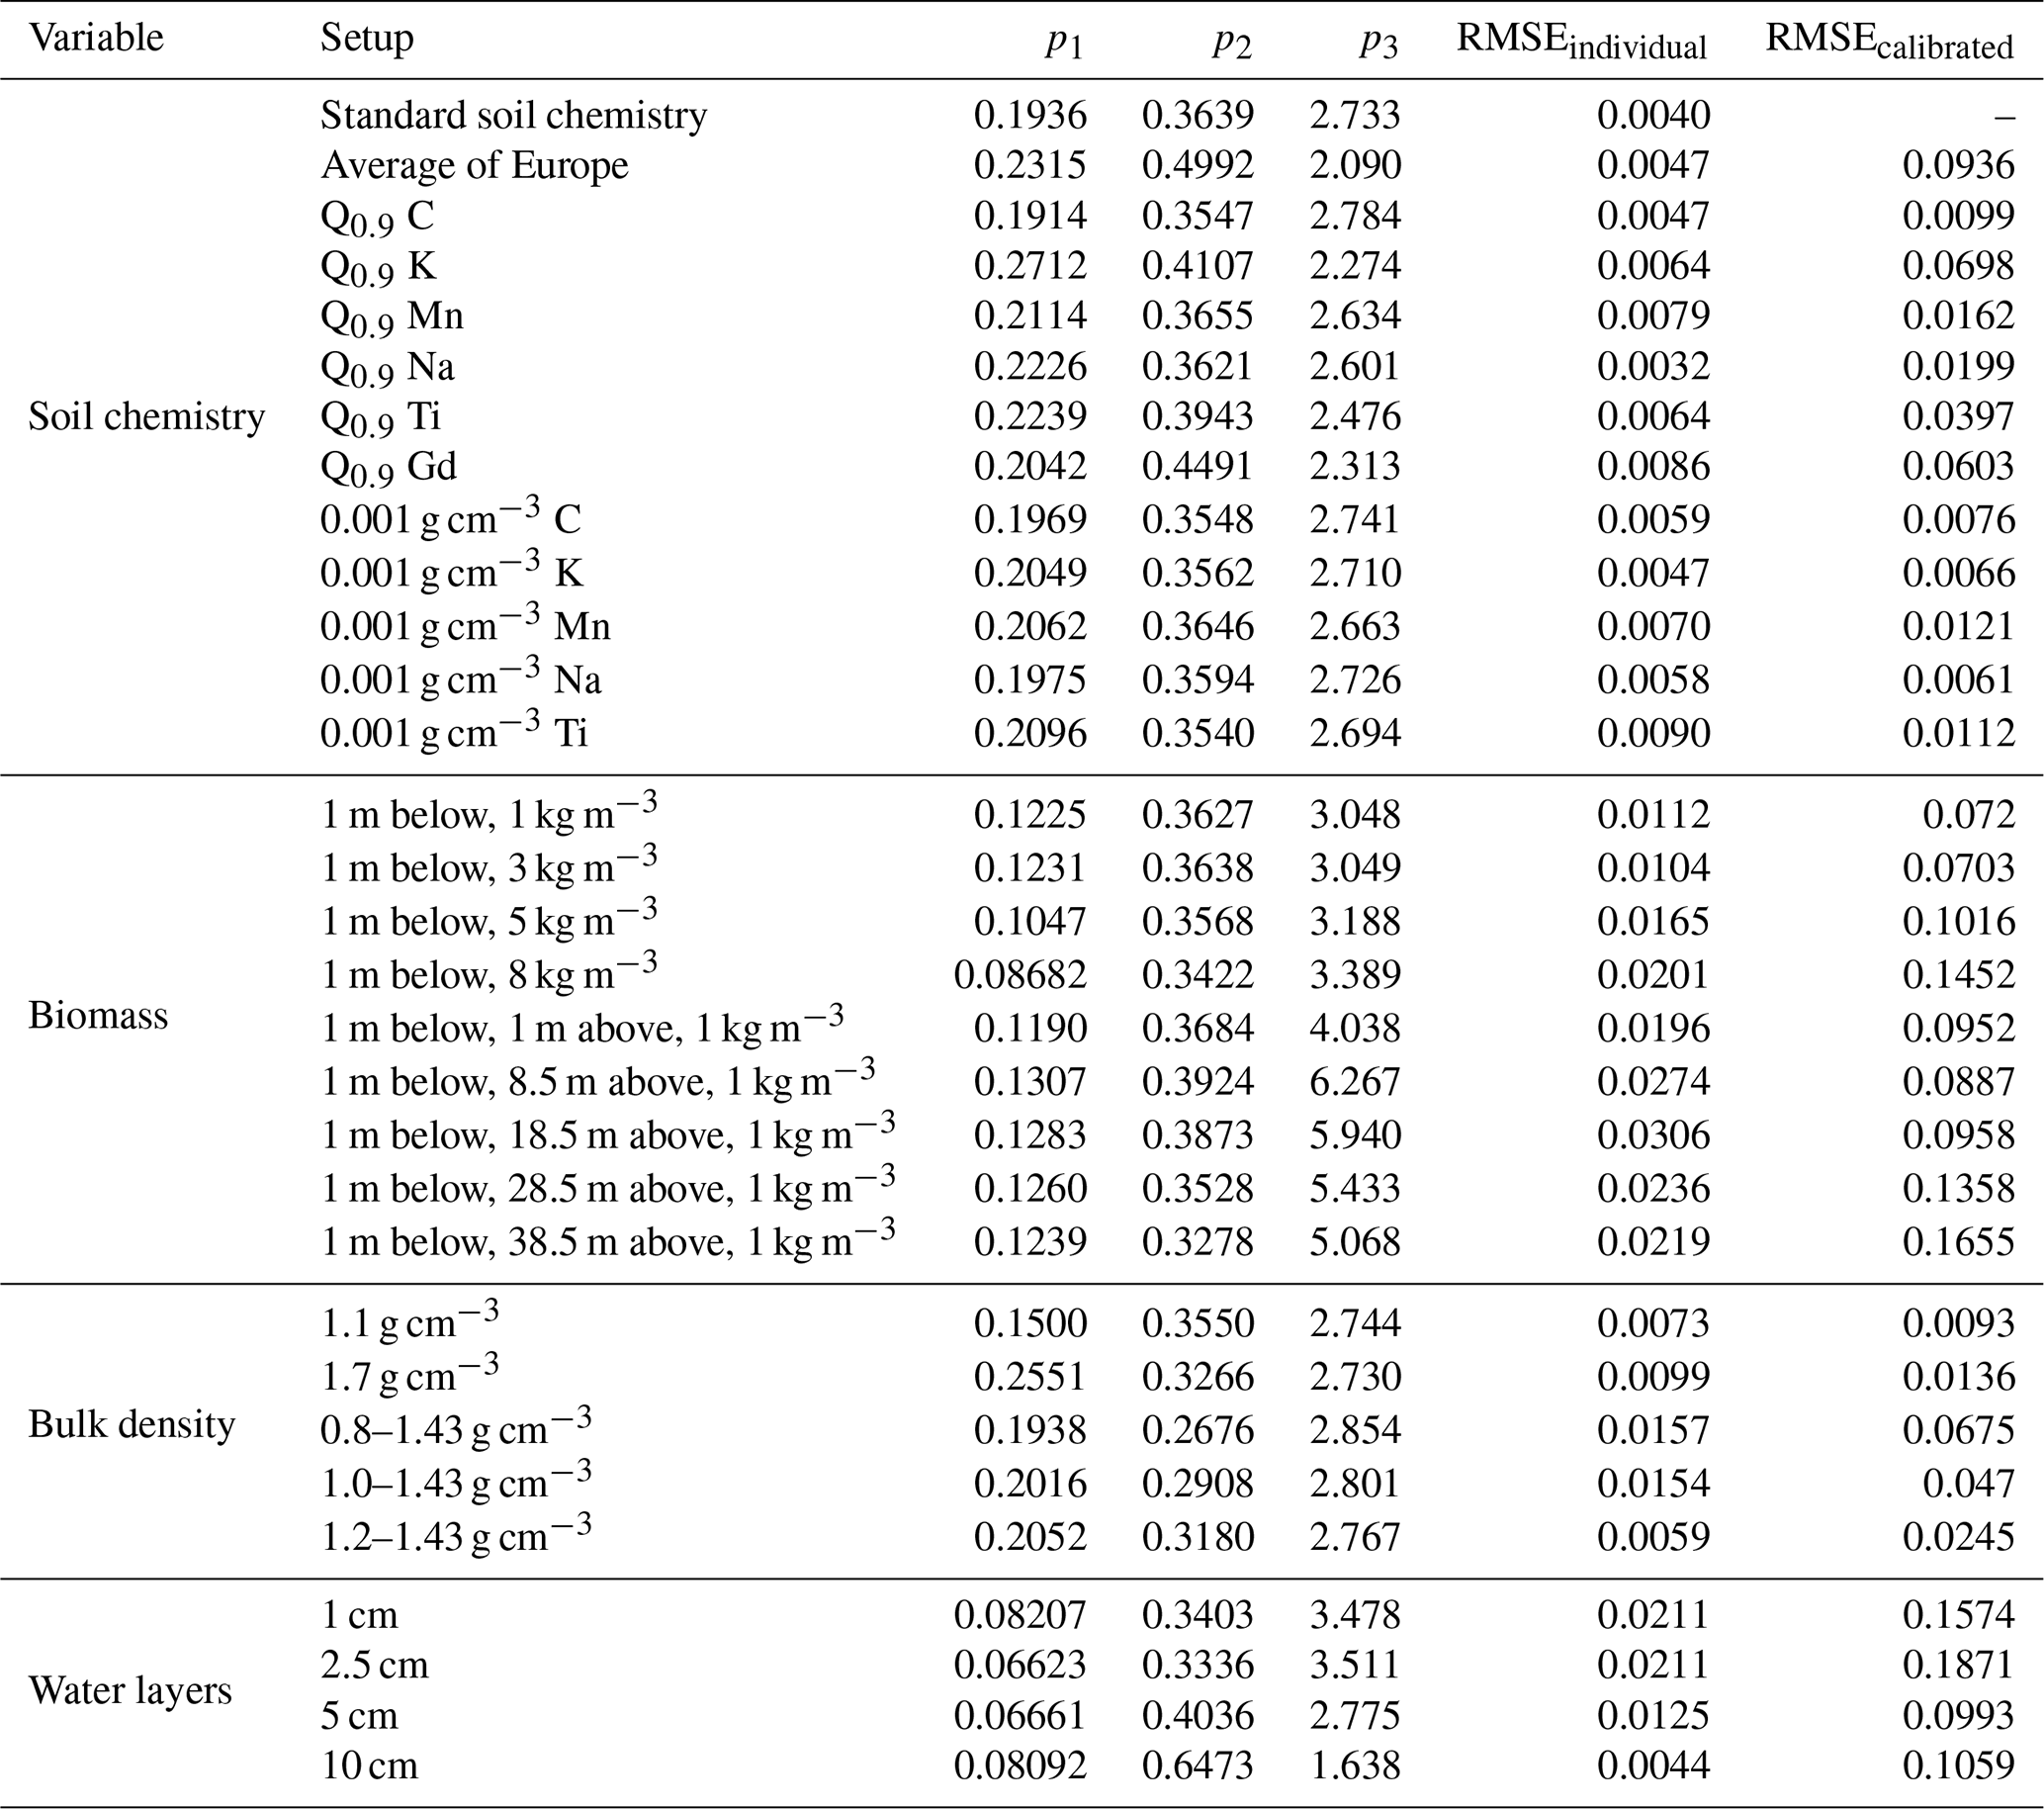
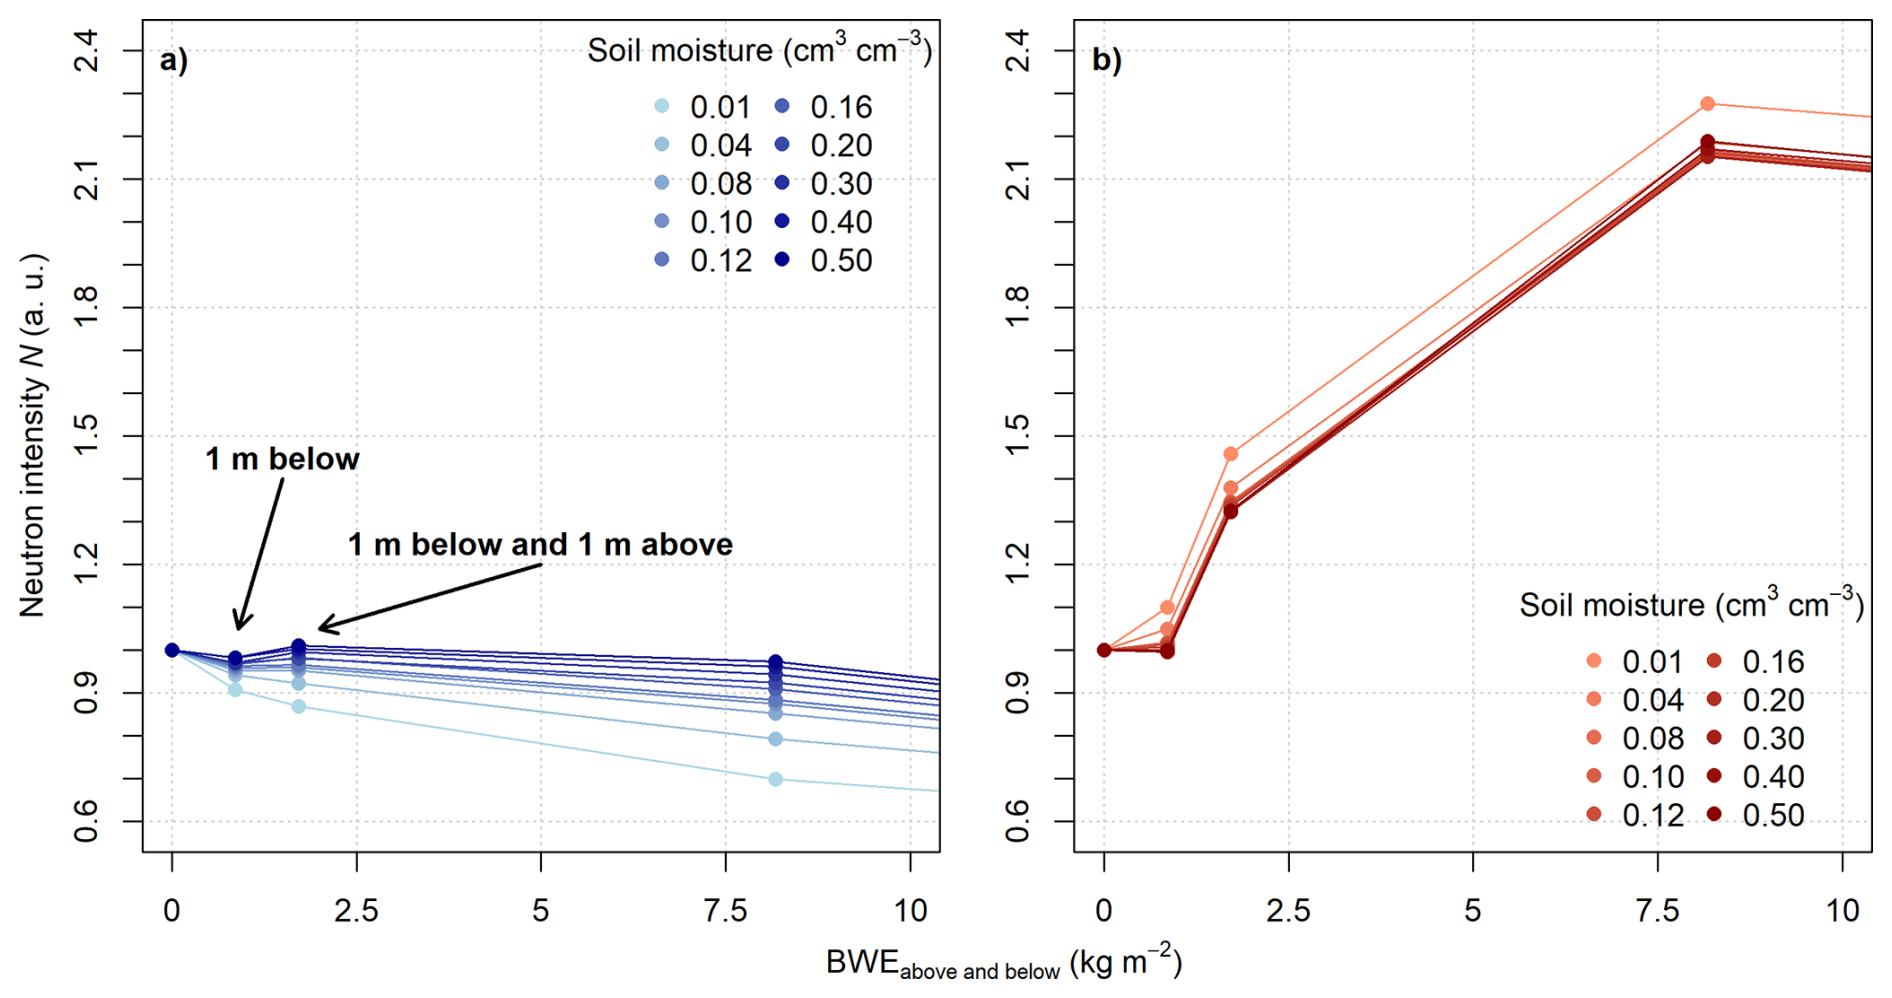
Figure A3Detail plot of the neutron response to changes in above-ground biomass water equivalents (BWE) above and below the virtual moderated (a) and bare (b) detector. The moderated detector intensity increases from the setup with biomass below the detector to above and below the detector for higher soil moisture contents. For lower soil moisture contents, a continuous decrease can be observed. The bare detector intensities increase for all simulated soil moisture contents.
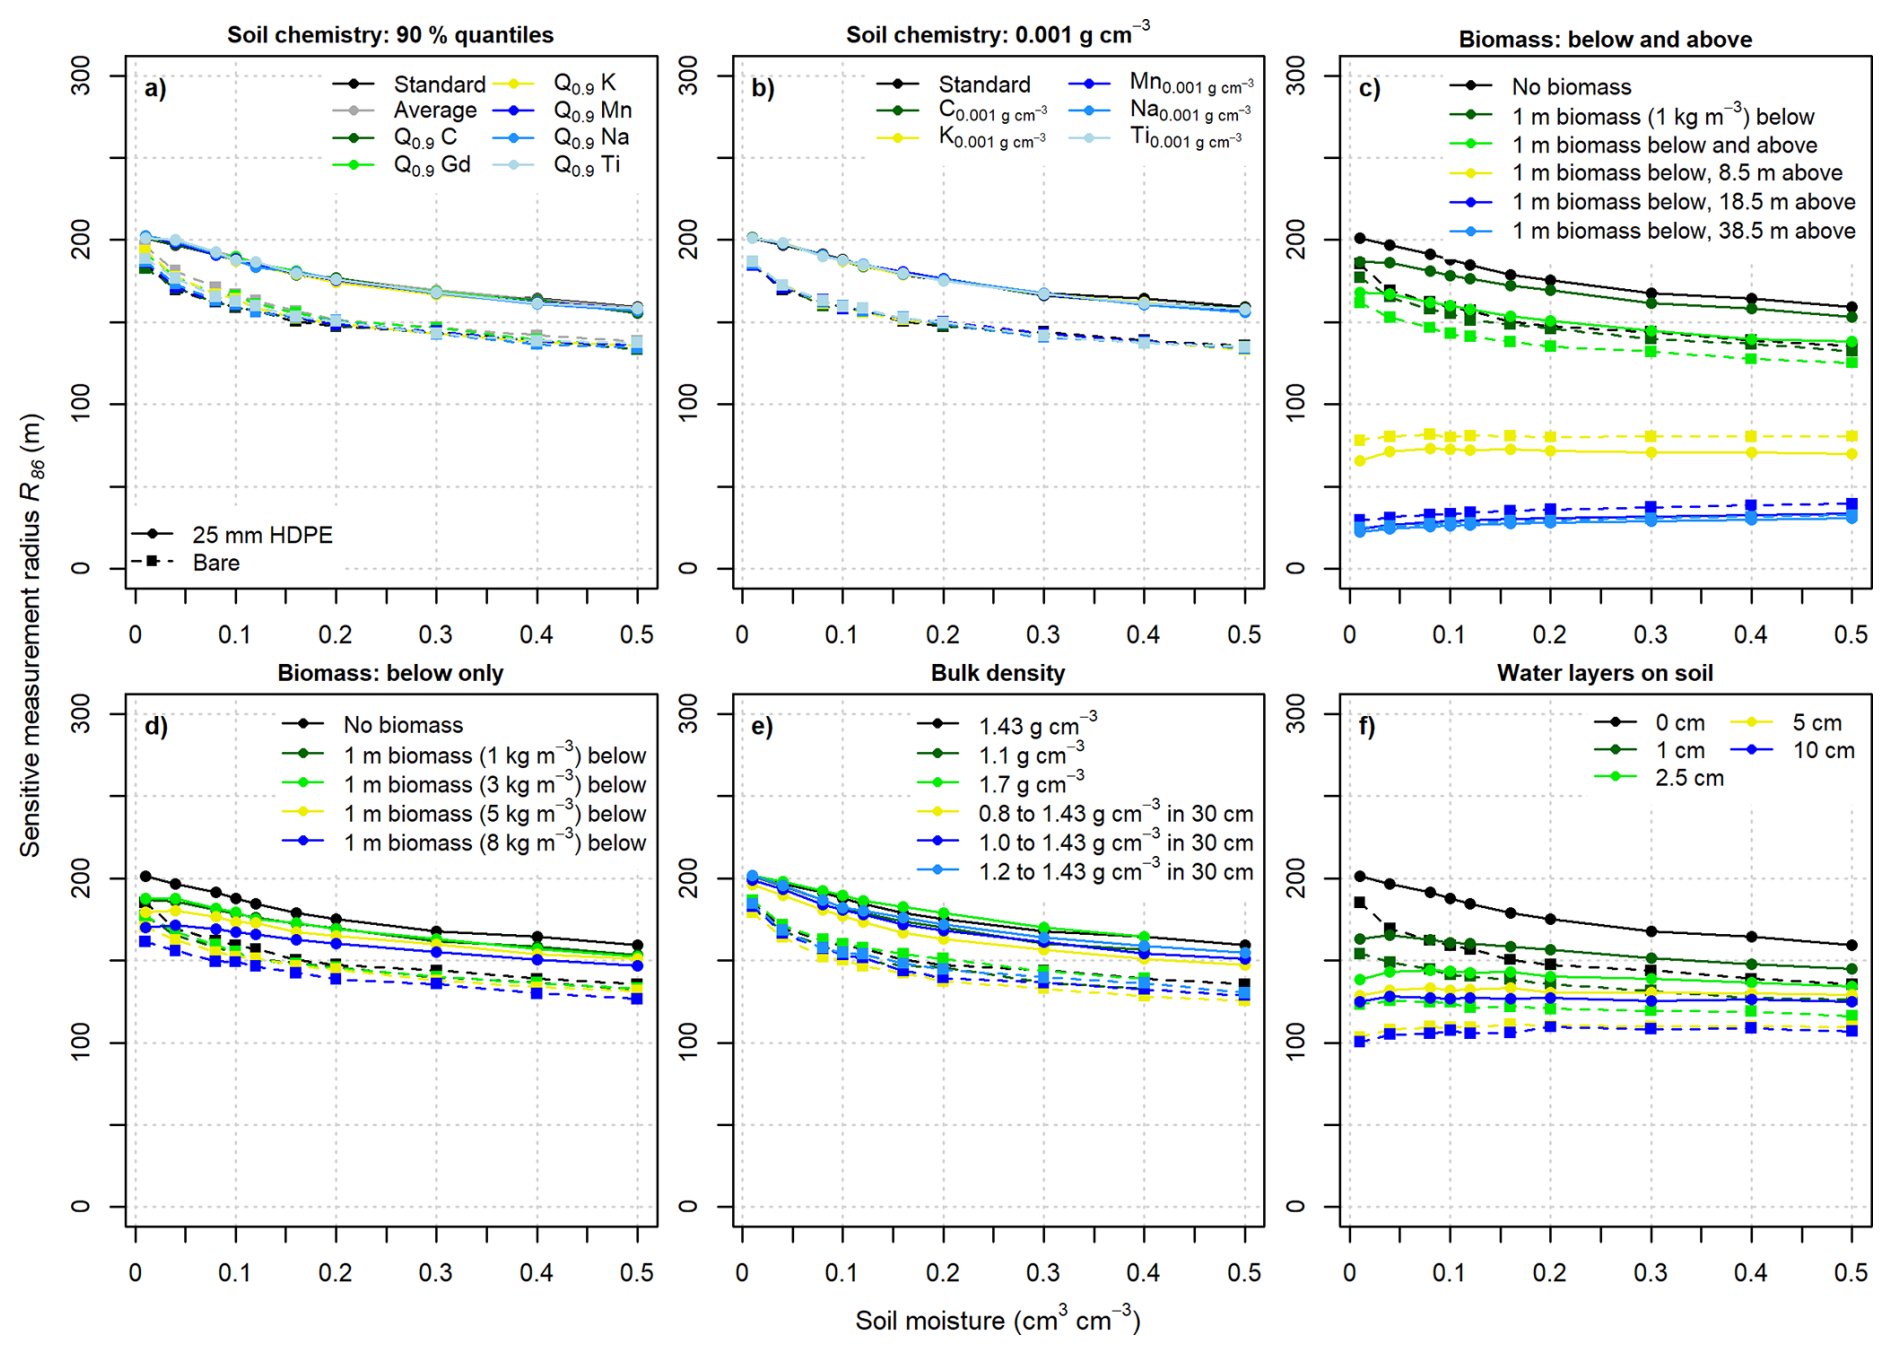
Figure B1Calculated R86 using the detector response functions for a bare and moderated detector for each simulation setup. Dashed lines with squares represent bare detector intensities while solid lines with dots represent moderated detector (25 mm HDPE shielding) intensities. The colours refer to the individual selected simulation setups listed in Tables 1–3.
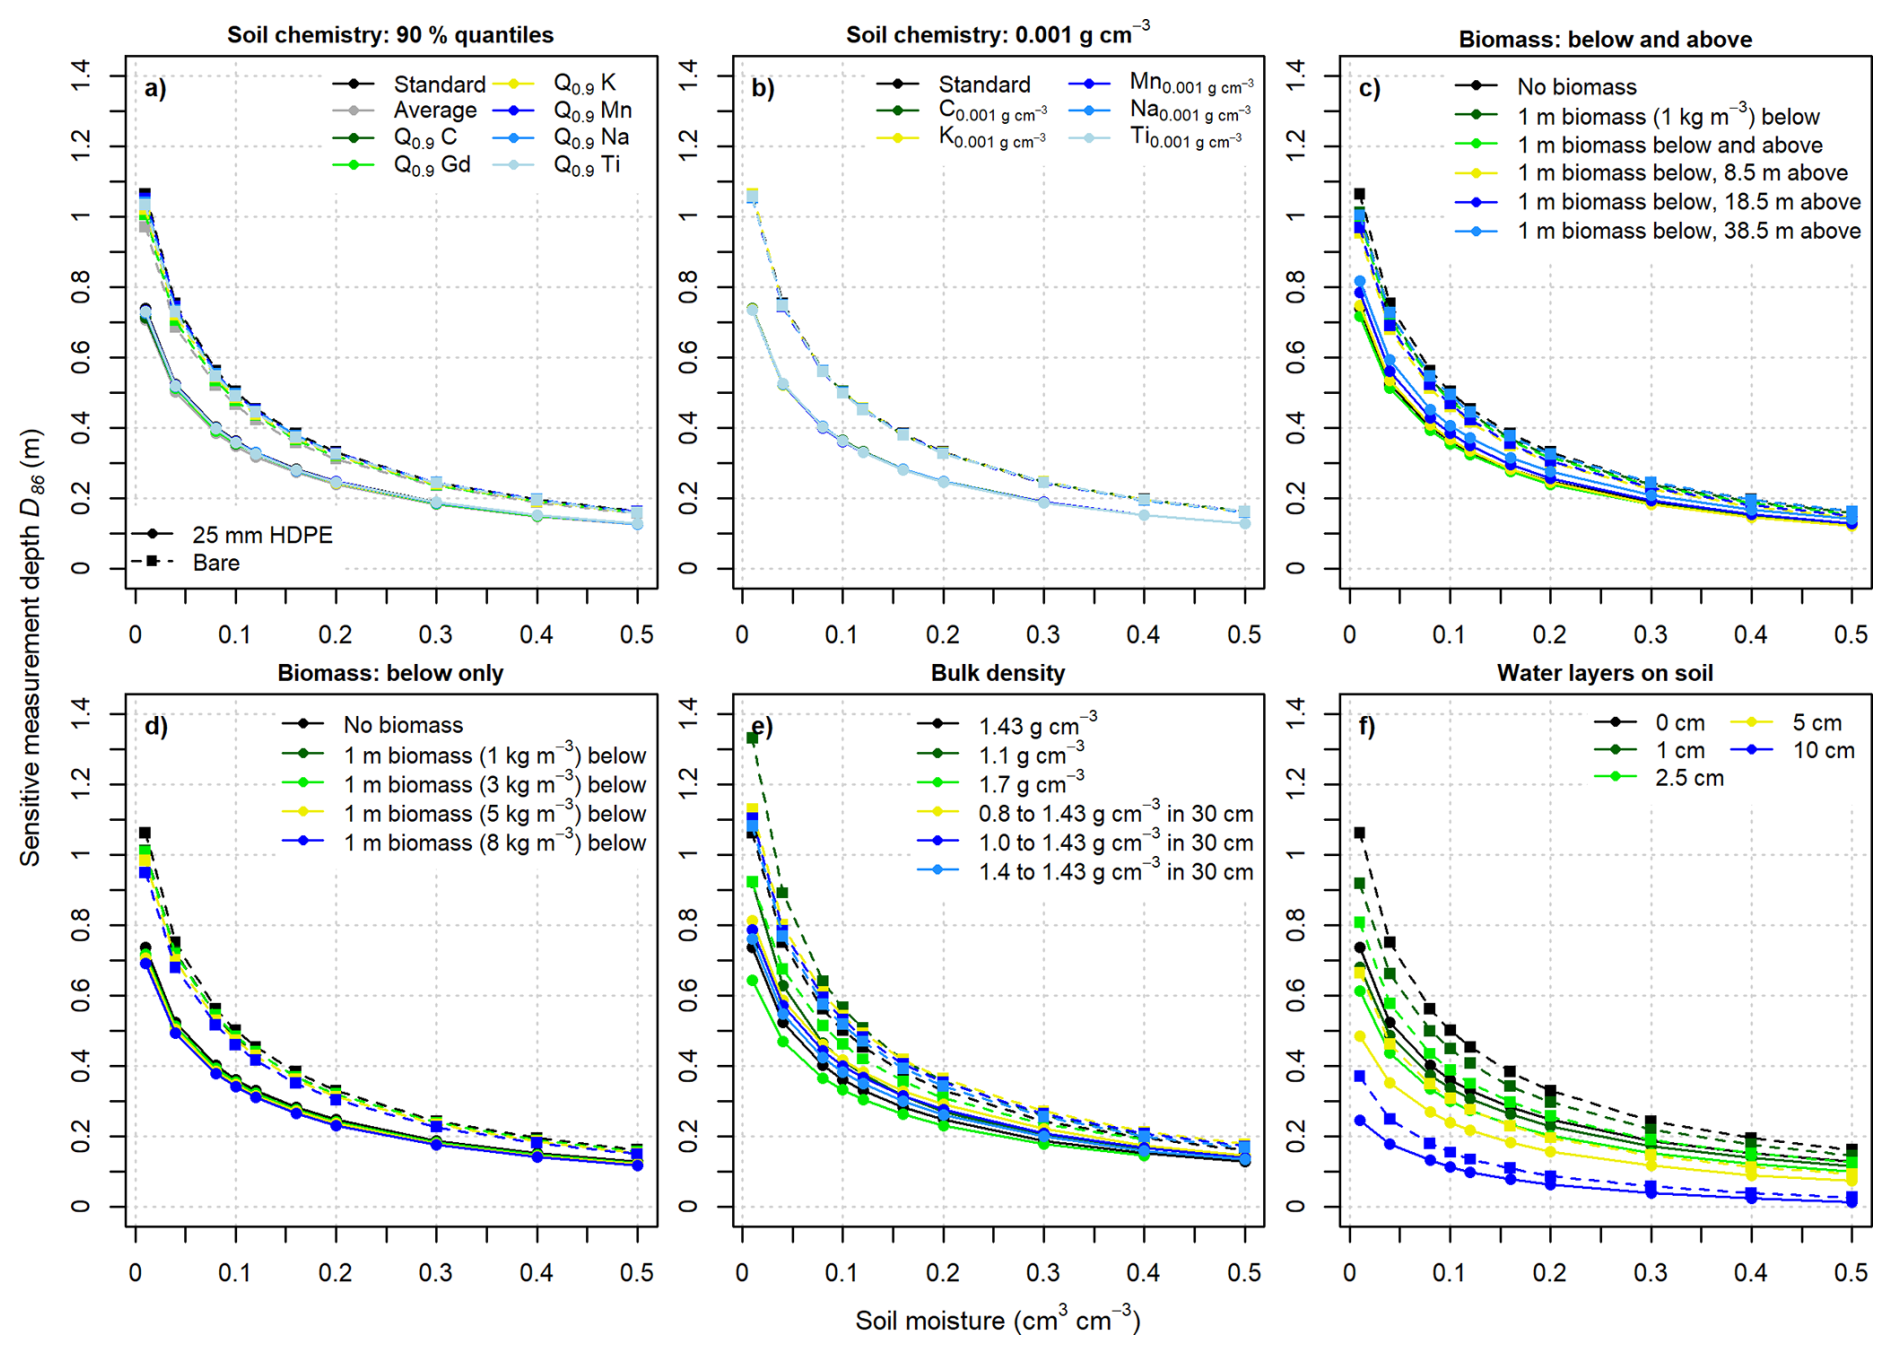
Figure B2Calculated D86 using the detector response functions for a bare and moderated detector for each simulation setup. Dashed lines with squares represent bare detector intensities while solid lines with dots represent moderated detector (25 mm HDPE shielding) intensities. The colours refer to the individual selected simulation setups listed in Tables 1–3.
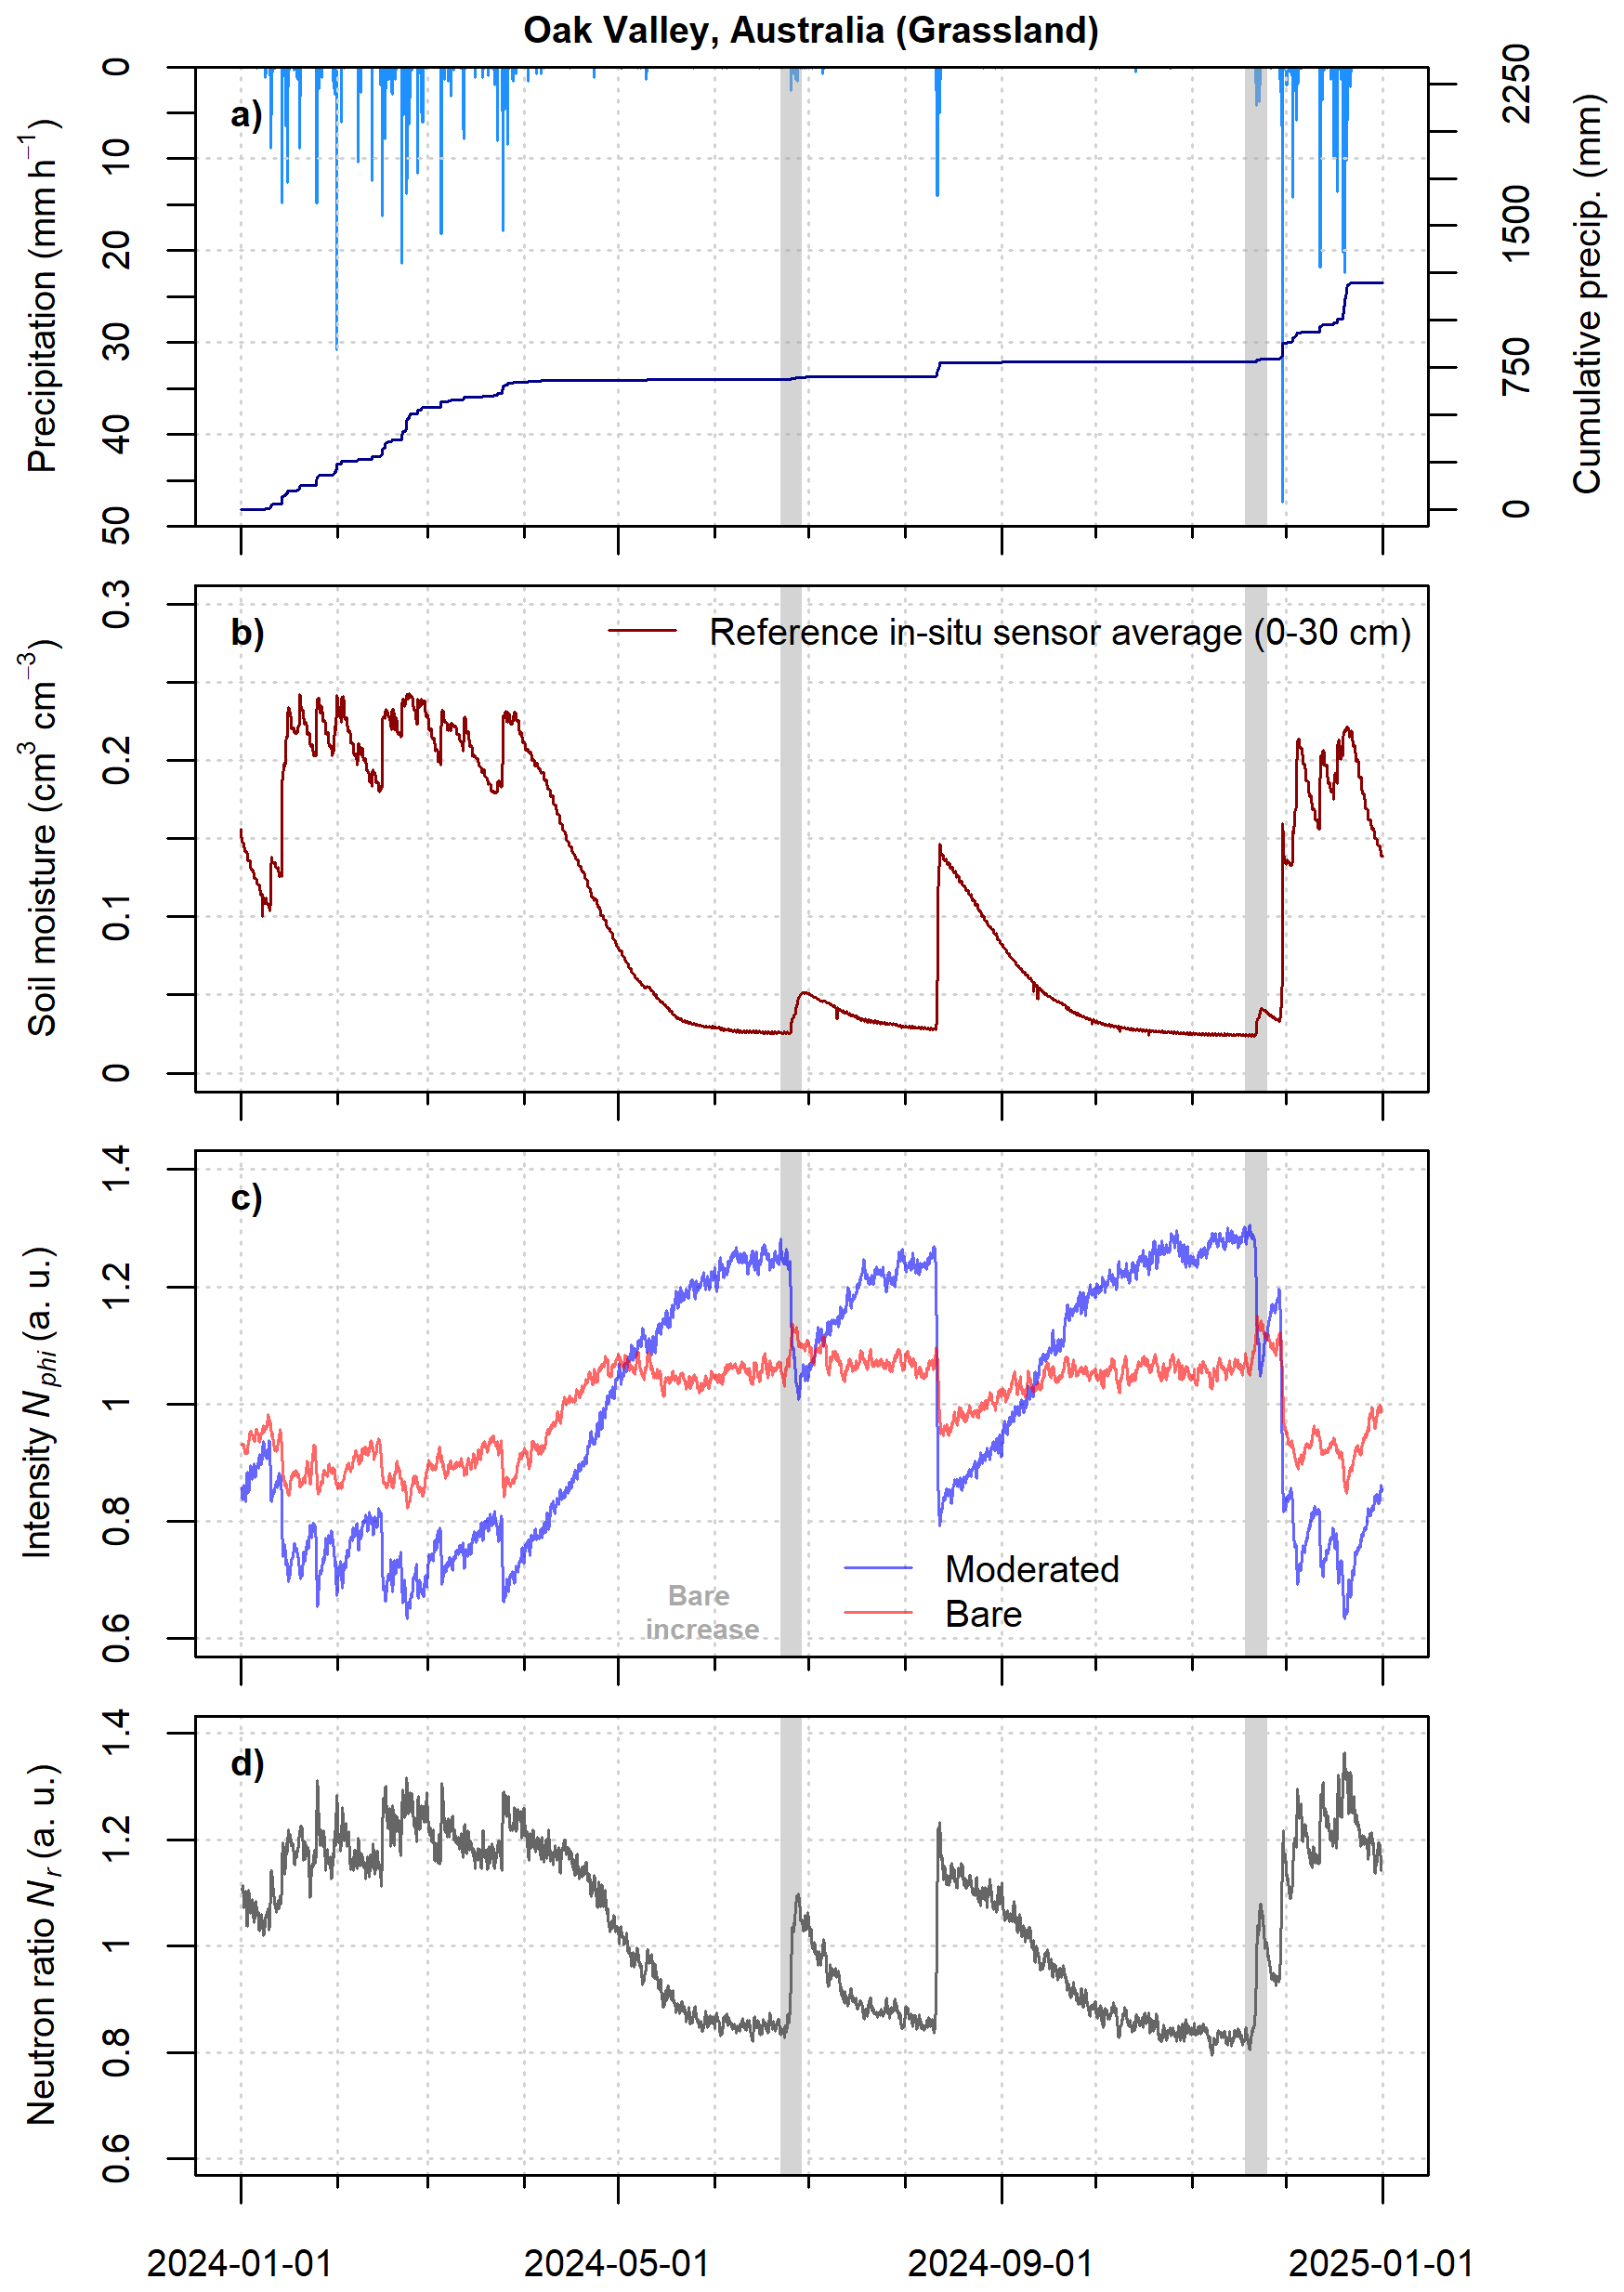
Figure C1Observed and corrected neutron intensities, neutron ratios, precipitation and arithmetic average reference soil moisture for the Oak Valley grassland site in north-eastern Australia (e.g., see McJannet et al., 2025). Neutron intensities were corrected for incoming high-energy neutron intensities using the approach after McJannet and Desilets (2023) and the neutron monitor JUNG in Switzerland (https://www.nmdb.eu/, last access: 1 October 2025), air pressure and absolute air humidity after Rosolem et al. (2013) and Rasche et al. (2023). Bare and moderated detector intensities were smoothed with a 25 and 13 h moving average, respectively. Note the increase of bare intensities during small rainfall events when the soil is dry (grey shaded zones).
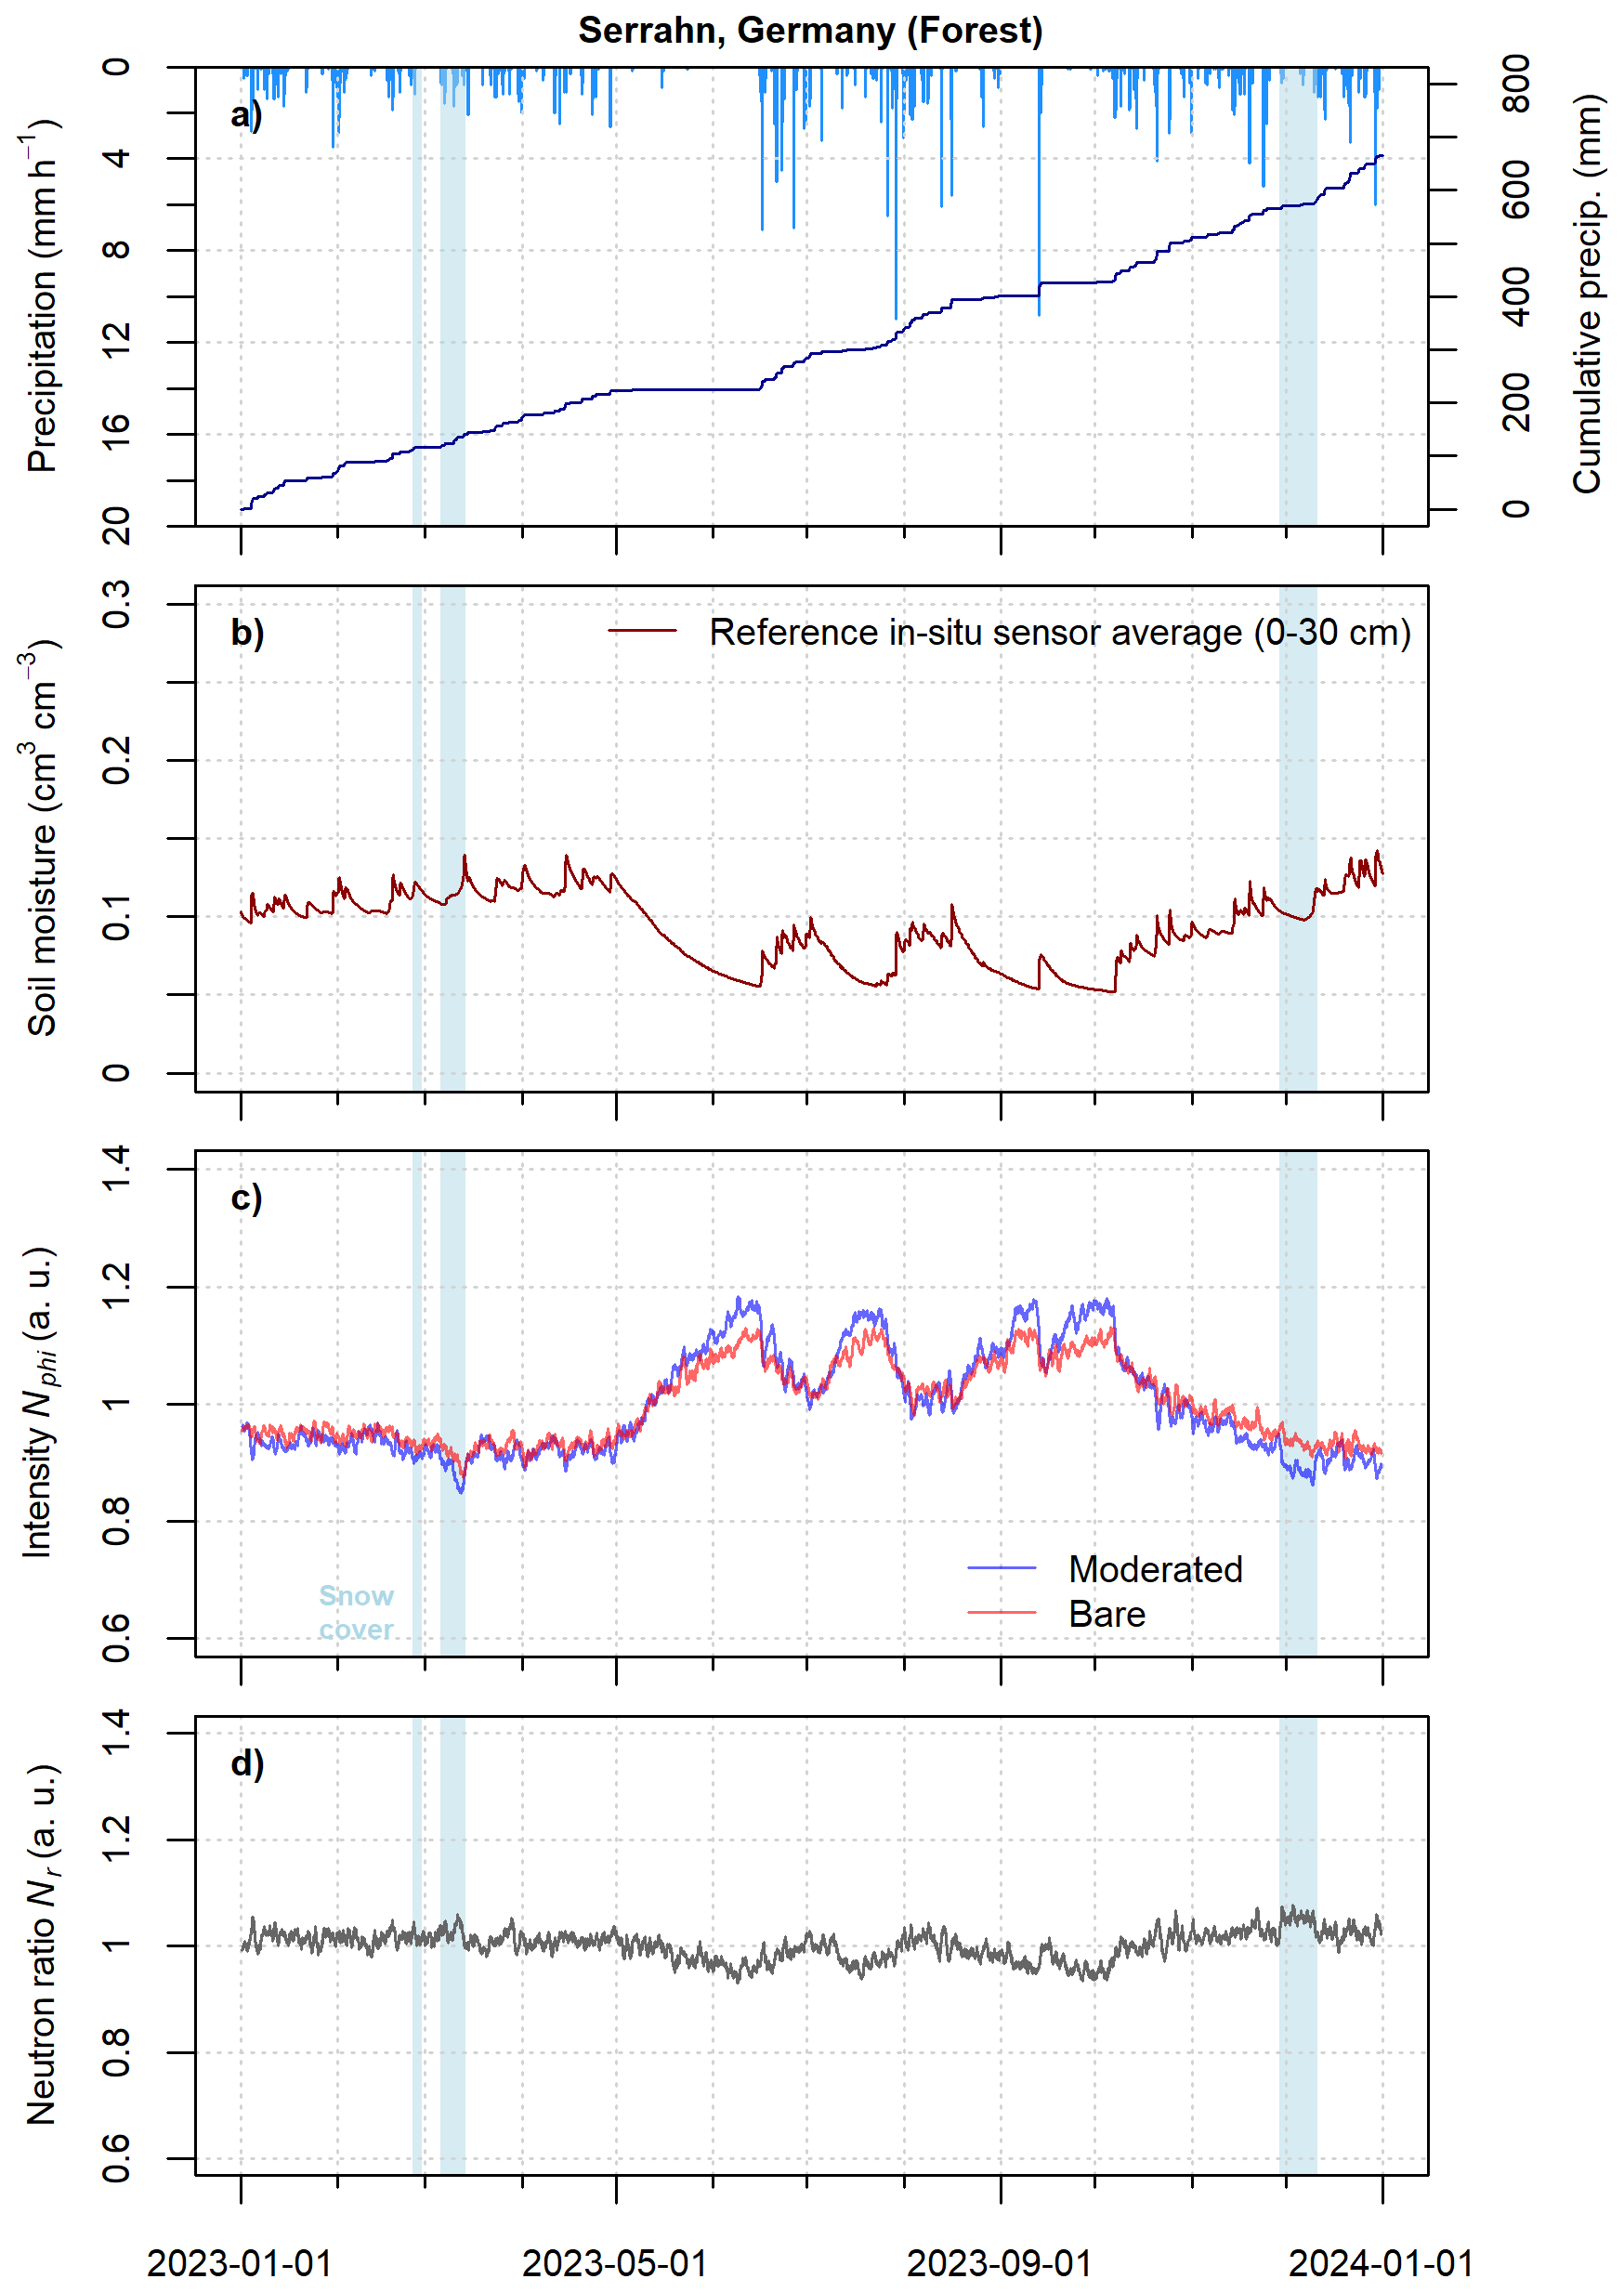
Figure C2Observed and corrected neutron intensities, neutron ratios, precipitation and arithmetic average reference soil moisture for the Serrahn forest site in north-eastern Germany (e.g., see Bogena et al., 2022). Neutron intensities were corrected for incoming high-energy neutron intensities using the approach after McJannet and Desilets (2023) and the neutron monitor JUNG in Switzerland (https://www.nmdb.eu/, last access: 1 October 2025), air pressure and absolute air humidity after Rosolem et al. (2013) and Rasche et al. (2023). Bare and moderated detector intensities were smoothed with a 25 h moving average.
Post-processed simulation data is available via GFZ Data Services (https://doi.org/10.5880/GFZ.RDOQ.2026.003, Rasche et al., 2026). The remaining data is available from the authors upon request.
DR designed and conducted the neutron transport simulations, performed the data analyses and wrote the manuscript. CB and MK assisted in the conceptual and technical design of the simulation scenarios and their post-processing, contributed to the interpretation of the simulation results and assisted in the writing of the manuscript. JW and MS contributed to the interpretation of the simulation results and the writing of the manuscript. DM processed and provided observation data and contributed to the writing of the manuscript. TB and AG contributed to the writing of the manuscript.
Markus Köhli and Jannis Weimar hold leading positions at Styx Neutronica GmbH (Germany), a manufacturer of neutron detectors. The peer-review process was guided by an independent editor, and the authors also have no other competing interests to declare.
Publisher's note: Copernicus Publications remains neutral with regard to jurisdictional claims made in the text, published maps, institutional affiliations, or any other geographical representation in this paper. The authors bear the ultimate responsibility for providing appropriate place names. Views expressed in the text are those of the authors and do not necessarily reflect the views of the publisher.
We would like to thank Heye Bogena and Jannis Jakobi for stimulating discussions on the topic of thermal neutron sensing in the context of CRNS. We gratefully acknowledge the data access for the Serrahn site which is part of the TERENO-Northeast German Lowland observatory, funded by the Helmholtz Association, as well as to the Oak Valley site which is part of the Australian CosmOz network funded by CSIRO (Commonwealth Science and Industry Research Organisation) and TERN (Terrestrial Ecosystem Research Network). Further, we acknowledge the NMDB database (https://www.nmdb.eu, last access: 16 October 2026) founded as part of the European Union's FP7 programme (contract no. 213007) and the PIs of individual neutron monitors for providing data.
This study was conducted as part of the research unit FOR-2694 Cosmic Sense funded by the German Research Foundation (DFG, project no. 357874777).
The article processing charges for this open-access publication were covered by the GFZ Helmholtz Centre for Geosciences.
This paper was edited by Mehrez Zribi and reviewed by two anonymous referees.
Akinshin, A.: Weighted quantile estimators, arXiv, https://doi.org/10.48550/ARXIV.2304.07265, 2023. a
Al-Mashharawi, S. K., Steele-Dunne, S. C., El Hajj, M. M., Valencia, O. M. L., Camargo, O. A. L., Pouget, G., Doussan, C., Courault, D., and McCabe, M. F.: Exploring the use of thermal neutron counts to track orchard phenological development, Front. Water, 8, https://doi.org/10.3389/frwa.2026.1749654, 2026. a
Andreasen, M., Jensen, K. H., Zreda, M., Desilets, D., Bogena, H., and Looms, M. C.: Modeling cosmic ray neutron field measurements, Water Resour. Res., 52, 6451–6471, https://doi.org/10.1002/2015wr018236, 2016. a, b, c, d
Andreasen, M., Jensen, K. H., Desilets, D., Zreda, M., Bogena, H. R., and Looms, M. C.: Cosmic-ray neutron transport at a forest field site: the sensitivity to various environmental conditions with focus on biomass and canopy interception, Hydrol. Earth Syst. Sci., 21, 1875–1894, https://doi.org/10.5194/hess-21-1875-2017, 2017. a, b, c, d, e
Andreasen, M., Jensen, K. H., Bogena, H., Desilets, D., Zreda, M., and Looms, M. C.: Cosmic Ray Neutron Soil Moisture Estimation Using Physically Based Site-Specific Conversion Functions, Water Resour. Res., 56, https://doi.org/10.1029/2019wr026588, 2020. a
Andreasen, M., Kragh, S. J., Meyer, R., Jensen, K. H., and Looms, M. C.: Mapping spatiotemporal soil moisture in highly heterogeneous agricultural landscapes using mobile dual‐spectra cosmic‐ray neutron sensing, Vadose Zone J., https://doi.org/10.1002/vzj2.20287, 2023. a
Baatz, R., Bogena, H. R., Franssen, H.-J. H., Huisman, J. A., Montzka, C., and Vereecken, H.: An empirical vegetation correction for soil water content quantification using cosmic ray probes, Water Resour. Res., 51, 2030–2046, https://doi.org/10.1002/2014wr016443, 2015. a, b, c, d, e, f, g, h, i
Baatz, R., Davies, P., Nasta, P., and Bogena, H.: Data-driven scaling methods for soil moisture cosmic ray neutron sensors, Hydrol. Earth Syst. Sci., 29, 2583–2597, https://doi.org/10.5194/hess-29-2583-2025, 2025. a, b
Bogena, H. R., Herrmann, F., Jakobi, J., Brogi, C., Ilias, A., Huisman, J. A., Panagopoulos, A., and Pisinaras, V.: Monitoring of Snowpack Dynamics With Cosmic-Ray Neutron Probes: A Comparison of Four Conversion Methods, Front. Water, 2, https://doi.org/10.3389/frwa.2020.00019, 2020. a, b, c, d, e, f
Bogena, H. R., Schrön, M., Jakobi, J., Ney, P., Zacharias, S., Andreasen, M., Baatz, R., Boorman, D., Duygu, M. B., Eguibar-Galán, M. A., Fersch, B., Franke, T., Geris, J., González Sanchis, M., Kerr, Y., Korf, T., Mengistu, Z., Mialon, A., Nasta, P., Nitychoruk, J., Pisinaras, V., Rasche, D., Rosolem, R., Said, H., Schattan, P., Zreda, M., Achleitner, S., Albentosa-Hernández, E., Akyürek, Z., Blume, T., del Campo, A., Canone, D., Dimitrova-Petrova, K., Evans, J. G., Ferraris, S., Frances, F., Gisolo, D., Güntner, A., Herrmann, F., Iwema, J., Jensen, K. H., Kunstmann, H., Lidón, A., Looms, M. C., Oswald, S., Panagopoulos, A., Patil, A., Power, D., Rebmann, C., Romano, N., Scheiffele, L., Seneviratne, S., Weltin, G., and Vereecken, H.: COSMOS-Europe: a European network of cosmic-ray neutron soil moisture sensors, Earth Syst. Sci. Data, 14, 1125–1151, https://doi.org/10.5194/essd-14-1125-2022, 2022. a, b, c
Brall, T., Mares, V., Bütikofer, R., and Rühm, W.: Assessment of neutrons from secondary cosmic rays at mountain altitudes – Geant4 simulations of environmental parameters including soil moisture and snow cover, The Cryosphere, 15, 4769–4780, https://doi.org/10.5194/tc-15-4769-2021, 2021. a, b
Brogi, C., Bogena, H. R., Köhli, M., Huisman, J. A., Hendricks Franssen, H.-J., and Dombrowski, O.: Feasibility of irrigation monitoring with cosmic-ray neutron sensors, Geosci. Instrum. Method. Data Syst., 11, 451–469, https://doi.org/10.5194/gi-11-451-2022, 2022. a
Brogi, C., Jakobi, J., Huisman, J., Schmidt, M., Montzka, C., Bates, J., Akter, S., and Bogena, H.: Cosmic-ray neutron sensors provide scale-appropriate soil water content and vegetation observations for eddy covariance stations in agricultural ecosystems, Agr. Forest Meteorol., 373, 110731, https://doi.org/10.1016/j.agrformet.2025.110731, 2025. a, b, c
Desilets, D., Zreda, M., and Ferré, T. P. A.: Nature's neutron probe: Land surface hydrology at an elusive scale with cosmic rays, Water Resour. Res., 46, https://doi.org/10.1029/2009wr008726, 2010. a, b, c, d, e
Dorman, L. I.: Cosmic Rays in the Earth's Atmosphere and Underground, Astrophysics and Space Science Library, Springer Netherlands, 1 edn., ISBN 978-1-4020-2071-1, https://doi.org/10.1007/978-1-4020-2113-8, 2004. a
Evans, J. G., Ward, H. C., Blake, J. R., Hewitt, E. J., Morrison, R., Fry, M., Ball, L. A., Doughty, L. C., Libre, J. W., Hitt, O. E., Rylett, D., Ellis, R. J., Warwick, A. C., Brooks, M., Parkes, M. A., Wright, G. M. H., Singer, A. C., Boorman, D. B., and Jenkins, A.: Soil water content in southern England derived from a cosmic‐ray soil moisture observing system – COSMOS‐UK, Hydrol. Process., 30, 4987–4999, https://doi.org/10.1002/hyp.10929, 2016. a
Franz, T. E., Zreda, M., Ferre, T. P. A., Rosolem, R., Zweck, C., Stillman, S., Zeng, X., and Shuttleworth, W. J.: Measurement depth of the cosmic ray soil moisture probe affected by hydrogen from various sources, Water Resour. Res., 48, https://doi.org/10.1029/2012wr011871, 2012. a
Franz, T. E., Zreda, M., Rosolem, R., and Ferre, T. P. A.: A universal calibration function for determination of soil moisture with cosmic-ray neutrons, Hydrol. Earth Syst. Sci., 17, 453–460, https://doi.org/10.5194/hess-17-453-2013, 2013. a, b
Hawdon, A., McJannet, D., and Wallace, J.: Calibration and correction procedures for cosmic-ray neutron soil moisture probes located across Australia, Water Resour. Res., 50, 5029–5043, https://doi.org/10.1002/2013wr015138, 2014. a, b
Jakobi, J., Huisman, J. A., Vereecken, H., Diekkrüger, B., and Bogena, H. R.: Cosmic Ray Neutron Sensing for Simultaneous Soil Water Content and Biomass Quantification in Drought Conditions, Water Resour. Res., 54, 7383–7402, https://doi.org/10.1029/2018wr022692, 2018. a, b, c
Jakobi, J., Huisman, J. A., Köhli, M., Rasche, D., Vereecken, H., and Bogena, H. R.: The Footprint Characteristics of Cosmic Ray Thermal Neutrons, Geophys. Res. Lett., 48, https://doi.org/10.1029/2021GL094281, 2021. a, b, c, d, e, f, g, h
Jakobi, J., Huisman, J. A., Fuchs, H., Vereecken, H., and Bogena, H. R.: Potential of Thermal Neutrons to Correct Cosmic‐Ray Neutron Soil Moisture Content Measurements for Dynamic Biomass Effects, Water Resour. Res., 58, https://doi.org/10.1029/2022wr031972, 2022. a, b, c, d, e, f, g, h, i
Kasner, M., Zacharias, S., and Schrön, M.: On soil bulk density and its influence to soil moisture estimation with cosmic-ray neutrons, Hydrol. Earth Syst. Sci. Discuss. [preprint], https://doi.org/10.5194/hess-2022-123, 2022. a
Kodama, M., Nakai, K., Kawasaki, S., and Wada, M.: An application of cosmic-ray neutron measurements to the determination of the snow-water equivalent, J. Hydrol., 41, 85–92, https://doi.org/10.1016/0022-1694(79)90107-0, 1979. a
Kodama, M., Kudo, S., and Kosuge, T.: Application of atmospheric neutrons to soil moisture measurement, Soil Sci., 140, 237–242, 1985. a
Köhli, M.: Soil moisture measurements by Cosmic-Ray neutron sensing: A critical review, Geoderma, 465, 117626, https://doi.org/10.1016/j.geoderma.2025.117626, 2026. a
Köhli, M., Schrön, M., Zreda, M., Schmidt, U., Dietrich, P., and Zacharias, S.: Footprint characteristics revised for field-scale soil moisture monitoring with cosmic-ray neutrons, Water Resour. Res., 51, 5772–5790, https://doi.org/10.1002/2015wr017169, 2015. a, b, c, d, e, f, g
Köhli, M., Schrön, M., and Schmidt, U.: Response functions for detectors in Cosmic Ray Neutron Sensing, Nuclear Instruments and Methods in Physics Research Section A: Accelerators, Spectrometers, Detectors and Associated Equipment, 902, 184–189, https://doi.org/10.1016/j.nima.2018.06.052, 2018. a, b, c
Köhli, M., Weimar, J., Schrön, M., Baatz, R., and Schmidt, U.: Soil Moisture and Air Humidity Dependence of the Above-Ground Cosmic-Ray Neutron Intensity, Front. Water, 2, https://doi.org/10.3389/frwa.2020.544847, 2021. a, b, c, d, e, f, g, h, i, j, k, l, m, n
Köhli, M., Schrön, M., Zacharias, S., and Schmidt, U.: URANOS v1.0 – the Ultra Rapid Adaptable Neutron-Only Simulation for Environmental Research, Geosci. Model Dev., 16, 449–477, https://doi.org/10.5194/gmd-16-449-2023, 2023. a, b, c, d
McJannet, D., Rasche, D., Marano, J., Hawdon, A., Stenson, M., and Schrön, M.: Over‐Water Low‐Energy Neutron Observations for Intensity Corrections Across Cosmic‐Ray Soil Moisture Sensor Networks, Water Resour. Res., 61, https://doi.org/10.1029/2024wr039727, 2025. a, b, c
McJannet, D. L. and Desilets, D.: Incoming Neutron Flux Corrections for Cosmic‐Ray Soil and Snow Sensors Using the Global Neutron Monitor Network, Water Resour. Res., 59, https://doi.org/10.1029/2022wr033889, 2023. a, b, c
Morris, T. C., Franz, T. E., Becker, S. M., and Suyker, A. E.: Effect of Biomass Water Dynamics in Cosmic-Ray Neutron Sensor Observations: A Long-Term Analysis of Maize–Soybean Rotation in Nebraska, Sensors, 24, 4094, https://doi.org/10.3390/s24134094, 2024. a, b, c
Rasche, D., Köhli, M., Schrön, M., Blume, T., and Güntner, A.: Towards disentangling heterogeneous soil moisture patterns in cosmic-ray neutron sensor footprints, Hydrol. Earth Syst. Sci., 25, 6547–6566, https://doi.org/10.5194/hess-25-6547-2021, 2021. a, b, c, d, e, f, g, h, i, j, k, l, m, n, o, p, q
Rasche, D., Weimar, J., Schrön, M., Köhli, M., Morgner, M., Güntner, A., and Blume, T.: A change in perspective: downhole cosmic-ray neutron sensing for the estimation of soil moisture, Hydrol. Earth Syst. Sci., 27, 3059–3082, https://doi.org/10.5194/hess-27-3059-2023, 2023. a, b, c, d, e
Rasche, D., Brogi, C., Köhli, M., McJannet, D., Weimar, J., Schrön, M., Blume, T., and Güntner, A.: Signal response of bare and moderated cosmic-ray neutron sensors to varying soil and biomass conditions – Dataset, GFZ Data Services [data set], https://doi.org/10.5880/GFZ.RDOQ.2026.003, 2026. a
Rosolem, R., Shuttleworth, W. J., Zreda, M., Franz, T. E., Zeng, X., and Kurc, S. A.: The Effect of Atmospheric Water Vapor on Neutron Count in the Cosmic-Ray Soil Moisture Observing System, J. Hydrometeorol., 14, 1659–1671, https://doi.org/10.1175/jhm-d-12-0120.1, 2013. a, b, c
Salminen, R., Batista, M., Bidovec, M., Demetriades, A., Vivo, B. D., Vos, W. D., Duris, M., Gilucis, A., Gregorauskiene, V., Halamic, J., Heitzmann, P., Lima, A., Jordan, G., Klaver, G., Klein, P., Lis, J., Locutura, J., Marsina, K., Mazreku, A., O'Connor, P., Olsson, S., Ottesen, R.-T., Petersell, V., Plant, J., Reeder, S., Salpeteur, I., Sandström, H., Siewers, U., Steenfelt, A., and Tarvainen, T.: Geochemical Atlas of Europe: Part 1 - Background Information, Methodology and Maps, Geological Survey of Finland, ISBN 951-690-921-3, http://weppi.gtk.fi/publ/foregsatlas/index.php (last access: 16 October 2026), 2005. a, b
Schattan, P., Baroni, G., Oswald, S. E., Schöber, J., Fey, C., Kormann, C., Huttenlau, M., and Achleitner, S.: Continuous monitoring of snowpack dynamics in alpine terrain by aboveground neutron sensing, Water Resour. Res., 53, 3615–3634, https://doi.org/10.1002/2016wr020234, 2017. a
Schattan, P., Köhli, M., Schrön, M., Baroni, G., and Oswald, S. E.: Sensing Area-Average Snow Water Equivalent with Cosmic-Ray Neutrons: The Influence of Fractional Snow Cover, Water Resour. Res., 55, 10796–10812, https://doi.org/10.1029/2019wr025647, 2019. a
Schrön, M., Köhli, M., Scheiffele, L., Iwema, J., Bogena, H. R., Lv, L., Martini, E., Baroni, G., Rosolem, R., Weimar, J., Mai, J., Cuntz, M., Rebmann, C., Oswald, S. E., Dietrich, P., Schmidt, U., and Zacharias, S.: Improving calibration and validation of cosmic-ray neutron sensors in the light of spatial sensitivity, Hydrol. Earth Syst. Sci., 21, 5009–5030, https://doi.org/10.5194/hess-21-5009-2017, 2017. a, b, c
Schrön, M., Rasche, D., Weimar, J., Köhli, M., Herbst, K., Boehrer, B., Hertle, L., Kögler, S., and Zacharias, S.: Buoy‐Based Detection of Low‐Energy Cosmic‐Ray Neutrons to Monitor the Influence of Atmospheric, Geomagnetic, and Heliospheric Effects, Earth Space Sci., 11, https://doi.org/10.1029/2023ea003483, 2024. a, b, c
Tian, Z., Li, Z., Liu, G., Li, B., and Ren, T.: Soil water content determination with cosmic-ray neutron sensor: Correcting aboveground hydrogen effects with thermal/fast neutron ratio, J. Hydrol., 540, 923–933, https://doi.org/10.1016/j.jhydrol.2016.07.004, 2016. a, b
Vather, T., Everson, C. S., and Franz, T. E.: The Applicability of the Cosmic Ray Neutron Sensor to Simultaneously Monitor Soil Water Content and Biomass in an Acacia mearnsii Forest, Hydrology, 7, 48, https://doi.org/10.3390/hydrology7030048, 2020. a, b
Weimar, J., Köhli, M., Budach, C., and Schmidt, U.: Large-Scale Boron-Lined Neutron Detection Systems as a 3He Alternative for Cosmic Ray Neutron Sensing, Front. Water, 2, 16, https://doi.org/10.3389/frwa.2020.00016, 2020. a, b, c
Zreda, M., Desilets, D., Ferré, T. P. A., and Scott, R. L.: Measuring soil moisture content non-invasively at intermediate spatial scale using cosmic-ray neutrons, Geophys. Res. Lett., 35, https://doi.org/10.1029/2008gl035655, 2008. a, b, c, d, e
Zreda, M., Shuttleworth, W. J., Zeng, X., Zweck, C., Desilets, D., Franz, T., and Rosolem, R.: COSMOS: the COsmic-ray Soil Moisture Observing System, Hydrol. Earth Syst. Sci., 16, 4079–4099, https://doi.org/10.5194/hess-16-4079-2012, 2012. a, b, c
- Abstract
- Introduction
- Material and methods
- Results and discussion
- Conclusions
- Appendix A: Simulated neutron intensity response
- Appendix B: Estimated footprint radius and depth
- Appendix C: Observation data
- Data availability
- Author contributions
- Competing interests
- Disclaimer
- Acknowledgements
- Financial support
- Review statement
- References