the Creative Commons Attribution 4.0 License.
the Creative Commons Attribution 4.0 License.
A network of magnetometers for multi-scale urban science and informatics
Trevor A. Bowen
Elena Zhivun
Arne Wickenbrock
Vincent Dumont
Stuart D. Bale
Christopher Pankow
Gregory Dobler
Jonathan S. Wurtele
Dmitry Budker
The magnetic signature of an urban environment is investigated using a geographically distributed network of fluxgate magnetometers deployed in and around Berkeley, California. The system hardware and software are described and initial operations of the network are reported. The sensors measure vector magnetic fields at a 3960 Hz sample rate and are sensitive to 0.1 . Data from individual stations are synchronized to ±120 µs using global positioning system (GPS) and computer system clocks and automatically uploaded to a central server. We present the initial observations of the network and preliminary efforts to correlate sensors. A wavelet analysis is used to study observations of the urban magnetic field over a wide range of temporal scales. The Bay Area Rapid Transit (BART) is identified as the dominant signal in our observations, exhibiting aspects of both broadband noise and coherent periodic features. Significant differences are observed in both day–night and weekend–weekday signatures. A superposed epoch analysis is used to study and extract the BART signal.
- Article
(10834 KB) - Full-text XML
- BibTeX
- EndNote
The study of fluctuating magnetic fields, commonly referred to as magnetometry, has found widespread application in a variety of disciplines. Understanding geomagnetic fields are important to global-positioning-system-free (GPS-free) navigation, radiation hazard prediction, atmospheric modeling, and fundamental geophysics research. Additionally, measurements of the auroral magnetic field are necessary in testing models for space-weather prediction, aiming to mitigate hazards from solar storms (Angelopoulos, 2008; Peticolas et al., 2008; Harris et al., 2008). High-cadence (sampling rate) magnetic field measurements have been used for magnetic anomaly detection (MAD), which has numerous applications in naval defense and unexploded ordnance detection (Sheinker et al., 2009). Geographically distributed magnetometers operating at high sample rates have been used in atmospheric science to measure the global distribution of lightning strikes using the Schumann resonance (Schlegel and Füllekrug, 2002). Recently, multi-satellite space missions have used magnetometry to provide multi-point observations of the dynamic evolution of plasmas on electron scales (Burch and Phan, 2016; Phan et al., 2018).
Many advancements in magnetometry have been driven by progress in the design of high-precision sensor networks. Time-synchronized sensor networks are currently being implemented in diverse disciplines such as the search for dark matter (Pustelny et al., 2013; Afach et al., 2018) and localization and monitoring of wildlife in ecology (Wang et al., 2005); perhaps the most notable recent accomplishment of network design is the observation of gravitational waves associated with black hole mergers by the Laser Interferometer Gravitational-Wave Observatory (LIGO) and Virgo Interferometer collaborations (Abramovici et al., 1992; Abbott et al., 2016, 2017). Indeed, sensor networks have long been used in geophysics to monitor geomagnetic dynamics: e.g., SuperMAG, an international consortium of magnetometer arrays, comprises approximately 300 sensors operated by numerous organizations, providing uniformly processed data in a common coordinate system and time base (Gjerloev, 2009, 2012).
Here we report on the development of a synchronized magnetometer network in Berkeley, California, for the purpose of studying urban magnetic fields over spatiotemporal scales not previously studied. By applying proven techniques of network design and magnetometry, we aim to complement the growing field of observational urban science and informatics. Only recently have investigators been able to accumulate and analyze data with adequate spatial and temporal granularity to characterize the dynamic evolution of a city. Recent work has shown that broadband visible observations at night can identify patterns of light that can be used to measure total energy consumption and public health effects of light pollution on circadian rhythms (Dobler et al., 2015). Measurements of urban lighting made faster than ∼120 Hz allow for phase change detection of fluorescent and incandescent flicker, which may be used as a predictor for power outages (Bianco et al., 2016). In addition, infrared hyperspectral observations can determine the molecular content of pollution plumes produced by building energy consumption, providing a powerful method for environmental monitoring of cities (Ghandehari et al., 2017). In tailoring a synchronized network of magnetometers for an urban area, we explore whether dynamic signatures of urban magnetic fields can contribute to the growing discourse surrounding urban science and informatics.
Our magnetometer array, currently consisting of four sensors operating at a 3960 Hz sample rate with high-precision timing (120 µs) for correlation analysis, will make sustained measurements of urban magnetic fields over years, observing dynamic magnetic signatures characterizing a city. Figure 1 shows a map of Berkeley with a sample network configuration. Our hardware, software, and instrumental techniques are described in Sect. 2. Initial network observations are presented in Sect. 3. Observations taken from multiple geographically separated stations are analyzed and compared in Sect. 3.1. A wavelet analysis is introduced in Sect. 3.2 to provide an analysis of the different spatiotemporal scales present in the urban magnetic field. Initial results of multi-station correlations are presented. In Sect. 4, we present an initial method to isolate the BART signal.
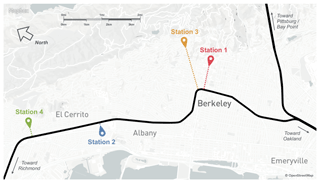
Figure 1Map of Berkeley and location of the stations. The colored pins identify the locations of the magnetometers in our network. The black line shows the different paths of the BART trains. The shortest distance from each magnetometer station to the nearby BART line is represented by the dashed lines. Stations 1 to 4 are respectively located 1, 0.13, 2, and 0.36 km from the BART rail.
2.1 Instrumentation and hardware
Each station consists of a commercially available fluxgate magnetometer, a general-purpose laptop computer, and an inexpensive GPS receiver. We emphasize our preference for commercially available hardware and additionally highlight the adoption of timing techniques from the Global Network of Optical Magnetometers for Exotic (GNOME) physics project (Pustelny et al., 2013). Our approach, which avoids bulky and expensive hardware in favor of consumer components wherever possible, reduces the cost of the acquisition system and enables portability through battery operation. However, achieving the desired timing precision (∼120 µs) with affordable commercial hardware requires a customized timing synchronization algorithm.
Each station is controlled by a computer (PC, ASUS X200M) running the Windows 10 operating system (OS). The PC acquires magnetic field measurements from a Biomed eMains 24 bit Universal Serial Bus (USB) data acquisition device (DAQ) and timing data from the GPS receiver (Garmin 18x LVC). The DAQ continuously samples the Biomed eFM3A fluxgate magnetometer at a sample rate of 3960 Hz. Absolute timing data are provided once per second by the GPS receiver, which is connected through a high-speed RS232-to-USB converter (SIO-U232-59). The GPS pulse-per-second signal is routed to the computer through the carrier detect (CD) pin of the RS232 converter with 1 µs accuracy. Data from the DAQ arrive in packets of 138 vector samples approximately every 35 ms. The data are recorded together with the GPS information and the computer system clock and uploaded via wireless internet to a shared Google Drive folder.
2.2 Time synchronization
Time intervals between the GPS updates are measured by the computer system clock (performance counter), running at ≈2.5 MHz. A linear fit model is used to determine the absolute system time relative to the GPS. The GPS timing data from the previous 120 s are used to determine linear fit parameters. When a magnetic field data packet is received, the acquisition system records the performance counter value. The packet time tag is determined by interpolating the linear fit GPS time to the performance counter value. Typical jitter of the inferred time stamps is 120 µs and is limited by the USB latency (Korver, 2003).
Due to OS limitations some data packets are not processed immediately by the PC. Packets may be delayed by several milliseconds before arriving to the data acquisition software. The number of delayed packets depends on the OS load. During normal operation of a magnetometer, about 3 % of packets are delayed. The intervals between GPS pulses and packet arrival times are measured with the performance counter in order to identify the delayed packets. Any GPS pulses that deviate more than 50 µs from the expected arrival time are discarded from the linear fit model. When a data packet arrives with a 200 µs deviation from the expected time, the associated time stamp is replaced with the expected arrival time inferred from the linear fit.
2.3 Performance characterization
To characterize sensor and data acquisition system timing performance, the four sensors are simultaneously placed in a single Helmholtz coil system driven by a pulse generator. Each sensor is sampled by a unique DAQ and PC, ensuring that the time characterization accounts for all delays associated with signal processing and transmission through the system. Sensors are stimulated with a 2 µT amplitude square wave, with a period of 200 ms and duty cycle of 50 % (Fig. 2a). Figure 2 represents the data before and after the application of the timing correction algorithm. The inset in Fig. 2a demonstrates how a delay in retrieving a data packet disrupts the timing of the field pulses. When a data packet is delayed, the magnetic field samples are distributed over a slightly larger time period, causing a shift in the observed time of the square wave zero crossing relative to the other sensors. Figure 2b shows the time discrepancies between the interpolated and expected square wave zero crossings. The zero crossings are recorded with a 120 µs standard deviation from the expected interval; however, a large number of outliers with up to 10 ms of discrepancy exist. Figure 2c shows the histogram of the data from Fig. 2b, where the red curve represents the best-fit Gaussian. After the timing correction algorithm is applied to the data, time stamps associated with outlier packets are replaced with the expected arrival times (Fig. 2d, e, f). The remaining jitter is Gaussian distributed with an error of 120 µs.
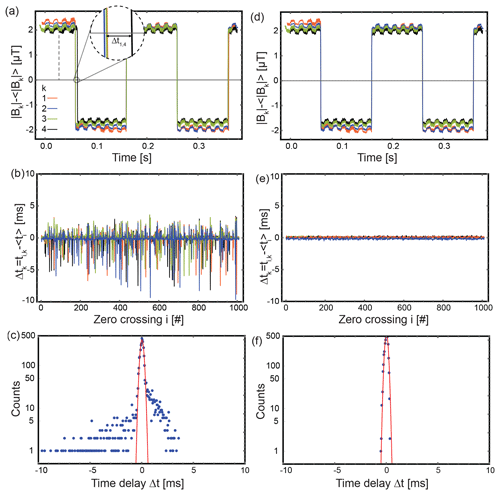
Figure 2Characterization measurement of the time synchronization algorithm. The four magnetometers are subjected to a square-wave-modulated magnetic field. Panels (a–c) show measurements with unprocessed time tags. Panels (d–f) show the time tags after processing. (a) Time series of the four magnetometer traces. The inset shows a discrepancy in magnetometer 4 at the zero crossing. (b) The difference of the mean zero-crossing time of the square wave and the individual zero-crossing time for each magnetometer for 2 min of data. (c) Histogram of the data in (b), with the red curve representing the best-fit Gaussian. While most zero-crossing events have the correct timing within the 120 µs standard deviation of the Gaussian fit, there are a significant number of outliers. Panels (d), (e), and (f) show the same data after implementing the time synchronization algorithm.
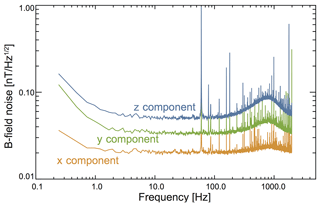
Figure 3 shows the instrumental noise floors for each vector axis of the magnetometers. Data were obtained in a two-layer μ-metal shield for approximately 35 min (223 samples at the 3960 Hz sample rate). Data were separated into an ensemble of 64 individual intervals of 217 samples. Power spectral densities were calculated for each interval, with the noise floor taken as the ensemble average of the interval spectra. The noise floor varies between individual axes, with the most noise observed on the Z axis. For all three directions, the noise floor is constant between ∼2 and 700 Hz. Narrowband spectral features from 60 Hz and harmonics are easily observed in the data. For frequencies above 1 Hz, the noise floor is uniformly below 0.1 . The peak observed in the noise floor, predominately in the Z and Y channels between ∼300 and ∼1500 Hz, is likely due to the operation of the fluxgate electronics.
3.1 Multi-station analysis of urban magnetic fields
The spatiotemporal behavior of ultralow-frequency electromagnetic fields throughout the San Francisco Bay Area has led to the identification of the Bay Area Rapid Transit (BART) as a source of electromagnetic noise (Fraser-Smith and Coates, 1978). Subsequent measurements at a distance of 100 m from BART suggested periodic bursts of magnetic activity with roughly the periodicity of the BART train (Ho et al., 1979). Given its observability, reliable periodicity, and the presence of multi-scale signatures (e.g., individual train periodicity versus daily operation schedule), the BART is a useful tool to understand the operation of a magnetometer array in an urban area.
Many magnetic signatures associated with urban activity occur at frequencies at which GPS alone provides adequate timing. To observe the spatiotemporal effect of BART in the urban magnetic field, we decimate our high-cadence data to a 1 Hz sample rate using a 3960-element moving average low-pass filter (−3 dB cutoff at ≈0.44 Hz) to address aliasing. Low-cadence data can provide adequate time resolution and bandwidth for correlating multi-station observations of urban magnetic fields over many days and months. In the subsequent analysis, only data from stations 2, 3, and 4 are used for multi-station comparisons; station 1 served as an engineering unit at the time.
Figure 4 shows the fluctuating scalar magnetic field magnitude of three stations on Sunday, 20 March 2016 (PDT). Mean fields for each station are subtracted from the total magnitude. A magnetically quiet period corresponding to BART nonoperating hours is consistent with previous observations of the urban magnetic field (Fraser-Smith and Coates, 1978). Each panel additionally shows 1 min average magnetic field observations from the USGS station in Fresno, CA. Figure 4a demonstrates a general agreement between our observations and the USGS data. Figure 4b shows that urban fluctuations dominate the daytime magnetic field. Additionally, Fig. 4c shows a subset of the data from 10:00 to 11:00 PDT, revealing several synchronous spikes in each sensor.
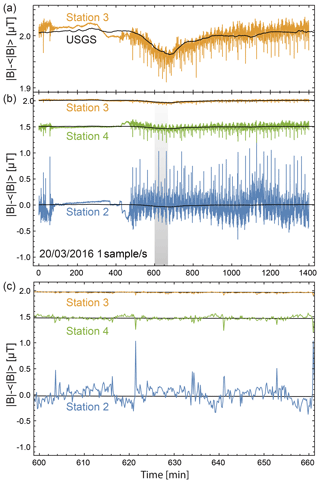
Figure 4Magnetic field magnitudes for three stations at a cadence of one sample per second on 20 March 2016. Panel (a) shows close agreement between the geomagnetic field measured by a USGS station in Fresno, CA, and sensor 3. Panel (b) shows 24 h scalar magnitudes (DC values were adjusted for plotting purposes) for the three active sensors; the magnitude of fluctuations decreases with increasing distance from the BART train line. The grey bar represents 1 h of data from 10:00 to 11:00 PDT; a better visualization of that region can be seen in panel (c). The 1 min averaged USGS geomagnetic field data are shown in each plot as a black line.
Figure 5 shows distributions of observed magnitude fluctuations binned at 10−3 µT. The record naturally separates into two intervals, corresponding to the hours when BART trains are running (roughly, from 07:55 to 01:26 PDT) and hours when BART trains are inactive. We refer to these intervals as “daytime” and “nighttime”, respectively. Different characteristics are observed for daytime and nighttime distributions. The nighttime distribution functions appear as a superposition of several individual peaks. The standard deviations, indicative of a typical fluctuation amplitude, of the measurements are given in order of increasing amplitude as σ3=0.009 µT, σ4=0.026 µT, and σ2=0.072 µT. Computing the amplitude of a typical nighttime fluctuation using the average of standard deviations computed using a 20 min sliding window throughout the night significantly reduces the estimated fluctuation amplitudes 〈σ3〉=0.001 µT, 〈σ4〉=0.004 µT, and 〈σ2〉=0.014 µT. This suggests that the magnetic field fluctuations during the night are dominated by low-amplitude fluctuations, with occasional large jumps in the field leading to a multi-peaked distribution function. Different numbers of discrete peaks (jumps) are observed in the sensors, suggesting that they may not be related to globally observable magnetic events, e.g., the BART.
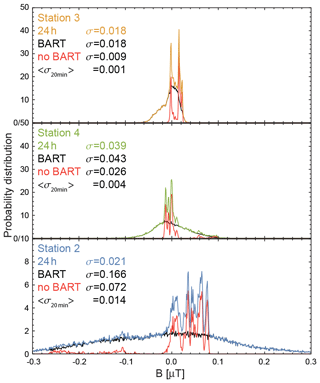
Figure 5Distributions for 24 h, daytime, and nighttime magnetic field observations with typical fluctuation amplitudes, σ, computed for each period. Additionally, the amplitude of typical nighttime fluctuations is computed using a 20 min sliding window, 〈σ〉, and demonstrates that nighttime observations are nonstationary with several discrete peaks. Daytime fluctuations follow broad distributions. The variance of the distributions increases as the distance from the BART train line decreases.
From Fig. 1, it is clear that both the daytime and nighttime variance of the distributions increases as distance to the BART rail decreases, suggesting that the background noise level observed in each station is set by the distance to BART, even when the trains are not running. Identifying other anthropogenic fields (for example, traffic) is complicated by the presence of the large BART signal. Accordingly, identifying the signatures of additional urban sources requires a thorough characterization of the magnetic background generated by BART.
3.2 Time–frequency (wavelet) analysis
Localizing the temporal distribution of spectral power requires simultaneous analysis in both time and frequency domains. To investigate the time–frequency distribution of low-frequency fluctuations associated with BART we implement a continuous wavelet transform (CWT) using Morlet wavelets (Torrence and Compo, 1998). The unnormalized Morlet wavelet function ψ(τ) is a Gaussian-modulated complex exponential,
with nondimensional time and frequency parameters τ and ω0. A value of ω0=6 is commonly used across disciplines (Podesta, 2009; Torrence and Compo, 1998; Farge, 1992). The CWT of the magnetic field B is defined by the convolution of the time series with a set of self-similar wavelets, scaled by factor s and normalized to maintain unit energy at each wavelet scale.
We implement a wavelet transform with 130 scales logarithmically spaced at , corresponding to a frequency range of 0.58 mHz ≲f<≲0.47 Hz. Full-day wavelet power spectral densities (in units of µT2∕Hz) for stations 3 and 4 on Sunday, 20 March 2016 (PST) are displayed in Fig. 6. These spectrograms prominently display the quiet nighttime period across all scales. Strong power is observed in scales corresponding to a 20 min period (0.833 mHz) and associated higher harmonics. This 20 min period coincides with the Sunday BART timetable on the geographically closest BART line (Richmond–Fremont). The black lines display the region subject to edge effects, known as the cone of influence (COI), corresponding to the e-folding time for the wavelet response to an impulse.
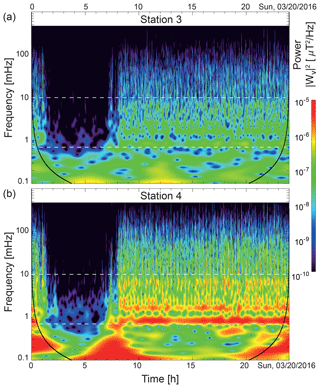
Figure 6Time–frequency analysis of scalar magnetic field. Continuous wavelet transform power spectral densities (µT2∕Hz) for stations 3 (a) and 4 (b). The spectrograms reveal power in several bands, including the 0.83 mHz frequency corresponding to a 20 min train period, common to both sensors. White dashed lines show the frequency range of a brick-wall filter (0.7–10 mHz) applied to isolate these narrowband features. Black lines show the region where edge effects may impact the wavelet transform, frequently called the cone of influence.
A brick-wall band-pass filter (i.e., unity gain in the passband, full attenuation in the stop band) between 0.7 and 10 mHz is applied to each sensor to isolate the range of observed spectral features. Figure 7a shows the band-passed time series for 10:00–11:00 PDT on 20 March 2016. The band-passed time series are normalized to their maximum values for the purpose of visualization. These observations suggests that stations 3 and 4 are correlated with each other and respectively anticorrelated with station 2. This is verified by Fig. 7b, which shows the cross-correlation coefficients Cij(τ) calculated for the band-passed 24 h time series:
where N is the record length, τ is a translation between time series, and n is the sample index (Bendat and Piersol, 1990). The phase correspondence between the stations is consistent with the distribution of stations east–west of the BART line (Fig. 1) and suggests strong azimuthal symmetry around the BART rail. Future work will aim to determine the multiple components (e.g., line current, dipole, quadrupole) corresponding to the BART field.
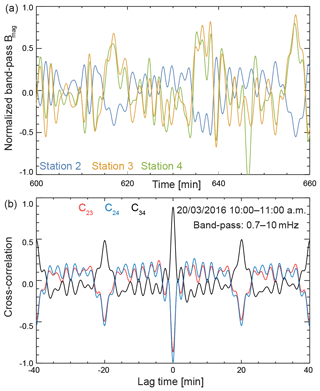
Figure 7(a) Band-passed 0.7–10 mHz time series for all three stations on 20 March 2016 between 10:00 and 11:00 PDT. (b) The correlation coefficients between pairs of stations as a function of lag. Stations 3 and 4 are highly correlated (in phase), while station 2 is respectively anticorrelated (out of phase).
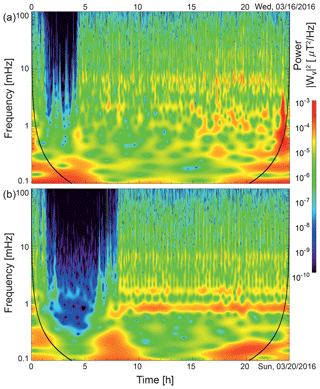
Figure 8BART night signatures. Continuous wavelet transform of magnetic field magnitude data at one sample per second from station 2 on Wednesday, 16 March 2016 (a) and Sunday, 20 March 2016 (b). The nighttime signature is significantly shorter in the data taken on Wednesday; this corresponds to BART operating hours. Additionally, the strong power bands observed on Sunday are not present in the Wednesday data.
Figure 8 shows full-day wavelet spectral densities for station 2 on both Wednesday, 16 March 2016 and Sunday, 20 March 2016. The quiet BART night is much shorter on Wednesday, corresponding to different weekend and weekday timetables. Additionally, Fig. 8a demonstrates the absence of a strong 20 min spectral component in the Wednesday data. The increase in spectral complexity is consistent with increases in train frequency, an additional active BART line, and variability associated with schedule changes for commuter hours. Previous efforts to capture period signatures associated with the BART found bursts of activity corresponding approximately to the train schedule but with an irregular variation in the waveform (Ho et al., 1979). In contrast, our observations reveal a highly regular signature, with multiple spectral components, occurring at the BART train period. The periodicity of the coherent BART signature enables the identification and extraction of the time series waveform associated with BART operation.
Previous attempts have been made to identify and remove transient features associated with BART from geomagnetic time series using wavelets (Liu and Fraser-Smith, 1998). Our observations of a highly periodic BART signature suggest that statistical averaging over observations may be used to remove the periodic behavior. The periodic 20 min signature observed in the Sunday, 20 March 2016 time series from station 2 can be extracted using the technique known as superposed epoch analysis (Singh and Badruddin, 2006). We identified 46 sharp peaks in the magnetic field occurring with an approximate 20 min period (e.g., Fig. 4). From these 46 peaks, an ensemble [X(t)i] of intervals is constructed comprising the 3 min preceding and 17 min succeeding each individual peak. Averaging over the ensemble of intervals reveals a coherent signature with an approximate 20 min period; see Fig. 9a. The periodic signal observed in the data has the form of a sharp discrete peak of ≈1 µT, followed by an oscillation with a period on the order of several minutes. A quantitative comparison between each member of the ensemble and the extracted coherent structure is obtained through the Pearson correlation.
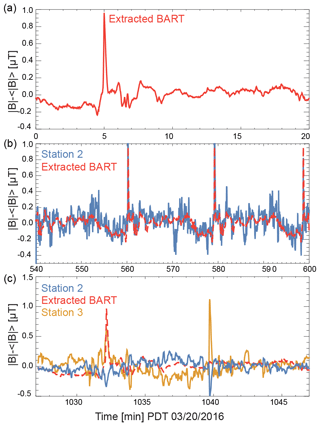
Figure 9Extraction of BART signal. (a) The 20 min periodic signal of the BART extracted from an ensemble average of 46 intervals from station 2. (b) Comparison of the extracted average signal with an hour of observations from station 2 taken from 09:00 to 10:00 PDT. (c) Comparison of extracted average signal with an interval containing a global magnetic anomaly likely due to variation in BART operation.
The average correlation between the extracted signal and observed data is , with ρi ranging from 0.1 to 0.85. The cross-correlation indicates the fraction of power in each interval derived from the average signature. Figure 9b demonstrates high correlation between the extracted average signal with an hour of observations taken from 09:00 to 10:00 PDT. Figure 9c demonstrates an interval of data (with ρ=0.17) that includes a transient feature observed in multiple stations, likely due to transient variation in the BART operation. By extracting periodic magnetic signatures of BART, we enable the identification of globally transient events associated with BART operation that can be used to differentiate local anomalous behavior due to other urban signatures. Measurements from a single sensor allow us to identify events that deviate from the correlated periodic observations; our future work will employ the full network of magnetometers to identify spatiotemporally correlated signals, allowing for the identification of magnetic fluctuations local to each sensor.
An array of four magnetometers has been developed with a sampling rate of ∼4 kHz and sensitivity better than for the purpose of monitoring urban magnetic fields. The array has been deployed around Berkeley, CA, and subsequent work will report on observations taken in New York City. This array is sensitive to both low-frequency variations in the Earth's geomagnetic field and a variety of anthropogenic sources: currents associated with BART, traffic, and 60 Hz power lines. The broadband spectra of the urban magnetic field are dominated by the BART train system, which also generates coherent narrowband spectral features. Significant variations in spectral signatures are observed between weekends and weekdays, corresponding to differences in the BART train schedule. During the hours for which BART is nonoperational, broadband noise is significantly decreased and agreement with the USGS magnetic field measurements is observed. However, the nighttime field still contains features not attributable to geophysical activity. Further study is required to determine the nature and sources of these features.
These observations rely on the implementation of the network presented in Sect. 2. Our network relies on low-cost commercial hardware and a customized time synchronization algorithm that allows for the cross-correlation of the sensors at high frequencies. This algorithm additionally corrects for latency issues associated with the use of commercial, non-precision hardware. Our synchronization procedure, which has been verified through simultaneous simulation of sensors, is precise to ≈120 µs. Though many sources of urban magnetic fields operate at much slower timescales, this precision enables studies of high-frequency urban magnetic anomaly detection and sensor cross-correlation. Additionally, this synchronization algorithm may be implemented across other sensor networks built with cost-effective hardware.
We provide a proof-of-concept deployment of what, to our knowledge, is the first synchronized network of magnetometers specifically designed for observing the effects of human activity on the magnetic field in an urban environment. Further development of algorithms to characterize and extract the BART signal, as well as other magnetic signatures, is necessary. These algorithms may take advantage of other data sources – e.g., real-time BART arrival–departure data – and machine-learning techniques. In analyzing magnetic observations of a city, we demonstrate that urban magnetic fields can reflect identifiable aspects of human activity; further work will aim to identify other sources of urban magnetic fields with multi-scale signatures (e.g., traffic and energy consumption). This work may prove useful for the identification and reduction of noise in geophysical sensor networks that measure magnetic fields and seismic activity. Several additional courses for future work are evident: the study of high-frequency signals such as the 60 Hz power line; exploration of the long-term behavior of magnetic fields taken from single station observations; and comparative measurements of urban magnetic fields between cities.
The datasets generated and analyzed during the current study are available from the corresponding author on reasonable request. Public release of the data has not been approved at this time. Our time filtering algorithm and data acquisition software are publicly available on GitHub at https://github.com/lenazh/UrbanMagnetometer (last access: 3 May 2018).
EZ, AW, and VD were responsible for hardware development. EZ, AW, VD, and TAB participated in network characterization. TAB conducted analysis of magnetometer data. AW, VD, and TAB generated figures. VD, TAB, and EZ contributed most portions of the paper. DB, JW, GD, CP, and AW generated the initial concept for the network and study. DB and JW were responsible for project management and coordination. All authors participated in discussions, the direction of the work, and review of the paper.
The authors declare that they have no conflict of interest.
We are grateful to Brian Patton for his contributions in the early stages of the project. The views expressed in the publication are those of the authors and do not imply endorsement by the Department of Defense or the National Geospatial-Intelligence Agency. Gregory Dobler's work has been partially supported by a James S. McDonnell Complex Systems Scholar Award.
This paper was edited by Luis Vazquez and reviewed by four anonymous referees.
Abbott, B. P., Abbott, R., Abbott, T. D., et al.: Observation of Gravitational Waves from a Binary Black Hole Merger, Phys. Rev. Lett., 116, 061102, https://doi.org/10.1103/PhysRevLett.116.061102, 2016. a
Abbott, B. P., Abbott, R., Abbott, T. D., et al.: Multi-messenger Observations of a Binary Neutron Star Merger, Astrophys. J. Lett., 848, L12, https://doi.org/10.3847/2041-8213/aa91c9, 2017. a
Abramovici, A., Althouse, W. E., Drever, R. W. P., Gursel, Y., Kawamura, S., Raab, F. J., Shoemaker, D., Sievers, L., Spero, R. E., Thorne, K. S., Vogt, R. E., Weiss, R., Whitcomb, S. E., and Zucker, M. E.: LIGO – The Laser Interferometer Gravitational-Wave Observatory, Science, 256, 325–333, https://doi.org/10.1126/science.256.5055.325, 1992. a
Afach, S., Budker, D., DeCamp, G., Dumont, V., Grujić, Z. D., Guo, H., Kimball, D. F. J., Kornack, T. W., Lebedev, V., Li, W., Masia-Roig, H., Nix, S., Padniuk, M., Palm, C. A., Pankow, C., Penaflor, A., Peng, X., Pustelny, S., Scholtes, T., Smiga, J. A., Stalnaker, J. E., Weis, A., Wickenbrock, A., and Wurm, D.: Characterization of the global network of optical magnetometers to search for exotic physics (GNOME), Phys. Dark Universe, 22, 162–180, https://doi.org/10.1016/j.dark.2018.10.002, 2018. a
Angelopoulos, V.: The THEMIS Mission, Space Sci. Rev., 141, 5, https://doi.org/10.1007/s11214-008-9336-1, 2008. a
Bendat, J. S. and Piersol, A. G.: Random Data: Analysis and Measurement Procedures, John Wiley & Sons, Inc., New York, NY, USA, 2nd Edn., 1990. a
Bianco, F. B., Koonin, S. E., Mydlarz, C., and Sharma, M. S.: Hypertemporal Imaging of NYC Grid Dynamics: Short Paper, in: Proceedings of the 3rd ACM International Conference on Systems for Energy-Efficient Built Environments, BuildSys '16, ACM, New York, NY, USA, 61–64, https://doi.org/10.1145/2993422.2993570, 2016. a
Burch, J. L. and Phan, T. D.: Magnetic reconnection at the dayside magnetopause: Advances with MMS, Geophys. Res. Lett., 43, 8327–8338, https://doi.org/10.1002/2016GL069787, 2016. a
Dobler, G., Ghandehari, M., Koonin, S. E., Nazari, R., Patrinos, A., Sharma, M. S., Tafvizi, A., Vo, H. T., and Wurtele, J. S.: Dynamics of the urban lightscape, Inform. Syst., 54, 115–126, https://doi.org/10.1016/j.is.2015.06.002, 2015. a
Farge, M.: Wavelet Transforms and their Applications to Turbulence, Ann. Rev. Fluid Mech., 24, 395–458, https://doi.org/10.1146/annurev.fl.24.010192.002143, 1992. a
Fraser-Smith, A. C. and Coates, D. B.: Large-amplitude ULF electromagnetic fields from BART, Radio Sci., 13, 661–668, https://doi.org/10.1029/RS013i004p00661, 1978. a, b
Ghandehari, M., Aghamohamadnia, M., Dobler, G., Karpf, A., Buckland, K., Qian, J., and Koonin, S.: Mapping Refrigerant Gases in the New York City Skyline, Sci. Rep.-UK, 7, 2735, https://doi.org/10.1038/s41598-017-02390-z, 2017. a
Gjerloev, J. W.: A Global Ground-Based Magnetometer Initiative, Eos, Transactions American Geophysical Union, 90, 230–231, https://doi.org/10.1029/2009EO270002, 2009. a
Gjerloev, J. W.: The SuperMAG data processing technique, J. Geophys. Res.-Space, 117, a09213, https://doi.org/10.1029/2012JA017683, 2012. a
Harris, S. E., Mende, S. B., Angelopoulos, V., Rachelson, W., Donovan, E., and Jackel, B.: THEMIS Ground Based Observatory System Design, Space Sci. Rev., 141, 213–233, https://doi.org/10.1007/s11214-007-9294-z, 2008. a
Ho, A. M.-H., Fraser-Smith, A. C., and Villard, O. G.: Large-amplitude ULF magnetic fields produced by a rapid transit system: Close-range measurements, Radio Sci., 14, 1011–1015, https://doi.org/10.1029/RS014i006p01011, 1979. a, b
Korver, N.: Adequacy of the Universal Serial Bus for real-time systems, Tech. rep., University of Twente, available at: http://doc.utwente.nl/56344/1/Korver03adequacy.pdf (last access: 17 October 2018), 2003. a
Liu, T. T. and Fraser-Smith, A. C.: Identification and removal of man-made transients from geomagnetic array time series: a wavelet transform based approach, in: Conference Record of Thirty-Second Asilomar Conference on Signals, Systems and Computers (Cat. No.98CH36284), vol. 2, 1363–1367 https://doi.org/10.1109/ACSSC.1998.751548, 1998. a
Peticolas, L. M., Craig, N., Odenwald, S. F., Walker, A., Russell, C. T., and Angelopoulos, V.: The Time History of Events and Macroscale Interactions during Substorms (THEMIS) Education and Outreach (E/PO) Program, Space Sci. Rev., 141, 557–583, https://doi.org/10.1007/s11214-008-9458-5, 2008. a
Phan, T. D., Eastwood, J. P., Shay, M. A., Drake, J. F., Sonnerup, B. U. Ö., Fujimoto, M., Cassak, P. A., Øieroset, M., Burch, J. L., Torbert, R. B., Rager, A. C., Dorelli, J. C., Gershman, D. J., Pollock, C., Pyakurel, P. S., Haggerty, C. C., Khotyaintsev, Y., Lavraud, B., Saito, Y., Oka, M., Ergun, R. E., Retino, A., Le Contel, O., Argall, M. R., Giles, B. L., Moore, T. E., Wilder, F. D., Strangeway, R. J., Russell, C. T., Lindqvist, P. A., and Magnes, W.: Electron magnetic reconnection without ion coupling in Earth's turbulent magnetosheath, Nature, 557, 202–206, https://doi.org/10.1038/s41586-018-0091-5, 2018. a
Podesta, J. J.: Dependence of Solar-Wind Power Spectra on the Direction of the Local Mean Magnetic Field, Astrophys. J., 698, 986–999, https://doi.org/10.1088/0004-637X/698/2/986, 2009. a
Pustelny, S., Jackson Kimball, D. F., Pankow, C., Ledbetter, M. P., Wlodarczyk, P., Wcislo, P., Pospelov, M., Smith, J. R., Read, J., Gawlik, W., and Budker, D.: The Global Network of Optical Magnetometers for Exotic physics (GNOME): A novel scheme to search for physics beyond the Standard Model, Ann. Phys.-Berlin, 525, 659–670, https://doi.org/10.1002/andp.201300061, 2013. a, b
Schlegel, K. and Füllekrug, M.: 50 Years of Schumann Resonance, Physik in unserer Zeit, 33, 256–261, 2002. a
Sheinker, A., Frumkis, L., Ginzburg, B., Salomonski, N., and Kaplan, B. Z.: Magnetic Anomaly Detection Using a Three-Axis Magnetometer, IEEE T. Magn., 45, 160–167, https://doi.org/10.1109/TMAG.2008.2006635, 2009. a
Singh, Y. P. and Badruddin: Statistical considerations in superposed epoch analysis and its applications in space research, J. Atmos. Sol.-Terr. Phys., 68, 803–813, https://doi.org/10.1016/j.jastp.2006.01.007, 2006. a
Torrence, C. and Compo, G. P.: A Practical Guide to Wavelet Analysis, B. Am. Meteorol. Soc., 79, 61–78, 1998. a, b
Wang, H., Chen, C. E., Ali, A., Asgari, S., Hudson, R. E., Yao, K., Estrin, D., and Taylor, C.: Acoustic sensor networks for woodpecker localization, in: Proc. SPIE, Advanced Signal Processing Algorithms, Architectures, and Implementations XV, vol. 5910, p. 12, https://doi.org/10.1117/12.617983, 2005. a


