the Creative Commons Attribution 4.0 License.
the Creative Commons Attribution 4.0 License.
 | 23 May 2019
A full waveform current recorder for electrical prospecting
Kai Chen
Sheng Jin
Current data are an important input data for electrical prospecting data postprocessing. The existing current recorder is inadequate for continuous recording, precision, bandwidth, dynamic range, and input range. A new full waveform current recorder that is ideal for measuring current signal for electrical prospecting applications is presented. The new measurement principle enables the fabrication of a high-precision current sensor with an autonomous data logger as well as continuous measurement capabilities for full waveforms that are comparable to recent developments for electrical prospecting applications. The full waveform current recorder is capable of measuring current with bandwidth from direct current (DC) to 10 kHz, with a power spectrum density noise floor of 10 µA/rt(Hz) at 10 Hz. The current recorder has a dynamic range that is higher than 97 dB over a range of 100 A at peak, with time synchronisation error as low as ±0.1 µs. These features make new current recorder a promising technology for high-precision measurement with long-duration, autonomous data logging for field electrical prospecting applications.
- Article
(3886 KB) - Full-text XML
- BibTeX
- EndNote


Electrical prospecting contains many branch methods, such as time-domain-induced polarisation (TDIP) (Fiandaca et al., 2012), spectral-induced polarisation (SIP) (Vanhala, 2010), direct-current resistivity (DCR) (Monteiro Santos and Elkaliouby, 2011), magnetotellurics (MT) (Cagniard, 1953), and controlled source electromagnetic surveying (CSEM) (Boerner et al., 1993a), which have been successfully applied on mineral exploration, hydrocarbons prospecting, and groundwater investigation.
At present, CSEM sounding measurements are mostly interpreted using their apparent resistivity. In far-zone sounding, the electric field and the magnetic field components are proportional to the electromagnetic moment of the controlled source; therefore, the effect of the field source parameters on resistivity can be ignored. However, when a single component (E field or B field) is used to calculate a normalised field, the current data must be calculated for data postprocessing. This requires the current signal to be recorded with high precision (Constable, 2013). For TDIP applications, the load of the transmitter is not stable due to variable grounding resistance in field conditions, and the real current amplitude is not constant. To obtain the required high-precision resistivity result, the precision of current amplitude measurement should be ensured. For SIP applications, the complex resistivity is calculated using the current data, measuring both the phase and the amplitude; thus, achieving a low time synchronisation error for current measurement is important. For the application of the controlled source audio magnetotelluric (CSAMT) method (Boerner et al., 1993b; Di et al., 2017), the current is not used as the input for data postprocessing, but the current data can provide a reference for the evaluation of the transmitter quality. Furthermore, when the transmitter launches a pseudo-random sequence (PRS) (Ramayya et al., 2008), the pulse width is narrow, not only measuring the current amplitude but also requiring a broader sampling bandwidth and time precision.
As shown in the preceding examples, current is an important parameter for data postprocessing in electrical prospecting. To meet the above requirements, current recorders focus on full waveform recording, bandwidth, amplitude accuracy, and time precision.
Several instruments have been recently developed to measure current for advanced electrical prospecting such as the RXU-TMR from Phoenix Geophysics (Phoenix Geophysics, 2018) and the I-FullWaver from IRIS (IRIS, 2018). A comparison of the performance of various current recorders is presented in Table 1. To meet the requirements for current measurement in high-power multifunction transmitters, which use PRS waveform and broad bandwidth CSEM, certain deficiencies in the input range, precision, bandwidth, and continuous recording should be addressed. The I-FullWaver is designed for TDIP, and its bandwidth is limited. The RXU-TMR from Phoenix Geophysics is suitable for CSAMT, TDIP, and SIP, but the raw data are discontinuous and therefore not suitable for PRS applications. Zhang et al. (2017) developed a full waveform voltage and current recording device for multi-transient electromagnetic (MTEM) applications (Ziolkowski et al., 2010; Di et al., 2018) with continuous recording capability; however, its accuracy and dynamic range are limited. Furthermore, its current transducer is based on sample resistance, which is insufficient for galvanic isolation.
Table 1Performance comparison of different current measurement solutions.
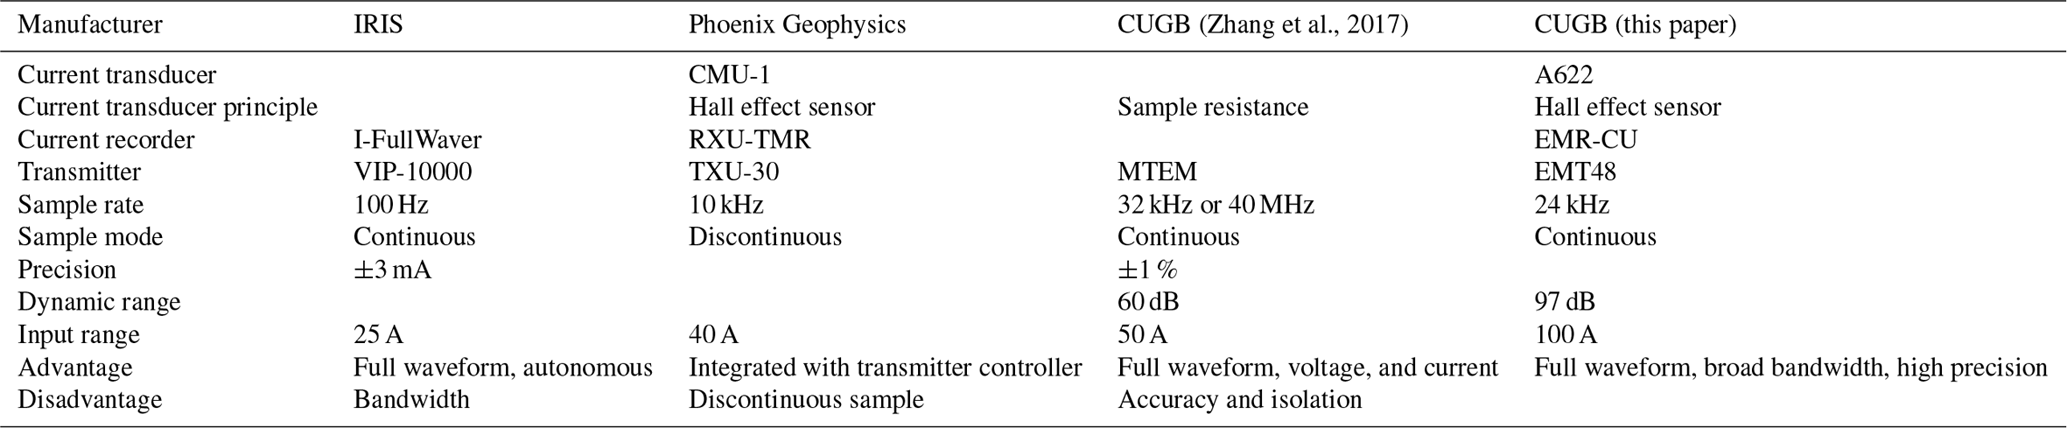
Considering the above analysis, an acceptable current recorder should have the following characteristics: (1) a suitable input range for a high-power multifunction transmitter; (2) acceptable precision for amplitude measurement; (3) accurate and consistent time synchronisation while recording the current to decrease phase calculation error; (4) continuous current sampling and full waveform recording for current amplitude and phase variable. Thus, the development of current recorders mainly focuses on the accuracy of the amplitude, the accuracy of time synchronisation, broad bandwidth, and continuous recording at a large input range for full waveform recording.
2.1 Design overview
Current information is required for deconvolution calculations for postprocessing. The waveform current recorder for current signals is a new device concept designed for SIP, TDIP, and advanced CSEM sounding. It can operate in all field conditions as it is compact, efficient, and discrete, and can autonomously record full, continuous current waveforms. This current recorder uses a Hall effect sensor to accurately measure and log the injected current IAB by proximity, without requiring direct contact. The current recorder is connected close to the transmitter without any injection, and an internal GPS that accurately provides a pulse per second (PPS) signal allows the device to store a continuous series with high-precision time stamping, which is crucial for correlating and processing data from an EM receiver installed nearby. The measurement of IAB is used to evaluate the behaviour of the transmitter and to accurately compute the apparent resistivity. Current samples are recorded at a sample rate of either 24 kHz or 2400 Hz, and all raw data are synchronised through GPS-PPS time stamping. Post-acquisition data processing improves the signal-to-noise ratio (SNR) for better results in terms of data quality due to the high-precision nature of current information, allowing for deeper investigations in noisy areas.
The current recorder continuously stores time series records of its output current on a removable flash memory SD card. The full waveform current recorder contains an integrated class-10 32 GB SD card for storage and can store up to 90 h of data corresponding to 11 8 h working days, using a 24 kHz sampling rate. Alternatively, data on the flash memory card can be uploaded to the postprocessing computer in the field via a high-speed ethernet interface at a maximum transfer rate of 10 MBps.
When the transmitter is used in the field, the current recorder performs measurement using a built-in current probe. While the current probe is engaged with the cable, the probe's output voltage has a linear relationship with the current in the cable based on the Hall effect. Figure 1 presents the system working principle. The multifunction EM transmitter consists of a high-power diesel generator, a high-power AC/DC regulator, a chopper module, a data acquisition unit, a current probe, two long-distance cables, two electrode plates, and an external tablet computer (PAD).
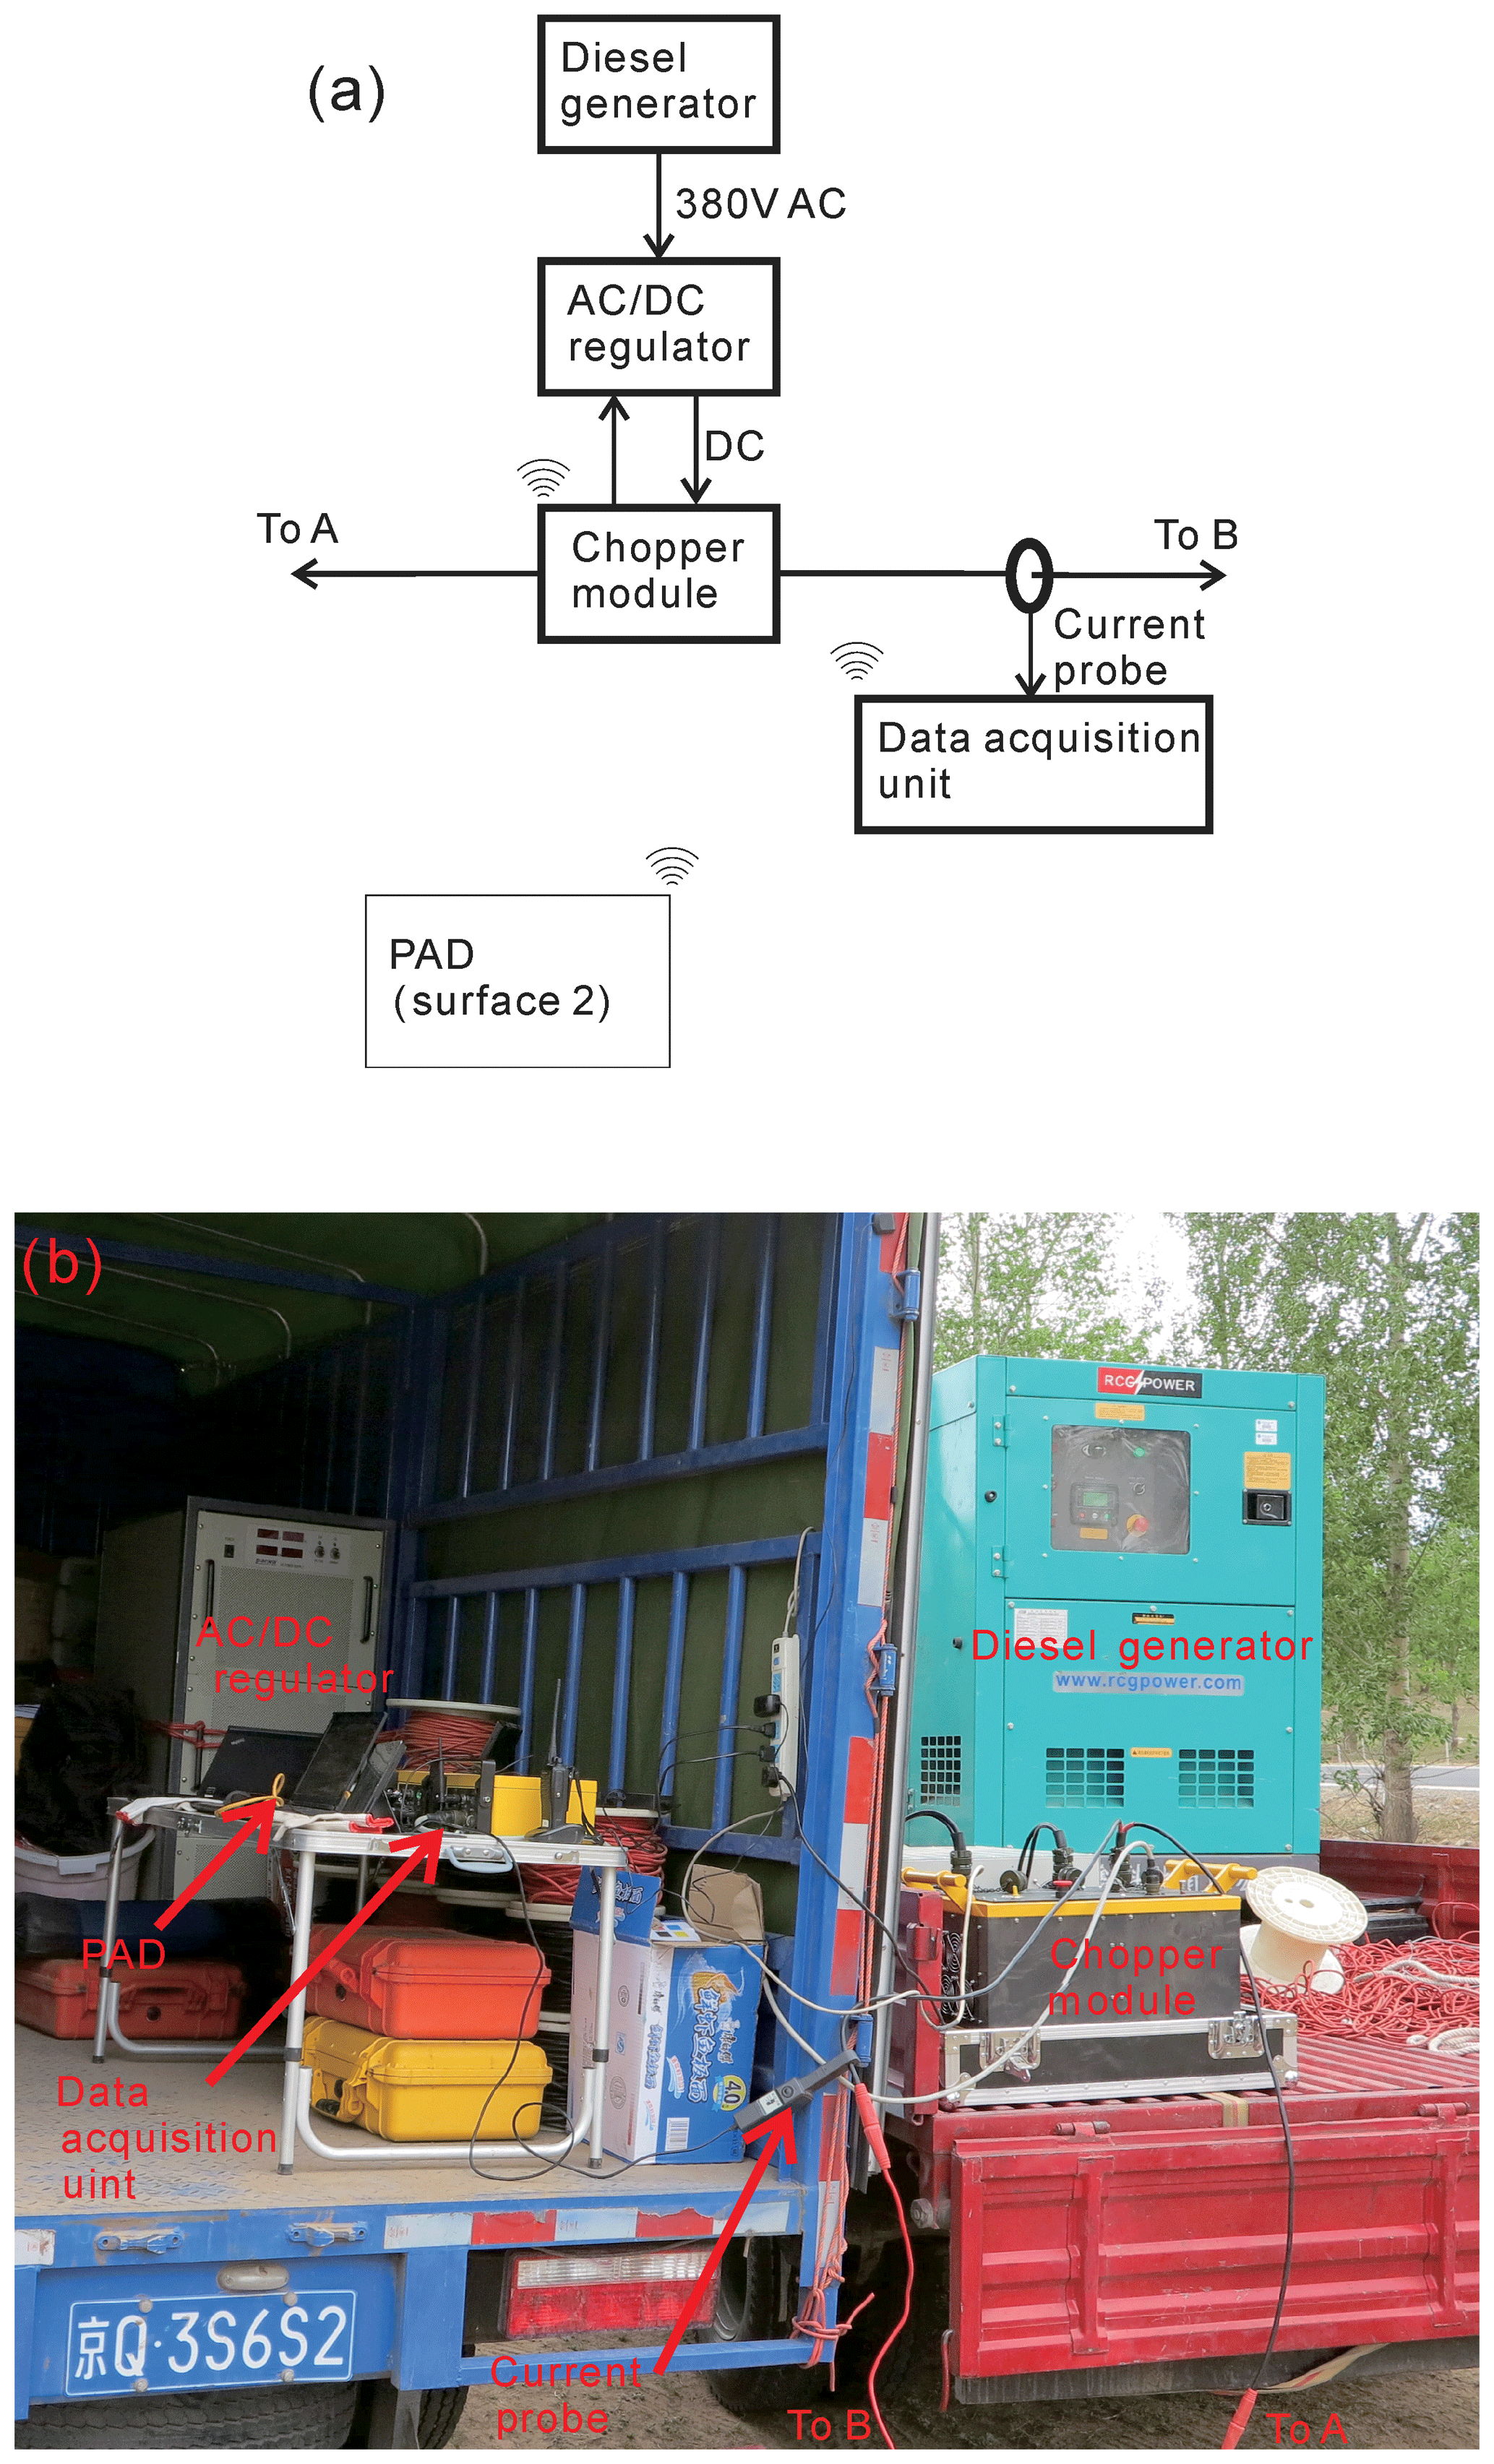
Figure 1(a) Diagram of multifunction EM transmitter architecture, (b) photograph of the transmitter: diesel generator, AC/DC regulator, chopper module, current probe, data acquisition unit, cable, tablet computer (PAD).
2.2 Hardware principle
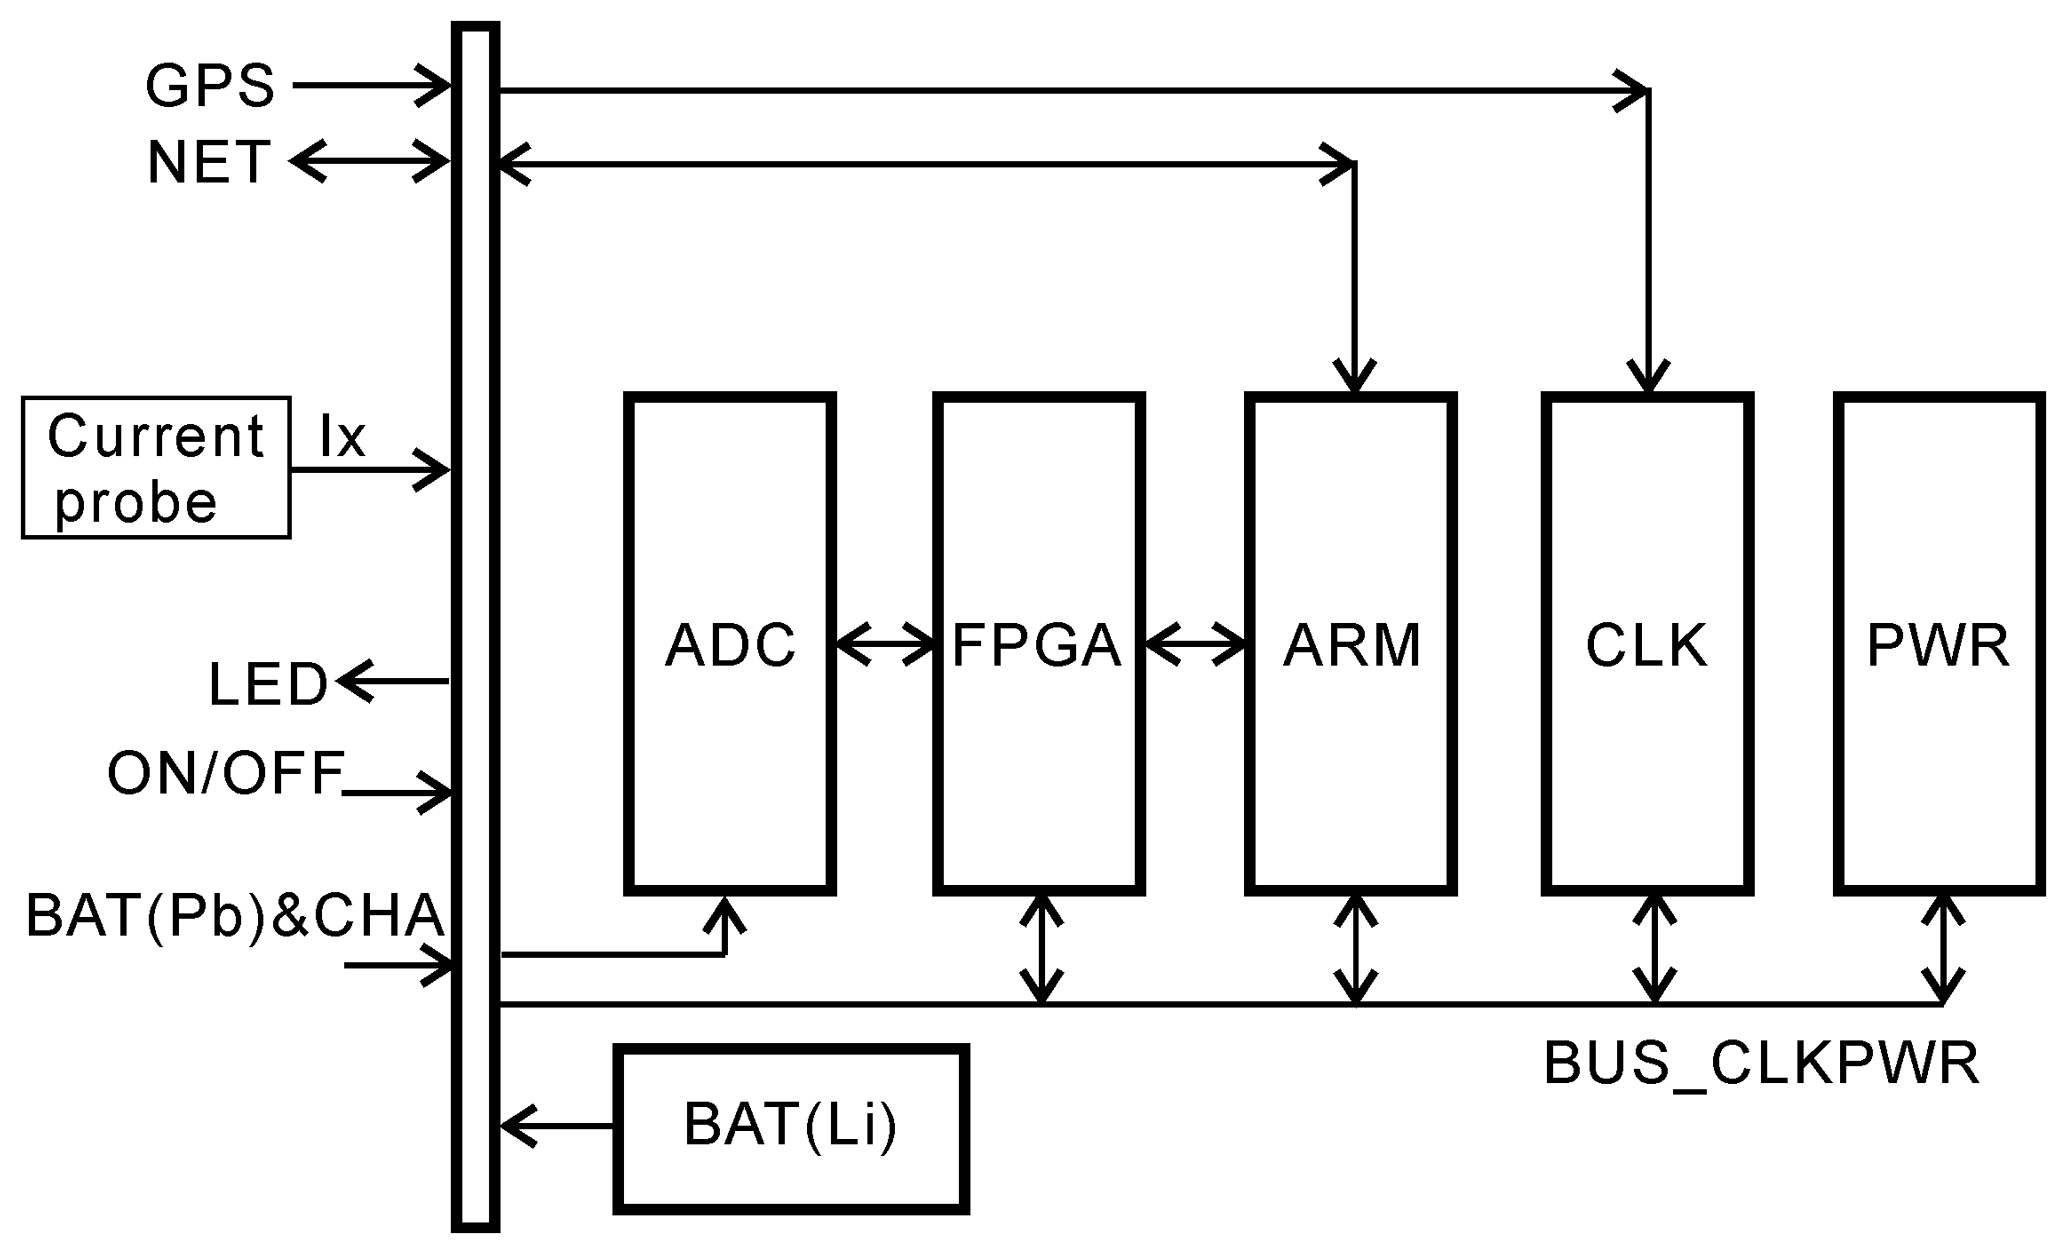
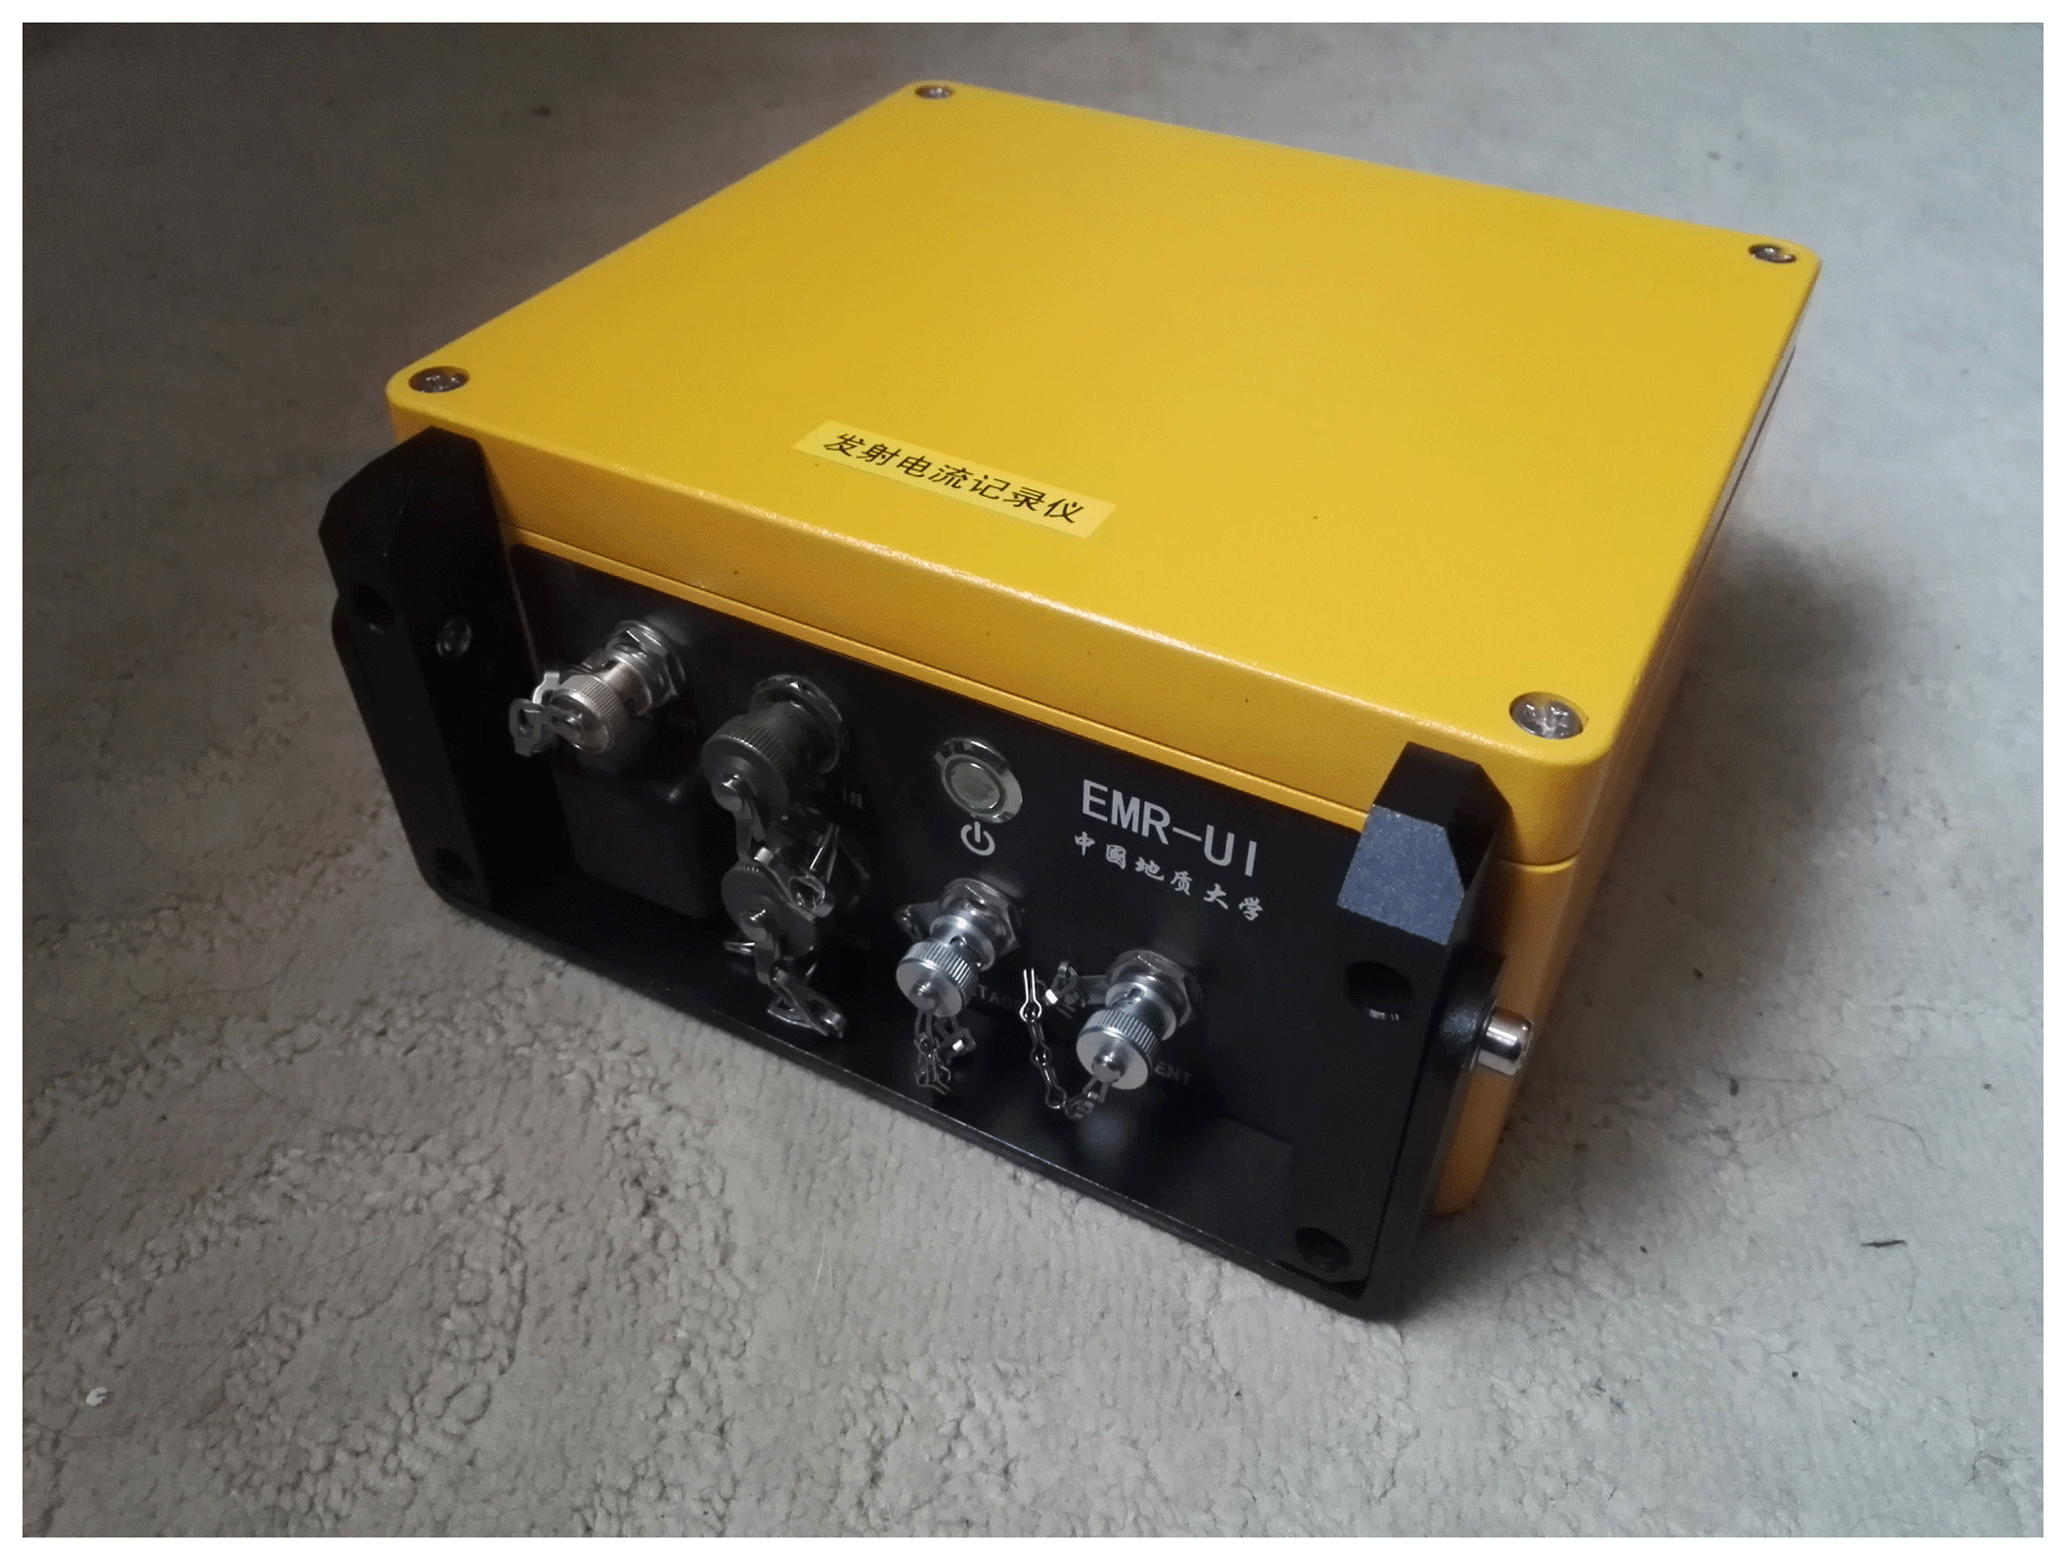
The current recorder contains the current probe and the data acquisition unit. Figure 2 shows the diagram of the current recorder. The data acquisition unit consists of a GPS antenna, an allium box, five printed circuit boards (PCBs), and a built-in battery. The PCB contains a front interface module, an analog-to-digital converter (ADC) module, a field-programmable gate array (FPGA) module, an Advanced RISC Machine (ARM) module, a clock module, and a power module. The front interface module integrates the protection of the input circuit and anti-aliasing filter, with connectors inside and outside the allium box. The NET interface is used to communicate with the external user PAD. The ADC module amplifies the voltage signal from the current probe output and converts the signal to a serial digit output. The sample rate is set as either 24 kHz or 2.4 kHz. The bandwidth is set as either 10 kHz or 1 kHz. The FPGA module reads the data stream and adds the GPS time stamp, and the ARM module transfers data from the FPGA to the built-in SD card. The CLK module provides GPS time information and PPS for the ARM and FPGA modules. Each discrete module is integrated using a bus. The power module converts the Li-ion battery voltage to analogue and digital power sources. The capacity of the battery is 20 Ah at 12 V, and the entire power consumption is approximately 6 W. The maximum working time is approximately 40 h, which is sufficient for field work. Figure 3 shows a photograph of the data acquisition unit.
The current recorder not only provides continuous real-time acquisition but also transfers data to the PAD for raw time series display. Fast ethernet is used to transfer data between the current recorder and the PAD, which is a Microsoft Surface 2 running Windows RT OS. The PAD configures the acquisition parameters and displays the waveform time series in real time. The acquisition parameter includes the sample rate and sensitivity of the current probe, as well as other values. The parameter configuration function is accessed using the Telnet protocol, and time series data transfer is performed using User Datagram Protocol (UDP). Although the display data are not continuous, data stored on the SD card are continuous. When the sample rate is set at 24 kHz, the data throughput rate is 4 B/ch × 24 kHz = 96 KBps, for a total data store rate of approximately 338 MB per hour. Fast ethernet (100 Mbps) is sufficient to meet the data transfer requirement. For an 8 h working day, the total data volume may reach 2.7 GB per day. The SD storage space is 32 GB, which is enough for 90 h (about 11 8 h working days). Time synchronisation is another key specification. Figure 4 shows the diagram of the clock module, which contains an LEA-6T GPS made by u-blox, FPGA, Oven Controlled Crystal Oscillator (OCXO) made by KVG Inc., and digital-to-analog converter (DAC). The GPS module provides high-precision time source with PPS drift error as low as 20 ns. The output frequency of the OCXO is set to 12.288 MHz with 10 ppb frequency stability in the entire temperature range. Before the data acquisition unit is started, the FPGA must calibrate the output clock of OCXO CLK_OCXO using PPS. The FPGA generates another PPS_local signal output as local PPS, which comes from the OCXO, measures the time difference between the PPS_GPS from the GPS and the PPS_local real time when the gap exceeds 0.1 µs, adjusts the taming voltage Vc of the OCXO using the DAC output for calibrating the OCXO output frequency.

2.3 Current probe
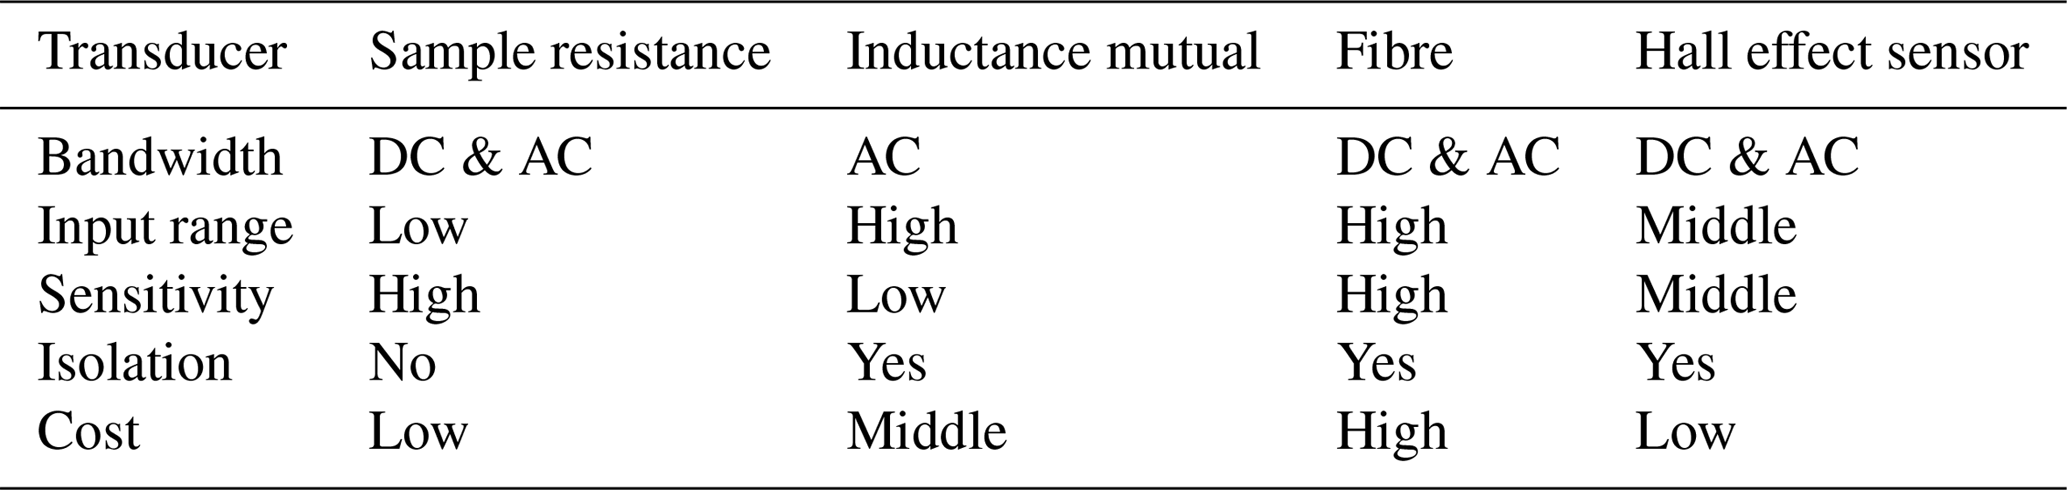
In the current measurement application, an available current transducer can be selected from the sample resistance, inductance mutual, Hall effect sensor, and fibre sensor. Table 2 presents a comparison of different sensors for current measurement. The Hall effect sensor is the best choice for a full waveform current recorder considering the bandwidth, galvanic isolation between the primary and secondary circuits, precision, input range, and cost.
Table 2Performance comparison of different current transducers.
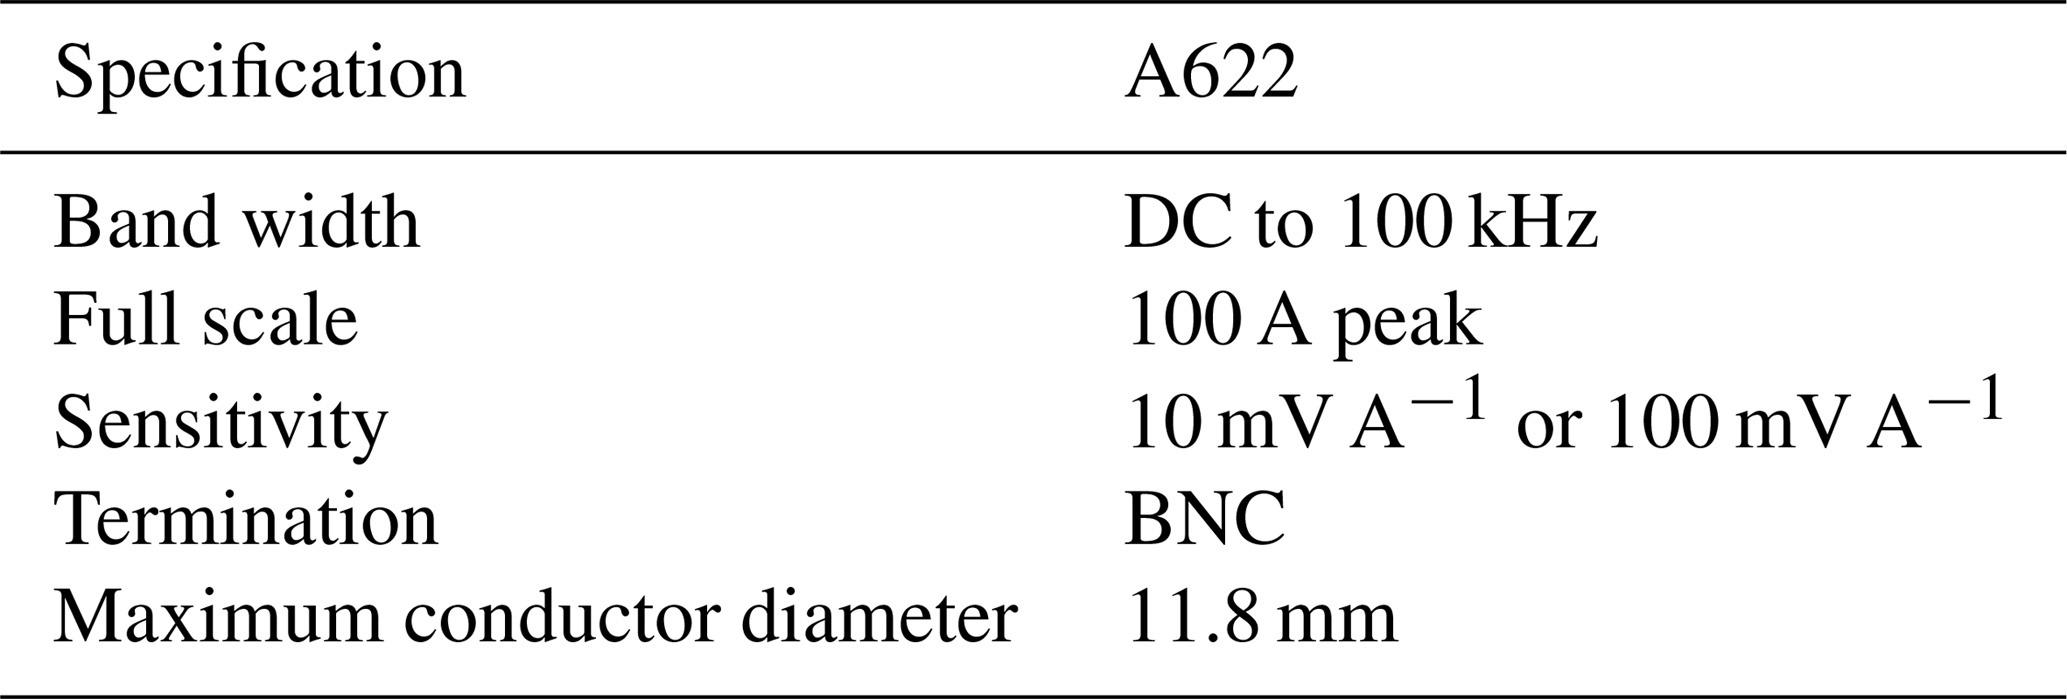
After evaluation and investigation, the Tektronix A622 (Tektronix, 2018) was selected as the current sensor. This is a Hall effect current sensor that meets the requirements of bandwidth, input range, precision, and compact design. Table 3 presents the main specifications of the A622. This “long nose” style clamp-on probe uses a Hall effect current sensor to provide a voltage output linearity with the input current to the data acquisition unit. It has a Bayonet Nut Connector (BNC) and can be used with a shrouded banana plug adapter; thus, it can also be used on digital multimeters, TekMeter devices, and oscilloscopes. The A622 can measure AC/DC currents from 50 mA to 100 A peak over a frequency range of DC to 100 kHz. It provides 10 mV or 100 mV output for each amp measured.
Table 3Specification of the current probe (A622 from Tektronix).
2.4 Software principle
The software contains an ARM-Linux driver and an ARM-Linux application that is built on the embedded Linux platform PAD-Windows application run in Windows OS built using Visual C. Figure 5 shows the data flowchart of the current recorder. The flowchart can be categorised into two parts, namely up flow and down flow. In down flow, the user configures the data acquisition parameter (gain, sample rate, etc.) for use on PAD, and PAD sends the parameter file to the ARM platform using the Telnet protocol. ARM-Linux application analyses the parameter file and configures the ADC through the FPGA. In up flow, ARM-Linux application reads the converted data from ADC through the FPGA and writes the data to the SD card, which is sent to PAD through the UDP. To ensure continuous recording of data, the direct memory access (DMA) in ARM was used for data transfer, and multiple threads were created to read FPGA, write files to the SD card, and send UDP data frames to the PAD. The ARM-Linux application was used as the server, whereas the PAD-Windows application was used as the client.
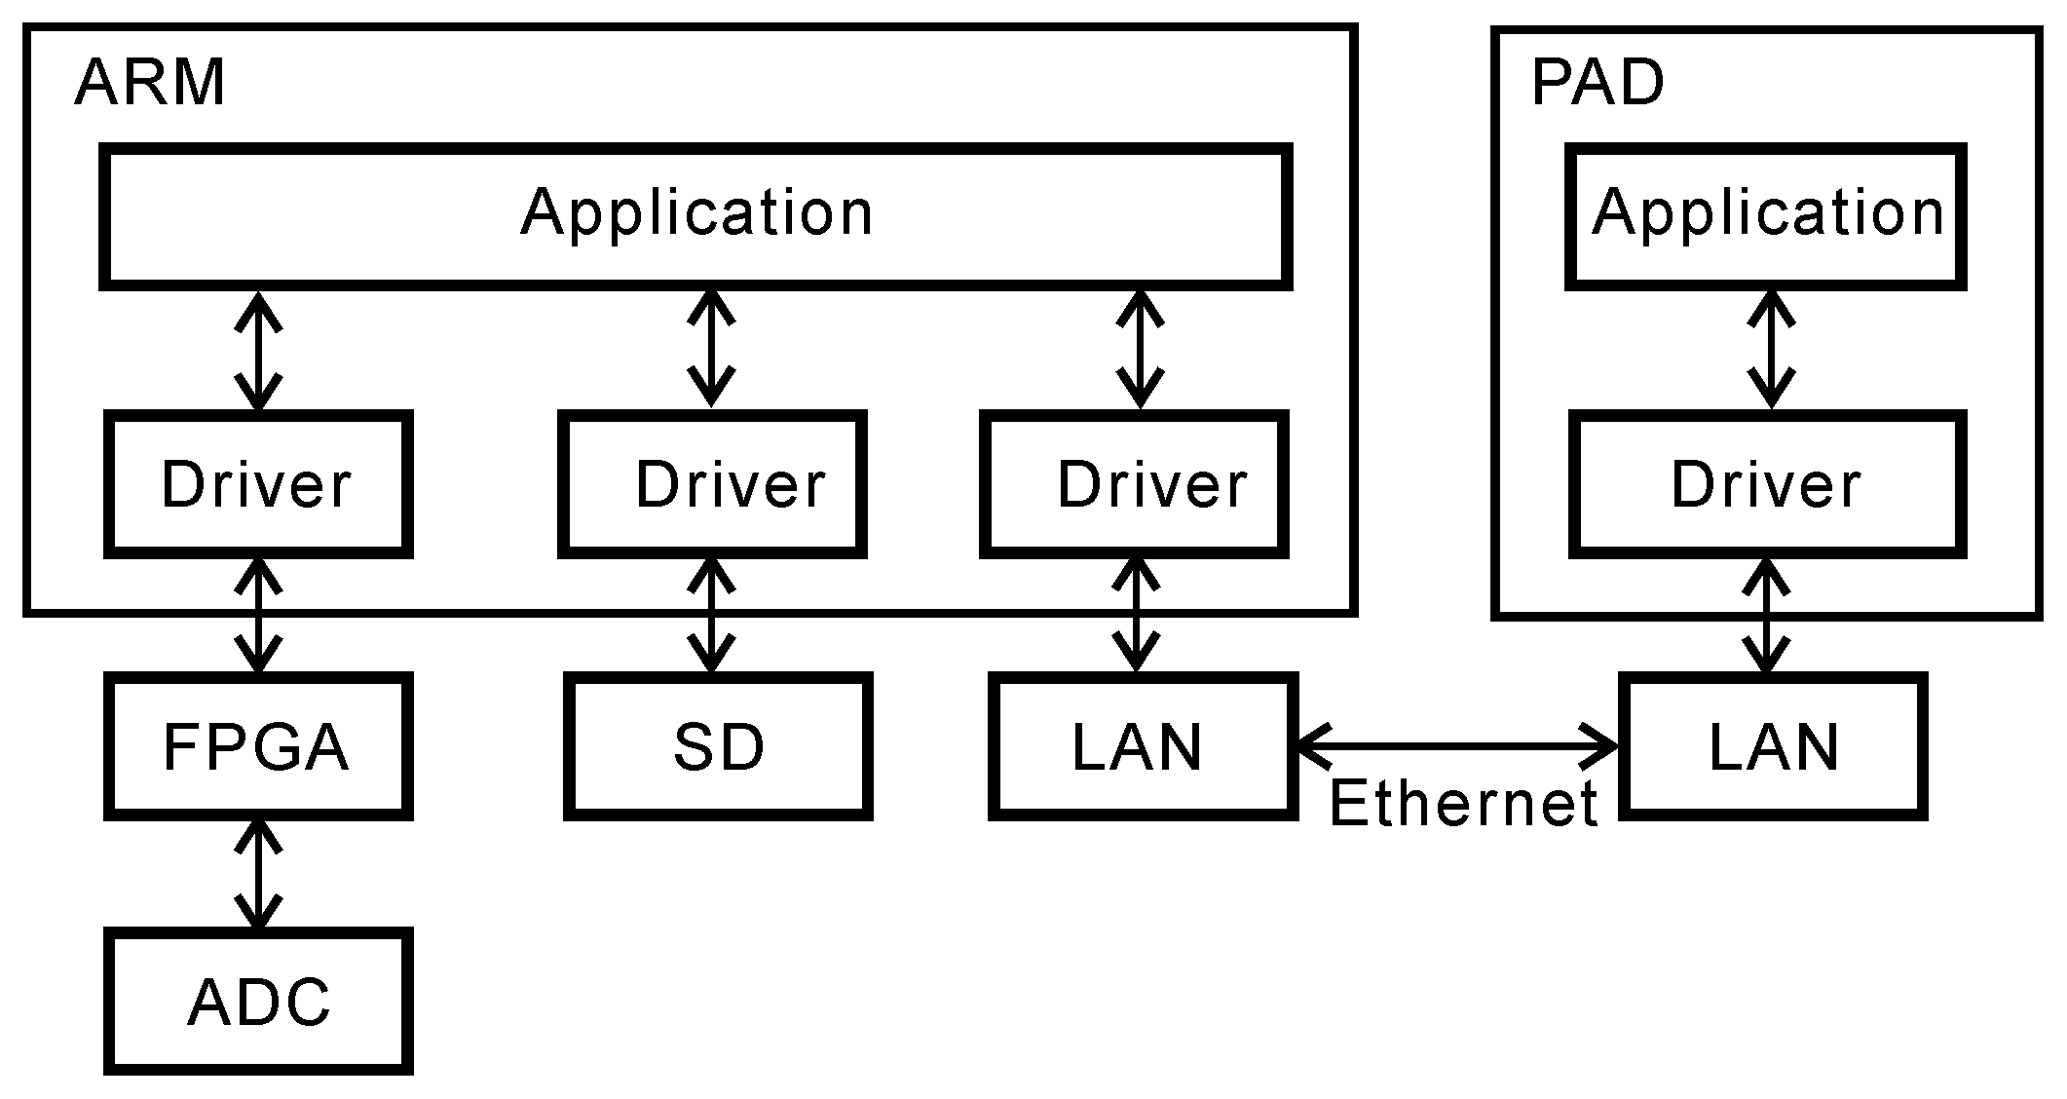
The current files are saved in binary mode in order to save disk space due to the high sampling rate. For high-throughput data transfer and local file saving, the current acquisition application is installed on the ARM-Linux platform using the high-efficiency user application software on PAD, fast ethernet, and high-class SD card. The Linux driver used for data acquisition depends on the ping-pong principle, which is designed for data block transfer between kernel and application and DMA hardware, to save data to the SD card with a high-throughput data rate and no missing data.
The above software and hardware platform has been verified with a four-channel 24 kHz sample rate continuous data acquisition and the data throughput rate reached 388 KBps. The high data throughput rate principle ensured sufficient data throughput rate for the current recorder.
3.1 Laboratory test
Laboratory tests were conducted for time sync error, input range, self-noise level, dynamic range, and bandwidth specification. The following method was used to measure the noise level of the current probe and the data acquisition unit. First, the input of the data acquisition unit was shorted, and the noise time series was recorded to determine the self-noise power spectrum density of the data acquisition unit channel. Second, with the current probe placed on a magnetic shield barrel, the sensitivity of the current probe was set to 100 mV A−1, and the data acquisition unit sample rate was set to 24 kHz; we calculated the noise power spectrum density. As shown in Fig. 6, the current noise power spectrum density of the channel and probe was approximately 10 µA/rt (Hz) at 10 Hz. The dynamic range was approximately 97 dB with 10 kHz bandwidth.

Figure 6Current noise power spectrum density of the current probe and data acquisition unit obtained on a magnetic shield barrel.
The data acquisition integrated 24 bits ADC, and the dynamic range reached 100 dB with 10 kHz band width. The bandwidth of the A622 current probe reached 100 kHz, and with bandwidth of the data acquisition set as DC to 10 kHz, the sample rate was set to 24 kHz. The maximum transmission current of the high-power transmission system studied by the research group can reach 60 A, whereas the input range of the current probe was set to 100 A.
3.2 Field experiment
To evaluate the performance of the full waveform current recorder in field conditions, we conducted field ore exploration experiments on Linxi county, which is in northern China. A total of 15 EMR6 EM receivers (Chen et al., 2017) and two EMT48 multifunction transmitters (Wang et al., 2018) were deployed for the field work. The EM receivers and transmitters were set as multifunction to support many electrical prospecting methods, such as TDIP, SIP, CSAMT, and PRS mode data acquisition.
As the most advanced controlled current source available for electrical prospecting exploration, the EMT48 incorporates many of the features of the new ground-breaking technology developed in 2016 for a 48 kW chopper unit. The chopper module is a compact portable system, combining substantial power output with great reliability, flexibility, and user-friendly operation.
For the CSAMT mode, the circular frequency list is from 9600 to 0.9375 Hz, lasting 50 min. The circular frequency list contains 41 frequency points, with the duration of each frequency point set between 40 and 300 s against the frequency variable. The distance between the transmitter and the receiver is approximately 6 km. The transmitter dipole length is 1300 m, and the contacted ground resistance is approximately 30Ω. When the transmitter voltage is set to 900 V and the transmitter output frequency is set to 120 Hz, the output current reaches 30 A at peak. While the transmitter is operational, the current recorder measures the current continuously. Figure 7a shows the raw time series measurements, which last approximately 20 min in a circular list, whereas Fig. 7b shows the frequency stack result. The transmitter circular list cycles from high frequency to low frequency, and the amplitude of the current is low in the high-frequency band due to resistance induced by the cable length. The minimum current is as low as 2 A and the maximum current is approximately 30 A. In the low-frequency band, the main source of ground resistance is the Earth resistance, whereas the induced resistance from the cable length is negligible. The corner frequency is approximately 2000 Hz. The time–frequency spectrum (Marple Jr., 2002) result shows the current frequency variable with time, and the colour bar indicates the current amplitude variable with frequency. Figure 7c shows the full spectrum of each frequency waveform time series from 300 to 0.09375 Hz. The amplitude of the high band frequency is lower than that of the low band frequency, and the duration is shorter than the low band frequency. The harmonic of the fundamental frequency is obvious due to the square waveform.
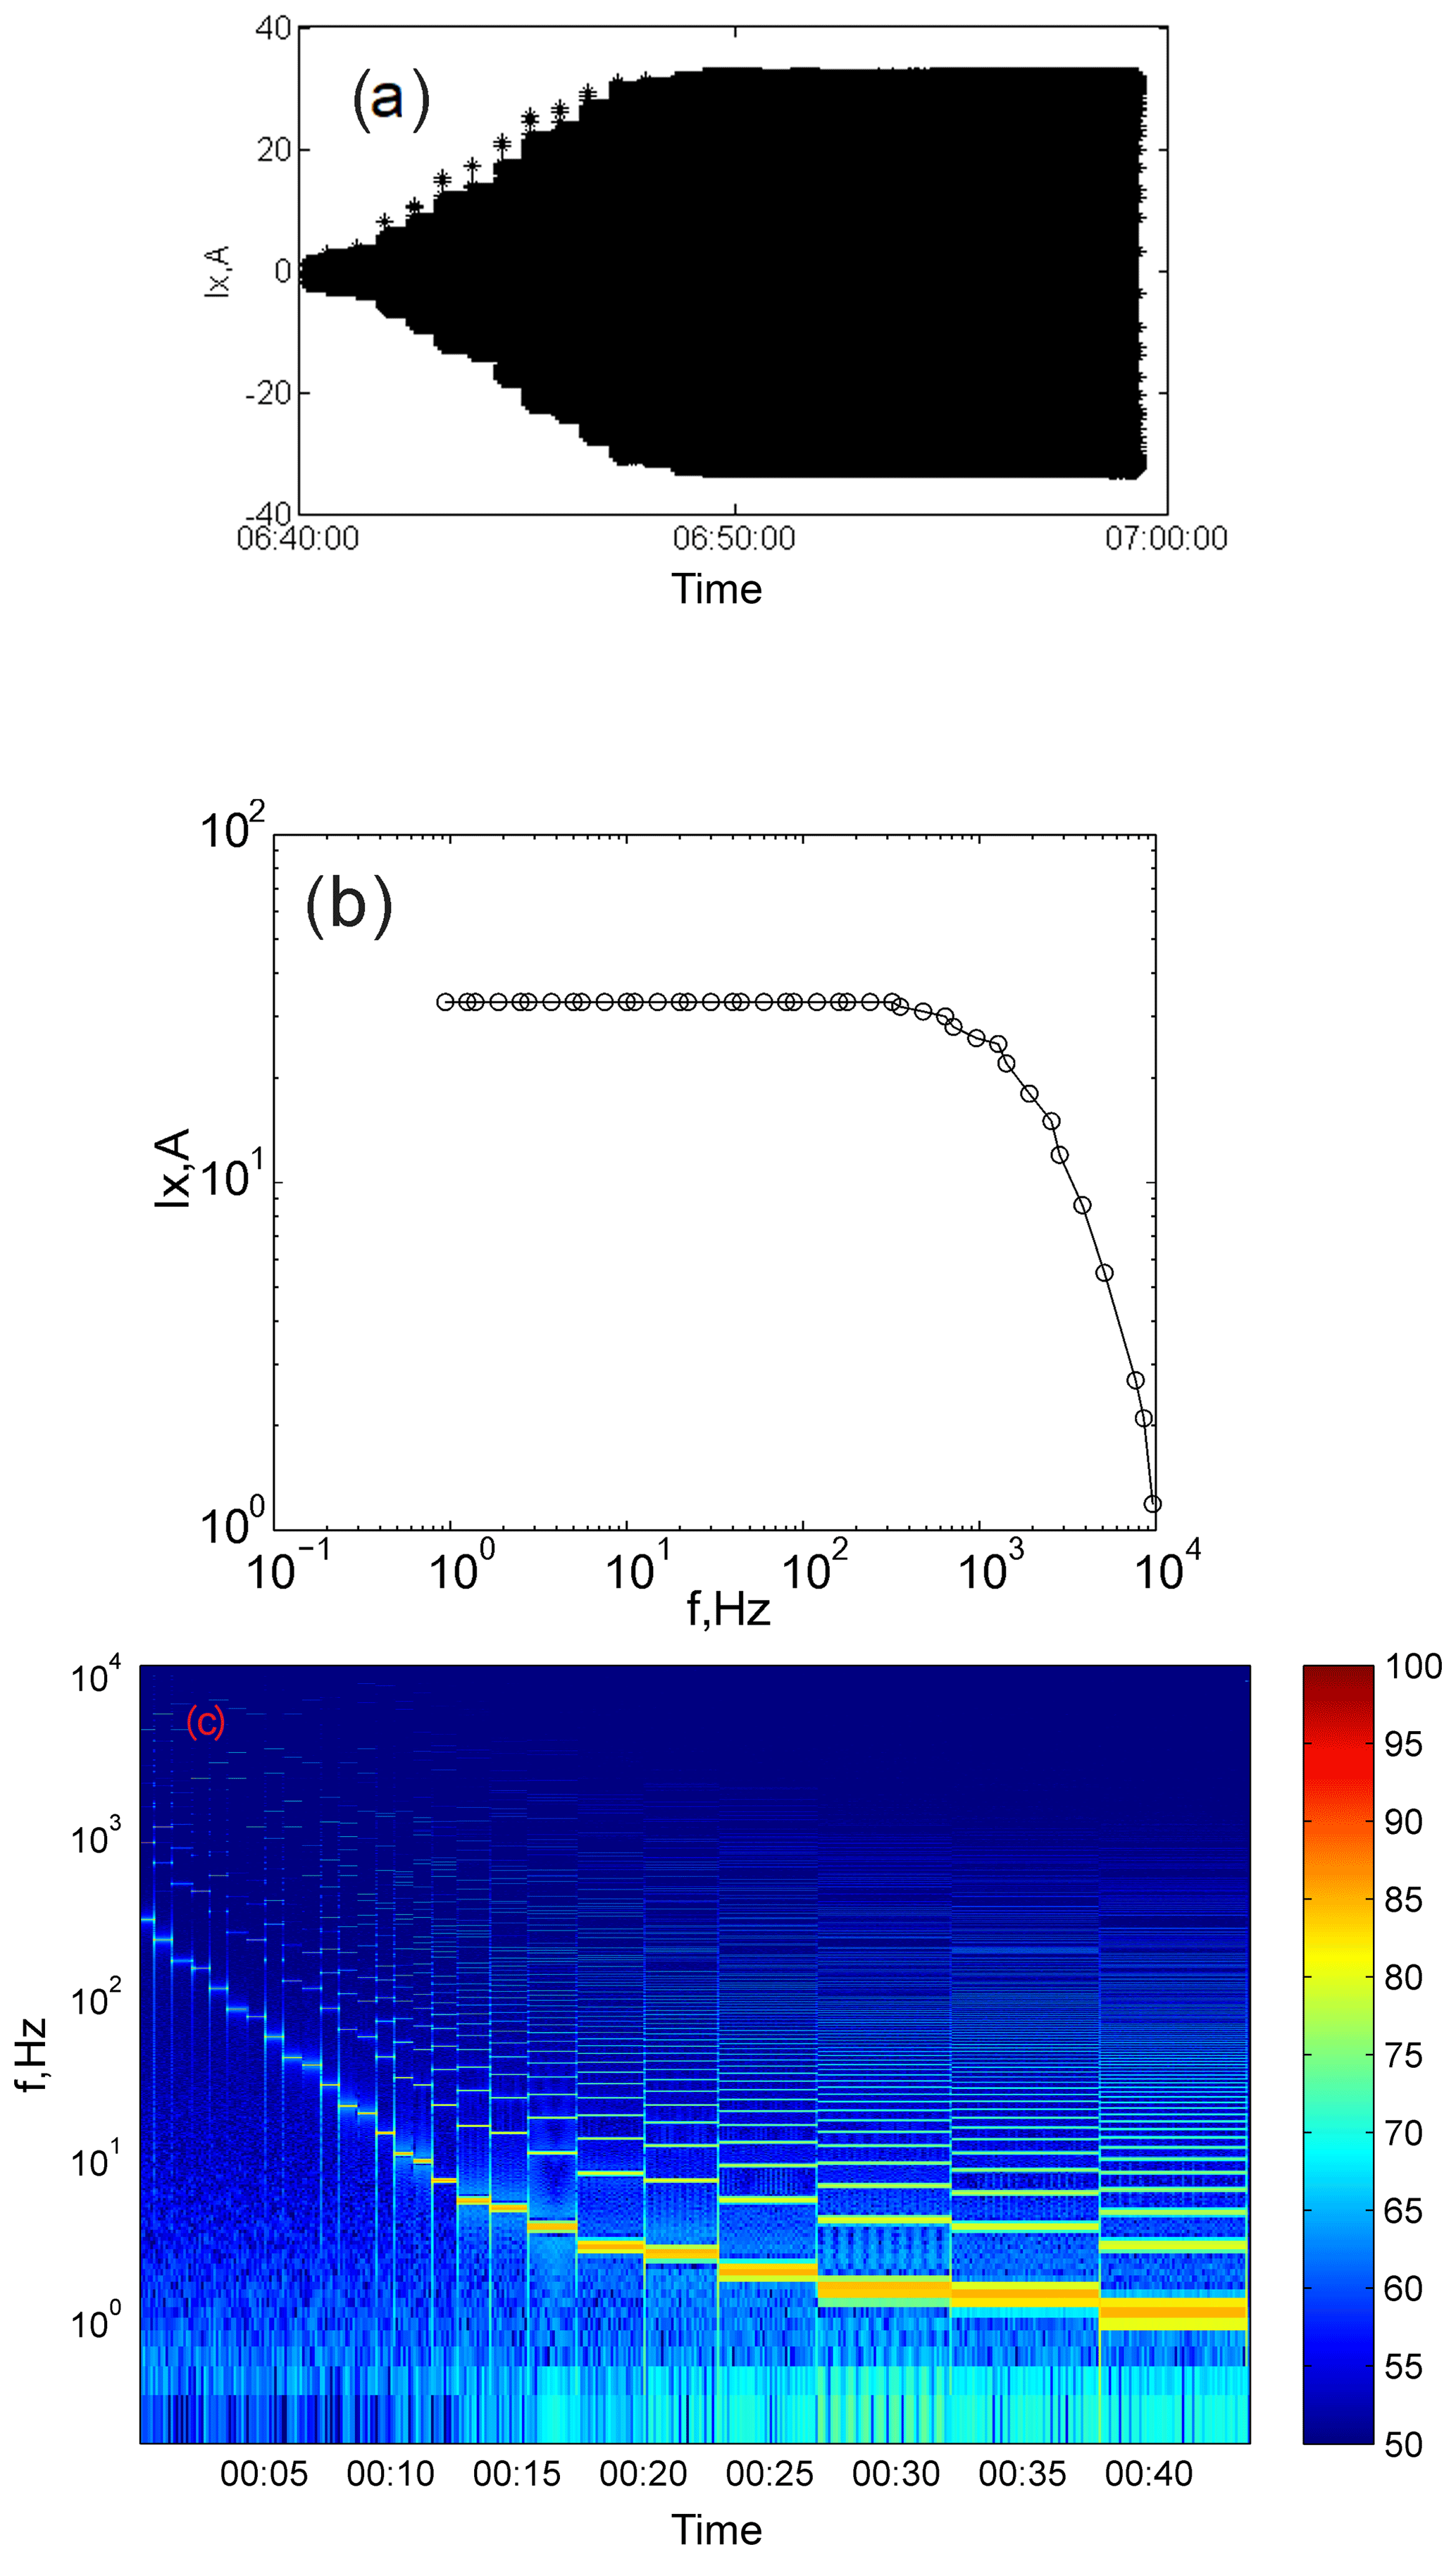
Figure 7(a) Current time series as one complete cycle (CSAMT mode, duration 50 min, 9600 to 0.9375 Hz, 2 to 30 Ap); (b) frequency stack result; and (c) time–frequency spectrum (CSAMT mode).
In SIP method mode, the circular frequency list duration is 15 min, ranging from 128 to 1∕16 Hz. It contains 12 frequency points, and each frequency point duration ranges from 50 to 270 s. The length of the transmitter dipole is 25 m, and the distance between the transmitter and the receiver is 75 m. The SNR and total E field are large due to the short distance between the transmitter and the receiver; thus, the current amplitude is set to 2 A peak. While the transmitter is working, the current recorder acquires data continuously. Figure 8a shows the raw current time series and time–frequency spectrum. During the circulation frequency list, the amplitude of the current is almost constant at approximately 2 A. Figure 8b shows the time–frequency spectrum of the output current. The result shows the frequency step schedule from 128 to 1 Hz.
Table 4Performance comparison with commercial current recorder from Phoenix Geophysics.

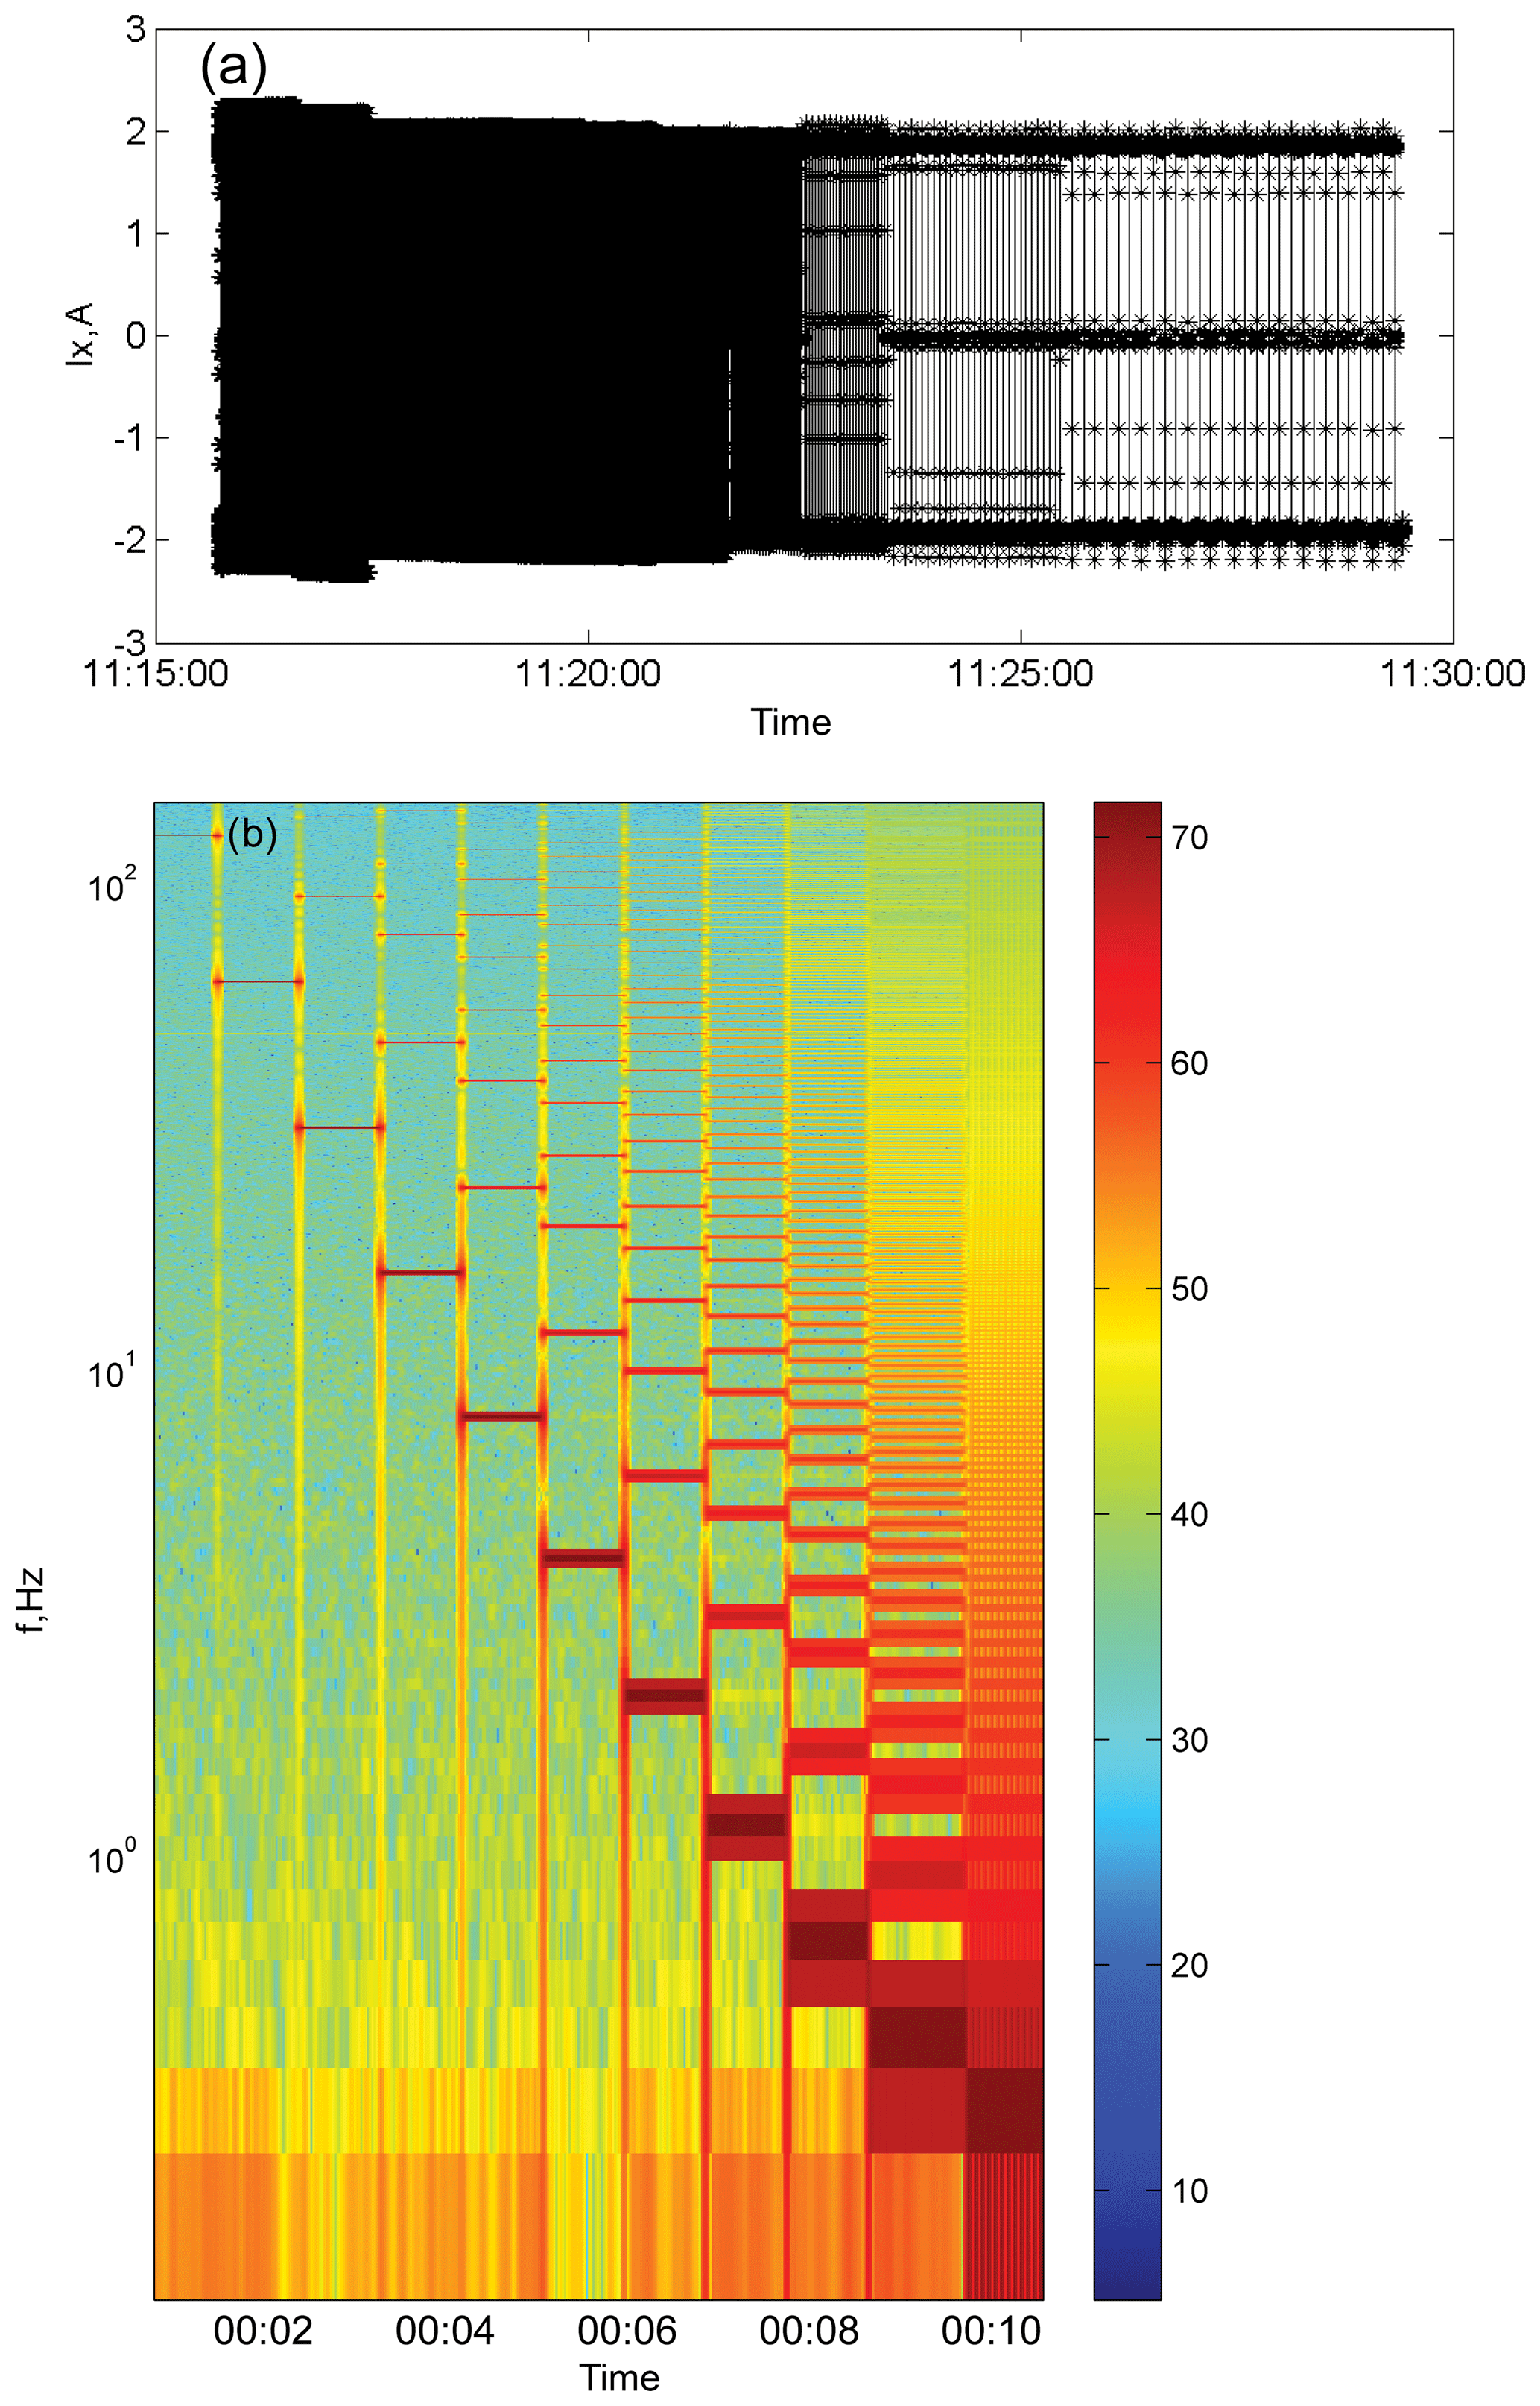
Figure 8(a) Raw current time series with whole circulation (15 min) and (b) time–frequency spectrum (SIP mode).
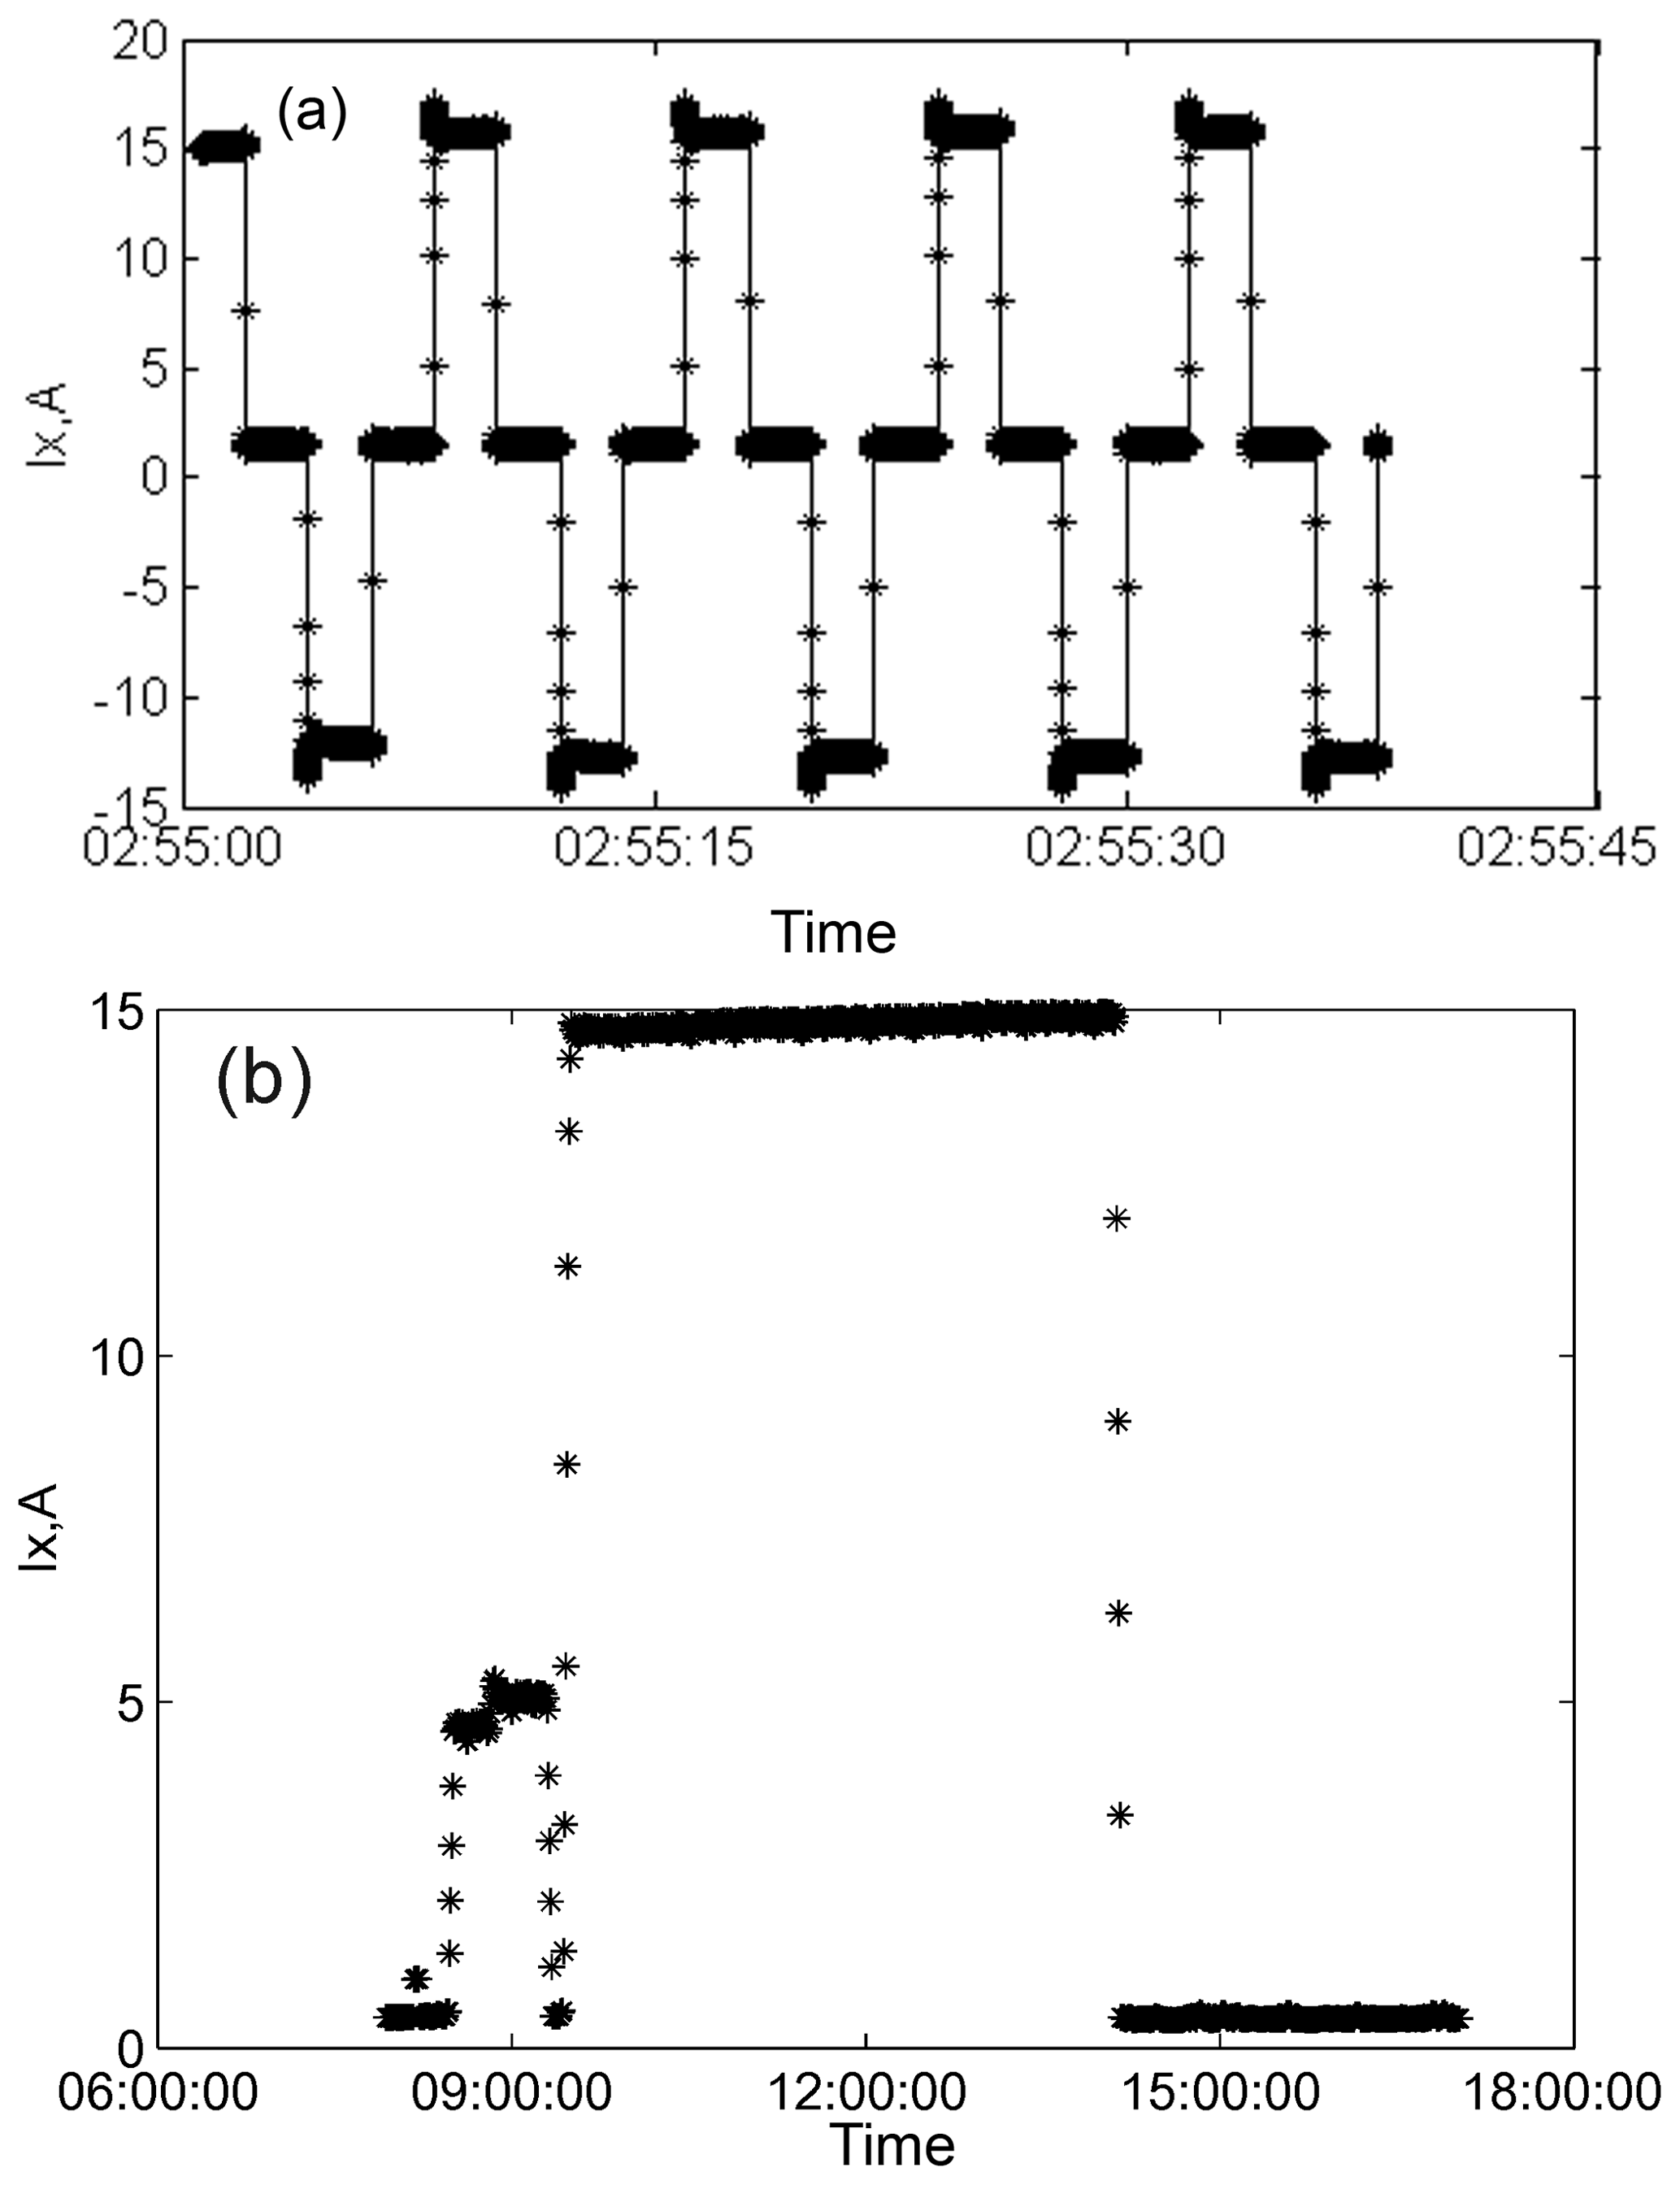
In the TDIP mode, a positive zero negative zero (PZNZ) waveform was generated by the transmitter. The source dipole length is 1600 m, and the amplitude current is approximately 15 A peak. The pulse width lasted 4 s, and the entire period lasted 16 s. Figure 9a shows the current amplitude variable in a working day lasting 8 h. The transmitter started at 08:40 LT, and from 08:40 to 09:10 LT, the current was approximately 5 A for status verification of the transmitter operation. After the operational status verification procedure, the current was increased to 15 A until 09:20 LT, stopping at 14:00 LT. During these 5 h, the amplitude increased from 14.5 to 15 A due to decrease in ground contact resistance.
From the results of the above experiment, Table 4 presents a comparison of the specifications of the developed full waveform recorder and Phoenix Geophysics transmitter control unit (TMR-RXU), which integrated the current measurement function. The developed full waveform recorder is a better data logger for multifunction EM transmitter for electrical prospecting applications.
The performance of existing current recorder is inadequate with regard to advanced electrical prospecting requirements for full waveform continuous acquisition. The newly developed full waveform current recorder presented in this paper was found to be useful for multifunction EM transmitters for electrical prospecting. Field experimental results show that the full waveform recorder can autonomously measure current in field conditions. The raw current time series shows details of the transmitter output current waveform, providing high-precision amplitude and phase information for data postprocessing. The continuous series was recorded for calculation as a stack. In the TDIP mode, low variation of the current amplitude is shown. In the CSAMT mode, the time–frequency spectrum result shows the current amplitude decreasing as the frequency increases. The waveform current recorder has additional advantages of ease of use and low power consumption.
In future research, high-power voltage information from the output of the chopper module will be measured similarly to the current information using a galvanic isolated voltage attenuator. The channel and storage space has been reserved, and effective data throughput technology is available.
The raw data of the field experiment are available upon request (ck@cugb.edu.cn).
KC developed the required hardware and software. SJ carried out the overall design and conducted the experiment.
The authors declare that they have no conflict of interest.
We are thankful for the data processing from Gaofeng Ye. We would also like to thank Wang Zhongxing and two anonymous referees.
This research has been supported by the National High Technology Research and Development Program of China (grant nos. 2014AA06A603, 2016YFC0303100, and 2017YFF0105700) and the National Science Foundation of China (grant nos. 61531001, 41804071).
This paper was edited by Luis Vazquez and reviewed by Wang Zhongxing and two anonymous referees.
Boerner, D. E., Kurtz, R. D., and Jones, A. G.: Orthogonality in CSAMT and MT measurements, Geophysics, 58, 924–934, 1993a.
Boerner, D. E., Wright, J. A., Thurlow, J. G., and Reed, L. E.: Tensor CSAMT studies at the Buchans Mine in central Newfoundland, Geophysics, 58, 12–19, 1993b.
Cagniard, L.: Basic theory of the magneto-telluric method of geophysical prospecting, Geophysics, 18, 605–635, 1953.
Chen, K., Jin, S., and Wang, S.: Electromagnetic receiver with capacitive electrodes and triaxial induction coil for tunnel exploration, Earth Planets Space, 69, 123 https://doi.org/10.1186/s40623-017-0706-3, 2017.
Constable, S. C.: Review paper: Instrumentation for marine magnetotelluric and controlled source electromagnetic sounding, Geophys. Prospect., 61, 505–532, https://doi.org/10.1111/j.1365-2478.2012.01117.x, 2013.
Di, Q., Xue, G., Lei, D., Wang, Z., Zhang, Y., Wang, S., and Zhang, Q.: Geophysical survey over molybdenum mines using the newly developed M-TEM system, J. Appl. Geophys., 158, 65–70, https://doi.org/10.1016/j.jappgeo.2018.07.008, 2018.
Di, Q. Y., Fu, C. M., An, Z. G., Xu, C., Wang, Y. L., and Wang, Z. X.: Field testing of the surface electromagnetic prospecting system, Appl. Geophys., 14, 449–458, 2017.
Fiandaca, G., Auken, E., Christiansen, A. V., and Legaz, A.: Time-domain-induced polarization: Full-decay forward modeling and 1D laterally constrained inversion of Cole-Cole parameters, Geophysics, 77, E213, https://doi.org/10.1190/geo2011-0217.1, 2012.
IRIS: I-FullWaver 2018, available at: http://www.iris-instruments.com/i-fullwaver.html, last access: 1 June 2018.
Marple Jr., S. L.: Computing the discrete-time “analytic” signal via FFT, IEEE T. Signal Proces., 47, 2600–2603, 2002.
Monteiro Santos, F. A. and Elkaliouby, H. M.: Quasi-2D inversion of DCR and TDEM data for shallow investigations, Geophysics, 76, F239–F250, 2011.
Phoenix Geophysics: V8 RECEIVER 2018, available at: http://www.phoenix-geophysics.com/products/receivers/v8, last access: 1 June 2018.
Prasad, T. R., Ramayya, B. D., and Rao, Y. P.: A process and device for measurement of spectral induced polarization response using Pseudo Random Binary Sequence (PRBS) current source, U.S. Patent, 2002.
Tektronix: A621&A622 current probe 2018, available at: https://www.tek.com.cn/datasheet/a621-a622-current-probes-datasheet, last access: 1 June 2018.
Vanhala, H.: Mapping oil-contaminated sand and till with the spectral induced polarization (SIP) method, Geophys. Prospect., 45, 303–326, 2010.
Wang, M., Jin, S., Deng, M., Wei, W., and Chen, K.: Multi-function electromagnetic transmitting system for mineral exploration, IEEE T. Power Electron., 33, 8288–8297, 2018.
Zhang, X., Zhang, Q., Wang, M., Kong, Q., Zhang, S., He, R., Liu, S., Li, S., and Yuan, Z.: Development of a full-waveform voltage and current recording device for multichannel transient electromagnetic transmitters, Geosci. Instrum. Method. Data Syst., 6, 495–503, https://doi.org/10.5194/gi-6-495-2017, 2017.
Ziolkowski, A., Parr, R., Wright, D., Nockles, V., Limond, C., Morris, E., and Linfoot, J.: Multi-transient electromagnetic repeatability experiment over the North Sea Harding field & Dagger, Geophys. Prospect., 58, 1159–1176, 2010.