the Creative Commons Attribution 4.0 License.
the Creative Commons Attribution 4.0 License.
 | 30 Jan 2019
The operator difference in absolute geomagnetic measurements
Yufei He
Jianjun Wang
Fuxi Yang
Xijing Li
Changjiang Xin
Wansheng Yan
Wentong Tian
Absolute geomagnetic measurement is very important at geomagnetic observatories. It plays a decisive role in data quality control and instrument calibration. As absolute geomagnetic measurements from modern fluxgate theodolite instruments have high precision, usually within 1 arcsec, the measurement results are susceptible to external factors. The operator difference is one of these factors and has become an important consideration that can not be ignored with respect to measurement results. Therefore, an experiment was designed in order to estimate the operator difference. Six fluxgate theodolites were used and six observers who were proficient in absolute measurements were invited to participate. The observers took turns making absolute geomagnetic measurements, and the operator difference between the observers for each instrument was computed by comparing baseline values using statistical methods.
- Article
(2822 KB) - Full-text XML
- BibTeX
- EndNote


The geomagnetic field is an intrinsic characteristic of the Earth, and it is a vector which has a direction as well as size. To determine a vector field, at least three independent elements are required,. These elements are different in different coordinates: they may be expressed by X (north component), Y (eastern component) and Z (vertical component) in Cartesian coordinates; described by H (horizontal component), D (declination) and Z in cylindrical coordinates; or represented by D, I (inclination) and F (total field) in spherical coordinates. Nowadays, D, I and F are extensively adopted in most geomagnetic observatories around the world (Bitterly et al., 1984; Jankowski et al., 1996).
Usually, a set of at least three major instruments is used to measure the geomagnetic field at most observatories: a variometer, an absolute scalar magnetometer and a fluxgate theodolite (Gonsette et al., 2017a). The variometer can record the continuous variations of the geomagnetic field components; as the variometer usually works as a near-zero sensor, the recording is not an absolute value but a relative value, and its measurement range is usually within ±3000 nT, although it may be as great as ±4000 nT at high latitudes (Jankowski et al., 1996). Therefore, to obtain the continuous absolute geomagnetic field components of tens of thousands of nanotesla, a reference value or “baseline” should be added to these relative values. When calculating the baseline, the absolute values of the geomagnetic field components are required. The absolute scalar magnetometer can record the intensity of the geomagnetic field, but the direction of the geomagnetic field relative to the geographic north is still unknown and can not be determined by the variometer or the magnetometer. Therefore, the fluxgate theodolite is introduced to measure the direction of the geomagnetic field, including the magnetic declination (D) and the inclination (I). The unique absolute vector geomagnetic field can then be determined using F, D and I, and the baselines of each of the components of the variometer can be calculated. The process of measuring the absolute vector geomagnetic field is called “absolute measurement”.
The baseline value is calculated using the absolute measurement result. This means that the absolute measurements play a decisive role in the quality of the continuous absolute value of the geomagnetic field. As variometers are rather stable and have a high precision, the baseline should be a constant value; however, it may suffer some slight changes, which can be caused by changes in environment, error associated with setting the orientation, the scale factor nonlinearity or the non-orthogonality of variometers, or the instability of the observation pillars (Zhang and Yang, 2011). Therefore, absolute measurements of a certain frequency are necessary. Twice a week is practice in most Chinese geomagnetic observatories, as it is a better way to monitor the changes and control data quality (Li et al., 2012).
Currently, the absolute scalar magnetometer and the fluxgate theodolite are extensively accepted as the pair of absolute measurement instruments present at most observatories. The proton magnetometer or Overhauser magnetometer is usually used for intensity measurements, while the fluxgate theodolite is used for declination and inclination measurements. As the declination and inclination are measured manually, some artificial observation errors are unavoidable during the measurement process which will affect the final results. Sometimes, there is more than one observer working in an observatory, and the observers take turns making absolute geomagnetic measurements. In these cases, there would be more artificial observation errors involved, and the influence on the final results may become stronger. In this study, we only concern ourselves with the differences between observers and estimate their influence on the final results.
As guaranteeing data quality is important for scientific research, it is useful work to accurately evaluate these errors (Zhang et al., 2016). This study will also be of great help with respect to understanding the impact of these errors on the final observation results, the quality control of observation data, and their performance in the research results. Proton magnetometer technology is very advanced, meaning that there is almost no operator influence on the total field measurements. Therefore, only the artificial observation errors in the absolute geomagnetic measurements are analyzed here.
There are many errors in absolute geomagnetic measurements, for example index error, horizontal-axis error, collimation error, positioning errors, the artificial observation error and so on (Newitt et al., 1996). Some of these errors are instrumental errors, and some are artificial observation errors. Most of the instrumental errors can be eliminated by choosing a specific measurement procedure, but the artificial observation errors are difficult to remove (Deng et al., 2010). This is due to the fact that they may be caused by magnetic objects (e.g., magnetic parts of clothing), they may come from the observer's observation method or skill, they may arise from the observer's minimum resolution (with respect to physiology or reading error) and so on. In short, these errors are uncertain and difficult to estimate. This is especially true of an observatory where the absolute geomagnetic measurements are made by more than one observer, as the artificial observation errors will become more complex. In this paper, the difference between the observation results, measured by two observers with the same instrument, is defined as the “operator difference”. It is not a constant value, so it is hard to estimate.
It is common knowledge that, to promote high quality data in geomagnetic observation, the IAGA (International Association of Geomagnetism and Aeronomy) Division V Working Group organizes the international comparison sessions every 2 years. During one of these sessions, the fluxgate theodolites from different countries were compared by making absolute measurements at an observatory. The difference between the instruments used (instrument difference) can be computed by comparing the baselines. If the absolute measurements are made on different pillars, the baseline can be corrected to the reference pillar by adding a pillar difference. Therefore, the operator difference, the azimuth error caused by inexact positioning (position error), and even the error of pillar difference (pillar error) are included in the instrument difference.
In order to estimate the operator difference, the position error and the pillar error should be excluded. For this purpose, an observation experiment was designed. Six fluxgate theodolites were used and six skilful observers from different geomagnetic observatories were invited to participate (to ensure enough observation samples). The fluxgate theodolites were then installed in the correct position on the respective observation pillars, and were not moved during the experiment (to eliminate the position error). Finally, the observers took turns making absolute geomagnetic measurements. After completing the measurements, the baseline values measured by the same instrument were calculated one by one. The operator difference between the observers for each instrument was then computed by comparing the baseline values. The equation for computing the baseline value for the arbitrary component W is given in the INTERMAGNET reference manual (St-Louis, 2011):
Here, (i:j) is the time interval (generally several minutes) for the measurement; (k) is the kth time, which is the average time of the interval (i:j); WO is the observed absolute field value; WR is the minute value recorded by a variometer; and WB is the computed baseline value.
The measurement procedure used in the observation experiment is similar to that of the international comparison. However, the difference is that the observation experiment is only concerned with the differences between observers. Only the difference between the baselines, determined using the same instruments but different observers, were calculated. The difference between the baselines, determined by different instruments and different (or identical) observers, was not used here (to eliminate pillar error and the systematic differences of instruments). Therefore, the position error and the pillar error are not involved in the operator difference; this is the difference between this observation experiment and the traditional comparison.
In the process of the operator difference calculation, sets of baseline values, determined by the same fluxgate theodolite and same observer on the same day, were averaged. The operator differences were then calculated by comparing these average values. As we only focus on the magnitude of the operator difference rather than the sign, we take the absolute values of the operator differences. The general form of the equation for computing the operator difference for the arbitrary component “W” is shown below:
Here, n is the pillar number, p and q represent different respective observers, WB is the computed set of baseline values, is the average of a set of baselines and ΔWBpq is the operator difference between two observers.
Finally, all of the observer differences were collated and analyzed using statistical methods. In this way, the observer difference in the absolute geomagnetic measurements can be estimated. The Zeiss 010B fluxgate theodolite instruments used in this experiment have a precision of 1 arcsec. The measurement procedure followed the guide published by IAGA (Newitt et al., 1996). The experimental results are displayed in Sect. 3.
The experiment was carried out in an absolute measurement house at Lanzhou Observatory; it was performed on quiet solar day when the geomagnetic field varied slowly. This provided excellent conditions for the experiment. Theoretically, the daily variation of the geomagnetic field has no effect on baseline values. However, in practice, there may be some slight changes due to setup error, possible orientation issues or scale factor (Gonsette et al., 2017a). Therefore, sets of absolute measurements were made early in the morning and late in the evening to avoid the potential impact of the principal part of the daily variation. The fluxgate theodolites were installed in the correct position on the observer pillars, and they were not moved during the experiment. The azimuth error of the reference marker caused by inexact positioning can be excluded. Observers were carefully checked for magnetic objects or magnetic parts of clothing before measurement began, so that the influence of magnetic contamination could be removed.
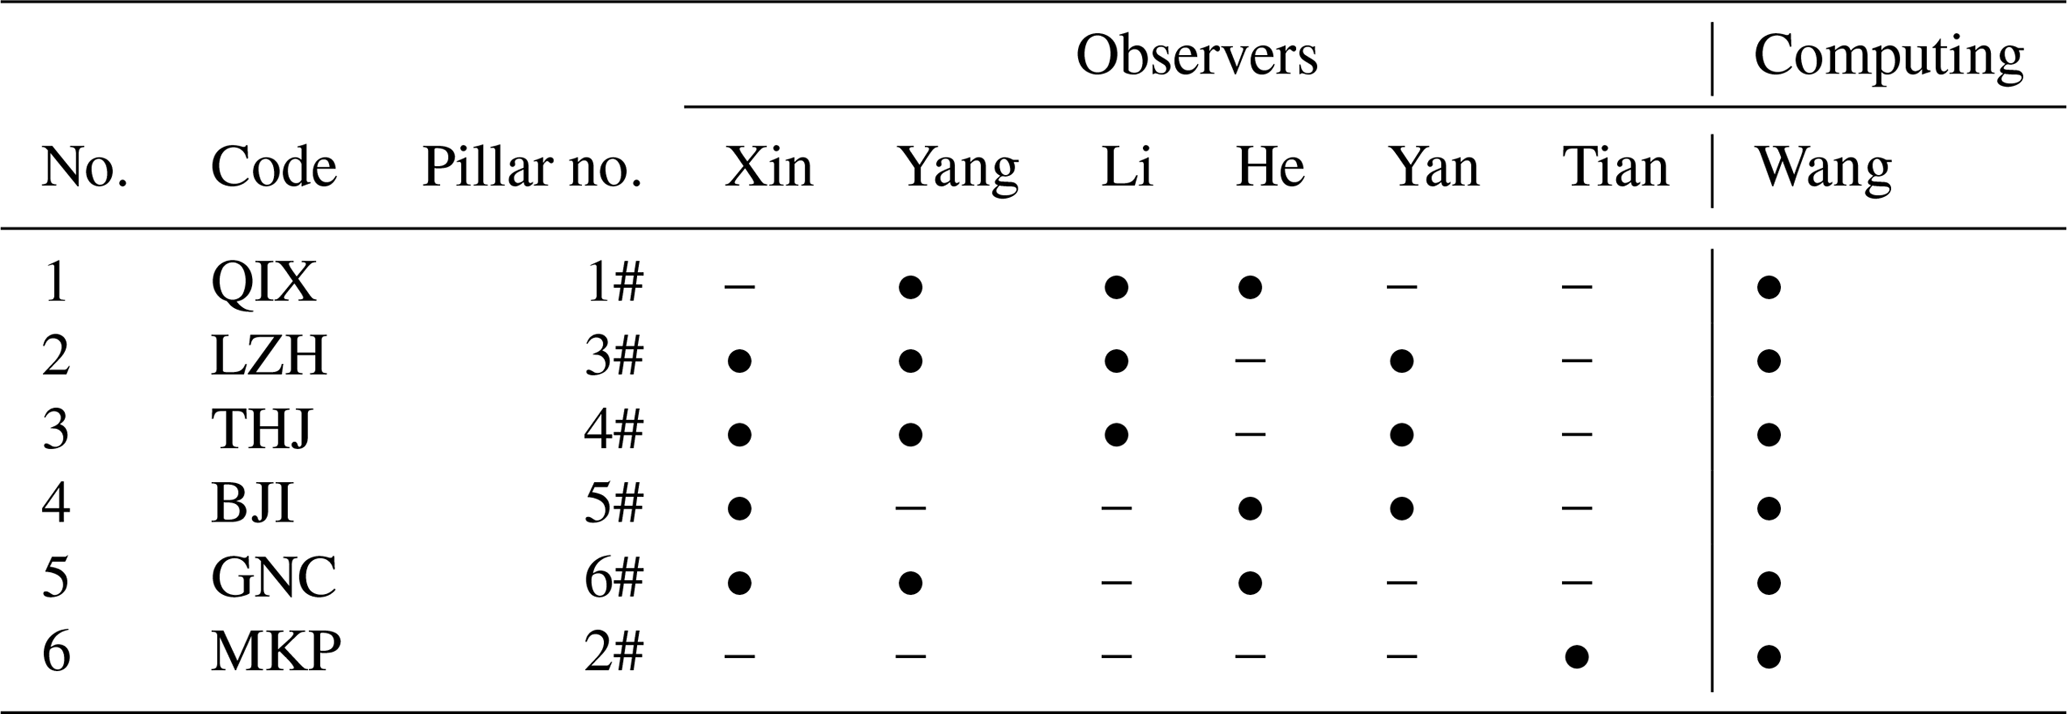
The layout of the absolute measurement house is displayed in Fig. 1. The six fluxgate theodolites were fixed on the respective observation pillars. The observers took turns operating them. The fluxgate theodolite code, the pillar number and the observer order are listed in Table 1. The black dots represent that the observer made an absolute measurement with the instrument, while the short lines indicate that no operation was undertaken.
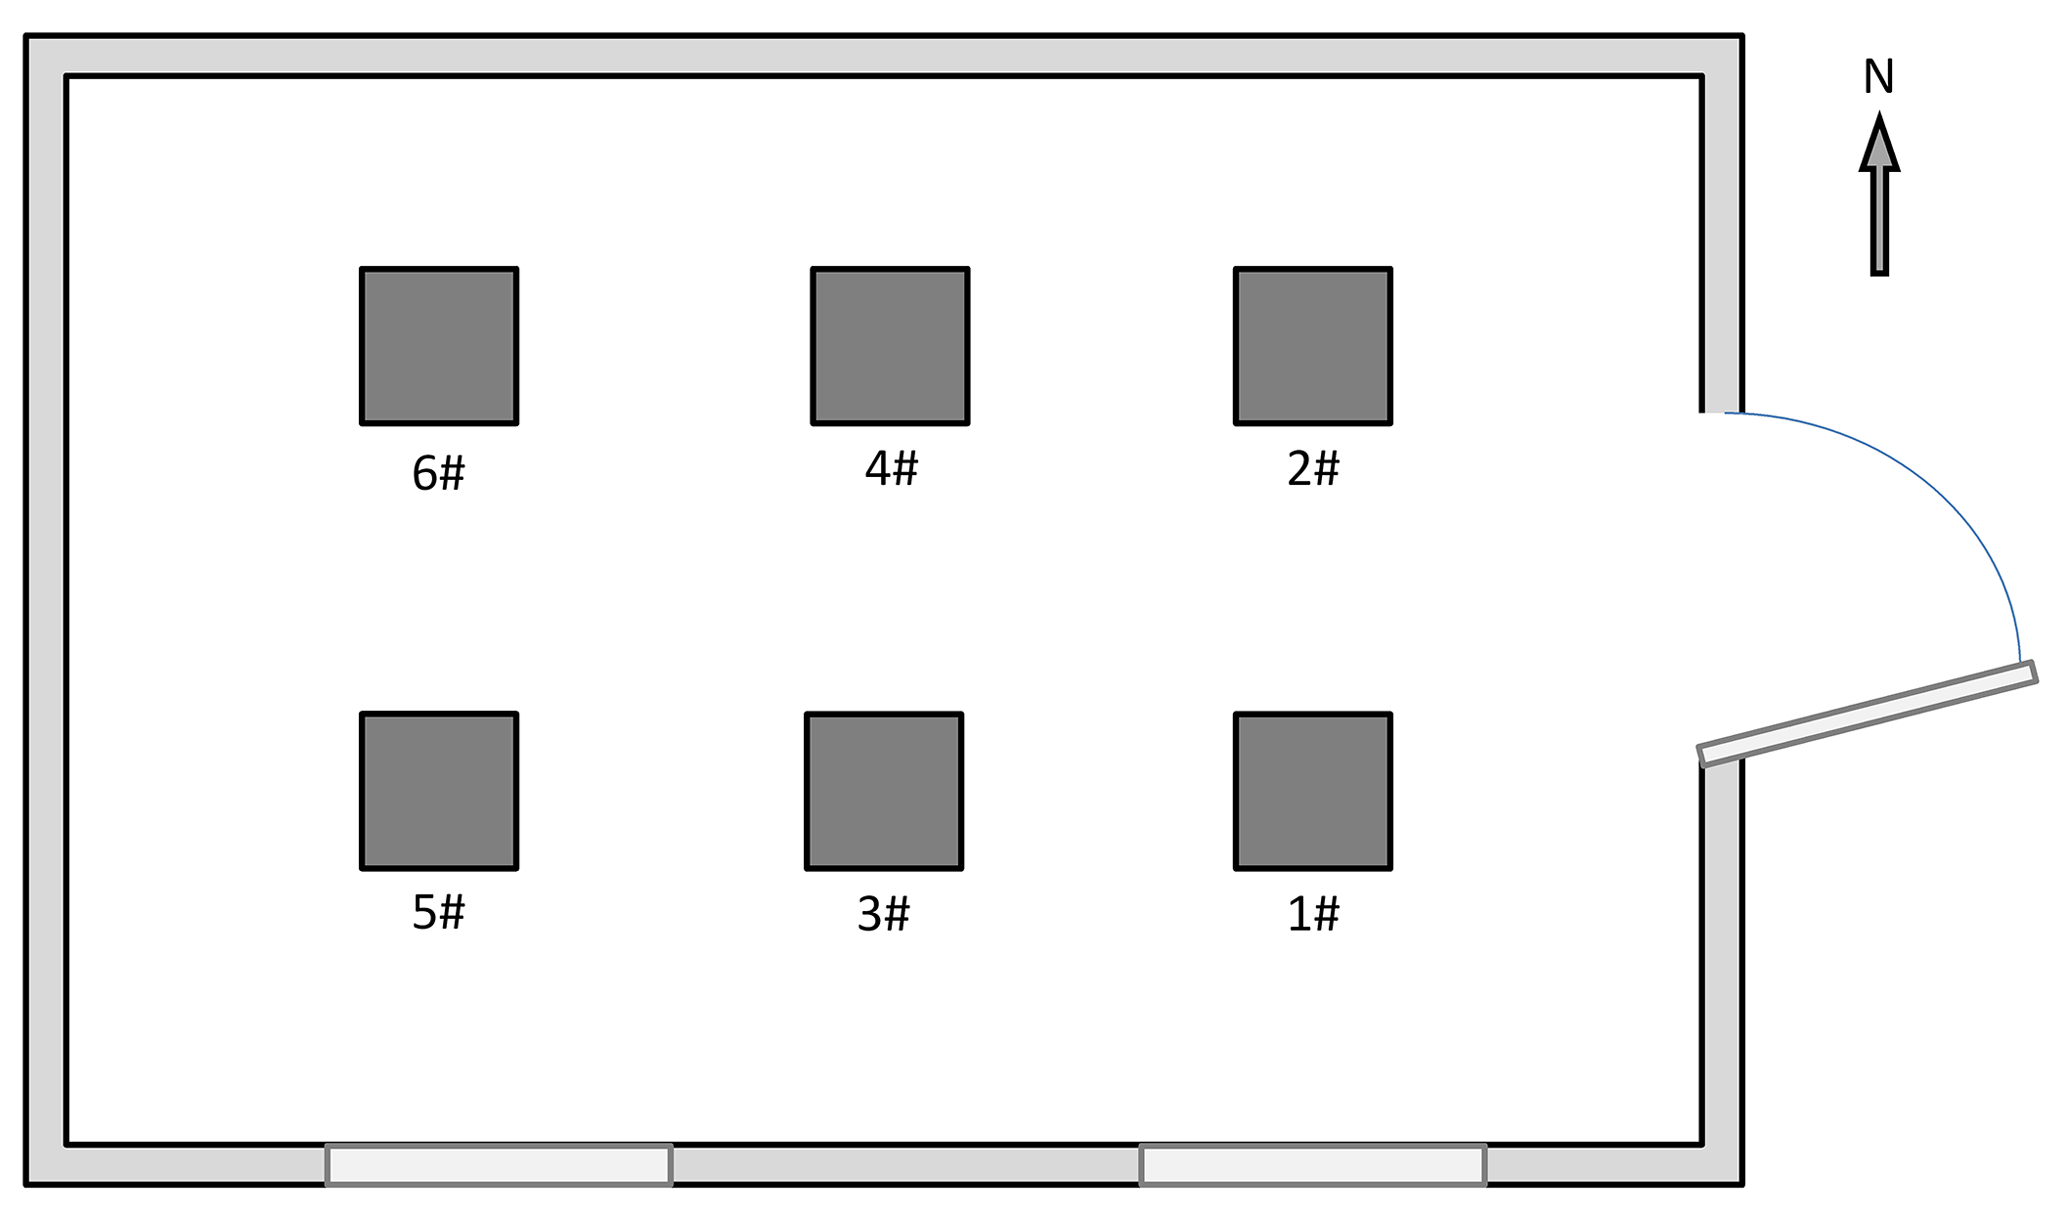
Table 1The code and position of the fluxgate theodolites and the observer order.
The baselines determined by each fluxgate theodolite and by each observer were calculated following Eq. (1). All of the declination and inclination baselines are shown in Figs. 2 and 3, respectively. The different symbols (or colors) represent different observers, while different line styles represent that the same observer made absolute measurements on different observation dates. The baselines for each instrument were separately plotted in different panels, meaning that there are five panels for each figure. As shown in the two figures, each observer made several sets of measurements on the same day. These baselines were rather stable, except for large individual values. This means that the absolute measurement results in this experiment display a high observation quality.
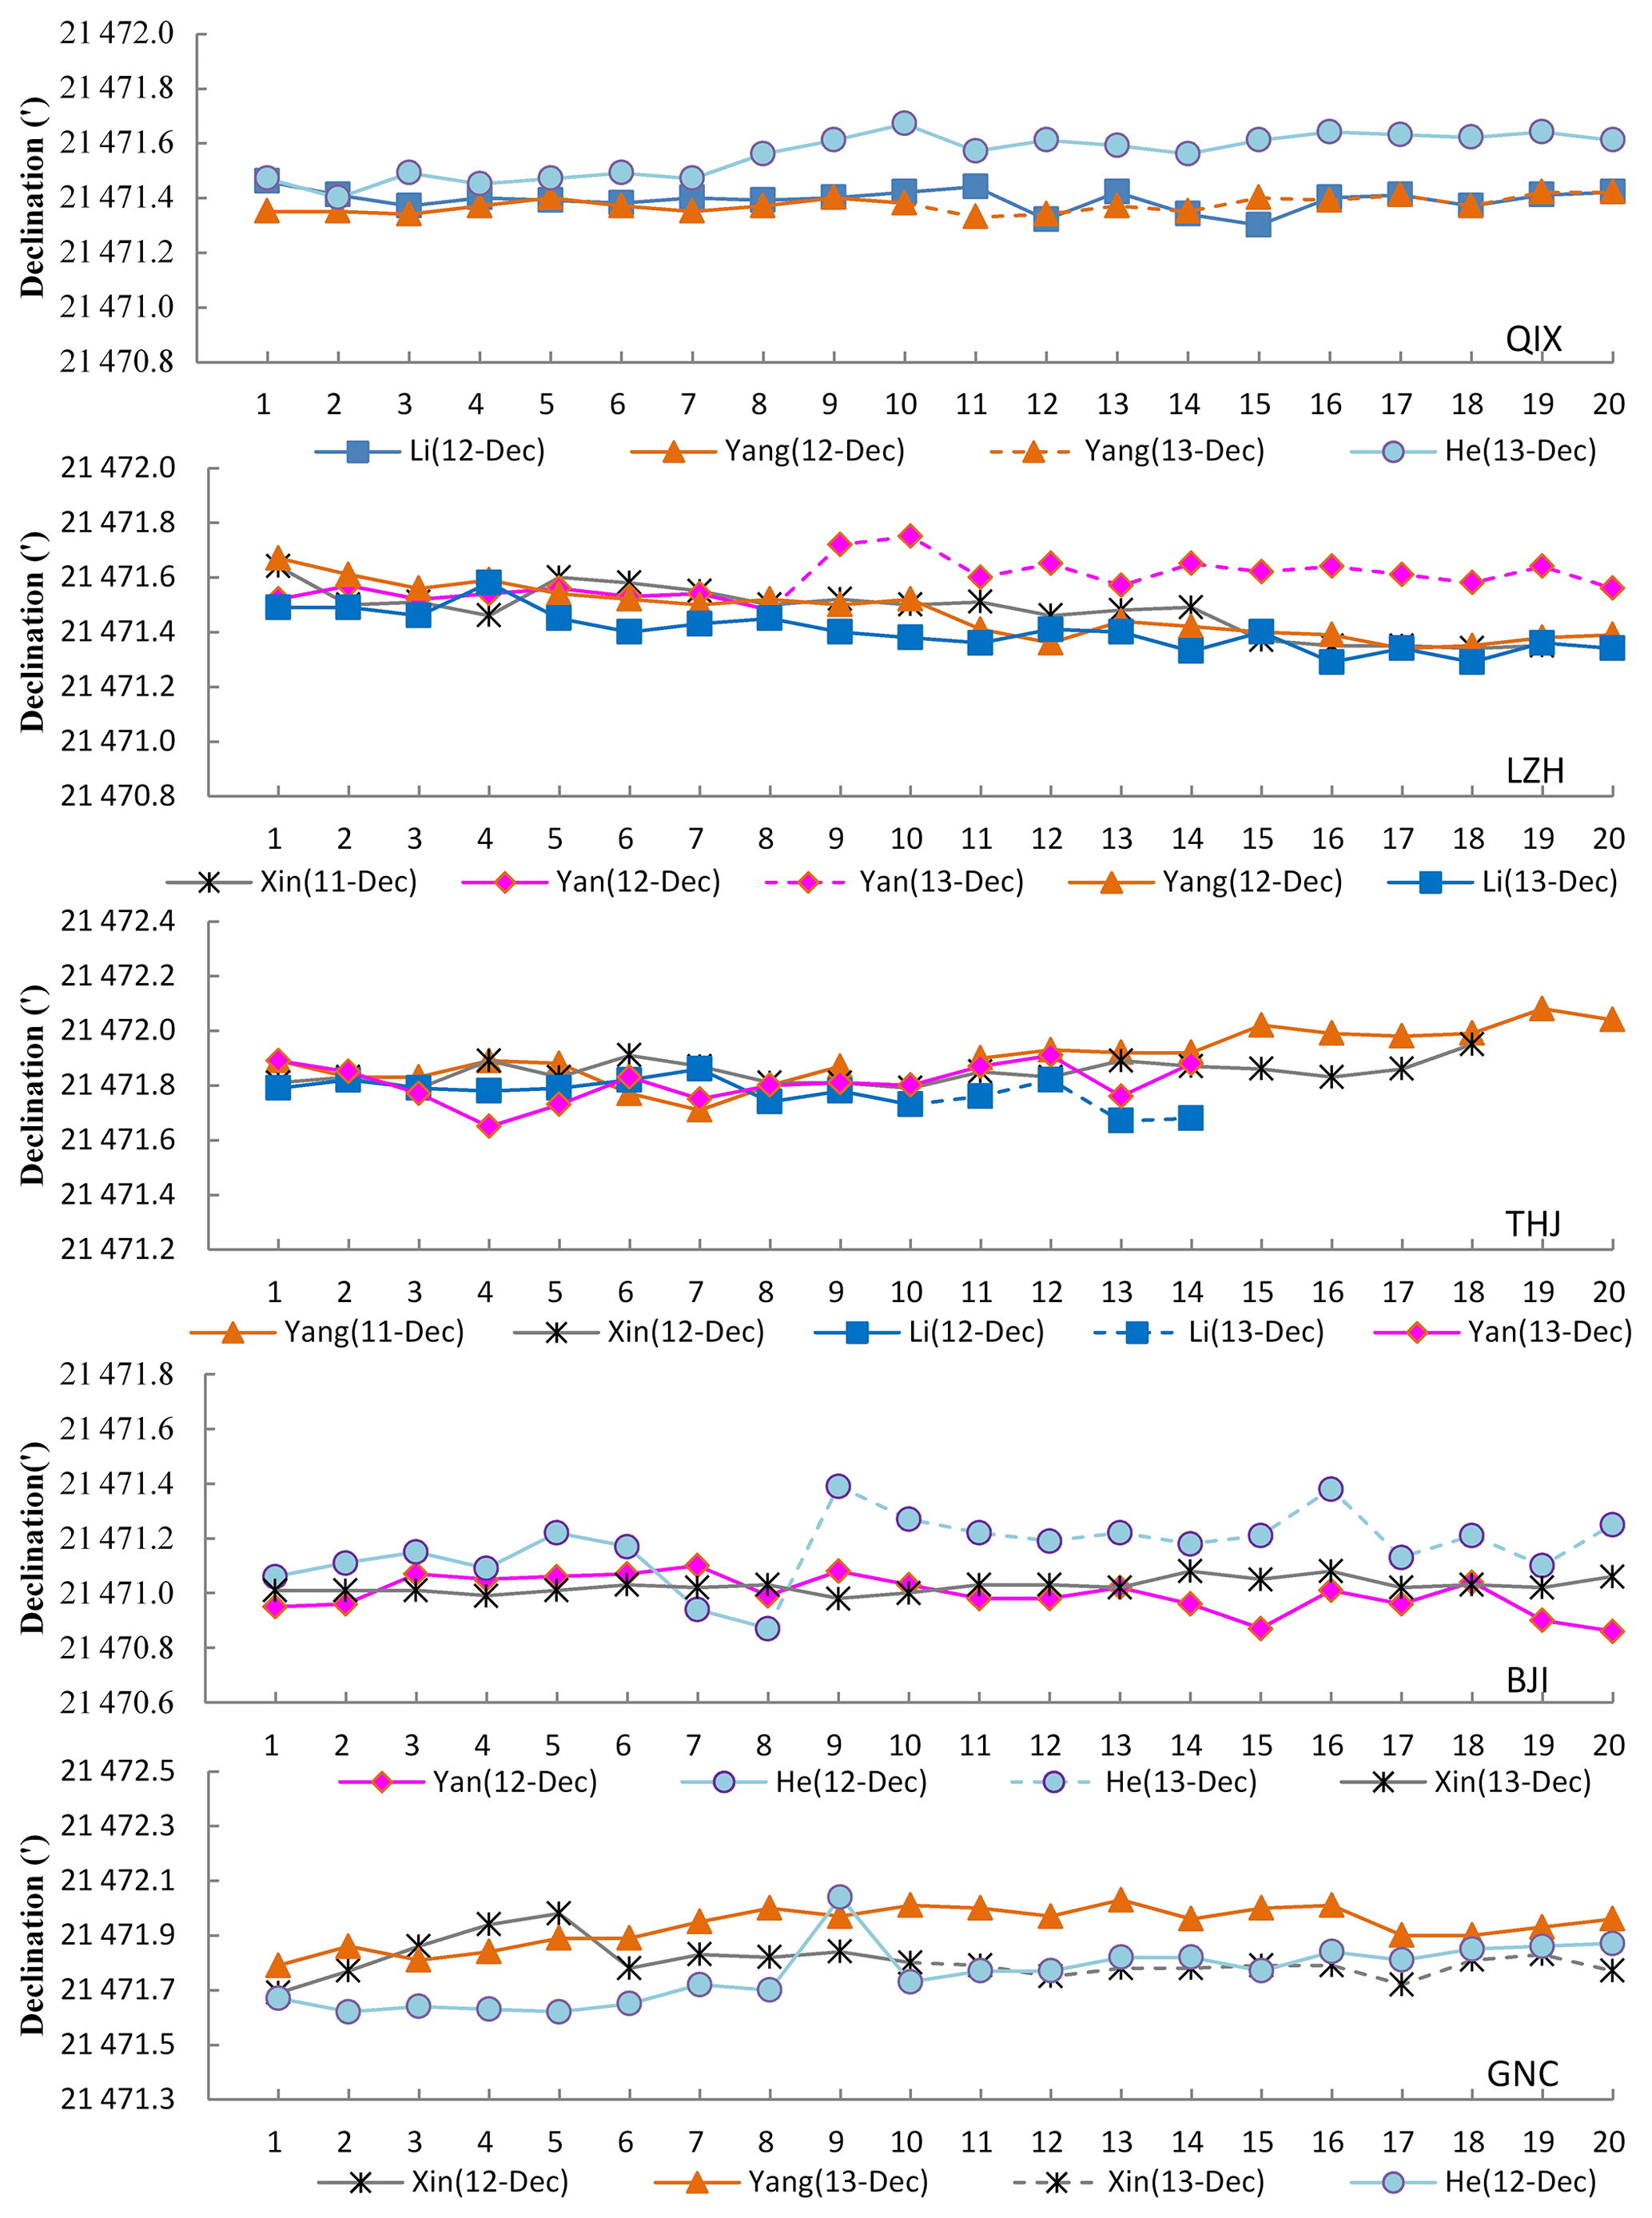
Figure 2The baselines for declination measurements. Different symbols (or colors) represent different observers, and different line styles represent that the same observer made absolute measurements on different observation dates.

Figure 3The baselines for inclination measurements. Different symbols (or colors) represent different observers, and different line styles represent that the same observer made absolute measurements on different observation dates.
To check the reliability of observers' results, the standard deviations of the sets of baseline values for each person were also computed (Tables 2, 3). The standard deviation can be used to reflect the degree of dispersion of the data set: the smaller the standard deviation, the less the value deviates from the average value. Therefore, to an extent it represents the absolute measurements level of observer. Consequently, the results from this study indicate that the observers have a high level of observation.
Table 2The standard deviation of the declination baselines for each observer. The numbers in parentheses refer to the observation pillars in Fig. 1.
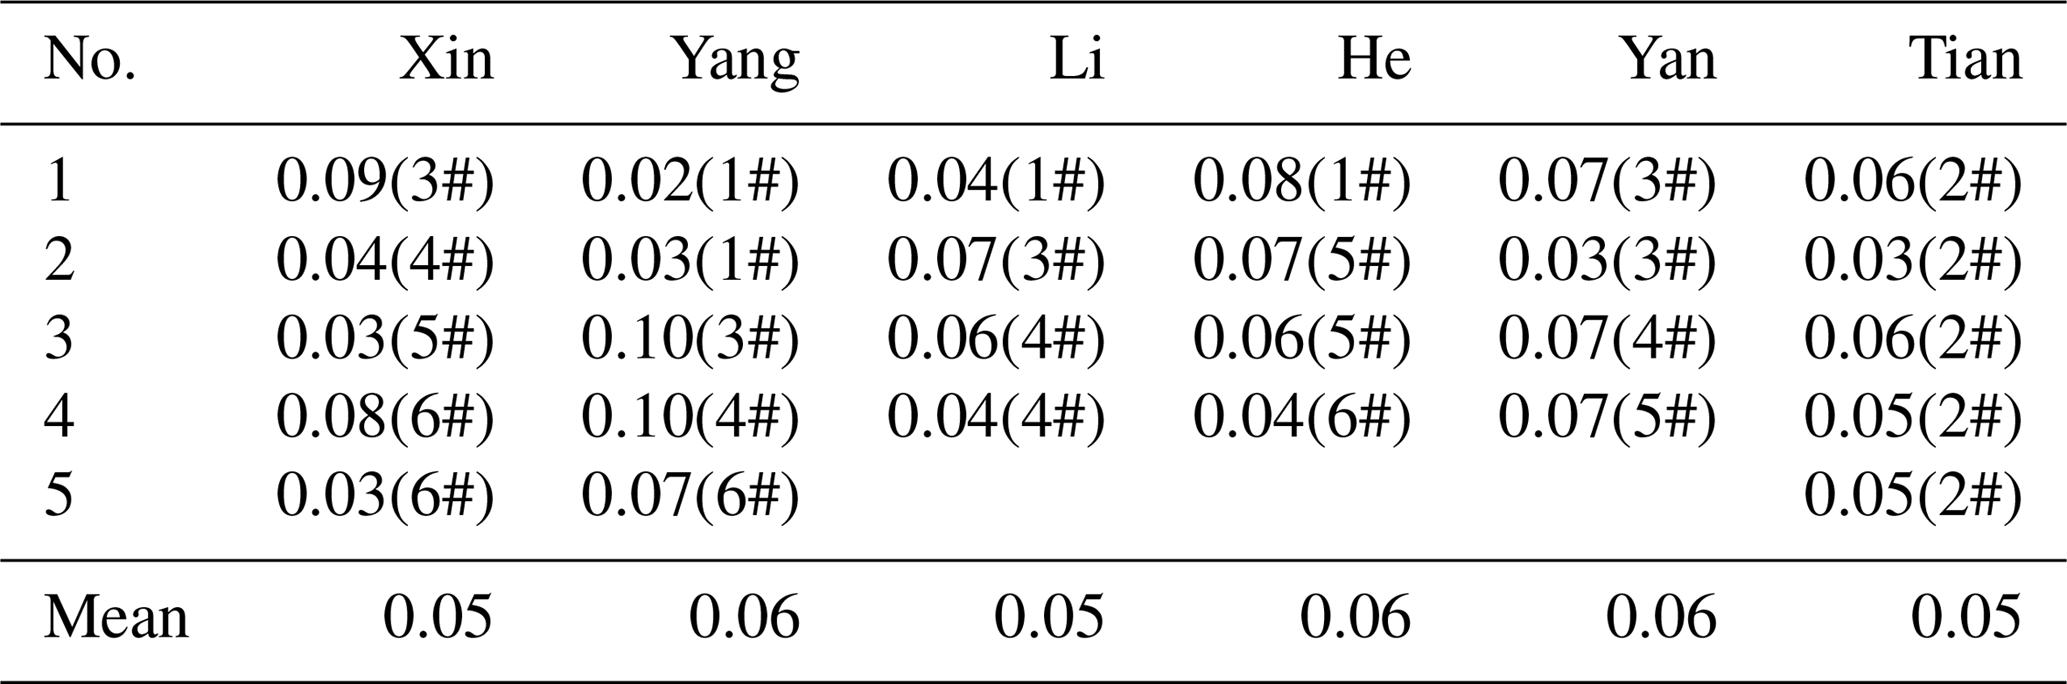
Table 3The standard deviation of the inclination baselines for each observer. The numbers in parentheses refer to the observation pillars in Fig. 1.
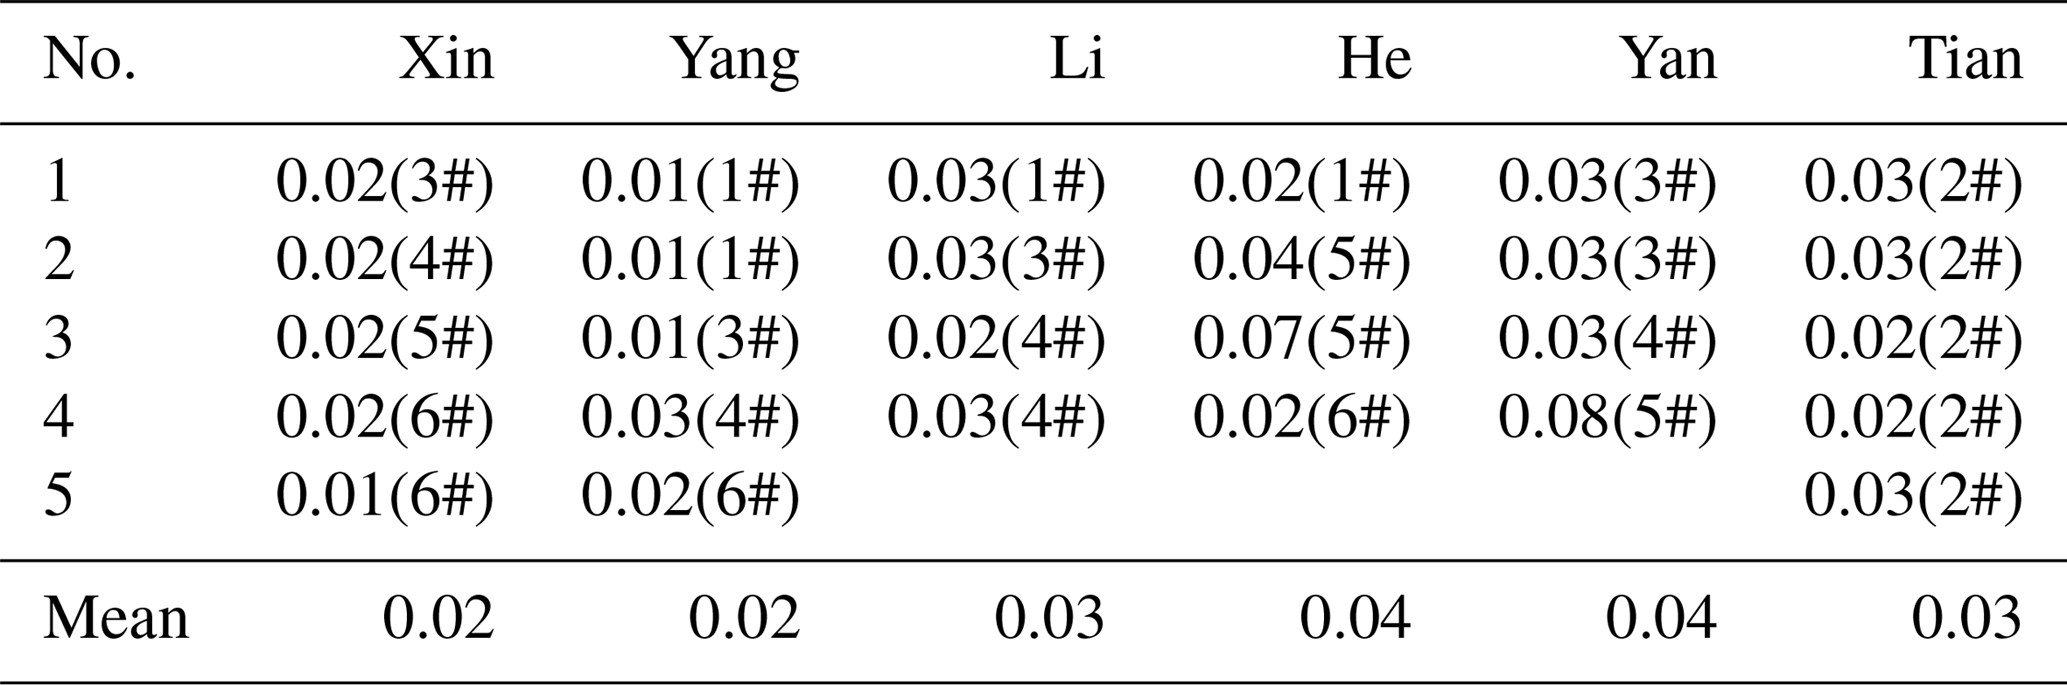
In addition, the observers at Lanzhou Observatory made synchronous absolute measurements with their own fluxgate theodolite. In this fashion, the observation environment changes of Lanzhou Observatory can be monitored during the experiment. The declination and inclination baselines from Lanzhou Observatory are displayed in Fig. 4. As shown in the figure, the baselines were stable during the experiment period. These results suggest that the experimental results are reliable. However, there is a sudden change on the 12 December (Fig 4., dark red), when the variation of the declination baseline is about 0.2′ compared to the day before. This difference may have been caused by artificial observation errors from the observers. This is similar to both Yang's results (Fig. 2, pink, second panel, LZH) and He's results (Fig. 2, light blue, fourth panel, BJI). The differences in a single observer's measurements are also part of the operator difference.

Tables 4 and 5 list all of the operator differences for the declination and inclination measurements, which were calculated following Eq. (2). The number in parentheses following the operator difference is the pillar number. As shown in the tables, the maximum of the operator difference with respect to the declination is 0.22′; the maximum value regarding the inclination is 0.09′.
Table 4The operator differences with respect to declination. The numbers in parentheses refer to the observation pillars in Fig. 1.
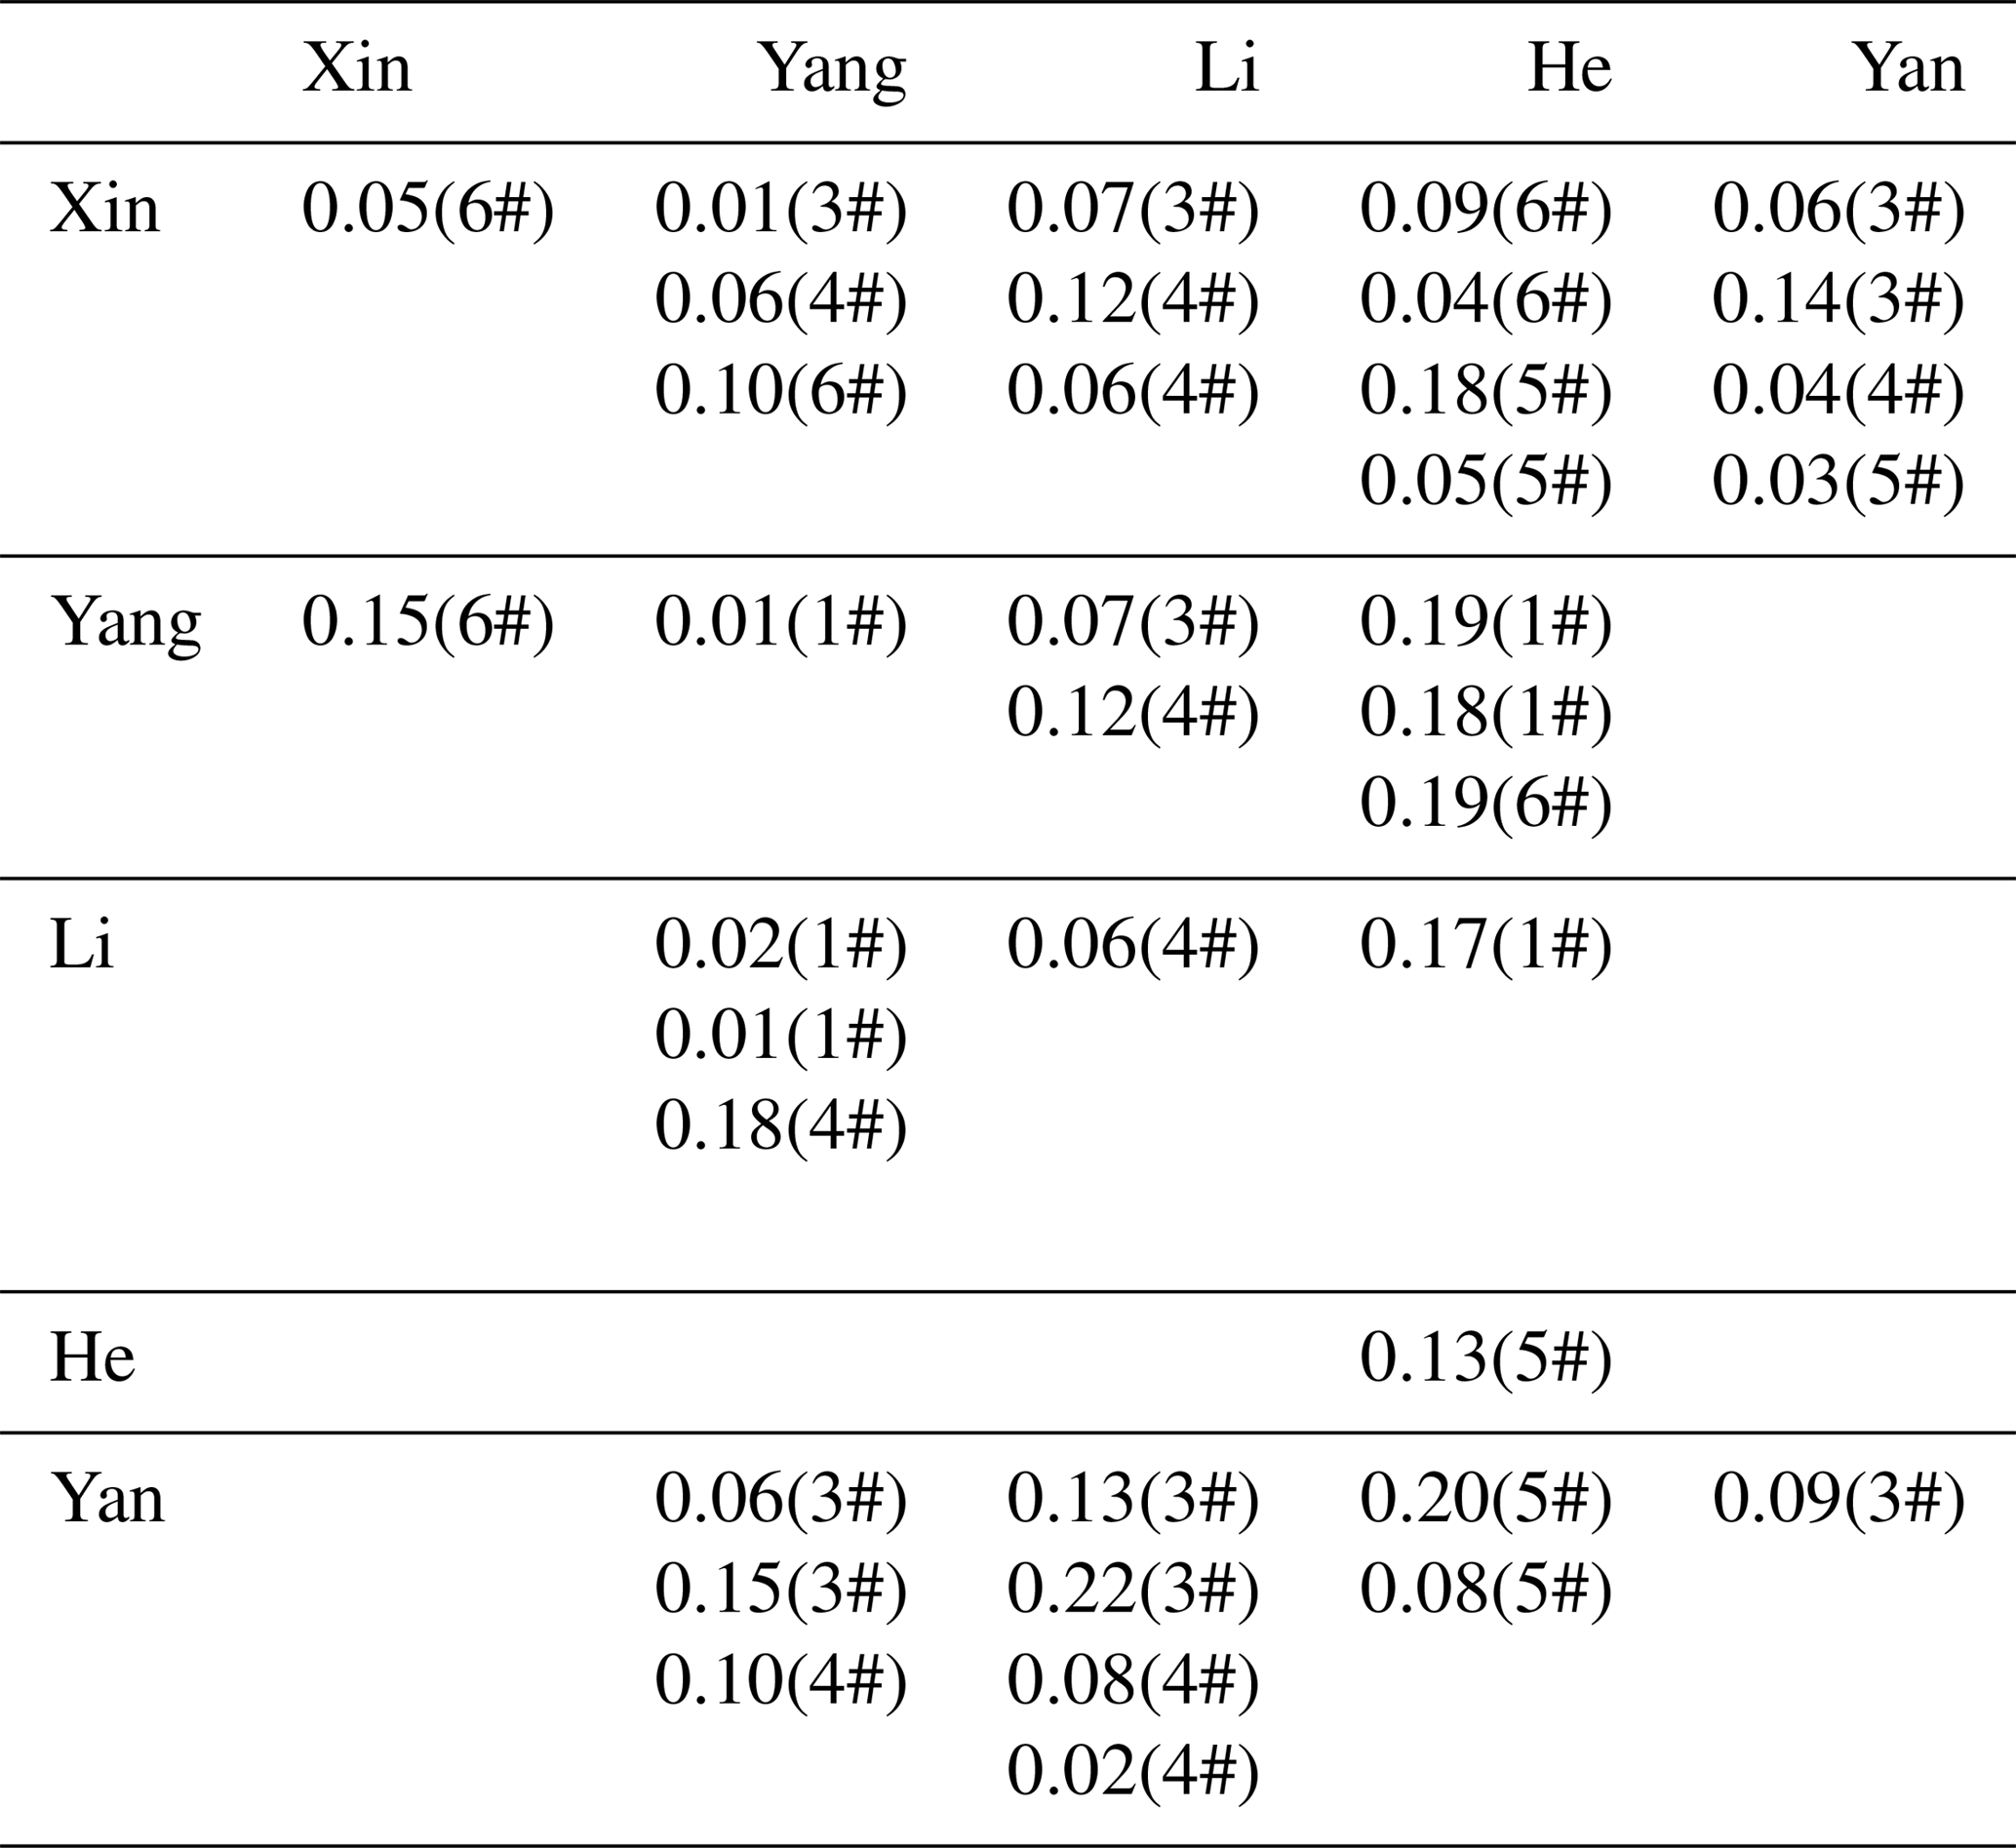
Table 5The operator differences with respect to inclination. The numbers in parentheses refer to the observation pillars in Fig. 1.

Figure 5 shows the statistical results for all of the oberator differences. The frequency distribution (corresponding to the left vertical axis) and the cumulative probability (corresponding to the right vertical axis) are represented by a dotted line and a solid line, respectively. The histogram is the count of the operator difference. The statistical results for the operator difference with respect to the declination and the inclination are displayed in Fig. 5a and b, respectively. The operator differences for the declination are almost evenly distributed between 0′ and 0.22′; the operator differences for the inclination are distributed between 0′ and 0.1′, although most data are located near zero.
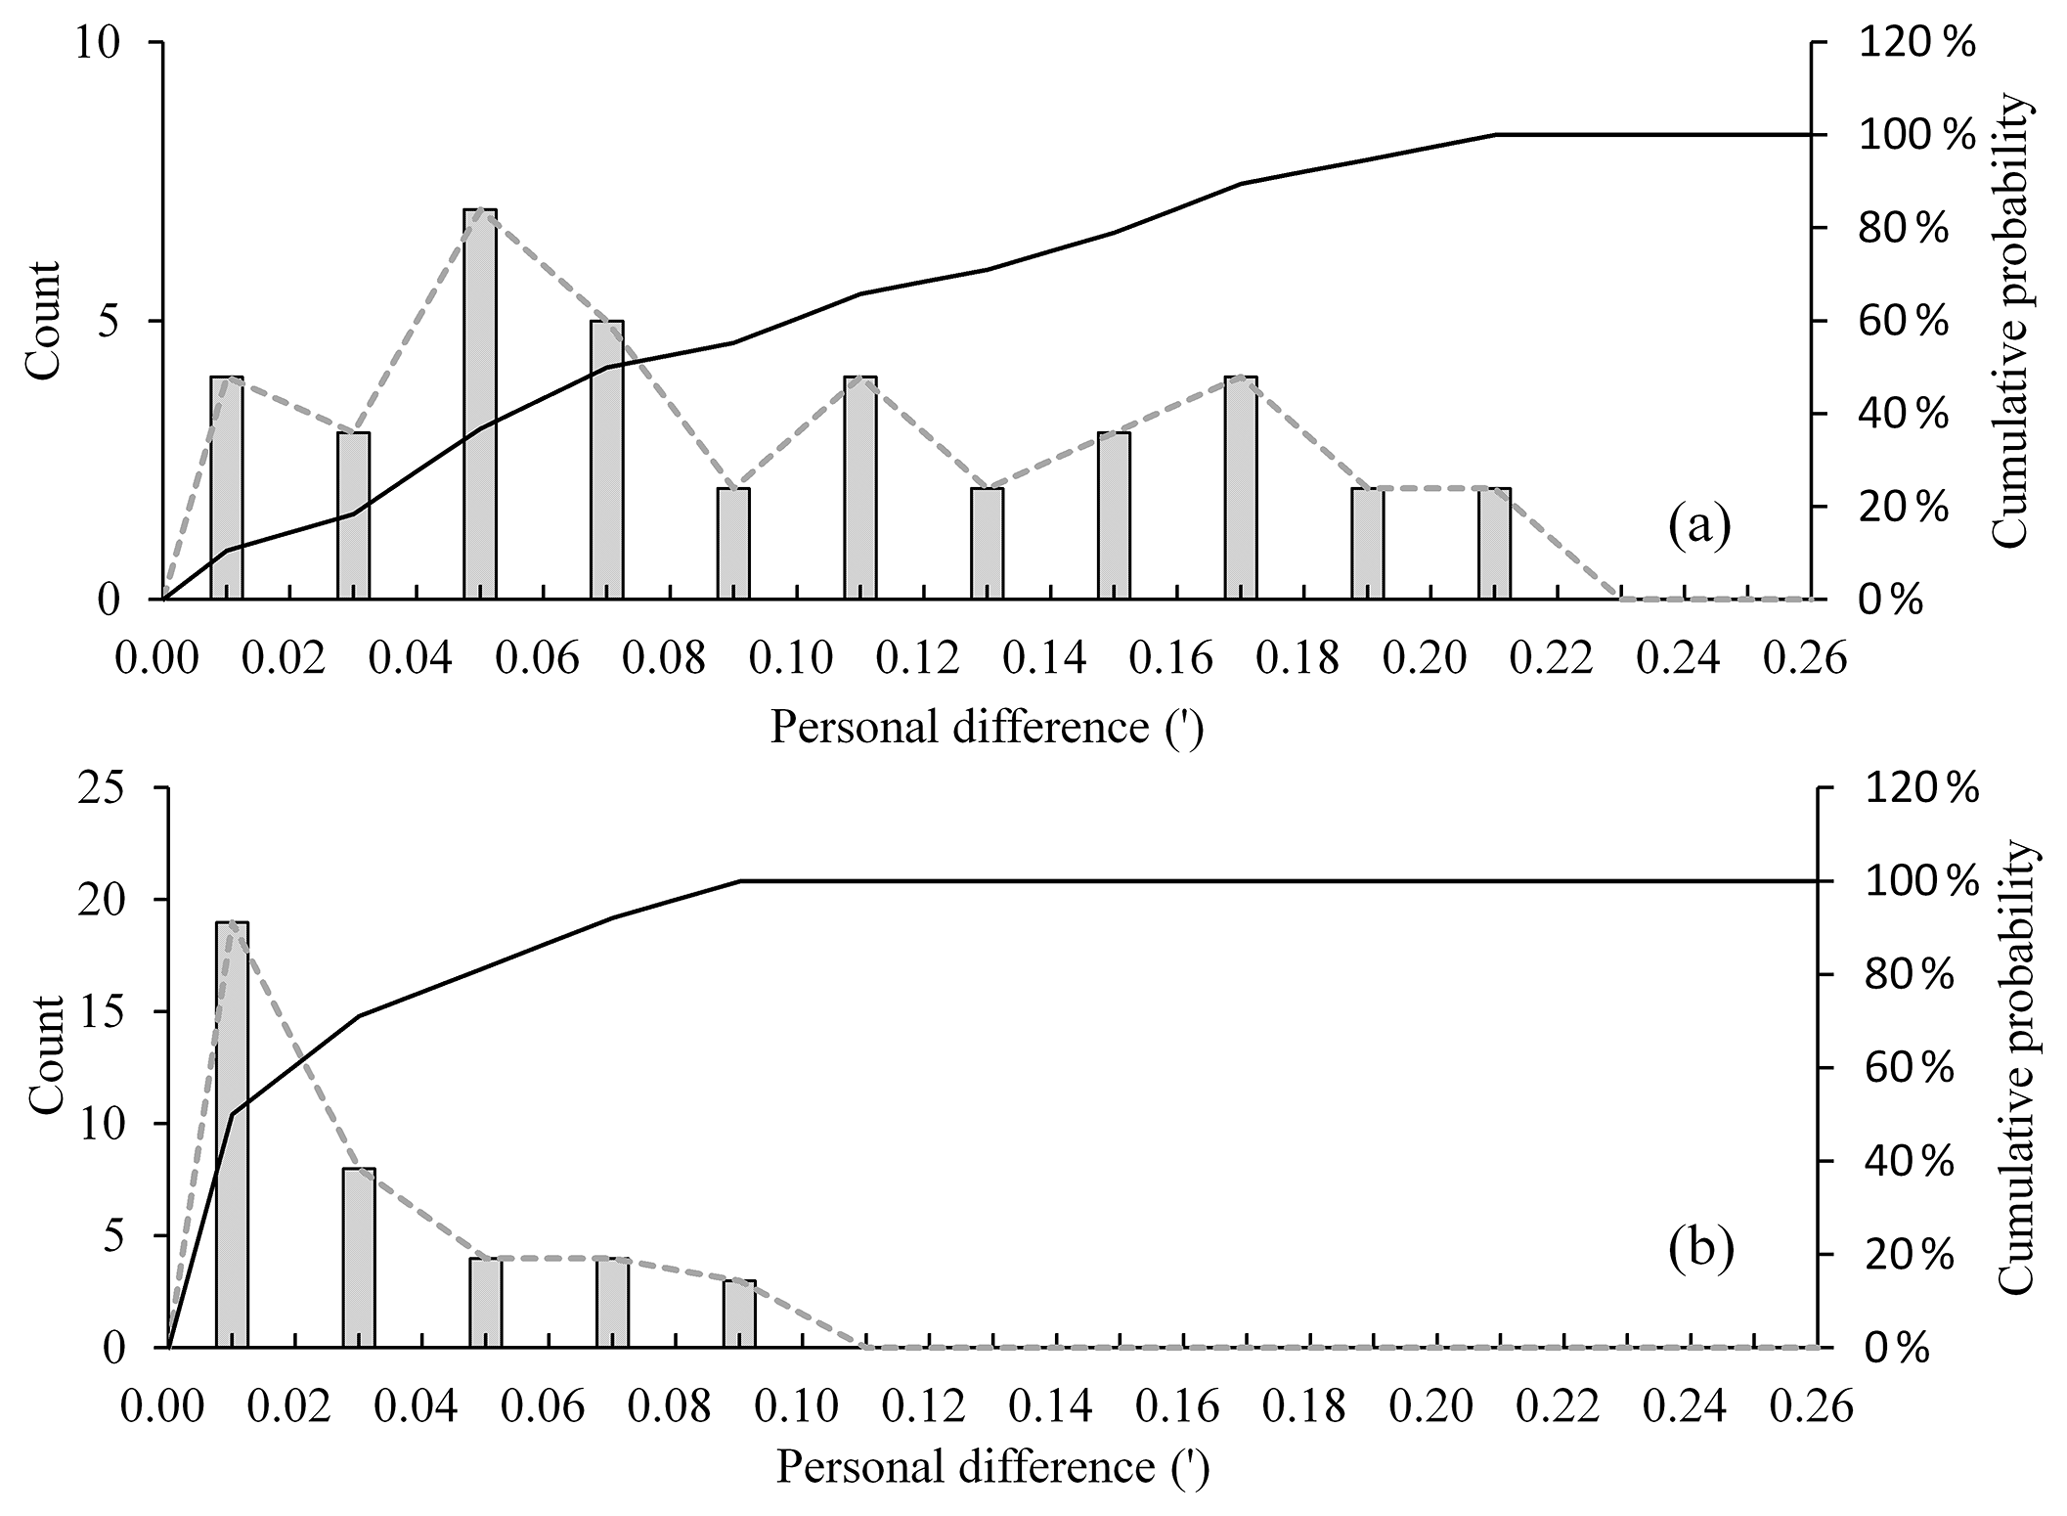
Figure 5The frequency distribution and the cumulative probability for the declination (a) and inclination (b). The histogram is the count of the operator differences. The dotted line and the solid line represent the frequency distribution (corresponding to the left vertical axis) and the cumulative probability (corresponding to the right vertical axis), respectively.
Usually, an accuracy of less than 0.1′ (for directional elements) and less than 1 nT (for intensity elements) is considered to be the standard for data quality control at a geomagnetic observatory (Zhang et al., 2016). Furthermore, this is the goal that global geomagnetic observatories desire to achieve. If this level of accuracy is used to investigate operator difference in this experiment, the cumulative probability of the declination corresponding to 0.1′ is only 55 %. When it comes to the inclination data, the percentage is 100 %. That is to say, it is currently difficult to achieve an accuracy of less than 0.1′ in declination measurement.
In order to reasonably estimate the operator difference, 90 % of the cumulative probability is adopted as an evaluation criterion in this work, and obviously incorrect data is excluded. The operator difference value corresponding to 90 % of the cumulative probability is then considered as the estimation value. As seen in Fig. 5, when a value of 90 % was adopted to estimate operator difference, the estimation values of the declination and inclination were 0.18′ and 0.08′, respectively. Furthermore, the operator difference of the declination was much larger than that of the inclination. This means that more artificial observation errors might have been introduced during the declination measurements, and that the quality of the inclination measurements is better than that of the declination measurements.
There are two possible reasons for the distinction between operator differences with respect to the declination and inclination. First, the initial step in declination measurement is to measure the position of the azimuth mark. To so this, the observer must adjust the telescope to ensure that the optical axis is aligned with the azimuth mark. However, it is hard for an observer to adjust the optical axis to exactly the same position every time. Second, the horizontality of the fluxgate sensor may introduce observer-based differences. To measure the declination, the observer has to put the sensor in the horizontal plan, and the horizontality (i.e., the vertical circle at 90 ∘) needs to be controlled at each step; if this does not occur, there is a projection of the Z component. Therefore, in both of the above-mentioned cases, operator differences are introduced to the final results for absolute geomagnetic measurements.
Geomagnetic observatories are the main sites which measure the secular variation of the magnetic field. As previously mentioned, it is desirable to aim for an accuracy of less than 0.1′ (for directional elements) and 1 nT (for intensity elements). In principle, modern instruments such as the Zeiss 010B fluxgate theodolite, (which is precise within 1 arcsec) have a precision that is sufficient to make this aim possible. In practice, the instrument's accuracy is not better than 3 s (according ISO 17-123). This means that a possible error of 0.05′ will introduced into the results. Moreover, the existence of various errors in measurement, especially artificial observation errors, makes this goal difficult to achieve. The operator difference is one of these artificial observation errors, and is difficult to estimate.
The measurement experiment outlined in this paper is a feasible way to estimate the operator difference. The results are reliable, and they clearly display the operator difference present in absolute geomagnetic measurements. According to the estimation results, the operator difference of the declination and inclination are 0.18′ and 0.08′, respectively. If the absolute measurements are made by different observers in one observatory, the operator difference is introduced to the final results. However, one must be aware that differences in a single observer's observations and the instrument accuracy error may both be contained in the operator difference. We also found that the results for the declination are more susceptible to error than those of the inclination. Two possible reasons for this have been given in this paper.
This work is helpful with respect to understanding and estimating the operator difference in absolute measurements. It has been found that having a fixed observer who is responsible for absolute geomagnetic measurements is useful for improving the observation data quality. It is also helpful for scientists who use these data to carefully analyze their research results.
In recent years, much effort has been directed toward the development of new observation technology and automatic fluxgate theodolites (Auster et al., 2003; Rassion et al., 2011; Gonsette et al., 2017b; Hegymegi et al., 2017; Brunke et al., 2018). Some of these technological developments have been realized and are currently operating in observatories. With the increase in instrument precision that these developments introduce, and their use around the world, we hope that the operator difference will cease to exist and that high quality observation data will be obtained in the future.
The raw data are available upon request from the corresponding author at zxd9801@163.com.
YH and XZ initiated the study, designed the experiment and wrote the paper. JW provided the calculation results. Other authors participated in the experiment and supplied raw observational data.
The authors declare that they have no conflict of interest.
We would like to acknowledge the editor and the reviewers who contributed to
the improvement of this article.
Edited by: Luis Vazquez
Reviewed by: Alexandre Gonsette, Dongmei Yang, and one anonymous referee
Auster, H. U. and Auster, V.: A new method for performing an absolute measurement of the geomagnetic field, Meas. Sci. Technol., 14, 1013, https://doi.org/10.1088/0957-0233/14/7/315, 2003.
Bitterly, J. J., Cantin, M., Schlich, R., Folques, J., and Gilbert D.: Portable magnetometer theodolite with fluxgate sensor for earth's magnetic field component measurements, Geophys. Surv., 6, 233–239, https://doi.org/10.1088/0957-0233/14/7/315, 1984.
Brunke, H.-P. and Matzka, J.: Numerical evaluation of magnetic absolute measurements with arbitrarily distributed DI-fluxgate theodolite orientations, Geosci. Instrum. Method. Data Syst., 7, 1–9, https://doi.org/10.5194/gi-7-1-2018, 2018.
Deng, N., Yang, D. M., Yang, Y. F., and Chen, J.: On problems of absolute measurement in geomagnetic observatory, J. Geodesy, 30, 129–134, https://doi.org/10.3969/j.issn.1671-5942.2010.z1.029, 2010.
Gonsette, A., Rasson, J., and Humbled, F.: In situ vector calibration of magnetic observatories, Geosci. Instrum. Method. Data Syst., 6, 361–366, https://doi.org/10.5194/gi-6-361-2017, 2017a.
Gonsette, A., Rasson, J., Bracke, S., Poncelet, A., Hendrickx, O., and Humbled, F.: Fog-based automatic true north detection for absolute magnetic declination measurement, Geosci. Instrum. Method. Data Syst., 6, 439–446, https://doi.org/10.5194/gi-6-439-2017, 2017b.
Hegymegi, L., Szöllősy, J., Hegymegi, C., and Domján, Á.: Measurement experiences with FluxSet digital D/I station, Geosci. Instrum. Method. Data Syst., 6, 279–284, https://doi.org/10.5194/gi-6-279-2017, 2017.
Jankowski, J. and Sucksdorff, C.: Absolute magnetic measurement, in: Guide for magnetic measurements and observatory practice, IAGA V–8, Boulder, USA, 87–102, 1996.
Li, X. J., Yang, D. M., Zhang, S. Q., and He, Y. F.: The necessary of the manual observation in absolute observation, Seismol. Geomag. Obser. Res., 33, 201–205, https://doi.org/10.3969/j.issn.1003-3246.2012.03/04.037, 2012.
Newitt, L. R., Barton, C. E., and Bitterly J.: Setting up Equipment and Taking Measurements, in: Guide for magnetic repeat station surveys, IAGA V–8, Boulder, USA, 43–45, 1996.
Rasson, J. L. and Gonsette, A.: The Mark II Automatic Diflux, Data Sci. J., 10, IAGA169–IAGA173, https://doi.org/10.2481/dsj.IAGA-24, 2011.
St-Louis, B.: INTERMAGNET technical reference manual, version 4.5, INTERMAGNET c/o British Geological Survey, available at: http://www.intermagnet.org/publications/im_manual.pdf, last access: 17 July 2018.
Zhang, S. Q. and Yang, D. M.: Study on the stability and accuracy of baseline values measured during the calibrating time intervals, Data Sci. J., 10, IAGA19–IAGA24, https://doi.org/10.2481/dsj.IAGA-04, 2011.
Zhang, S. Q., Fu, C. H., He, Y. F., Yang, D. M., Li, Q., Zhao, X. D., and Wang, J. J.: Quality control of observation data by the Geomagnetic Network of China, Data Sci. J., 15, 1–12, https://doi.org/10.5334/dsj-2016-015, 2016.