the Creative Commons Attribution 4.0 License.
the Creative Commons Attribution 4.0 License.
Shallow geophysical techniques to investigate the groundwater table at the Great Pyramids of Giza, Egypt
Sharafeldin M. Sharafeldin
Khalid S. Essa
Mohamed A. S. Youssef
Hakan Karsli
Zein E. Diab
Nilgun Sayil
The near-surface groundwater aquifer that threatened the Great Pyramids of Giza, Egypt, was investigated using integrated geophysical surveys. A total of 10 electrical resistivity imaging, 26 shallow seismic refraction, and 19 ground-penetrating radar surveys were conducted in the Giza Plateau. Collected data for each method were evaluated by state-of-the art processing and modeling techniques. A three-layer model depicts the subsurface layers and better delineates the groundwater aquifer and water table elevation. The resistivity of the aquifer layer and seismic velocity vary between 40 and 80 Ωm and between 1500 and 2500 m s−1, respectively. The average water table elevation is about +15 m, which is safe for the Great Sphinx, but it is still subjected to potential hazards from the Nazlet El-Samman suburb where the water table elevation reaches 17 m. A shallower water table at the Valley Temple and the tomb of Queen Khentkawes, with a low topographic relief, represents severe hazards. It can be concluded that a perched groundwater table is detected in the elevated topography to the west and southwest that might be due to runoff and capillary seepage.
- Article
(12936 KB) - Full-text XML
- BibTeX
- EndNote
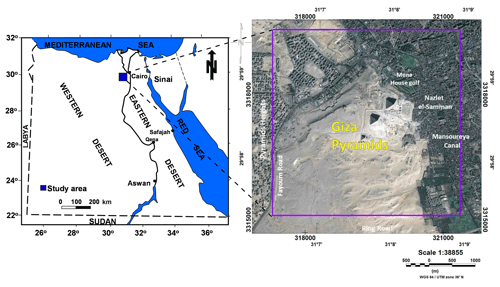
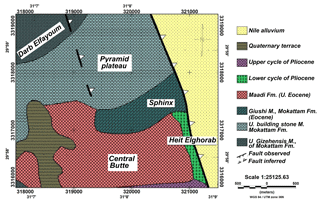
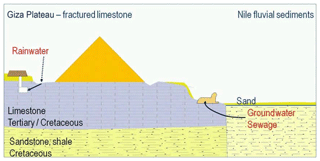
In recent years, the 4500-year-old Great Pyramids of Giza (GPG), Cheops (Khufu), Chephren (Khafre), Menkaure, and the Great Sphinx have been threatened by a rising groundwater table resulting from water leakage from the suburbs, irrigation canals, and mass urbanization surrounding the GPG. This problem promoted the need to use nondestructive near-surface geophysical techniques integrated with available borehole hydrogeological data to investigate and characterize groundwater occurrences in the GPG. The GPG is located in the southwestern part of the greater Cairo region (Fig. 1). Geologically, the Giza Plateau is composed mainly of white limestone, cream and yellow argillaceous limestone, and dark grey dolomitic limestone of middle–upper Eocene age. The plateau rocks are commonly interbedded with thin marl layers in their upper part, which dips about 5–10∘ to the southeast (SE) direction. Steep escarpments border the plateau to the north and east directions as shown in Fig. 2 (Yehia, 1985; Mahmoud and Hamdan, 2002). Two regional groundwater aquifers underlie the Sphinx (Fig. 3); the Quaternary aquifer of Nile alluvium consists of graded sand and gravel with intercalations of clay lenses at different depths, with a water table at depth ranges between 1.5 and 4 m below the ground surface (b.g.s.). The second aquifer is a fractured carbonate aquifer that covers the area below the pyramid plateau and the Sphinx, where the water table ranges in depth from 4–7 m b.g.s. The recharge of the aquifer below the Sphinx area occurred mainly through water system leakage, irrigation, and mass urbanization (AECOM, 2010; El-Arabi et al., 2013).
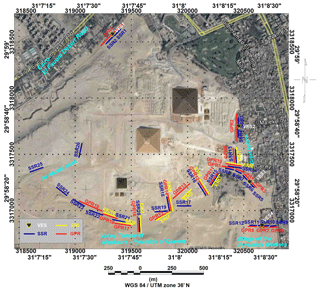
Many geophysical studies have been carried out in the GPG, mostly for archaeological exploration and investigations (e.g., Dobecki, 2005; Abbas et al., 2009, 2012). Geophysical studies have made an effective contribution to characterizing groundwater aquifers, especially geoelectrical resistivity, seismic refraction, and ground-penetrating radar techniques. Sharafeldin et al. (2017) studied the groundwater table in the GPG using combined electrical resistivity imaging (ERI) and ground-penetrating radar (GPR). The present work implemented an integration of electrical resistivity imaging (ERI), shallow seismic refraction (SSR), and ground-penetrating radar (GPR) techniques to depict the groundwater table and characterize the aquifer in the Giza pyramid area. The locations of different surveys conducted in the GPG are illustrated in Fig. 4.
2.1 Electrical resistivity imaging (ERI) surveying
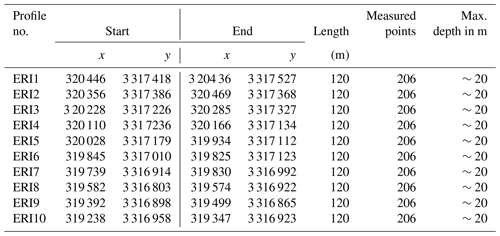
Two-dimensional electrical resistivity imaging surveys by tomographic inversion are usually carried out using a multielectrode system with 24 electrodes or more connected to a multicore cable (Griffiths and King, 1965). A Syscal-Pro resistivity meter from IRIS Instruments, France, was deployed at the site of the GPG using a 24 multielectrode dipole–dipole array configuration with 5 m electrode spacing. The length of geophone spread is 120 m for each profile and reaches more than 30 m as the maximum depth of investigation, considering the offset shots. A total of 10 ERI profiles were created to characterize the resistivity of subsurface layers to delineate the groundwater aquifer (Fig. 4). The topographic elevation of each electrode is considered along the ERI profile and linked to the Res2Dinv program. The acquired ERT data were processed using Prosys II software from IRIS Instruments to filter and exterminate bad and noisy data acquired in the field and produce pseudo-resistivity sections. The Res2Dinv software was used to invert the collected data along the conducted ERT profiles (Loke, and Barker, 1996; Loke, 2012). This software works by automatically subdividing the subsurface of the desired profile into several rectangular prisms and then applies an iterative least-squares inversion algorithm to solve a nonlinear set of equations to determine the apparent resistivity values of the assumed prisms while decreasing the misfit values between the predicted and the measured data. Table 1 shows the main characteristics of the ERI profiles, including information such as profile location, length, measured points, and expected depth of penetration.
2.2 Shallow seismic refraction (SSR)
Seismic refraction is widely used in determining the velocity and depth of weathering layers, with static corrections for deeper reflection data. It is also employed in civil engineering for bedrock investigations and large-scale construction. It is also used in groundwater investigations, the detection of fracture zones in hard rocks, examining stratigraphy and sedimentology, detecting geologic faults, evaluating karst conditions, and hazardous waste disposal delineation (Steeples, 2005; Stipe, 2015). A refraction technique is widely developed for characterizing groundwater tables (Grelle and Guadagno, 2009). Particularly, unsaturated soil followed by saturated soil can be separated by a refracting interface (Haeni, 1988). The seismic velocity values for the depth estimation of the groundwater can be used as an indicator for water saturation. The values of P wave velocity are not uniquely correlated with the aquifer layer, but many authors argue that P wave velocities around 1500 m s−1 represent a saturated layer (Grelle and Guadagno, 2009). Tomographic studies indicate that a water table corresponds to P wave velocity values of 1100 to 1200 m s−1 (Azaria et al., 2003; Zelt et al., 2006).
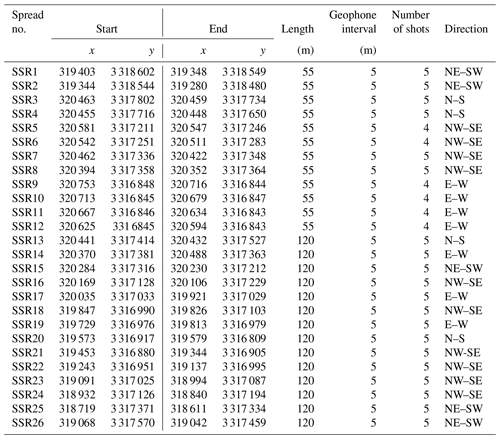
A total of 26 SSR profiles were acquired at GPG (Fig. 4). An OYO McSEIS-SX seismograph with 24 geophones and channels was deployed at the GPG site to collect seismic refraction data with geophone spacing of 5 m. Sledge hammers weighing 10 kg with an iron–steel plate are used to generate seismic P waves. Five shots per spread were gathered, two offset forward and reverse and a split spread shot. The spread length covers 115 m. Due to the historical and touristic nature of the site, a considerable amount of noise imposes on the recorded data. These noises were minimized as much as possible by using the internal frequency domain filter and vertically stacking several shots during data acquisition. The first arrival times were picked using SeisImager software version 4.2 from Geometrics. Tomographic inversion generated an initial model from the velocity model obtained by the time-term inversion; the inversion was then applied, which iteratively traces rays through the model with the goal of minimizing the RMS error between the observed and calculated travel-time curves (Schuster, 1998). SeisImager utilizes a least-squares approach for the inversion step (Zhang and Toksoz, 1998; Sheehan et al., 2005; Valenta, 2007). A three-layer model is assumed to represent the subsurface succession with the inverted velocities.
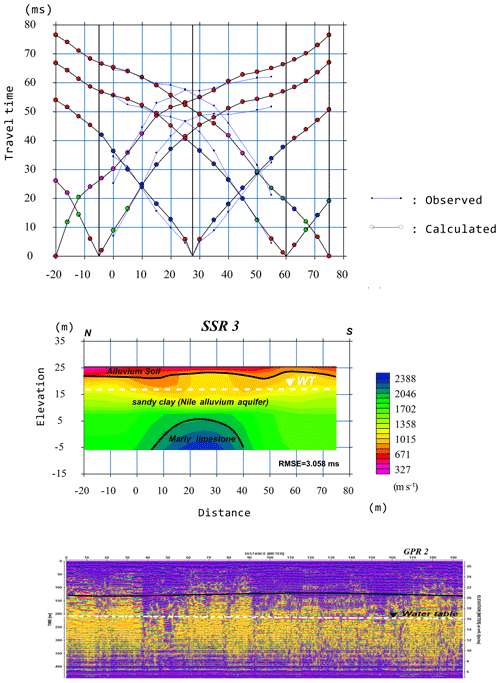
To test the accuracy of the resulting tomographic models, these models were used to calculate the arrival-time curve that was compared with the measured arrival time and RMS errors between the two results, which are calculated and illustrated as an example on a modeled seismic profile as blue and black segments in the SSR3 graphs (Fig. 5). Table 2 shows the main characteristics of the SSR profiles, including information such as profile location, length, measured points, and expected depth of penetration.
2.3 Ground-penetrating radar (GPR) techniques
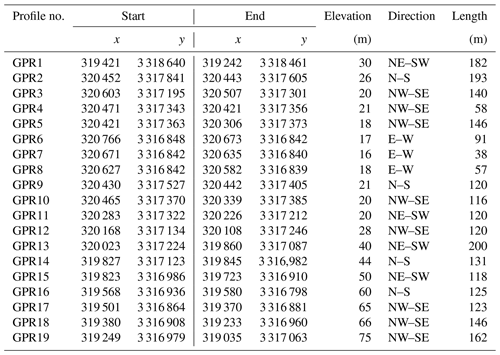
GPR is a noninvasive and effective geophysical technique to visualize the near-surface structure of the shallow subsurface and is widely used to solve environmental and engineering problems (Jol and Bristow, 2003; Comas et al., 2004; Neal, 2004). GPR is a site-specific technique that imposes a vital limitation on the quality and resolution of the acquired data (Daniels, 2004). The GPR surveys were carried out using a 100 MHz shielded antenna from MALA ProEx GPR. A total of 19 GPR profiles were performed along selected locations in the study area (Fig. 4). The GPR profiles range in lengths from 40–200 m, according to the space availability, with a total GPR survey length of about 2.5 km. Wheel calibration was carried out near the Great Sphinx along 30 m of distance, and the velocity used for calibration is 100 m µs−1, which resulted from a wide-angle reflection and refraction (WAAR) test using a pulseEKKO GPR 100 MHz unshielded antenna (Sensors&Software, Canada). Harari (1996) showed that the groundwater table can be detected easily with a discerning selection of the antenna frequency, and he observed that the lower-frequency antenna (e.g., 100 MHz) was more effective for locating the groundwater table depth. Several basic processing techniques can be applied to GPR raw data stating from a DC shift to migration (Annan, 2005; Benedetto et al., 2017). All 19 GPR profiles were processed to delineate subsurface layering and groundwater elevation in the study area. An appropriate processing sequence for GPR data was applied to facilitate interpretation of radargram sections using REFLEXWIN V. 6.0.9 software (Sandmeier, 2012). First, a time-zero correction and then dewow filters were applied to remove the DC component, and very low-frequency components were applied to all GPR data. Then, a band-pass filter was used to improve the visual quality of the GPR data, and gain recovery was applied to enhance the appearance of later arrivals because of the effect of signal attenuation and geometrical spreading losses (Cassidy, 2009). A running-average filter was the final filter applied. Table 3 shows the main characteristics of the GPR profiles.
3.1 ERI
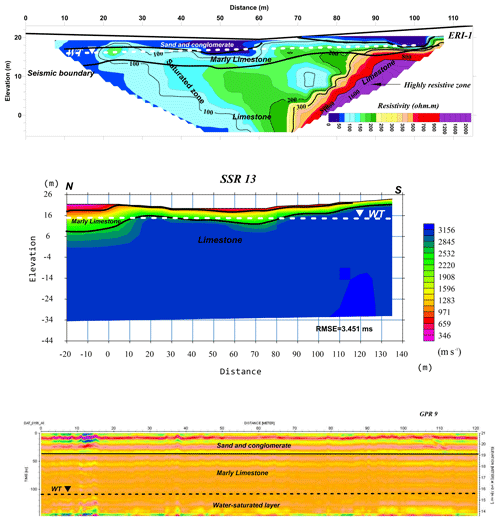
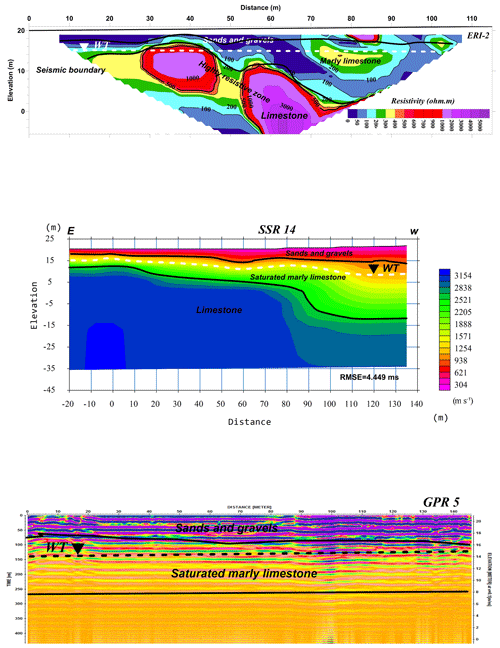
The ERI profile data represented in Table 1 are used to invert the 2-D resistivity models of the GPG site. Five selected profiles are presented in Figs. 6, 7, 8, 9, and 10 to characterize the resistivity model in the different archaeological sites that are potentially threatened by groundwater hazards. The interpreted profiles show that the subsurface of the area is composed of three layers: the surface layer consists mainly of sands and gravels and some exposures of hard limestone and marl. The resistivity values show a wide range of variation between 40 Ωm and more than 1200 Ωm in some parts as the clay content varies in the layer. The thickness of the layer ranges between 3 and 6 m. A second layer shows an average resistivity value varying between 50 and 200 Ωm and in some parts reaches a low value of 4 Ωm as the clay and gypsum intercalation increases. This layer is correlated with wet and saturated sandy and fractured marly limestone, and the thickness varies between 8 m and more than 30 m. The aquifer layer can be detected with a resistivity range of 40–80 Ωm. In the ERI-2 profile (Fig. 7), part of this layer shows a higher resistivity value ranges of 1000–3000 Ωm that reflects a facies change of marly limestone to limestone and dolomite. This facies change is also observed at the end of ERI (Fig. 6). This layer comprises two zones of water content separated by the water table. The upper zone above the water table is a wet zone and the part below the water belongs to the saturated zone. The third layer is a saturated zone and shows a resistivity value between 50 and 100 Ωm, which cannot be detected from the marly limestone only with the integration of seismic results.
3.2 SSR
All seismic profiles (Figs. 5 to 10) show a three-layer model for the subsurface succession with the inverted velocities and thicknesses. The topmost layer exhibits a velocity range of 500–1000 m s−1, and thicknesses of 3 and 6 m are correlated with dry sand and gravels. The second layer shows a velocity range between 1200 and 2500 m s−1 at 8 m to more than 30 m thick. The thickness increased toward the west and southwest as associated with the Maadi Formation at depth. It is noted that the upper part of this layer shows a relatively lower velocity due to water saturation and fractures. The water table can be correlated with a velocity of 1400–1600 m s−1, which separated the upper wet zone and lower saturated zone. The third layer shows a higher velocity that ranges between 2800 and 3800 m s−1, which can be correlated with the limestone and dolomite of the Mokattam Formation.
3.3 GPR
All interpreted GPR profiles (Figs. 5 to 10) detect the surface layer that is characterized by strong reflection, and the thickness is good match to that resulting from seismic interpretation. The top of the second layer shows weak reflections due to the water content through capillary seepage. Despite that, the water table in most GPR sections has been traced and is in good agreement with the SSR and ERI results. Due to the signals attenuated below the water table and the depth limitation of the GPR, the third layer cannot be defined in most sections.
The integrated interpretation of the SSR, ERI, and GPR surveys supports a three-layer model assumed to represent the subsurface succession with the inverted velocities, resistivities, and thicknesses. The collaboration of different geophysical techniques that are susceptible to different physical properties can minimize the ambiguity associated with a separate technique. SSR is sensitive to elastic properties and density that clearly depict the subsurface layer boundaries as well as the groundwater table associated with a velocity of 1500–1600 m s−1. These boundaries can be correlated with the interpreted GPR profiles and ERI. The ERI technique is highly affected by water and clay contents in the subsurface layers that control the resistivity values and reflect a resistivity boundary rather than lithological boundaries. The ERI can clearly delineate the aquifer layer and water content zone. GPR contributes to delineating the surface layer and also to delineating the groundwater table. The three-layer models comprise a surface layer of sand and gravels with a velocity range of 500–1000 m s−1 and a wide range of resistivity between 40 and 1200 Ωm; the thickness varies between 3 and 6 m. The second layer of sandy marly limestone shows a velocity range between 1200 and 2500 m s−1, and resistivity values vary from 50–200 Ωm; the thickness varies from 8 m to more than 30 m. The third layer shows a high velocity range between 2800 and 3800 m s−1, and resistivity values vary between 40 and 100 Ωm correlated with limestone and dolomite. The integrated interpreted surveys indicated that water table elevation ranges between 14.5 and 17 m in the area. As the ground relief increases toward the Menkaure Pyramids (small Pyramid) the water table is deeper and a perched water table is interpreted at elevations between 22 and 45 m.
Groundwater hazards were detected in some locations that have archaeological importance; these locations are Nazlet El-Samman village, the Great Sphinx, Sphinx Temple, Valley Temple of Khafre, central field of Mastaba, and Khafre causeway.
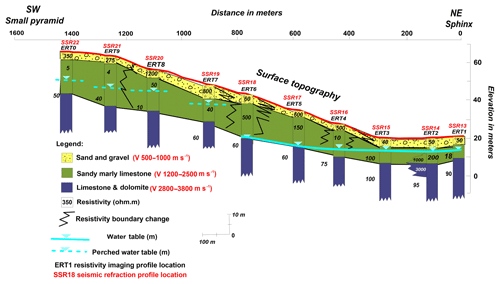
Figure 11A cross section using the ERT data shows how the groundwater elevation changes from the Sphinx to Menkaure Pyramid.
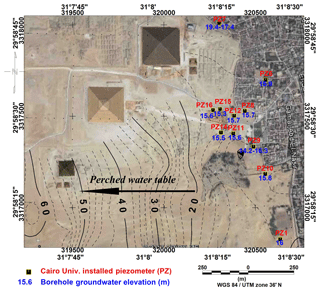
Figure 12Groundwater elevation map from the geophysical data gathered in Giza Plateau and piezometer groundwater levels measured by Cairo University.
Nazlet El-Samman village. This is a suburban area located outside the core of the archeological site. The geophysical surveys SSR-3 and 4 and GPR-2 were conducted in the area (Fig. 5). SSR3 shows a three-layer model and an aquifer layer of velocities 1600–1800 m s−1 with an interpreted water table at an elevation of 17 m. This elevation is fairly matched with the nearest piezometers (6 and 7) in the area where the groundwater elevation is 16–17 m. The aquifer in this part belongs to the Nile alluvium aquifer. This shallow water table might raise the water table level below the Sphinx area (Fig. 5), causing severe hazards.
Sphinx, Sphinx Temple, Valley Temple of Khafre, central field of Mastaba, and Khafre causeway. This is the most important part of the study area where water appeared on the surface at the Valley Temple and the surrounding area of the Sphinx during the year 2007. The locations of the surveys were chosen according to the limited space approved by the Pyramid Archaeological Authority. The locations of the collected data are shown in Fig. 4. Surveys show a good matching among the different techniques; the correlation among different survey results revealed that the groundwater elevation is between 15 and 15.5 m. The base-level elevation of the Sphinx is 20 m, and a safe water table elevation should be 15 m or less. This level is lower than the suburban area of Nazlet El-Samman, which might indicate a recharge of the aquifer below the Sphinx and increase capillary water rise.
Sphinx and Sphinx Temple. GPR-9, SSR-13, and ERI-1 (Fig. 6) were conducted in front of the Sphinx and Sphinx Temple. The integration of these surveys depicts a subsurface three-layer model resulting from SSR 13 and GPR9, and it clearly defines the groundwater aquifer in front of Sphinx Temple. The ERI1 section clearly shows the extension of the aquifer and saturated zone to the third limestone layer. The integrated groundwater elevation from different techniques is about 15.5–15.8 m, as shown in Fig. 6.
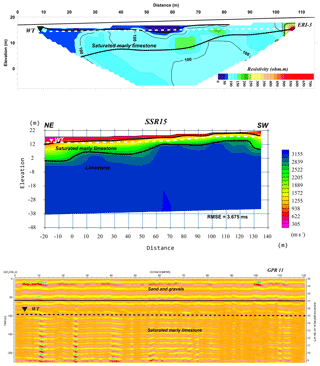
Valley Temple of Khafre and central field of Mastaba. This involves GPR profiles 3, 4, 5, 10, and 11, SSR profiles 5, 6, 7, 8, and 14, and ERI 2 (Fig. 4). The integration SSR-14, ERI-2, and GPR-5 is illustrated in Fig. 7. The integration of these surveys delineates the subsurface layer as well as the aquifer layer. The ERI-2 section shows a high-resistivity zone in the middle of the section that reflects a resistive boundary in the aquifer and more resistive lithology. This high resistivity might be explained by the change in clay and gypsum content in marly limestone; this boundary is not traced on SSR-14. The groundwater elevation is about 15 m as shown in Fig. 7. The tomb of Queen Khentkawes involves GPR-11, SSR-15, and ERI-3 (Fig. 8) conducted near the tomb. The integration of these surveys shows the three-layer subsurface model and aquifer layer. ERI-3 shows a homogenous resistivity with depth as an extension of the aquifer layer. The groundwater elevation is about 14.8–15.2 m in front of the valley tomb of Queen Khentkawes.
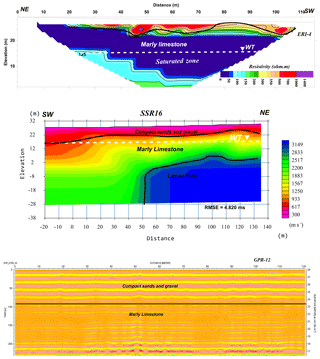
Valley Temple of Menkaure. This involves GPR-12, SSR-16, and ERI-4 conducted near the temple (Fig. 9). ERI-4 shows a high-resistivity top layer and a wet and saturated layer extending at depth. The integration of these surveys in front the of Valley Temple of Menkaure shows that the average groundwater elevation is about 16 m. The groundwater table is not seen on the GPR profile due to the short time window.
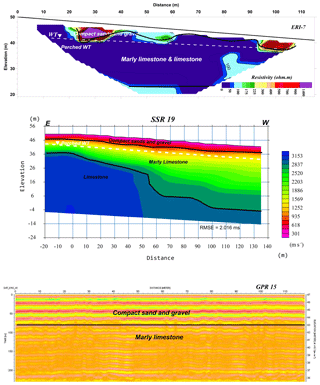
Causeway to Menkaure Pyramid. This involves the GPR-15, SSR-19, and ERI-7 surveys illustrated in Fig. 10 conducted near the causeway to Menkaure Pyramid. ERI-7 shows a relatively high resistivity value of the surface layer where a causeway is a compacted passage. A perched water table is located at an elevation of 43 m. At the Menkaure Queen Pyramids and Menkaure quarry, the surveys were conducted at higher topographic relief, and the correlation of the different techniques revealed that a perched water table might be interpreted at elevations of 45–48 m (Fig. 10).
Table 4 shows a comparison of the groundwater table elevation data recorded by piezometers installed by Cairo University during the year 2018 in the Wadi Temple and Sphinx area (AECOM, 2010). The interpreted water table elevation resulted from the nearest conducted geophysical surveys. There is a relatively small difference among the results, and differences might be related to the pumping effect when the surveys were conducted during 2016, as well as the tolerance in the geophysical data and variation in contact surface between the wet and saturated zones.
Figure 11 represents a cross section using the interpreted results of SSR, ERI, and GPR data to illustrate the difference in groundwater table elevation between the Great Sphinx and the small pyramids of Menkaure. It indicates an increase in groundwater elevation from west to east. The MW6 borehole drilled at a ground elevation of 65 m detected a water table at an elevation of 15 m (AECOM, 2010). The water table to the west might be considered a perched water table due to leakage from mass urbanization, surface runoff, and capillary fracture seepage. Figure 12 represents the compiled groundwater table elevation contour map from the geophysical surveys and groundwater table levels measured from piezometers installed by Cairo University (AECOM, 2010). The present geophysical surveys proved that the pumping systems installed by Cairo University (2008) and AECOM (2010) have lowered the groundwater levels and there is a need for more pumping to compensate for the recharge of water leakage from the surrounding area of the Sphinx. A threat comes from the eastern edge where the Nazlet El-Samman suburb, a golf course, and the Sound and Light Gardens will raise the groundwater level, decrease the outflow from the archaeological area, and consequently raise the water level at the site. A new threat along the western edge of the area is due to the mass urbanization studied by Bekhit et al. (2013), who stated that increasing the head along the western boundary by 1 m reduces the outflow from the western boundary by about 1120 m3 day−1. Decreasing the water head along the western boundary increases the outflow from the western boundary by about 1060 m3 day−1.
The integrated interpretation of ERT, SSR, and GPR surveys was performed at the Great Pyramids of Giza site to successfully investigate the groundwater aquifer and water table elevation and assist hazard mitigation. An integrated interpretation of three-layer models is assumed to depict the subsurface layers and a better delineation of the aquifer layer. The surface layer is composed of sands and gravels with a seismic velocity of 500–1000 m s−1 and a wide range of resistivity between 50 and 1200 Ωm; the thickness varies between 3 and 6 m. The aquifer layer shows a velocity of 1200–2500 m s−1 and a resistivity range of 40–80 Ωm, with a thickness between 8 and 30 m correlated with marly limestone. The third layer shows a high velocity at 2800–3800 m s−1 and a resistivity range of 40–100 Ωm correlated with limestone and dolomite in the saturated zone. The average water table depth is about 15 m, which is safe for the Sphinx where the base foot has an elevation of 20 m. The shallow water table elevation at Nazlet El-Samman village reaches 16–17 m and might recharge the aquifer below the Sphinx and Valley Temple, which is considered a severe hazard on the site. A perched groundwater table might exist in the elevated area toward the west and southwest. Great care should be taken regarding the effect of mass urbanization to the west of the Great Pyramids of Giza, which might affect the groundwater model of the area. A dewatering system should be implemented to avoid such hazards.
The data used in this study are available from the corresponding author upon request.
SMS proposed the paper idea, performed the data interpretation, and edited the paper; KSE proposed the paper idea and contributed to reviewing; MASY collected the field data and performed the data processing; HK provided expertise on the SSR data processing and interpretation and contributed to reviewing; ZED participated in all the fieldwork and shared in the field data, processing, and preparing the figures; NS contributed to reviewing this paper.
The authors declare that they have no conflict of interest.
The authors would like to thank Jothiram Vivekanandan, the chief executive editor,
Nicola Masini, the associate editor, and all expert reviewers
for their constructive comments that improved our paper. The critical
comments of anonymous reviewers largely improved the paper. The Geophysics
Department, Cairo University, furnished all facilities to conduct the
research. IIE-SRF funded the scholarship of Sharafeldin M. Sharafeldin hosted
by the Geophysical Engineering Department, KTU, Turkey. The Supreme Council of
Antiquities, Egypt, granted us permission to conduct the surveys and their assistance
is gratefully acknowledged.
Edited by: Nicola Masini
Reviewed by: four
anonymous referees
Abbas, A. M., Atya, M., EL-Emam, A., Ghazala, H., Shabaan, F., Odah, H., El-Kheder, I., and Lethy, A.: Integrated Geophysical Studies to Image the Remains of Amenemeht- II Pyramid's Complex in Dahshour Necropolis, Giza, Egypt, NRIAG, 2009.
Abbas, A. M., El-sayed, E. A., Shaaban, F. A., and Abdel-Hafez, T.: Uncovering the Pyramids-Giza Plateau in a Search for Archaeological Relics by Utilizing Ground Penetrating Radar, J. Am. Sci., 8, 1–16, 2012.
AECOM (ECG, and EDG): Pyramids Plateau Groundwater Lowering Activity. Groundwater Modeling and Alternatives Evaluation, USAID Contract No EDH-I-00-08-00024-00-Order No.02, 2010.
Annan, A. P.: Ground-penetrating radar, in: Near surface geophysics, edited by: Butler, D. K., Society of exploration geophysicists: Tulsa, Investigations in Geophysics, 13, 357–438, 2005.
Azaria, A., Zelt, C. A., and Levander, A.: High-resolution seismic mapping at a groundwater contamination site: 3-D traveltime tomography of refraction data, EGS–AGU–EUG joint Assembly, Abstracts from the meeting held in Nice, 2003.
Bekhit, H. M., Hassan, A. E., and Abd-Elmegeed M. A.: Effect of urban development, limestone dissolution and preventive mechanisms on the groundwater levels at the Sphinx archaeological area, Egypt, edited by: Hadi, K. and Copty, N., Groundwater Modeling and Management under Uncertainty, ISBN 978-1-138-00012-4, 2013.
Benedetto, A., Tosti, F., Ciampoli, L. B., and D'Amico, F.: An overview of ground-penetrating radar signal processing techniques for road inspections, Signal Process., 132, 201–209, 2017.
Cassidy, N. J.: Ground penetrating radar data processing, modelling and analysis, in: Ground penetrating radar: theory and applications, edited by: Jol, H. M., Elsevier, Amsterdam, 141–176, 2009.
Comas, X., Slater, L., and Reeve, A.: Geophysical evidence for peat basin morphology and stratigraphic controls on vegetation observed in a northern peat land, J. Hydrol., 295, 173–184, 2004.
Daniels, D. J.: Ground penetrating radar, 2nd Edn., Institution of Electrical Engineers, London, 2004.
Dobecki, T. L.: Geophysical Exploration at the Giza Plateau, Egypt a Ten-Year Odyssey. Environmental & Engineering Geophysical Society (EEGS). 18th EEGS Symposium on the Application of Geophysics to Engineering and Environmental Problems, 2005.
El-Arabi, N., Fekri, A., Zaghloul, E. A., Elbeih, S. F., and laake A.: Assessment of Groundwater Movement at Giza Pyramids Plateau Using GIS Techniques, J. Appl. Sci. Res., 9, 4711–4722, 2013.
Grelle, G. and Guadagno, F. M.: Seismic refraction methodology for groundwater level determination: Water seismic index, J. Appl. Geophys., 68, 301–320, 2009.
Griffiths D. H. and King R. F.: Applied geophysics for Engineering and geologists, Pergamon press, Oxford, New York, Toronto, 221 pp., 1965.
Haeni, F. B.: Application of Seismic Refraction Technique to Hydrologic Studies, United States Government Printing Office, Washington, 95 pp., 1988.
Harari, Z.: Ground-penetrating radar (GPR) for imaging stratigraphic features and groundwater in sand dunes, J. Appl. Geophys., 36, 43–52, 1996.
Jol, H. M. and Bristow C. S.: GPR in sediments: advice on data collection, basic processing and interpretation, a good practice guide, in: Ground penetrating radar in sediments, edited by: Bristow, C. S. and Jol, H. M., Geological Society, London, Special Publication, 211, 9–28, 2003.
Loke, M. H.: Tutorial: 2-D and 3-D electrical imaging surveys, Course Notes, 2012.
Loke, M. H. and Barker, R. D.: Rapid least-squares inversion of apparent resistivity pseudo-sections by a quasi-Newton method, Geophys. Prospect., 44, 131–152, 1996.
Mahmoud, A. A. and Hamdan, M. A.: On the stratigraphy and lithofacies of the Pleistocene sediments at Giza pyramidal area, Cairo, Egypt, Sedimentology of Egypt, 10, 145–158, 2002.
Neal, A.: Ground-penetrating radar and its use in sedimentology: principles, problems and progress, Earth Sci. Rev., 66, 261–330, 2004.
Sandmeier, K. J.: The 2D processing and 2D/3D interpretation software for GPR, reflection Seismic and refraction seismic, Karlsruhe, Germany, available at: http://www.sandmeier-geo.de/ (last access: 24 January 2019), 2012.
Schuster, G. T.: Basics of Exploration Seismology and Tomography. Basics of Traveltime Tomography, Stanford Mathematical Geophysics Summer School Lectures, 1998.
Sharafeldin, M., Essa, K. S. , Sayıl, N. , Youssef, M. S., Diab, Z. E., and Karslı, H.: Geophysical Investigation Of Ground Water Hazards In Giza Pyramids And Sphinx Using Electrical Resistivity Tomography And Ground Penetrating Radar: A Case Study. Extended Abstract, 9th Congress of the Balkan Geophysical Society, Antalya, Turkey, https://doi.org/10.3997/2214-4609.201702549, 2017.
Sheehan, J. R., Doll, W. E., and Mandell, W. A.: An Evaluation of Methods and Available Software for Seismic Refraction Tomography Analysis, J. Environ. Eng. Geophys., 10, 21–34, 2005.
Steeples, D. W.: Shallow Seismic Methods, in: Hydrogeophysics, edited by: Rubin, Y. and Hubbard, S. S., the Netherlands, Springer, 215–251, 2005.
Stipe, T.: A Hydrogeophysical Investigation of Logan, MT Using Electrical Techniques and Seismic Refraction Tomography, Degree of Master of Science in Geoscience: Geophysical Engineering Option, Montana Tech., 179 pp., 2015.
Valenta, J. and Dohnal, J.: 3D seismic travel time surveying – a comparison of the time-term method and tomography (an example from an archaeological site), J. Appl. Geophys., 63, 46–58, 2007.
Yehia, A.: Geological structures of the Giza pyramids plateau, Middle East Res. Center, Ain Shams Univ., Egypt, Sci. Res. Ser., 5, 100–120, 1985.
Zelt, A. C., Azaria, A., and Levander, A.: 3D seismic refraction travel time tomography at a groundwater contamination site, Geophysics, 58, 1314–1323, 2006.
Zhang, J. and Toksoz, M.: Nonlinear refraction traveltime tomography, Geophysics, 63, 1726–1737, 1998.


