the Creative Commons Attribution 4.0 License.
the Creative Commons Attribution 4.0 License.
 | 01 Jul 2020
Development of a new centralized data acquisition system for seismic exploration
Feng Guo
Qimao Zhang
Wenhao Li
Yueyun Luo
Yuefeng Niu
Shuaiqing Qiao
Seismic exploration equipment has developed rapidly over the past few decades. One such piece of equipment is a centralized seismograph, which plays an important role in engineering, so improving its performance is of great scientific significance. In this research, the core part of general seismic-data acquisition devices is packaged to develop a centralized seismic-data acquisition system (named CUGB-CS48DAS) that has independent operating ability and high scalability, which can be used for seismic exploration in various engineering uses. Furthermore, by extending and modifying the acquisition circuit and corresponding software, the function of electrical method data acquisition has also been achieved. Thus, the proposed CUGB-CS48DAS makes it possible for joint exploration of seismic and electrical data in a single acquisition station, which is implicitly of great convenience in engineering prospecting as well as a solution to reduce the ambiguity problem. The low power-consumption computer of the system comprises a 24 bit Σ modulation A/D converter and 48 sampling channels with an optional sampling rate of 50 Hz to 64 kHz. With regard to the host computer, the architecture of the control software is smart, and it can integrate the multiple functions of data acquisition, preprocessing, and self-testing. To complete the networking ability and remote monitoring of this proposed system, the technology of the narrow-band internet of things (NB-IoT) was introduced and tested. Field experiments were implemented to prove that the system is stable and convenient to use, and the performance could meet the demand of high-precision joint exploration.
- Article
(4533 KB) - Full-text XML
- BibTeX
- EndNote


The development of seismic instruments has relied heavily on the continuous development of seismic-data acquisition methods (Qiao et al., 2018). Over the last 80 years, seismic exploration instruments have undergone five major developments: the electron tube (optical spot recorders), transistors (analog tape recorders), conventional digital seismographs (digital tape recorders), 16 bit telemetry seismographs, and 24 bit telemetry seismographs (Song et al., 2012). At the beginning of the 21st century, ION and Sercel launched the IV system and the 400 series of fully digital seismographs, respectively, which were recognized as sixth-generation seismographs in the industry. The development of seismic instruments cannot be isolated from the continuous development of seismic-data acquisition methods, combined with the latest technology available at the time. Currently, the development of seismographs is highly dependent on the progress of electronic technology (Zhao et al., 2015), computer science, seismic exploration methods, intelligent control, network technology (Liang and Li, 2016), signal processing, and other disciplines (Zhang et al., 2012); this development mutually reinforces the progress of the aforementioned disciplines.
The change from analog circuits to digital circuits has significantly increased the sampling accuracy, dynamic range, passband width, and number of data channels (Nakagawa, 2011). In terms of hardware circuitry, the presence of an analog–digital conversion acquisition chip and the high-performance conditioning filter circuit allows for a theoretical sampling precision of up to 24 bits and an instantaneous dynamic range of more than 120 dB. In terms of software, the automation of instrument operation allows for simple and convenient data processing.
The integrated framework of the centralized seismograph is usually fixed after entering the digital stage. Consider, for example, engineering seismographs such as SmartSeisST and ES-3000 from Laurel Technologies, whose major structure comprises a sensor (detector) receiving end, a signal conditioning circuit, an analog–digital conversion circuit, a control logic, and a human–computer interface (HCI) along the direction of data flow transmission (Mazza et al., 2012). Therefore, the major structure of the centralized seismograph is relatively stable. The difference between various models lies in the auxiliary equipment (printer, built-in GPS, etc.), the channel number of the acquisition circuit, sample performance parameters, or the instrument interface (Wu et al., 2011). Hence, we can separately package the conditioning circuit, the analog to digital (AD) conversion circuit, the logic controller, and the software into a fixed-core acquisition system. In this system, hardware and software can be customized and extended to acquire data via different seismic exploration methods, thus saving plenty of resources in the development of the instrument.
As is known, the ambiguity problem is hard to overcome with single geophysical method. Thus, an idea of joint inversion with multiple geophysical methods was introduced and has proven to be effective. Under this circumstance, a single instrument which can achieve joint seismic and electrical data acquisition is essential. In 2013, the Italian company named P.A.S.I launched the combined imaging system 16SG24-N for engineering seismic and high-density electrical acquisition. Moreover, the KMS-850 from KMS company can achieve data acquisition of microseismic and multi-functional electromagnetic methods (Zhang et al, 2012). However, the 16SG24-N already went out of production a couple of years ago and was altered by other instruments with a single function. Therefore, the idea came up to develop a combined acquisition system with multiple functions which is easy to use.
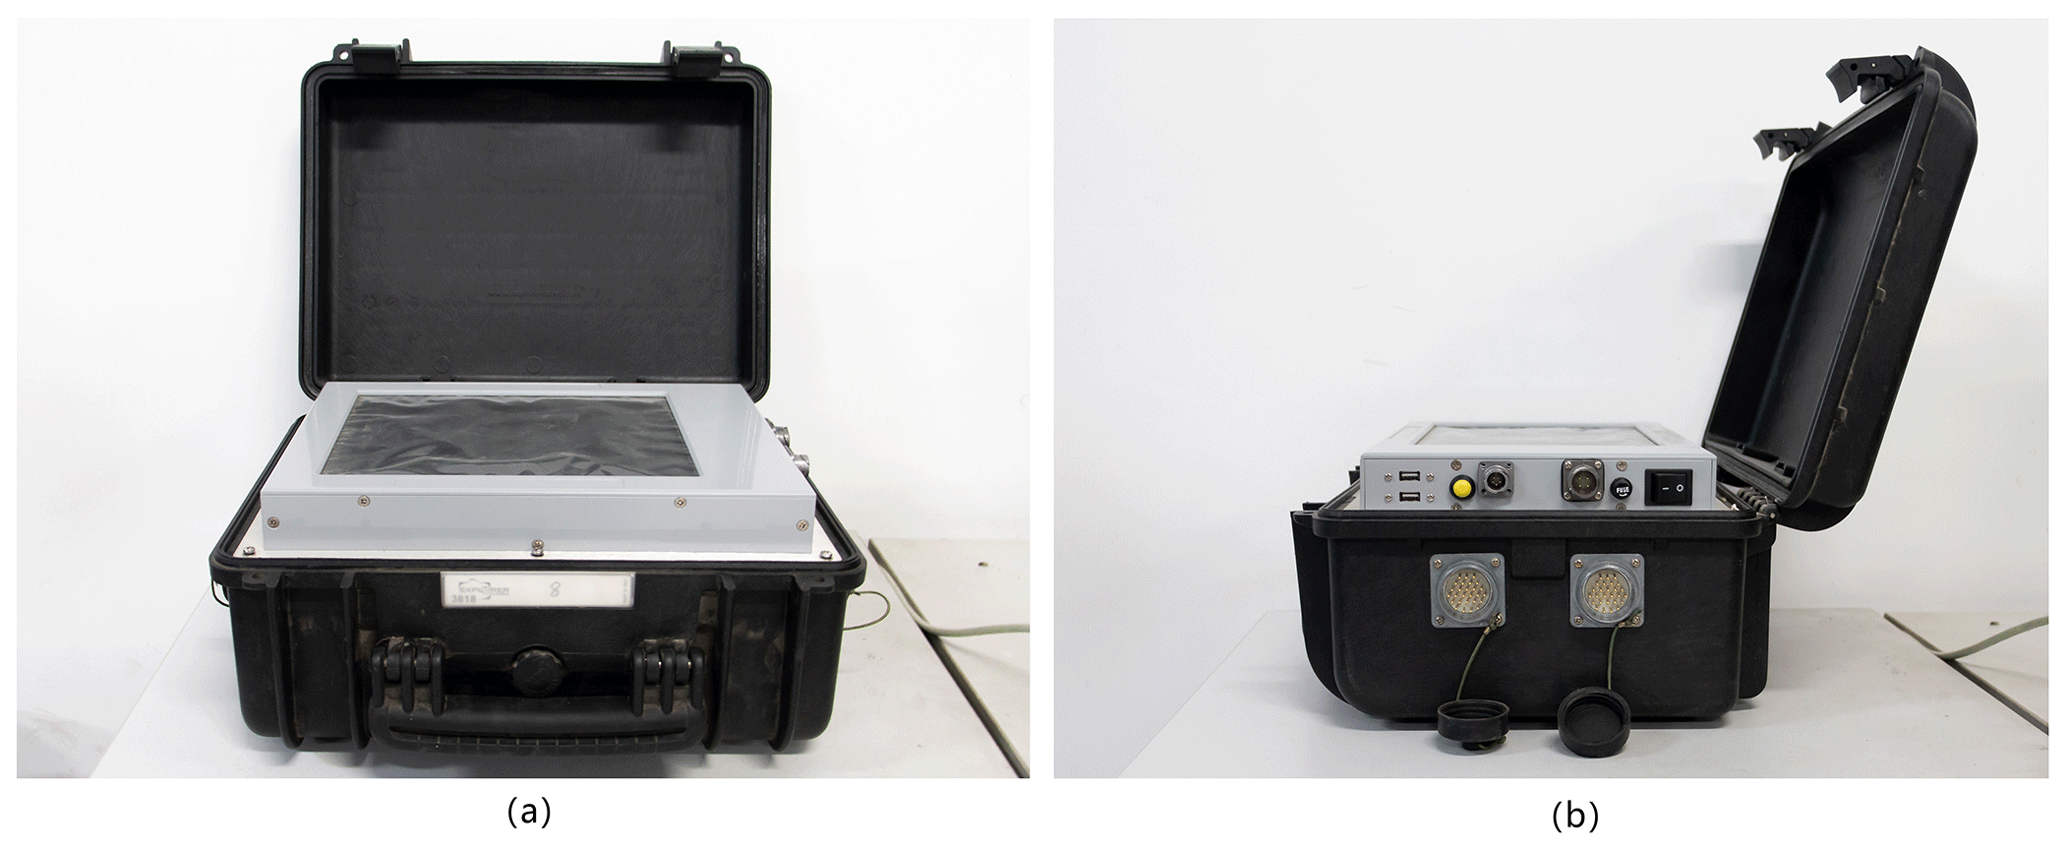
With this idea, a scalable data acquisition system (named CUGB-CS48DAS, shown in Fig. 1) is designed on the basis of the common PC104. The CUGB-CS48DAS data acquisition system can be used for seismic exploration as well as electrical prospecting. It has good application effects in engineering geology, mineral geology, and energy geology, and is suitable for exploration tasks in coalfields, petroleum, minerals, earthquakes, and urban construction, etc. In particular, with the introduction of the technology named narrow-band internet of things (NB-IoT), it will be simpler to realize multi-system networking, which provides great convenience for unified monitoring and management of the acquisition instruments during the exploration.
This paper focuses on describing the hardware and software architecture of the CUGB-CS48DAS system, as well as its implementation mechanism. The feasibility of this system is then demonstrated by using a specific case.
The development of the acquisition system generally involves hardware circuit design and control software development (Marjanovic et al., 2015). The CUGB-CS48DAS system structure is shown in Fig. 2. Basic performance parameters and functions of the acquisition system depend on the hardware circuit, which is essential for ensuring the quality of the acquired data. The operating state of the overall system is coordinated by the software, which is subject to certain fault tolerance and more flexible than the hardware circuit. It is required to encapsulate operations near hardware bottom and provide flexible and safe interfaces, thus both ensuring the system stability and improving its flexibility and portability.
2.1 Hardware architecture
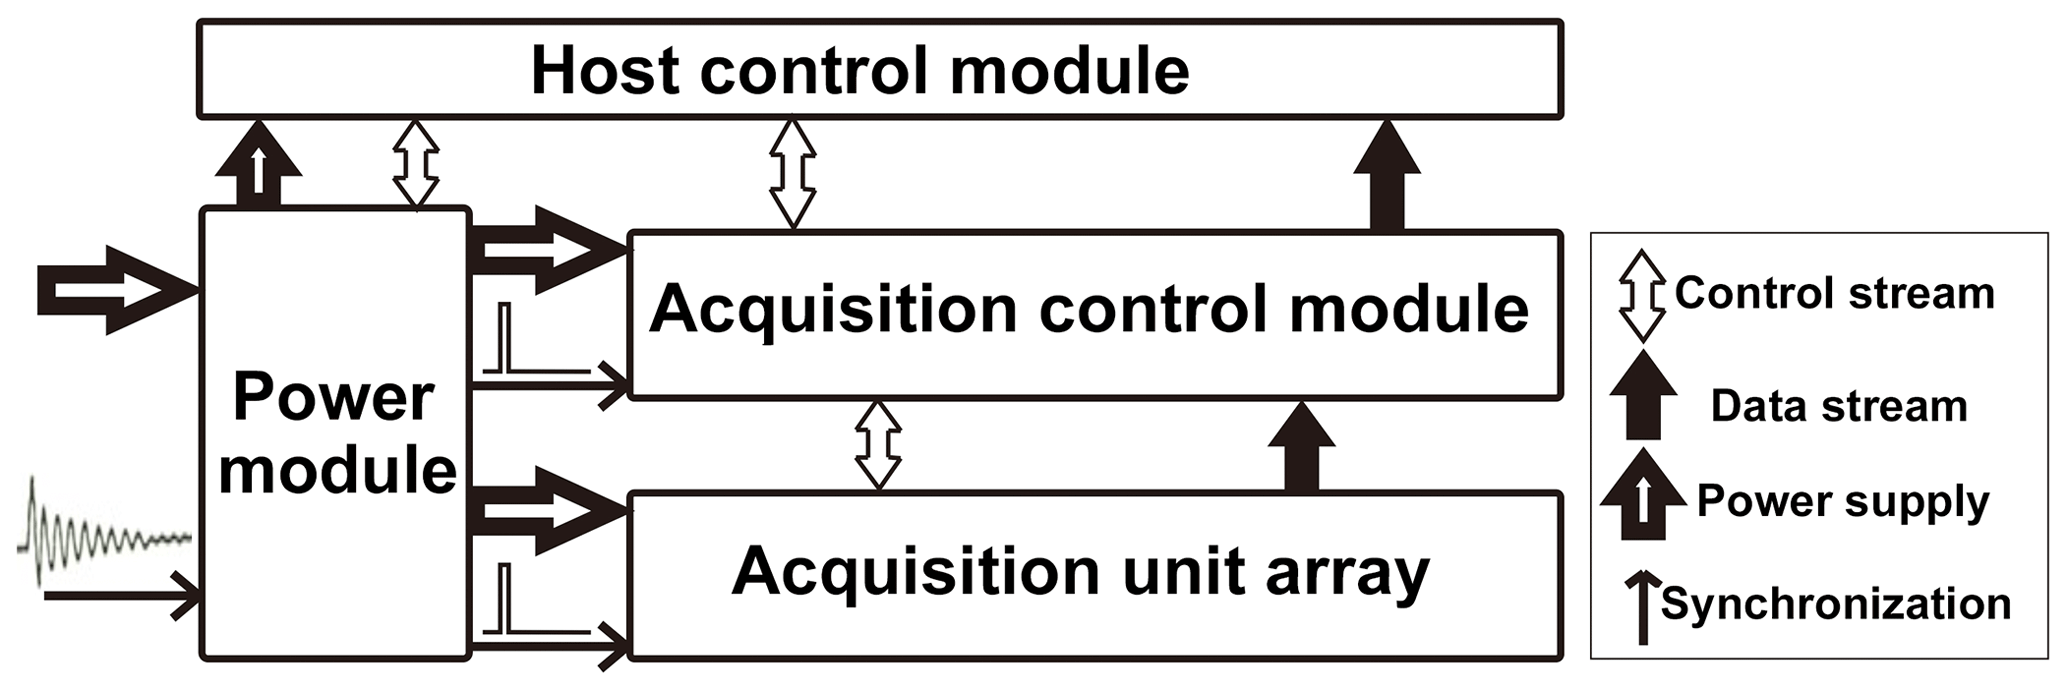
The acquisition system consists of a host control module, a power module, an acquisition control module, and an acquisition unit array; the CUGB-CS48DAS system structure is shown in Fig. 2.
The host control module can implement system status control, data concentration, and human–computer interaction. The module mainly adopts a PC104 (model)-based embedded system with a Windows XP embedded operating system and software written and compiled in MSVC. The host control module itself has two USB 2.0 interfaces, four RS232 serial ports, one 100 Mbps network port, and one screen LVDS (low-voltage differential signalling) port. Two of the four serial ports are used by the host computer to control the operating state of the other modules. The other two ports are reserved for functional extensions. The 100 Mbps network is used for transmitting acquired seismic data. The LVDS data cables are connected to an external LCD screen with adjustable backlight brightness. The USB interfaces are connected to a Bluetooth peripheral as the input device of the instrument.
The power module, which is shown in Fig. 3b, is used to supply power to the system, as well as to monitor all module operating states and to condition acquired synchronizing signals, etc. The module consists of an MCU circuit, a level switch circuit, and a synchronizing trigger circuit. The MCU circuit mainly consists of a C8051F320 microcontroller and related peripheral circuits. It can supply power to different system modules by strobing for relays of the level switch circuit. It also receives operating parameters of circuits via its own AD converter to monitor the operating states of modules. The level switch circuit can convert the external 12 V power into operating voltages required for the sub-modules of the acquisition system. The design needs to provide level switch stability to ensure normal operation of the acquisition system and accuracy of data acquisition. The synchronizing trigger circuit can isolate the acquired synchronizing signals, shape the signals, and then transmit them to the acquisition control module and the acquisition unit array to ensure temporal synchronization of channel data.

Figure 3Internal structure of CUGB-CS48DAS and circuit boards. (a) Packaging structure of circuit boards. (b) Realization of the power supply board. (c) Realization of the acquisition board with 12 channels.
The acquisition control module implements logic control of the acquisition unit array and transmission of acquired data, and details of the acquisition board can be found in Fig. 3c. The modular circuit mainly consists of a field-programmable gate array (FPGA) chip (EP3C25F324I7N) and a 100 Mbps network chip (DM9000). The module function mainly relies on the FPGA. A soft CPU is set up on the FPGA by using system-on-a-programmable-chip (SoPC) technology to communicate with other modules. The circuit module written in VHDL can provide data transmission between modules. Moreover, the network chip DM9000 was introduced in order to realize the communication between the upper computer (PC104) and the acquisition module.
The acquisition unit array comprises multiple acquisition units, each of which consists of one host controller FPGA and one group of AD conversion circuits (ADS1274). The controller can achieve control of conversion circuits and communication for the acquisition control system by setting up an SoPC on the FPGA. The AD conversion circuit mainly comprises three four-channel AD converters (ADS1274) and relevant conditioning circuits.
The internal circuit boards include a main control board, a power supply board, and four acquisition boards, which are inserted in the slot of an aluminium alloy frame as is shown in Fig. 3a. Except for the main control board, all other circuit boards can be removed easily from the slot, thus providing convenience to subsequent upgrade and maintenance. A shielding layer is placed between the power board and the acquisition board to reduce the impact of electromagnetic radiation on the acquired signal.
2.2 System software description
The system software runs under the embedded Windows XP operating system to balance the demand of a graphic display interface and the consideration of the performance limit of PC104. The host computer software is designed on the basis of the MFC provided by Microsoft. The software framework in this study is shown in Fig. 4. The system software architecture comprises an interactive interface, background program, and embedded system. The drawing module, methods manager, and document manager of the interactive interface can be adjusted or replaced depending on actual method requirements. The process controller of the background program is the core of the software that provides a functional interface for interface software development.
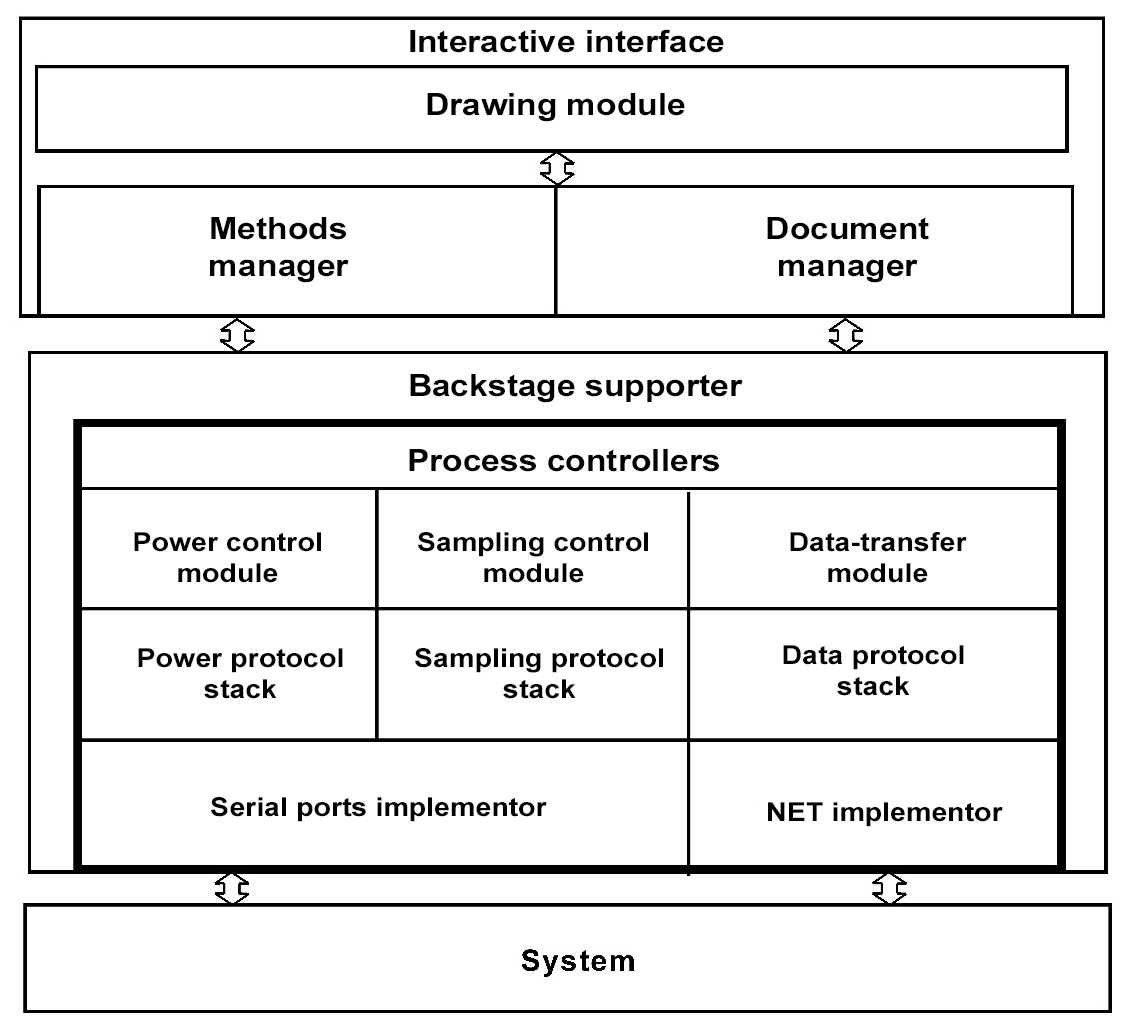
The process controller is mainly designed to enable the host computer control system to communicate with the power supply and the acquisition control system, and it can complete a full set of acquisition processes based on different methods and monitor the operating states of the instrument parts. The process controller comprises three basic units (a power control unit, a data acquisition control unit, and a data transmission unit) to provide services. Each unit consists of three layers, i.e. the implementation layer, protocol layer, and control layer. The implementation layer facilitates communication between the software and the underlying operating system. The protocol layer can parse data of the drive layer to find corresponding commands or data in the protocol table. The control layer, as a functional interface for the above two layers, can transmit messages corresponding to commands, so that each module can complete a series of tasks under the management of the process manager.
The exploration methods manager uniformly converts exploration methods selected on the HCI and relevant parameters to a data structure that can be identified between software modules and that can ensure parameter synchronization between modules.
The document manager can read and format raw data. Format templates for data storage are selected based on specific exploration methods. For example, seismic exploration methods are converted to SEG-2, SEG-Y, and other formats.
The drawing module is used for the graphical display of data. It is designed to manage acquisition parameters and actual data blocks, as well as handle graphic display operations for users.
It is critical for the overall acquisition system to achieve a complete, stable, and portable acquisition workflow. In the acquisition process, the process controller of the host control module plays an important role. Communication protocols and workflows between modules are defined by the process controller, which determines the operating state of the overall system. The process controller also acts as the hardware emulation layer in the aspect of architecture development, providing the software interface of the instrument with a complete application interface, which is essential for the overall acquisition system to possess high project portability.
3.1 Packaging design of process controller
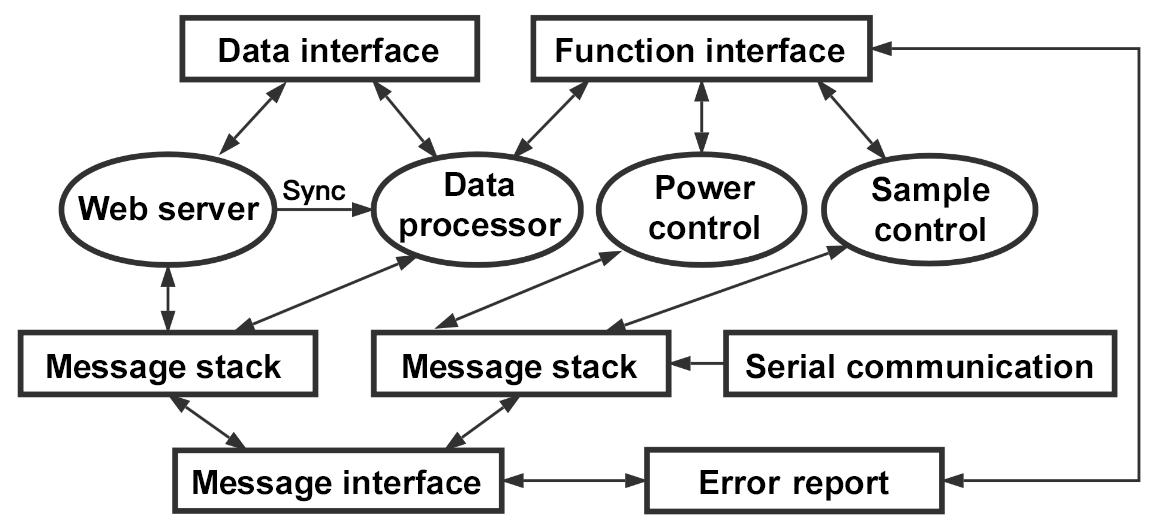
The packaging design of a process controller is shown in Fig. 5. The process controller can provide a data interface, functional interface, and message interface for the host control system software, implementing data communication and parameter setting as a pure software program.
When the process controller works, multiple threads and tasks will start simultaneously and data as well as message communication will be required between the functional layers and between the sub-modules. In order to ensure normal software operation, communication between threads under the same sub-module should be regulated via a synchronizer and communication between functional layers should be regulated via a message stack. Part of the message stack is packaged as an interface to facilitate the flexibility of the process controller. The two message stacks in Fig. 5 have a different use. The one connected to the web server and data processor is related to data upload, which is achieved through the network due to the large data volume, and represents the network data receiver based on UDP protocol in the upper computer software. Another message stack is used to transmit the command and control messages through UART. These two types of message stacks work separately to complete the whole data acquisition process.
The data interface partitions part of the memory area in service as the hard disk (HD) area by using the RAM disk. The user interface is in essence used for the mapping of cache files in the memory area. It can ensure high access speed of cache files and security in file sharing.
The functional interface mainly provides performance functions and public variables for operating the process controller, such as the sub-module state inquiry and configuration.
The message interface consists of a process message table and message allocation threads. The process message table is subject to the fixed priority setting, to collect and distribute messages of the process controller at work. Generally, error messages are at top priority, followed by network data-related messages, with a view to ensure the instrument stability and high transmission rate of acquired data. The message sent from the serial port is at low priority, followed by a return message. It involves operating the relay of the lower computer and other hardware configured with a low speed (≥100 ms), so the requirement for a response time is low. Each sub-module has its own message stack. Communication between sub-modules and that between sub-module and the process controller are assigned via a message interface at the upper level.
3.2 System acquisition process design
Single data acquisition is the most basic unit for system acquisition. Other acquisitions of the system are achieved by adjusting or calling the single data acquisition.
For each acquisition, the power of the acquisition control module and the acquisition unit array has to be turned on; we then have to wait for the termination of initialization and then for the configure acquisition parameters for the acquisition control module. For formal acquisition, a command shall be sent to the acquisition control module to make it ready and return a message to the host computer; the host computer then enters the data receiving mode. The acquisition control module transmits data to the host computer via the network. After the host control system receives network data packages, the data-transfer unit will receive and process the data package. After the acquisition is completed, the data-transfer unit will enter the preprocessing mode to collate and cache the data. Next, the acquisition mode is determined. The data will be processed by self-test procedures to obtain a self-test report when the instrument self-test is conducted. For normal acquisition, the data will be sent to the document manager and the drawing unit for processing. When the continuous acquisition is completed, the process controller will reset and turn off the acquisition control module and the acquisition unit array.
In the acquisition system, the actual data-transfer rate and the preset sampling rate share a linear relationship. The effective data-transfer rate should reach 16 Mbps for normal operation. Test results have shown that the data-transfer rate between the acquisition control module and the data acquisition unit array can reach 100 Mbps, and that between the acquisition control module and the host control module can reach 90 Mbps, while the data receiving rate of the host control module is generally about 16 Mbps.
Data receiving in the host control module is a bottleneck for the entire system. Hence, the thread concurrency should be minimized in the single acquisition design in order to improve the data-transfer rate and stability of the system. In particular, data receiving is separated from data feedback on the HMI (human–machine interface), while the timing query of the message stack is used in the drawing part to confirm the data acquisition progress and display it on the interface. After the abovementioned processing, the host control module can attain a data receiving rate of up to 90 Mbps, which can meet the demand of normal operation (16 Mbps).
3.3 System data transmission technology
For the convenience of indoor data processing and interpretation of seismic data, field data collection accuracy has to be high and the bit error rate has to be low. To ensure the accuracy of data, the collected seismic data need to be encoded and then sent from the acquisition unit to the acquisition control module. The transmission coding method of CUGB- CS48DAS uses Manchester encoding, which has the advantage of being able to extract the synchronization clock from the signal more easily.
The encoding process is completed in the acquisition unit, and the encoding module is written in VHDL. The parallel data in bytes are converted into one bit serial data which are encoded in the form of Manchester encoding. During the encoding process, binary “0” is converted to “01” and binary “1” is converted to “10”. Since the receiving end needs to align the valid edge with a certain period of time to achieve constant synchronization, a preamble must be sent before sending one frame of data. Then the encoded data are transmitted via LVDS which takes advantage of low noise and low power consumption.
The acquisition control module receives the data from acquisition unit through the LVDS interface. After receiving the preamble, the receiving end will complete the clock synchronization in several data cycles. The decoding module, which is also written in VHDL, uses a clock 8 times that of the data speed to detect the data jumps during the effective jumping time. Once the data have an early or a delayed transition, the decoding module automatically aligns with the new edge. In this way, the data can be allowed to shake to a large extent without causing bit errors. Besides, the decoding module also cope with eight synchronized header determinations and byte synchronization, etc. Eventually, the data are saved in the SDRAM and they can be acquired by the host control module through a 100 Mbps network.
As known from the system description, the overall system can independently perform basic functions such as instrument self-testing and data storage by using the process controller and the core hardware. Therefore, the process controller and core hardware can be packaged as a whole to provide technical support for other acquisition systems with different functions.
The porting of the acquisition system is accomplished in three steps. (1) The acquisition systems should be able to meet project performance requirements. (2) In terms of hardware, the circuit board size and the layout of device connectors and modules should be adjusted. (3) In terms of software, the process controller interfaces should be compiled with the interactive interface, methods manager, document manager, and drawing module.
It is easy to implement this method technically. In terms of hardware, the logic control part is included in the FPGA chip with a generally fixed interface, and it can be easily upgraded. In terms of software, the process controller is as assumed to be an independent linkbase. The methods manager, the document manager, and the drawing module can use it for joint compilation. Even the scripting language is used to provide an interactive interface function, thus greatly enhancing system reusability.
The acquisition system has been verified in actual engineering applications. In addition, some cases are employed to demonstrate great scalability of the system.
4.1 Application of centralized seismic exploration instrument
CUGB-CS48DAS is an engineering seismic exploration instrument obtained by customizing certain functions of the core acquisition system. The monitoring mechanism of the power module and data acquisition mechanism of the acquisition control part are optimized. Nine common engineering seismic exploration methods such as coverage measurement, reflection, refraction, and surface wave are included in the method selector of the host control system. Some interfaces of the drawing module and the document manager are modified.
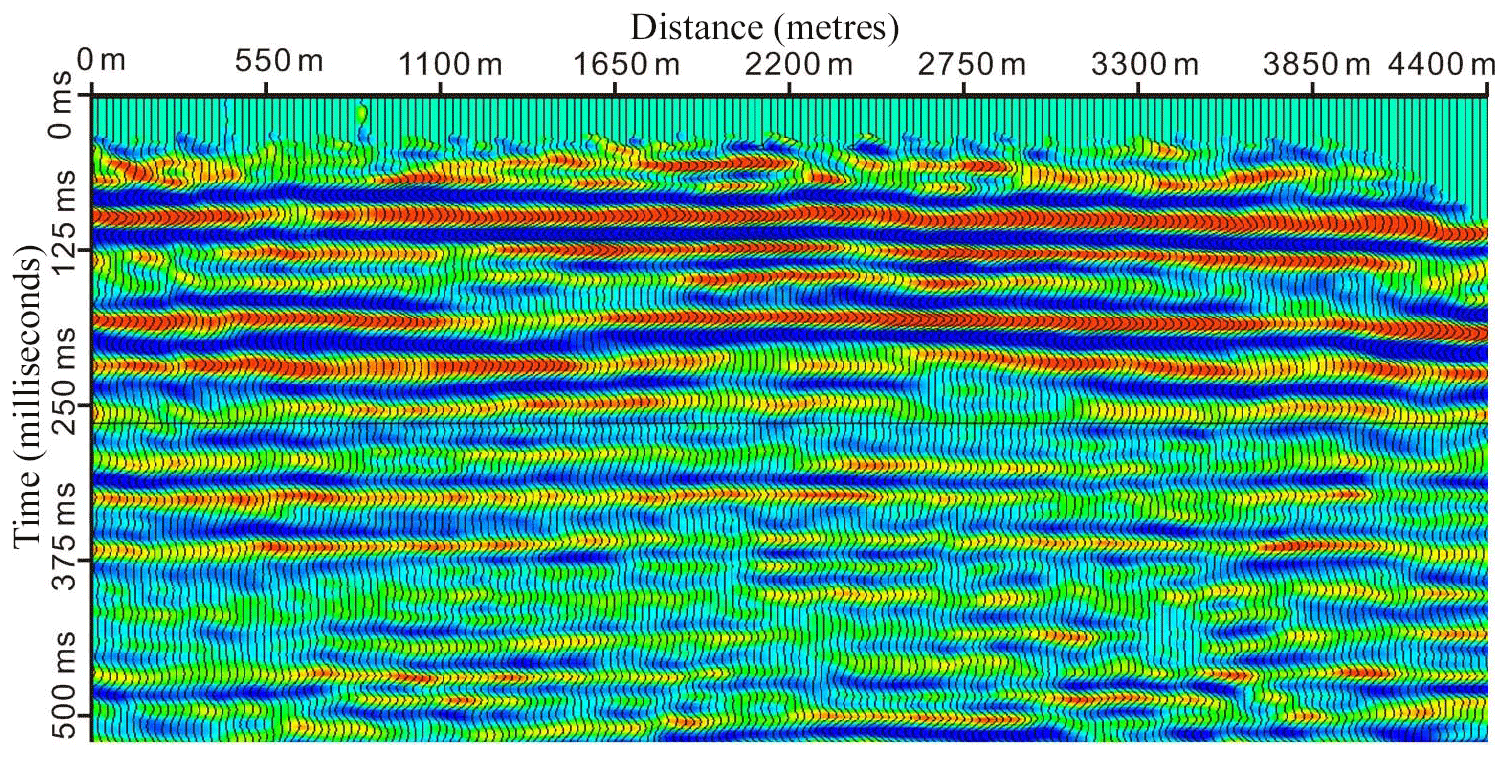
The instrument was used for a 2-week seismic exploration in an area of Golmud City, Qinghai Province in 2013; the total measuring line length was 4.4 km, the seismic migration profile is shown in Fig. 6. The exploration adopted the CDJ-Z/P60 geophone of the Chongqing Instrument Factory (technical parameters are listed in Appendix A) and explosives as seismic sources. The sampling rate was 4 kHz, with 2048 sampling points and 24 channels. Seismic surveying utilizes the coverage measurement method.
4.2 Realization of distributed seismic exploration instrument
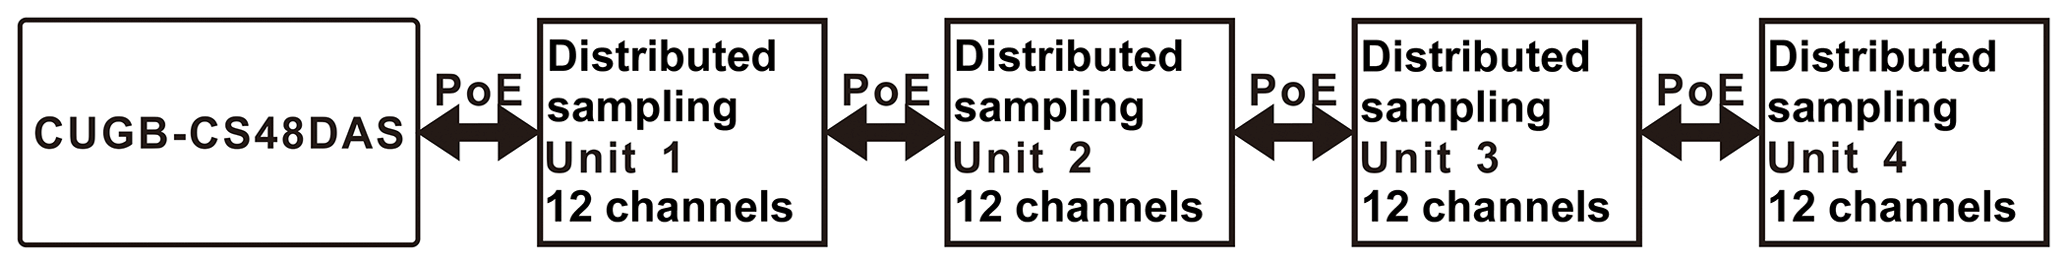
CUGB-CS48DAS was designed to provide additional distributed acquisition station functions on the basis of 48 channels to the original system and achieve data transfer and command control via network cables. Distributed control was added to the acquisition control system on the hardware layer. In the host control system, the operating interface, the drawing module, and the document manager were modified and 48 sampling channels were extended to 96; the system diagram is shown in Fig. 7 – it connects CUGB-CS48DAS and Distributed Sampling Unit with PoE (Power Over Ethernet).
4.3 Extension of electrical prospecting
In August 2014, an extension of the electrical prospecting function was achieved on the basis of the CUGB-CS48DAS seismograph. The extension of geophysical electrical prospecting is shown in Fig. 8. An electrical prospecting controller and an electrical transmitter were added to the original system, and sensors were changed to electrodes. Moreover, modifications were implemented in the original acquisition boards designed only for seismic-data acquisition to meet the needs of electrical data acquisition as well. Mainly, the cut-off frequency of low-pass filter became optional up to 3 kHz when acquiring electrical data. Particularly, 50 Hz power frequency filter circuits were added to realize a −82 dB attenuation on that frequency point. The host computer of the original system was directly connected to the electrical prospecting controller via serial ports. The overall acquisition process can be controlled using the electrical prospecting controller which controls the electrode channel configuration and operating state of the electrical transmitter based on host computer commands. The main part of the electrical transmitter is the medium-power generators used for geophysical electrical prospecting of the measured area, so that the measured objects show electrical characteristics (such as apparent resistivity and apparent polarizability). By controlling the electrical transmitter and changing the frequency and waveform of the emission current, the measurements of the induced polarization method in both frequency domain and time domain can be performed.
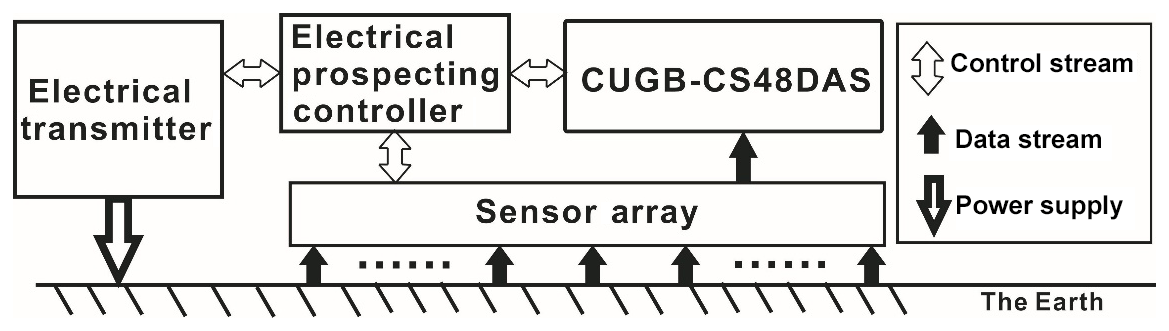
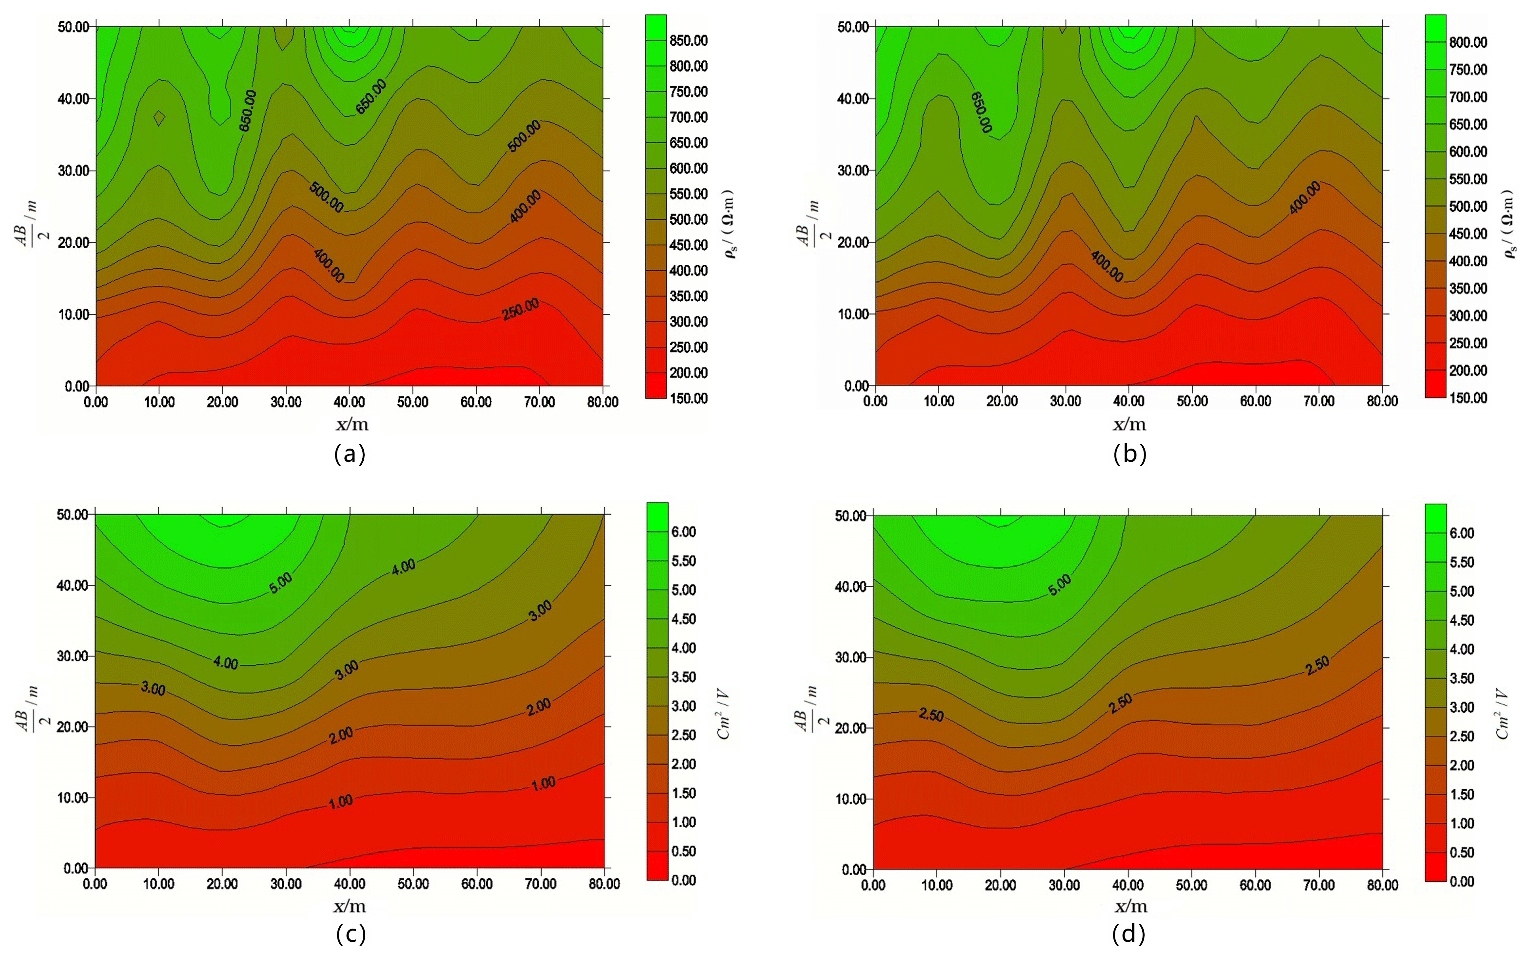
Figure 9Pseudo-sections of field comparative experiment. (a) Pseudo-section of apparent resistivity by DUK-2A. (b) Pseudo-section of apparent resistivity by CUGB-CS48DAS. (c) Pseudo-section of apparent polarizability by DUK-2A. (d) Pseudo-section of apparent polarizability by CUGB-CS48DAS.
A field comparative experiment was then implemented in the suburban area of Beijing, in contrast with the high-density electrical prospecting instrument of Chongqing Instrument Factory named DUK-2A. The pseudo-sections of apparent resistivity and apparent polarizability are shown in Fig. 9. As is indicated in Fig. 9a and b, the pseudo-sections of apparent resistivity obtained by both instruments present high consistency; the trend is not affected by resistivity variation or the approximate appearance and thickness of different layers. It could also be found that there are some differences between Fig. 9a and b presented as small scaled anomalies. This is because the two instruments were not placed at exactly the same location and some errors were introduced during the inversion process. Figure 9c and d are illustrations of apparent polarizability. According to this, it is easy to see that the contours of apparent polarizability acquired by the proposed instrument are well superimposed with that obtained using DUK-2A.
Therefore, it can be proven that the performance of CUGB-CS48DAS used as an electrical exploration receiver is in compliance with the requirements and has application value for joint seismic and electrical prospecting.
4.4 Connection to the internet of things
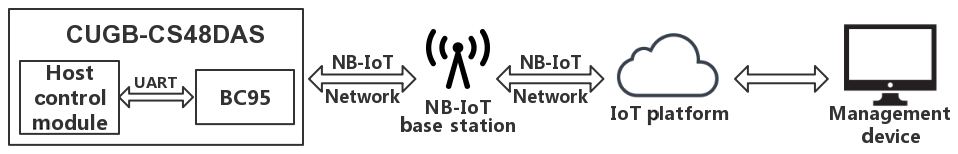
Recently, the introduction of the NB-IoT chip named BC95 has enabled a connection to the internet of things. Via the UART interface, data exchange between the host control module and BC95 can be accomplished. A commercial network has become available thanks to the internal GSM/GPRS module of BC95. When constructing urban underground space monitoring and natural disaster warning systems, we hope to deploy seismic acquisition stations in the areas covering the entire city to monitor the activity of underground media. However, it is not simple to build up a communication network covering a large area between acquisition stations and the central station if real-time quality control (QC) is expected. Taking the node seismographs systems as an example, the wireless data transmission methods between nodes and the central station are mainly as follows: (1) a relay-type transmission based on a multi-hop network, for example the scheme of the WTU-508 system; (2) a wireless data transmission scheme based on a high-power directional access point (AP) connecting directly with the central station using the star topology. Of these, the multi-hop network has a short single-station interval, and the communication distance of the directional AP is basically ideally no further than 5 km. Therefore, there are plenty of limitations that cannot adapt to the complex environment of the city. The LTE-based data transmission method is also one of the strategies because extra communication network could be omitted, but the LTE network coverage capability is not satisfying. In fact, the base station of NB-IoT can increase the gain by 20 dB compared with that of LTE (Adhikary et al., 2016), which means that stations can communicate normally in buildings and even underground garages and other places with obstacles. Another advantage of NB-IoT is that there is no need to build an extra communication network. These advantages altogether provide great convenience for the layout of seismic instruments. In addition, with the cloud server of NB-IoT, it is also easy to establish a QC monitoring centre without setting up an instrument vehicle or a central station like that in a traditional seismic survey.
As is illustrated in Fig. 10, the proposed CUGB-CS48DAS acts as the terminal device, and data from host control module are sent to the BC95 through the UART interface, then uploaded to the IoT open platform via NB-IoT base stations. The uploaded data could then be accessed by management device, which is usually a PC, after the processing of application services to distinguish between the data according to their type. Conversely, commands can also be sent to the terminal device from management device to control the acquisition process.
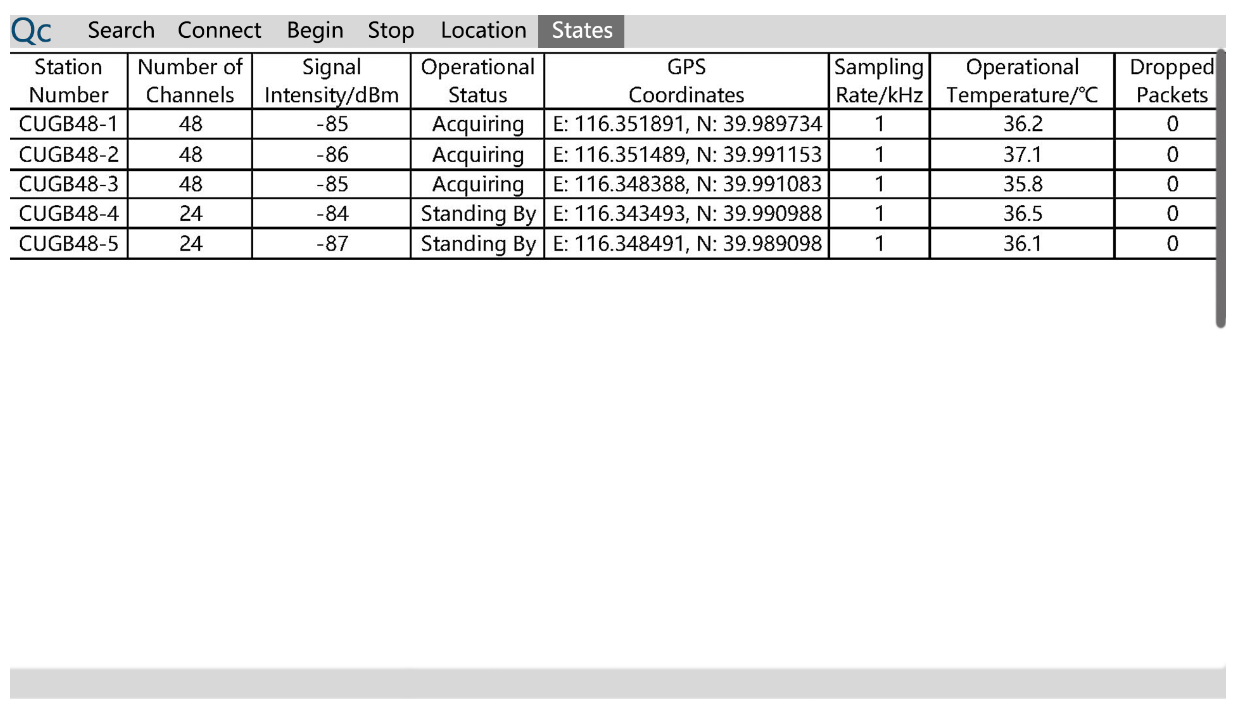
Figure 11QC monitoring interface.
As we can see, a screenshot of QC monitoring interface during a communication experiment we implemented is shown in Fig. 11. In total, five test points on campus were selected to observe the network quality and communication speed. CUGB48-1 was placed under a tree with relatively lighter occlusion. CUGB48-2 was placed near a big statue on the grass. CUGB48-3 was placed in the bush near a road. CUGB48-4 was placed in the laboratory near the window. And the last CUGB48-5 was placed right in an open area. We used the indicator reference signal receiving power (RSRP) to represent the signal intensity as is shown in Fig. 11. Generally speaking, the RSRP of five test points is around −85 dBm, which stands for good points of network quality. We then uploaded the acquired data file using each of the CUGB-CS48DAS stations to evaluate the average data uploading speed, and it turned out to be 192.32 206.53, 189.84, 182.06, and 226.50 kbps. Under such circumstances, QC monitoring and acquisition control can be realized as designed.
After conducting tests and analysis in the laboratory and in the field, the acquisition system developed has the following performance indicators:
-
an embedded Windows XP data acquisition interface that supports methods of surveying coverage measurement, reflection, and refraction; the system will be able to expand the collecting function of geophysical electrical prospecting;
-
low-pass filtering: 0.8 FN (digital filter);
-
sampling rate: 50 Hz to 64 kHz;
-
word length: 24 bits;
-
power supply: DC 12 V;
-
crosstalk rejection ratio: ≥80 dB;
-
dynamic range: 120 dB at 0.4 kHz BW (1 kHz sampling rate);
-
total harmonic distortion: −105 dB;
-
CMRR: >102 dB;
-
stop-band attenuation: >120 dB (above the Nyquist frequency);
-
noise (DC to 200 Hz): 450 nV RMS at 0 dB;
-
data transmission speed: 90 Mbps;
-
synchronization accuracy: <200 ns;
-
operating temperature: −20 to +70 ∘C.
Table 1Comparison of parameters between 16SG24-N and CUGB-CS48DAS.

Compared to the 16SG24-N, which represents the advanced level of combined system for seismic and electrical instruments, it can be found in Table 1 that the proposed CUGB-CS48DAS does not have obvious disadvantages and even outcompetes the 16SG24-N in some aspects like dynamic range and the number of channels etc. Therefore, CUGB-CS48DAS is proven to be a competitive and practical choice for a joint seismic and electrical prospecting instrument with a smaller budget.
5.1 System power consumption
We measured the different currents with a multimeter after each DC-DC to evaluate the system power consumption. In standby mode, which is the most common state, the power consumption is 2.065 W. In working condition, each acquisition board reaches a maximum power consumption of 2.66 W at the highest sampling rate 64 ksps. When all four acquisition boards (48 channels) work at the same time, the system power consumption reaches 12.705 W, which is also the maximum power consumption of the system.
The system we designed is powered by an external 12 V power source; therefore, there are different ways to solve the energy problem in the field. A single station can be powered by a custom made 12 V output lithium battery that is sustainable for 15 h. The other way is to utilize the power station we designed to supply power to multiple stations simultaneously. In this way, the power supply is more stable than using the battery directly.
In this study, a new type of centralized data acquisition system was designed, based on the SoPC technique. Through a research and development program, the following technical aspects were explored:
-
In accordance with the framework and actual results, CUGB-CS48DAS is a complete and independent acquisition system. Practical applications and extension cases show the system has better scalability and portability, with scope for use in many applications. Further standardization of the application interfaces of the system is expected, along with a reduction in cost. We will attempt to apply this system to data acquisition tasks besides geophysical exploration.
-
The seismic exploration data acquisition and processing technology using the SoPC technique as the master control core: this technology introduces the most recent SoPC technique into engineering seismic exploration, which reduces power consumption while improving seismograph resolution and synchronization accuracy. The system can also be flexibly embedded into the seismic exploration data processing algorithm in the form of hardware.
-
A 48-channel, 24 bit high-precision parallel AD conversion technique: the multi-channel seismic-data acquisition performed in existing engineering seismic exploration uses only one AD converter, resulting in poor synchronization when carrying out time-shared data acquisition, whereas in this design, every channel uses a separate high-precision AD converter to provide synchronization precision.
-
CUGB-CS48DAS can solve the ambiguity problem in geophysical prospecting by implementing joint seismic and electrical exploration. As the single method of present geophysical prospecting has ambiguity problems and thus cannot be refined. Therefore, this new centralized data collection system is proposed to provide technical means of solving ambiguity problems while offering useful exploration for joint geophysical prospecting. As a result, the proposed CUGB-CS48DAS becomes a novel supporting equipment with high synchronization precision and acquisition accuracy for joint geophysical seismic and electrical prospecting.
-
The introduction of embedded Windows XP technology has improved the human–machine interactive interface of an engineering seismograph.
-
The application of NB-IoT makes easy networking between multiple CUGB-CS48DAS stations and real-time QC monitoring possible.

Our research is supported by national projects; thus the data are not publicly accessible according to the confidentiality agreement.
FG was in charge of paper composing, hardware design, and implementing evaluation experiments. QisZ was in charge of paper revision and uploading and the design of the entire structure. QimZ was in charge of software top-level architecture design. Wenhao Li was in charge of part of the hardware circuit design and implementing test experiments. YL was in charge of the software programming and evaluation tests. YN and SQ were in charge of the acquisition circuit realization.
The authors declare that they have no conflict of interest.
This research has been supported by the National Natural Science Foundation of China (grant nos. 41574131 and 41204135), the National “863” Program of China (grant nos. 2012AA061102 and 2012AA09A20102), the National Major Scientific Research Equipment Research Projects of China (grant no. ZDYZ2012-1-05-01), and the Fundamental Research Funds for the Central Universities of China (grant no. 2652015213).
This paper was edited by Jean Dumoulin and reviewed by two anonymous referees.
Adhikary, A., Lin, X., and Wang, Y.: Performance Evaluation of NB-IoT Coverage, C. 2016 IEEE 84th Vehicular Technology Conference (VTC-Fall), 1–5, https://doi.org/10.1109/VTCFall.2016.7881160, 2016.
Liang, G. and Li, W.: Some thoughts and practice on performance improvement in distributed control system based on fieldbus and ethernet, J. Mea. Control, 49, 109–118, 2016.
Marjanovic, D., Grozdanovic, M., and Janackovic G.: Data acquisition and remote control systems in coal mines: a serbian experience, J. Mea. Control, 48, 28–36, 2015.
Mazza, S., Basili, A., Bono, A., Lauciani, V., Mandiello, A. G., Marcocci, C., Mele, F., Pintore, S., Quintiliani, M., Scognamiglio, L., and Selvaggi, G.: AIDA–Seismic data acquisition, processing, storage and distribution at the National Earthquake Center, J. Ann. Geophys., 55, 541–548, 2012.
Nakagawa, S.: Split Hopkinson resonant bar test for sonic-frequency acoustic velocity and attenuation measurements of small, isotropic geological samples, J. Rev. Sci. Instrum., 82, 044901, https://doi.org/10.1063/1.3579501, 2011.
Qiao, S., Duan, H., Zhang, Q., Zhang, Q., Li, S., Liu, S., Liu, S., Wang, Y., Yan, S., Li, W., and Guo, F.: Development of high-precision distributed wireless microseismic acquisition stations, Geosci. Instrum. Method. Data Syst., 7, 253–263, https://doi.org/10.5194/gi-7-253-2018, 2018.
Song, K. Z., Cao, G. P., Yang, J. F., and Cao, P.: A high-precision synchronous sampling approach for large-scale distributed Wire sensor networks in seismic data acquisition systems, J. Instrum. Sci. Technol., 40, 567–579, 2012.
Wu, Z. Q., Wu, S. G., Tong, S. Y., Liu, H. S., and Zhang, Y. B.: A study on seismic acquisition basic on marine carbonate hydrocarbon exploration in the southern Yellow Sea, J. Chin. J. Geophys., 54, 1061–1070, 2011.
Zhang, Q. S., Deng, M., Cui, J. L., and Wang, Q.: Research and development of one novel distributed digital seismic acquisition station, J. Adv. Inf. Sci. Serv. Sci., 4, 184–190, 2012.
Zhao, X., Zhang, Q. S., and Deng, M.: Super class-AB bulk-driven OTAs with improved slew rate, J. Electron. Lett., 51, 1488–1489, 2015.