the Creative Commons Attribution 4.0 License.
the Creative Commons Attribution 4.0 License.
 | 06 Sep 2021
Observation of the rock slope thermal regime, coupled with crackmeter stability monitoring: initial results from three different sites in Czechia (central Europe)
Jan Blahůt
Filip Hartvich
This paper describes a newly designed, experimental, and affordable rock slope monitoring system. This system is being used to monitor three rock slopes in Czechia for a period of up to 2 years. The instrumented rock slopes have different lithology (sandstone, limestone, and granite), aspect, and structural and mechanical properties. Induction crackmeters monitor the dynamic of joints, which separate unstable rock blocks from the rock face. This setup works with a repeatability of measurements of 0.05 mm. External destabilising factors (air temperature, precipitation, incoming and outgoing radiation, etc.) are measured by a weather station placed directly within the rock slope. Thermal behaviour in the rock slope surface zone is monitored using a compound temperature probe, placed inside a 3 m deep subhorizontal borehole, which is insulated from external air temperature. Additionally, one thermocouple is placed directly on the rock slope surface. From the time series measured to date (the longest since autumn 2018), we are able to distinguish differences between the annual and diurnal temperature cycles of the monitored sites. From the first data, a greater annual joint dynamic is measured in the case of larger blocks; however, smaller blocks are more responsive to short-term diurnal temperature cycles. Differences in the thermal regime between the sites are also recognisable and are caused mainly by different slope aspect, rock mass thermal conductivity, and colour. These differences will be explained by the statistical analysis of longer time series in the future.
- Article
(7734 KB) - Full-text XML
- BibTeX
- EndNote


Rock slope stability is crucially influenced by both rock properties and exogenous factors (D'Amato et al., 2016; Selby, 1980). The physical properties of rock are well known, and numerous laboratory experiments and theoretical works exist in this field. However, there are very few in situ experiments that deal with real-world scales (Fantini et al., 2016; Bakun-Mazor et al., 2013, 2020; Janeras et al., 2017; Marmoni et al., 2020; Isaka et al., 2018). Moreover, all these studies are focused on the monitoring of a single, well-known unstable rock slope.
Thermal expansion and frost action together with severe rainfall events are the main exogenous physical processes of the mechanical weathering of a rock surface (Krautblatter and Moser, 2009). Together with chemical weathering, these ultimately result in the weakening of rocks slopes and reduction of their stability (Gunzburger et al., 2005, Vespremeanu-Stroe and Vasile, 2010; do Amaral Vargas et al., 2013; Draebing, 2020). The loss of stability, caused by repeated changes in the stress field inside the rock, eventually leads to a rockfall, one of the fastest and most dangerous forms of slope processes (Weber et al., 2017, 2018; Gunzburger et al., 2005). In the alpine environment, rockfalls are increasingly caused by permafrost degradation and frost cracking (Gruber et al., 2004; Ravanel et al., 2017), or temperature-related glacial retreat (Hoelzle et al., 2017). To address the influence of permafrost melting on the rock slope stability, several monitoring systems/campaigns were proposed. Magnin et al. (2015a) constructed a monitoring system consisting of rock temperature monitoring both on the rock face and in-depth sensors. In-depth rock mass temperature monitoring was placed in up to 10 m deep boreholes. The monitoring was coupled with electrical resistivity tomography (ERT) campaigns to determine sensitive permafrost areas (Magnin et al., 2015b). Girard et al. (2012) introduced a custom acoustic emission monitoring system for quantifying freeze-induced damage in rock. An extensive monitoring system for permafrost activity in Switzerland is presented by Vonder Mühll et al. (2008) and Noetzli and Pellet (2020). Additionally, a significant percentage of small rockfalls is directly triggered by rainfall (Krautblatter and Moser, 2009; Ansari et al., 2015). However, the link between rockfall occurrence and rainfall intensity is not linear, and most events are triggered when rainfall intensity exceeds a specific threshold.
Among the destabilising processes caused by changes in rock temperature and contributing to the decrease of stability are
-
rock wedging–ratcheting (Bakun Mazor et al., 2020; Pasten et al., 2015);
-
repeated freeze–thaw cycles;
-
thermal expansion-induced strain (Gunzburger et al., 2005; Matsuoka, 2008), and in specific conditions, exfoliation sheets may be destabilised by cyclic thermal stress (Collins and Stock, 2016; Collins et al., 2017).
These processes are often repeated many times, effectively widening the joints, and fracturing the rock.
Rock slope monitoring is a common task in engineering geology and is often used at construction sites (Ma et al., 2020; Li et al., 2018; Scaoni et al., 2018), along roads or railways, or to protect settlements. Various approaches are used, with a background in geodesy (Gunzburger et al., 2005; Reiterer et al., 2010; Yavasoglu et al., 2020), geotechnics (Greif et al., 2017; Lazar et al., 2018), geophysics (Burjanek et al., 2010; 2018; Weber et al., 2017, 2018; Coccia et al., 2016; Yan et al., 2019; Weigand et al., 2020; Warren et al., 2013), or remote sensing methods (Sarro et al., 2018; Matano et al., 2015). Most commonly, sensors such as thermometers, accelerometers, inclinometers, visible light or IR cameras, total stations, TLS (terrestrial laser scanner), GbSAR (ground-based synthetic-aperture radar), and seismographs are used to detect potential rockfall events (Burjanek et al., 2010, 2018; Tripolitsiotis et al., 2015; Matsuoka, 2019). These methods are more suitable for monitoring large rock slopes. Tiltmeters, extensometers, and other geotechnical devices are usually used to monitor a single unstable block/part of the rock slope (Barton et al., 2000; Lazar et al., 2018). Usually, monitoring methods using various sensors are combined. Large rockslides were monitored by Crosta et al. (2017), Zangerl et al. (2010), and Loew et al. (2012) using a combination of remote sensing, geodetical network, and borehole inclinometers. Experimental monitoring systems aim to develop or test new sensors or approaches (Loew et al., 2017; Jaboyedoff et al., 2004, 2011; Chen et al., 2017; Hellmy et al., 2019) or to describe long-term processes of rock slope destabilisation (Fantini et al., 2016; Kromer et al., 2019; Du et al., 2017). However, these systems are site-specific, and installation of a similar system within multiple sites is complicated and often financially demanding.
To quantify the influence of meteorological variables, weather stations should be included within monitoring systems (Macciotta et al., 2015). Rarely, environmental monitoring is supplemented by solar radiation monitoring (Gunzburger and Merrien-Soukatchoff, 2011). Thermal observations are often limited to air temperature and/or rock face temperature monitoring only (Jaboyedoff et al., 2011, Blikra and Christiansen, 2014; Marmoni et al., 2020; Collins and Stock, 2016; Collins et al., 2017; Eppes et al., 2016). Less commonly, temperature changes are measured within the rock mass depth (Magnin et al., 2015a; Fiorucci et al., 2018). Site-specific designed systems are difficult to modify and are usually expensive. This brings difficulties into data processing because they are locally biased and cannot be directly compared.
Therefore, an easy-to-modify, modular, and affordable monitoring system composed of crackmeters, a weather station, solar radiation, and compound borehole temperature probes has been designed and tested. With just minor modifications, various rock slope sites may be easily instrumented, allowing data about the temporal behaviour of rock slopes in different settings to be compared, potentially bringing new and much needed information about rock slope stability spatiotemporal development (Viles, 2013).
Rock slope monitoring methods have recently undergone massive development in terms of their precision, accuracy, reliability, sampling rate, and applicability (Tables 1 and 2). Even completely new methods have been established, for example, unmanned aerial vehicle applications, high-precision or UAV (unmanned aerial vehicle)-held laser scanner. This expansion has been possible mainly due to the rapid development of corresponding fields of informatics, computation technologies, communication channels, and satellite technology applications.
Table 1List of the presented monitoring system components, with performance metrics and prices.
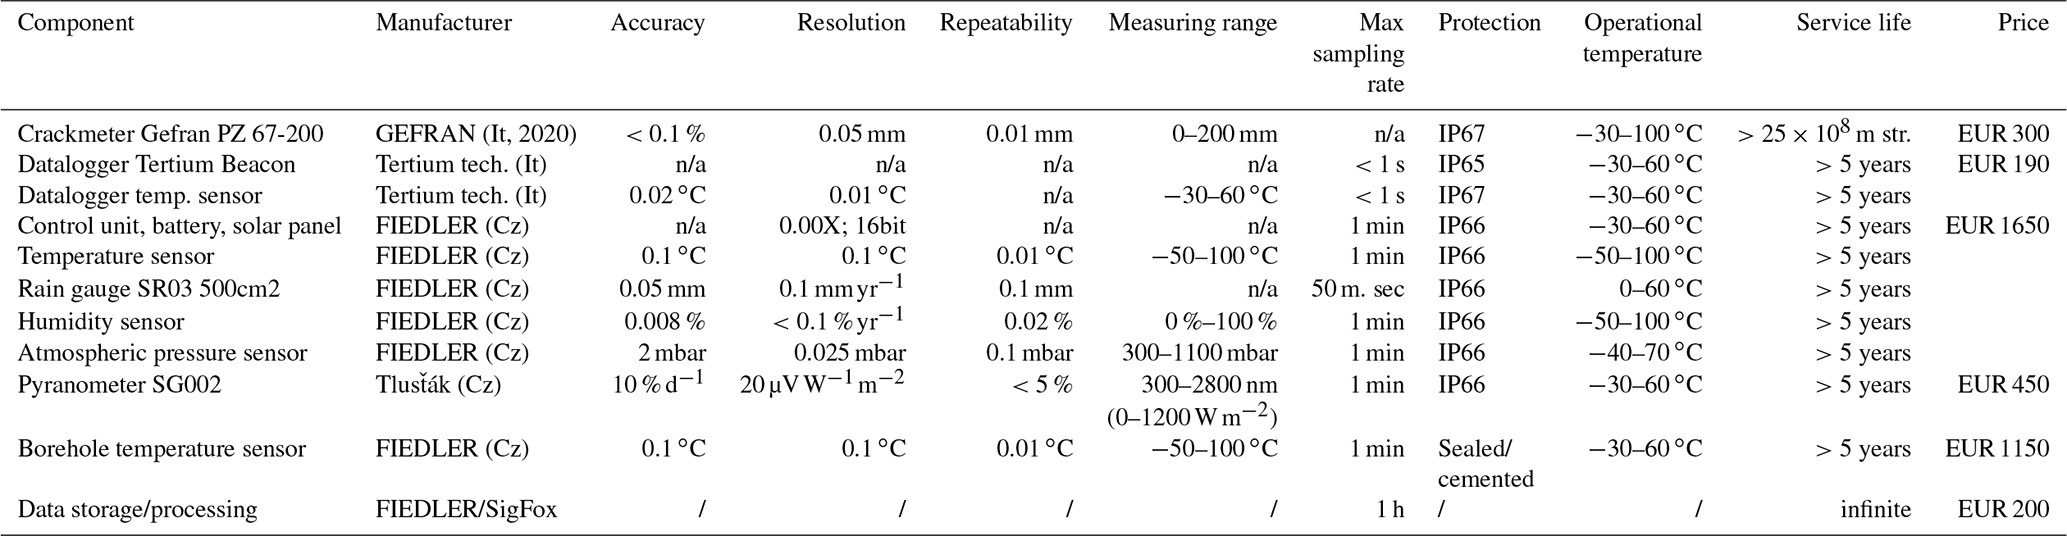
n/a: not applicable.
Table 2A comparison of rock slope spatial change monitoring techniques (updated after Klimeš et al., 2012). LVDT stands for linear variable differential transformer, EDM stands for electronic distance measurement, and GB InSAR stands for ground-based interferometric synthetic aperture radar.
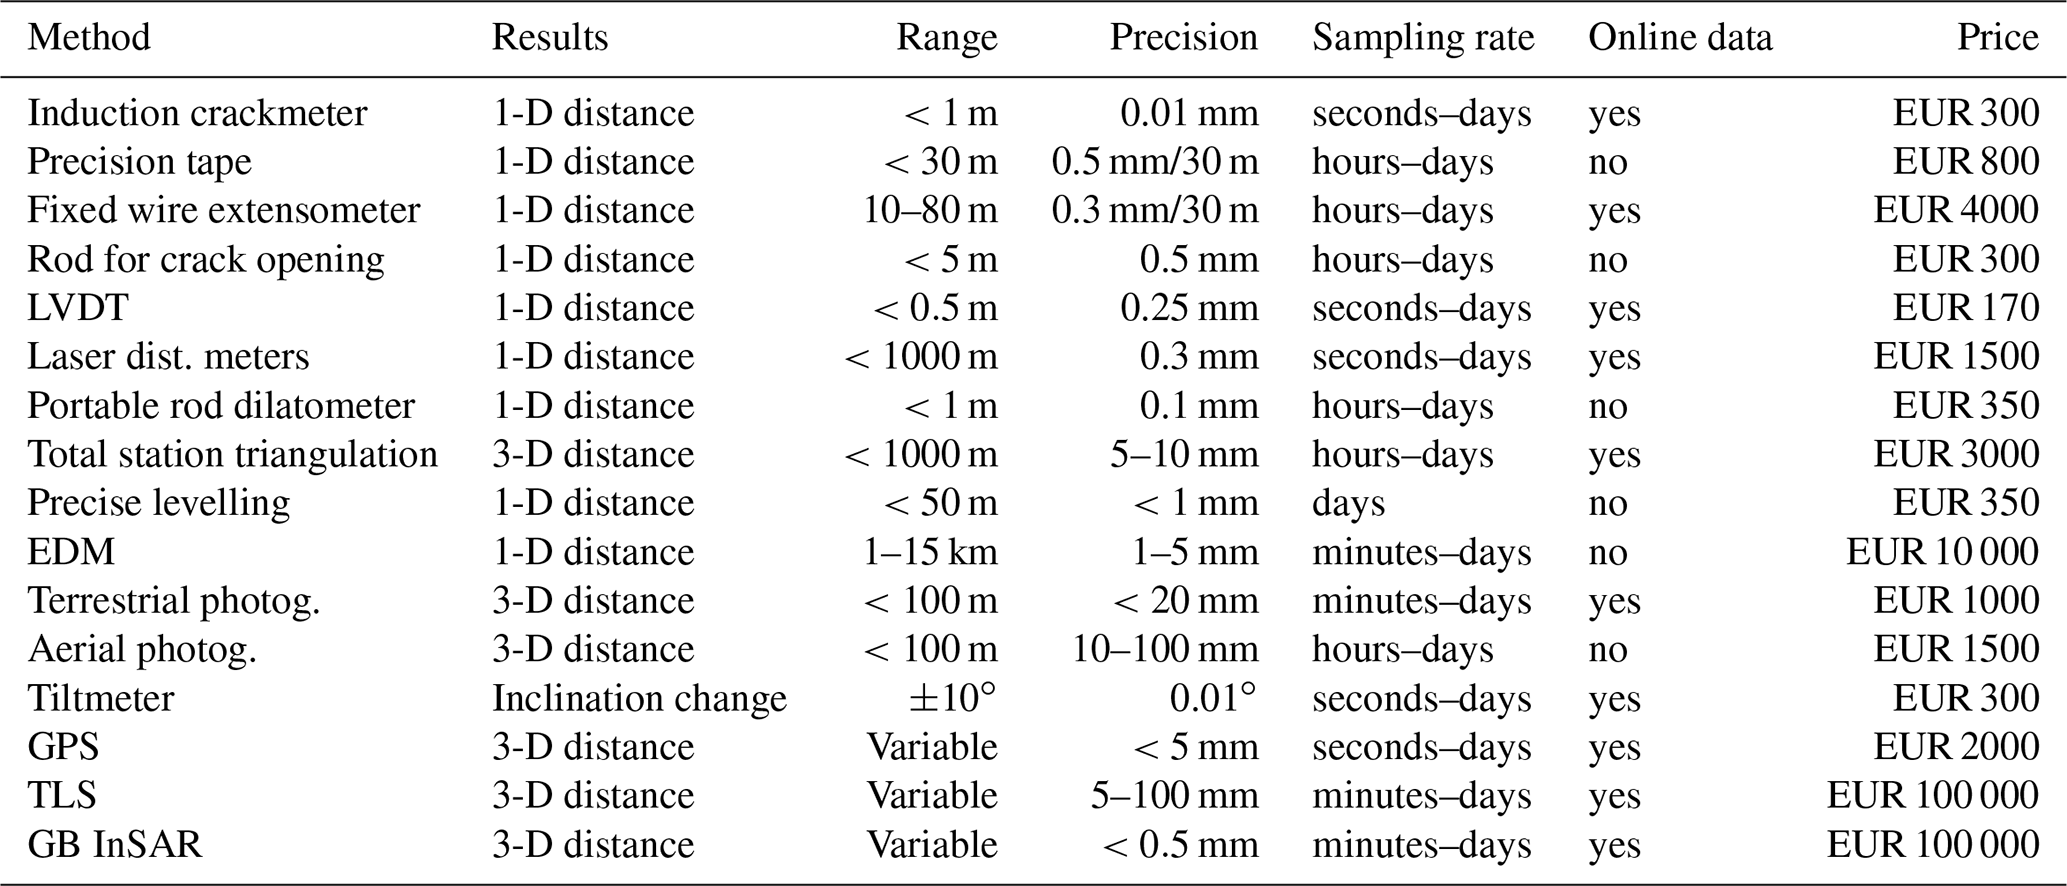

Figure 1Photo of the monitoring system at the Tašovice site: (a) generalised scheme of the monitoring system (b) CU: control unit, PU: processing unit, DL: datalogger, 1: temperature sensor, 2: pyranometers, 3: rain gauge, 4: borehole compound temperature probe, 5: crackmeters (only four of a total of six crackmeters are visible on this photo).

Figure 2Compound borehole thermocouple probe: (a) generalised scheme, (b) photo of compound thermocouple probe installation, (c) insulated head of a subhorizontal borehole with a processing unit.
Unlike the above-mentioned systems, the monitoring system presented here (Figs. 1 and 2; Table 1) may be placed at various sites without major modifications. Using common safety rules and methods for working at heights, the system may be placed directly within vertical or even overhanging rock faces. Anchoring must be made within a stable part of the rock slope, which ensures worker safety under any circumstances. This monitoring provides the opportunity to compare results from different locations and observe generally applicable regularities in the thermomechanical behaviour of the rock face thanks to the use of the same instrumentation on various rock slope sites. All sensors were calibrated by the manufacturer before they were installed on the rock slope to provide precise data. The monitoring system (Table 1, Fig. 1) is composed of the following components:
-
a set of automatic induction crackmeters, coupled with dataloggers (Fig. 1) measuring relative block displacement;
-
a weather station with a set of sensors measuring various meteorological data (Fig. 1), such as air temperature, humidity, and air pressure (Table 1), and surface solar radiation balance (incoming/reflected radiation) of the rock face (Fig. 5) using a pair of pyranometers;
-
a set of 12 thermocouples placed along a 3 m deep borehole (Fig. 2.), carefully insulated between each neighbouring sensor, measuring in-depth profiles of the rock slope temperature.
All the elements of the system (Table 1) are commercially available at affordable cost (instrumentation for a single site costs approximately EUR 5000) and are easily replaced by moderately experienced users. Additional costs include the drilling work (EUR 1000–2000), which depends on the site accessibility and rock mass hardness. The price of the specific monitoring system is also affected by the number of crackmeters and dataloggers used. System maintenance costs are no higher than EUR 300 per year, including data transmission, processing, and storage. This makes the system ideal for use at multiple sites, without great financial demands. When using the same instrumentation, data from different rock slope sites may be compared and analysed to better understand the general spatiotemporal behaviour of the rock slope.
2.1 Dilatation monitoring
At each site, suitable joints separating unstable rock blocks were selected. The joints and subsequent crackmeter placements were selected to best represent the general directions of the expected rock block destabilisation. Where it was possible, joints that directly separate unstable blocks from stable rock were chosen. These joints were subsequently instrumented with calibrated Gefran PZ-67-200 induction crackmeters. These crackmeters are able to record movements smaller than 0.1 mm (Tables 1 and 2). In comparison with other methods measuring spatial change, their precision is high, with lower costs (Table 2). The temporal resolution of the measurement is nearly continuous with the crackmeter position being read every second (Table 2). Moreover, we tested these devices in a controlled temperature environment using a climate chamber to determine any temperature-dependent errors. In this controlled test, we were able to measure the expansion of a concrete block. The resulting block expansion measurements matched the theoretically calculated concrete block expansion. This was performed to ensure that measurement of the crackmeters is not biased by dilatation of the device itself. Crackmeters are suitable for harsh conditions (Table 1). The devices may withstand temperature changes, snow cover, ice accumulation, or rainfall with IP 67 protection. The crackmeters are coupled with Tertium Beacon dataloggers (Tertium technology, 2019), which contain accurate in situ temperature sensors (Table 1). When a datalogger is placed within the discontinuity, it records the local temperature. The joint dilatation and temperature data are stored in the datalogger and may be wirelessly transmitted at a distance of up to 100 m using Wi-Fi, which simplifies data collection as it may be performed from below the rock face. Tertium Beacon data may be sent to a server via the Internet of Things (IoT) SigFox network. The crackmeters and dataloggers are powered with two AA batteries, which typically last 6–12 months according to the local climate. The displacement and temperature are set to be measured every hour. However, this may be changed if necessary, e.g. during special experiments such as thermal camera monitoring campaigns (Racek et al., 2021).
2.2 Environmental monitoring
For the monitoring of the weather and climatic parameters at the sites of interest, we use automatic weather stations manufactured by FIEDLER (2020) environmental systems. These are composed of a registration, communication and control unit, an external tipping-bucket rain gauge, two temperature sensors, an atmospheric pressure sensor, a humidity sensor, and a pair of pyranometers, measuring the incoming and reflected solar radiation. All these sensors and the control unit are powered by a 12 V battery, which is charged by a small solar panel (Fig. 1). Except for precipitation, which is measured using a pulse signal, all other meteorological variables and solar radiation are measured every 10 min. The control unit is equipped with a GSM modem, which sends the data automatically to the server of the provider every day. For detailed information about the accuracy, durability, and price of the environmental monitoring, see Table 1.
To compute the radiation balance (incoming minus reflected solar radiation) of a rock face, it is necessary to measure with two opposite facing pyranometers. For this purpose, a set of pyranometers (Gunzburger and Merrien-Soukatchoff, 2011; Janeras et al., 2017; Vasile and Vespremeanu-Stroe, 2017) is placed perpendicular to the rock face, with one facing the rock surface and the other facing the sky hemisphere. This setup enables both incoming and reflected solar radiation to be measured. The sensors are not placed directly on the rock face but on an L-shaped holder, which allows both sensors to be placed almost at the same point (Fig. 1). The rock-facing pyranometer is placed at a distance of approximately 10 cm from the rock surface. The pyranometers have an output of 0–2 V, which corresponds to a global radiation of 0–1200 W m−3. The monitored wavelengths span from 300 to 2800 nm. Outputs from the pyranometers are processed by a converter and then sent with the other monitored meteorological variables to the data hosting server.
2.3 Borehole temperature monitoring
For the monitoring of the thermal behaviour of a rock slope, it is necessary to know temperatures at different depths of the rock mass. The newly designed in-depth compound temperature probe (Fig. 2) is a crucial part of our monitoring system. The sensors are placed in a 3 m deep subhorizontal borehole. To ensure safety during drilling and the long lifespan of the borehole and sensors, the borehole itself is drilled into a stable part of the rock slope. The borehole is then equipped with a custom-designed probe with a set of thermocouples. The technical parameters of the temperature sensors are the same as for the air temperature sensors (Table 1). The thermocouple sensors that are connected to copper rings were originally designed for soil temperature measurements. By connecting these to copper rings, they become suitable for measuring the temperature of borehole walls. Copper rings with 5 cm diameter are placed at a given distance on the tubular spine (5 cm below the surface, 10, 20, 30, 50, 75, 100, 150, 200, 250, and 300 cm). The probe is placed in the subhorizontal borehole, so the copper rings containing the temperature sensors lay directly on the borehole walls (Fig. 2). This ensures that the probe is directly measuring the rock mass temperature. Additionally, one thermocouple is placed directly on the rock surface (Fig. 2). The head of the borehole is insulated to prevent air and water inflow into the rock and the sensors inside the borehole are separated by thorough thermal insulation to ensure that the temperatures are not affected by the air circulation inside the borehole. Therefore, temperature readings from the borehole compound probe correspond to the in situ rock mass temperature. The thermal data, collected every 10 min, are passed through a converter and sent to the main control unit of the environmental station.
To date, the monitoring system has been established at three different sites (Fig. 3), using the same instrumentation setup. The sites were chosen deliberately on steep rock slopes built of various rock types, with various slope aspects and a diverse geological history. To integrate a practical application aspect, sites were chosen where the potential rockfall endangers buildings, infrastructure, or other social assets.
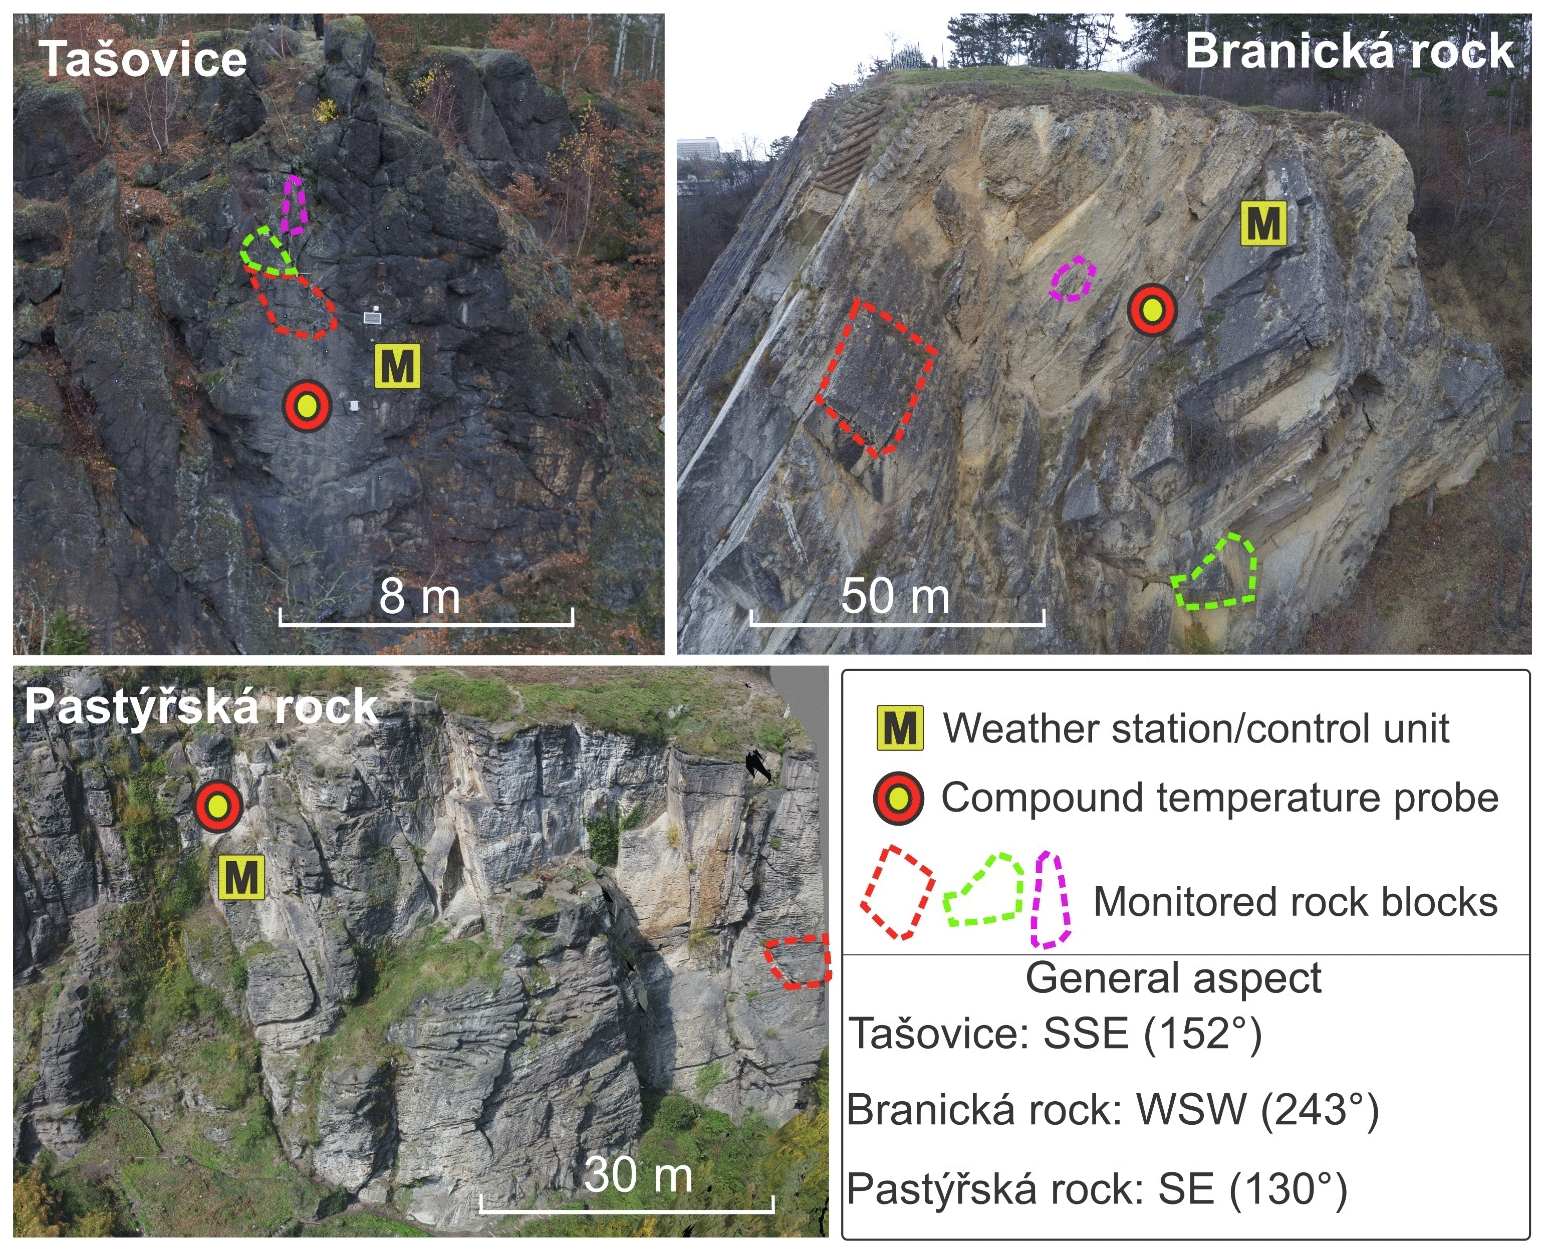
Figure 3Three instrumented rock slope sites. On each photo, the monitored rock blocks are indicated with dashed lines of a different colour. The placement of the compound borehole temperature probe and weather station is also indicated.
3.1 Pastýřská rock (PS)
The first instrumented rock slope called “Pastýřská rock” is located on the Labe (Elbe) riverbank in the town of Dečín, NW Czechia. Monitoring of meteorological variables began in late 2018. Shortly afterwards, the crackmeters and an in-depth borehole temperature probe were installed. Pastýřská rock is formed by Cretaceous sandstone with various mechanical properties (Table 3) and has a general SE orientation. The rock slab with the pyranometers and borehole is dipping 87∘ towards the east (085∘). Three main discontinuity sets (80/040, 86/310, 80/275) were identified using geological compass measurements. The locality is known for extensive rockfall activity in the past, which led to rock slope stabilisation works being performed in the late 1980s. However, the block monitored by the crackmeters remained in its natural state. One block is monitored using two pairs of crackmeters. The block has dimensions of m and is located in the overhanging part of the rock slope. All four of the visible cracks are monitored. The colour of the rock slope surface varies from dark to light grey. The rock slab where the pyranometers are placed is a light grey colour.
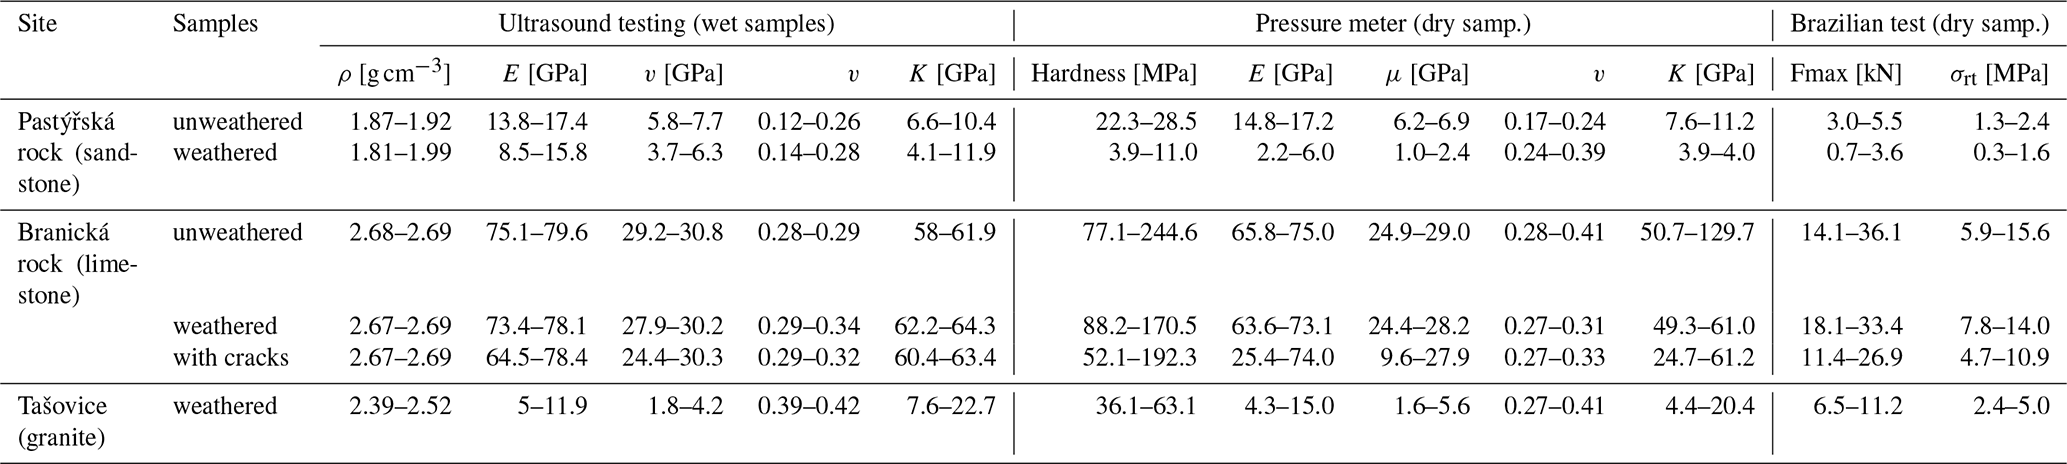
Table 3Mechanical and physical properties of laboratory tested rock samples from the three monitored sites. ρ: density, E: Young's modulus, v: Poisson's ratio, μ: shear modulus, K: bulk modulus, Fmax: maximum axial force, σrt: maximum tensile strength. All weathered and unweathered samples were collected from the sites. At the Tašovice site, only weathered granite was available, and at Branická rock site, some samples contained cracks. Only ultrasound testing was done with wet samples.
3.2 Branická rock (BS)
This rock slope in Prague (central Czechia) was instrumented in the summer of 2019. The rock slope is formed by several Silurian and Devonian limestone layers with varying mechanical and physical properties (Table 3). The rock slope was artificially created by mining (including blasting) and was used until the 1950s as a limestone quarry. The rock slope is located on a bank of the Vltava river, and it is generally facing WSW. The pyranometers and the borehole temperature sensors are placed on a rock slab dipping 80∘ to the SW (235∘). Three main discontinuity sets (50/325, 90/197, and 62/085) were identified directly in field. The site is known for extensive rockfall activity in the past, even after the quarry closed, which resulted in partial stabilisation of the known unstable blocks in the 1980s. Three unanchored blocks (Fig. 3) are monitored with seven crackmeters. In the upper part of the rock slope lies the largest monitored block at this site, with dimensions of m. This block is monitored with three crackmeters. The second block is located at the bottom of the rock slope, partly shaded by vegetation. The dimensions of the second block are m. This block slowly slides on the bottom surface and is instrumented with two crackmeters. The third monitored block is smaller ( m) and is located in a highly weathered part of the rock slope where it is monitored with two crackmeters. The colour of the limestone varies from grey to yellow, and the colour of the limestone facing the pyranometer is light grey.
3.3 Tašovice (T)
The third instrumented site is a rock slope above a local road and the river Ohře near Karlovy Vary in the west Czechia. The rock slope is formed by partly weathered granite (Table 3). Generally, it is facing a SSE direction. The instrumented slab is dipping 88∘ to the south (170∘). Three relatively poorly developed discontinuity systems (50/090, 50/220, and 88/345) were identified. At this site, small rockfalls are frequent as may be seen from the fresh rock and debris accumulations under the rock face. The locality was fully instrumented in the spring of 2020. Three relatively small blocks are monitored at this site. Block 1 ( m), Block 2 ( m), and Block 3 ( m). Each block movement is monitored with a pair of crackmeters. The colour of the rock slope varies from black to dark grey. The granite surface at the site of the pyranometers has a dark grey colour.
Each instrumented rock slope was characterised using traditional geological, geomorphological, and geotechnical methods, such as measuring the geometrical properties of joints and fault planes, relative surface strength measurement using a Schmidt hammer, discontinuity density measurement, and stability estimates using geotechnical classifications (Racek, 2020). The mechanical and physical properties of the rock samples (Table 3) will serve as input data for the numerical models of thermally induced strain, which are constructed using multiphysics ELMER (Raback and Malinen, 2016) and FEATool (FEATool, 2020) software.
Traditional methods were supplemented with state-of-the-art methods of rock slope analysis, including analysis of 3-D point clouds and derived mesh surfaces based on SfM (structure from motion, a photogrammetric technique to calculate the 3-D point cloud from overlapping photos with varying focal axis orientation) (Westoby et al., 2012) processing using the data collected with a UAV or based on TLS. The detailed rock surface models were then analysed using CloudCompare and its plugins (Facets and Compass) (Girardeau-Monaut, 2016; Thiele et al., 2018; Dewez et al., 2016) and the Discontinuity Sets Extractor (DSE) software (Riquelme et al., 2014) to derive the joint and fault planes and to measure their spatiostructural properties (Fig. 4). These methods automatically (DSE, Facets) or semi-automatically (Compass) derive structural planes from 3-D point clouds. From these, the structural setting and discontinuity systems of the rock slopes may be determined. Discontinuity sets define partial blocks that form the rock slope surfaces.
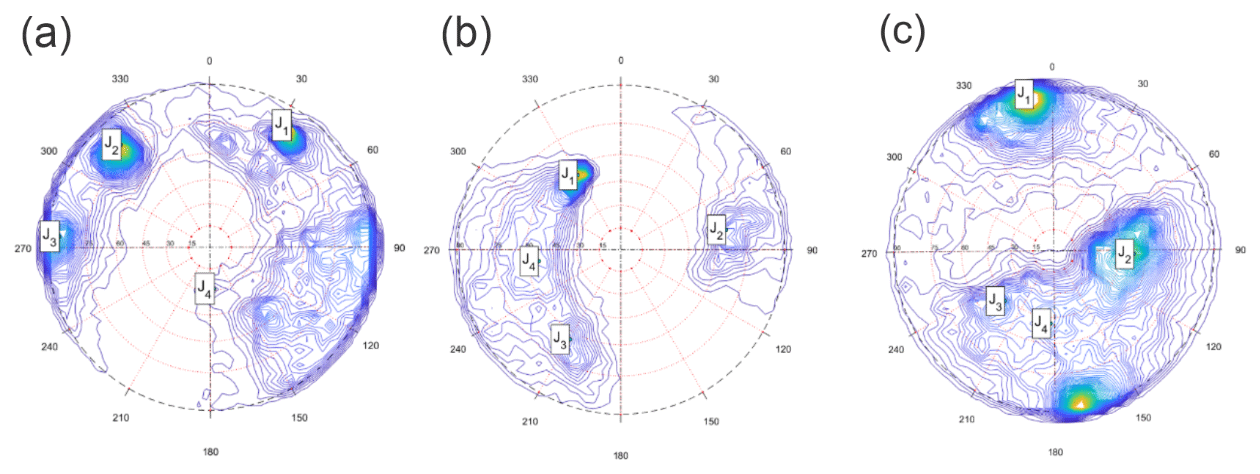
Figure 4Stereonets with the four main discontinuity sets (J1–J4) classified using DSE software (Riquelme et al., 2014). The density of the principal poles corresponds to the main discontinuity sets identified from the point clouds. (a) Pastýřská rock, (b) Branická rock, (c) Tašovice.
The monitoring systems will be operated for 1–2 years. To date, the gauges and sensors have operated without any problems or interruptions. However, some accidents or breakdowns have occurred, the most serious being the destruction of one pyranometer by debris, washed down by a rainstorm at the Branická rock site. As the experimental sites are easy to reach and spare parts easy to obtain, any broken or damaged elements may be replaced within a few days.
From the discontinuity analysis (Fig. 4), it is possible to see that in the case of the Pastýřská and Branická rock sites the discontinuity systems are clearly defined. The discontinuity sets at these sites are defined mainly by sedimentary layers and cracks perpendicular to them. In the case of the Tašovice site, the discontinuity systems are less pronounced. At this site, discontinuities are linked mainly to tectonically predisposed weak zones and weathered parts of the granite rock. The mechanical properties of the rock mass samples (Table 3) differ significantly according to the degree of weathering. The best results in terms of hardness were obtained from the unweathered limestone from the Branická rock site. The lowest hardness was determined for the weathered sandstone from the Pastýřská rock site. At the Tašovice site, it was not possible to called an unweathered sample due to the high degree of weathering of the whole rock slope.
5.1 Environmental monitoring
The weather station monitoring at all of the instrumented sites takes place without any issues. From the measured time series of the meteorological variables, the rock slope microclimate may be defined and the influence on the monitored discontinuity positions may be determined using statistical analyses. The comparison of crack openings with measured rainfall events does not indicate any visible influence of precipitation on the crack opening/closing. However, the measuring period is still short, with prevailing dry, relatively warm weather. Conversely, there is a visible influence of air and rock mass temperature on block dilatation (Racek et al., 2021), where both diurnal and annual cycles may be identified.
5.2 Rock surface radiation balance
The rock surface solar radiation balance was monitored at the sites in 2020 (Branická rock in January, Pastýřská rock in February, and Tašovice in December). Even from these incomplete data, it is possible to observe the differences between the individual sites (Fig. 5). Local conditions influence the incoming radiation pattern based on the general aspect of the rock slope (temporal shift of incoming radiation peak), rock slope albedo, or the shading effects of the surroundings of the pyranometers. Differences in the absolute reflected radiation are mainly caused by the different colours of the rock faces and by the different angle of incoming solar radiation due to the aspect of the instrumented slab.
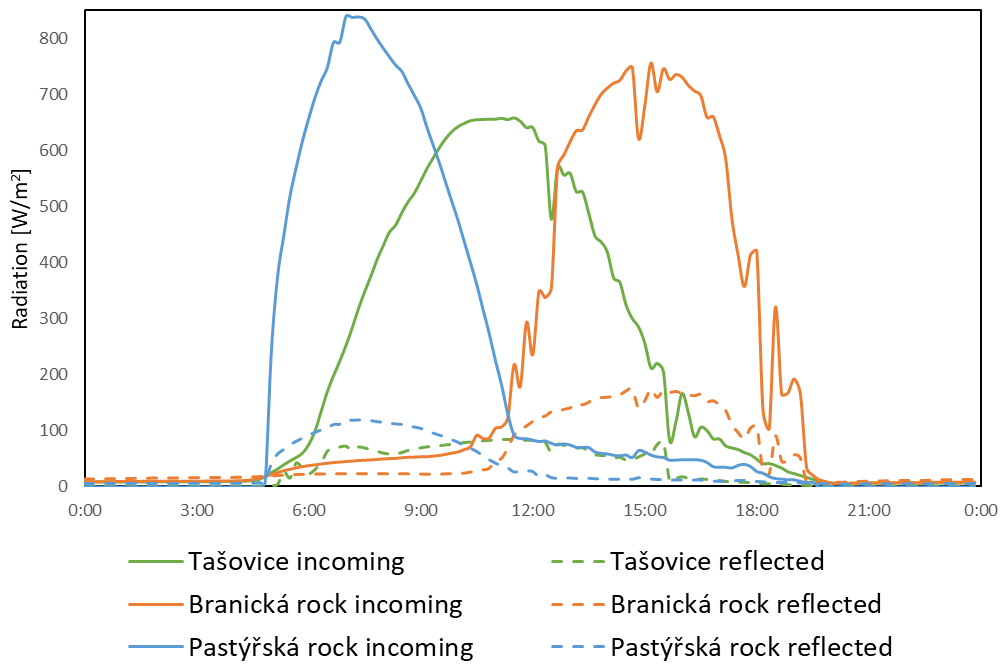
Figure 5Example of the incoming and reflected radiation measured by the pyranometers at the Branická, Tašovice, and Pastýřská rock sites. A 24 h time series of incoming and reflected radiation is displayed. Data were recorded on 1 August 2020 with no clouds. The influence of the slope aspect is obvious from the incoming radiation peak shift.
5.3 Borehole temperature
By continuously measuring the temperature at different depths inside the subhorizontal boreholes, it is possible to observe both diurnal and annual temperature amplitudes at various depths (Fig. 6). In-depth temperature measurements show differences in the temporal thermal behaviour between the monitored rock slopes (Fig. 6). From the boxplots that represent data from all of the monitored sites, it is possible to see that the largest surface temperature variation was measured at the Tašovice site. This is probably caused by the dark colour of the Tašovice rock surface, with lower albedo. However, at greater depths, this variation decreases. This is probably caused by the lower thermal diffusivity of the granite. Moreover, in the depth of the rock mass, the influence of direct sunlight is attenuated. Greater in-depth temperature variation is present at the Pastýřská rock site. However, these data may be biased by different time-series lengths (1 vs. 2 full years). The effect of different aspects may be seen in the peak of the diurnal temperature, when the temperature peaks earlier on the east-facing rock slope (Pastýřská rock) than on the SSE-facing Tašovice and WSW-facing Branická rock sites (Fig. 6). Differences in lithology (different thermal diffusivity) cause a temporal shift between surface and subsurface temperature peaks. This temporal shift differs between the different rock slopes. A higher median of the in-depth temperature at the Pastýřská and Branická rock sites (Fig. 6) is caused by longer in-depth temperature time series spanning over two summer periods.
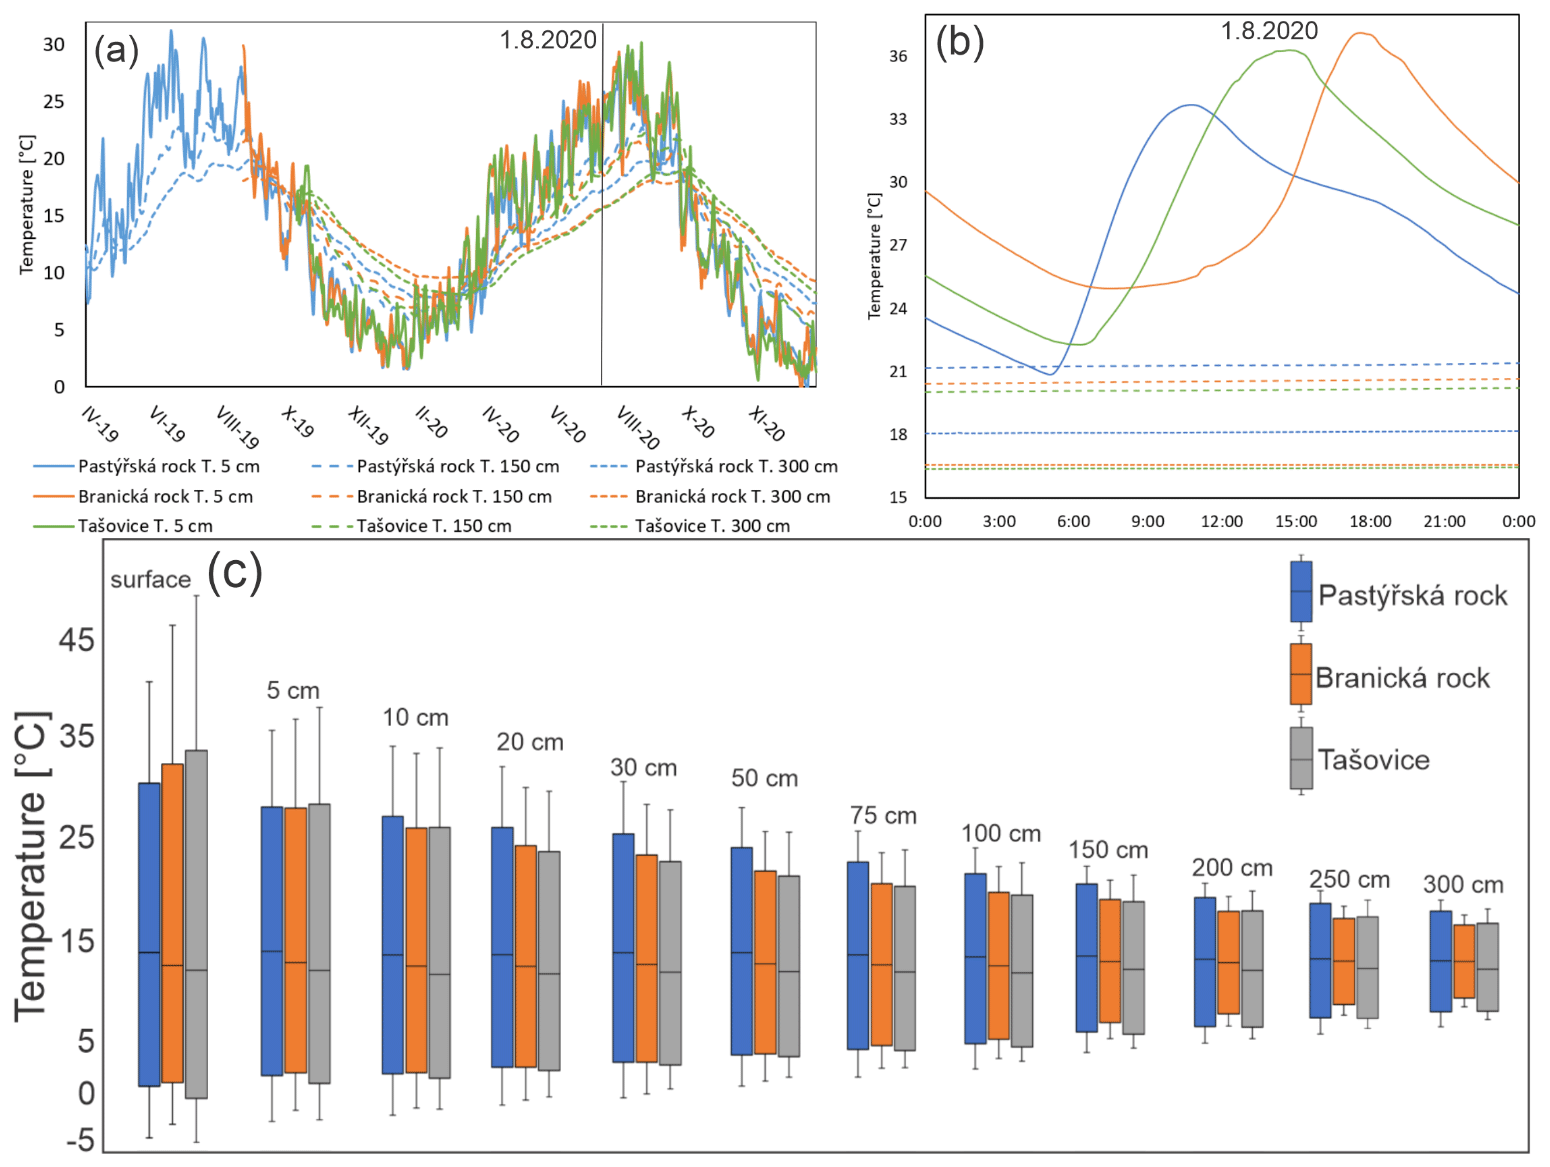
Figure 6Comparison of temperatures at different rock slope depths (5, 150, and 300 cm) at the three monitored rock slope sites: (a) long-term data (daily average) and (b) 1 d data from 1 August 2020. In-depth annual (a) and diurnal (b) temperature amplitudes are displayed. In-depth rock mass temperature data are from all three monitored sites. Boxplots shows median, minimum, maximum, first, and third quartiles of temperature data. Temperature amplitudes from the compound borehole temperature probes may be compared between sites. At all sites, a decrease in the temperature amplitude with depth is apparent (c).
5.4 Block dilatation
At all of the monitored sites, a thermally induced dilatation of the individual blocks is observed. However, due to the relatively short time series, the measured crack movements do not show any irreversible trends visible on graphs. From the crackmeter data, diurnal and annual amplitudes of crack openings may be identified for all of the monitored rock blocks. Figure 7 shows the measured diurnal and annual rock crack openings at the Pastýřská rock site. From the graph, it is possible to see the influence of the diurnal and annual temperature changes on the position of the crackmeter. Similar behaviour was observed within all of the monitored blocks.
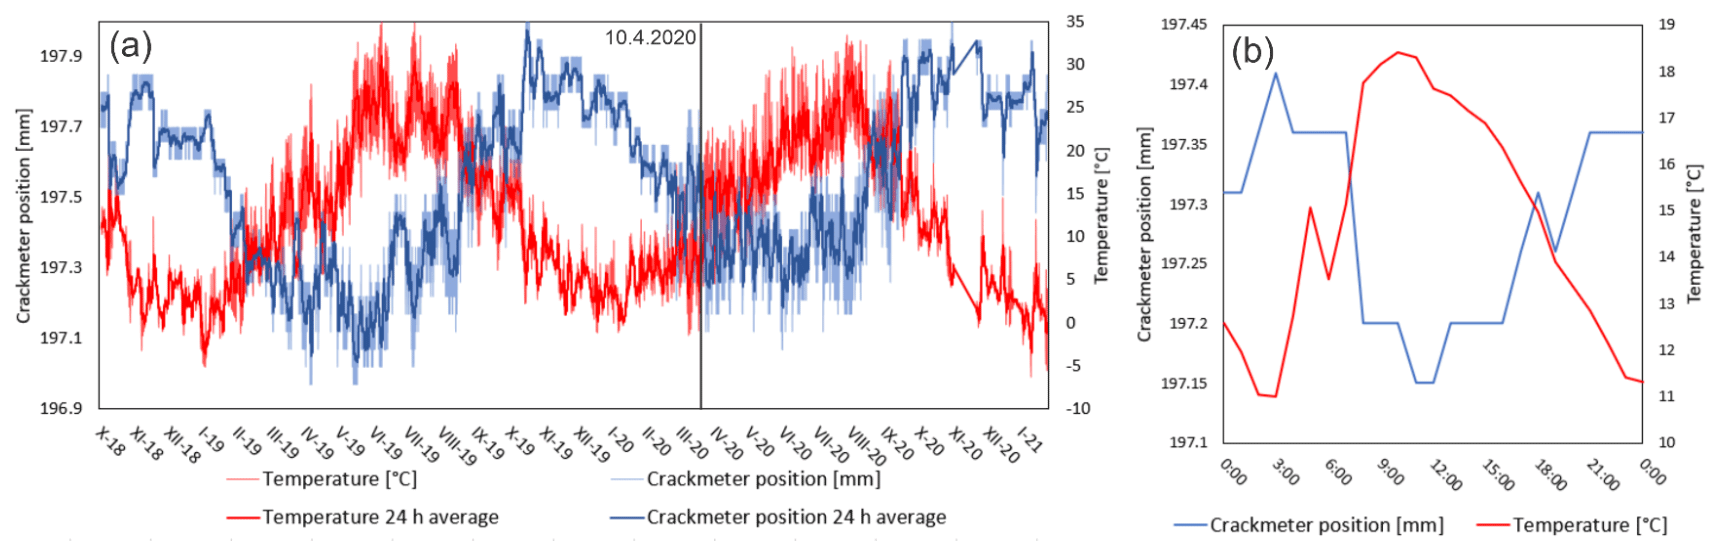
Figure 7Measured in situ temperature and crack opening at the Pastýřská rock site. (a) Whole time series with annual amplitudes, (b) example of the diurnal amplitude measured on 10 April 2020. From the plot in panel (a), the annual temperature and crackmeter position amplitude may be observed. The plot in panel (b) shows the diurnal temperature and crackmeter position amplitude.
Table 4Amplitude of crackmeters measuring at Pastýřská rock: one block, four crackmeters; Branická rock: three blocks, seven crackmeters; and Tašovice: three blocks, six crackmeters. The table shows the difference between the maximum and minimum opening of all the placed crackmeters. CM: crackmeter, P: position. The amplitude is calculated as the difference between the maximum and minimum position. “Block” refers to which specific block (according to Fig. 3) is instrumented by a crackmeter at each site. Last measured data: 27 January 2021.
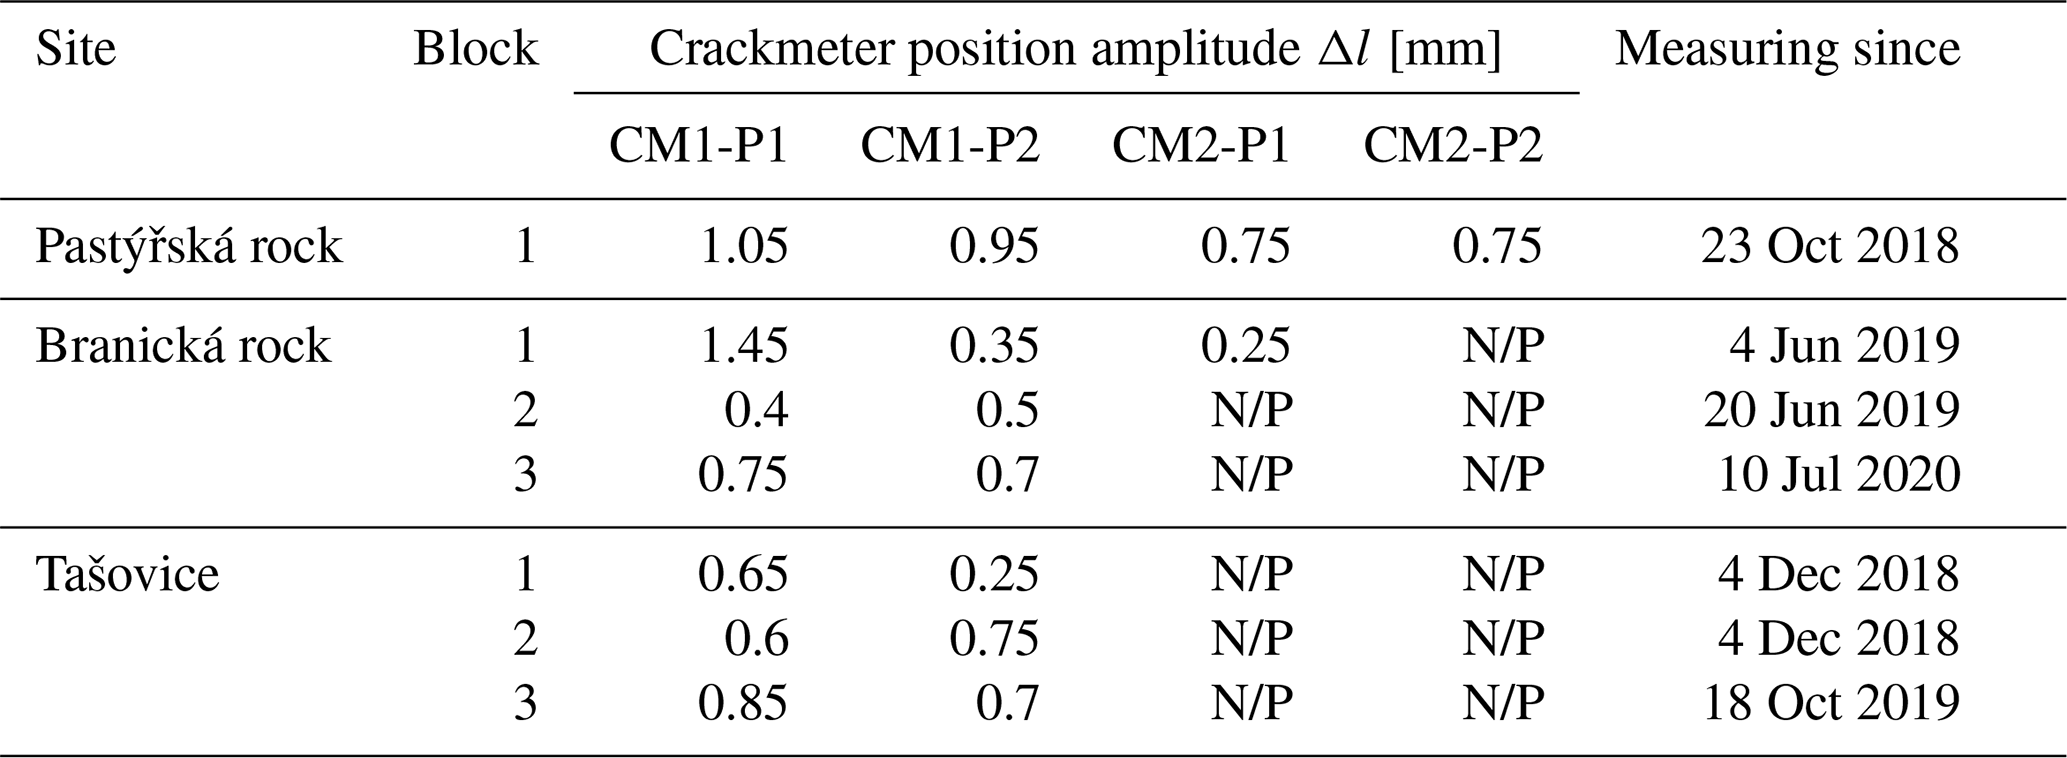
N/P: not placed.
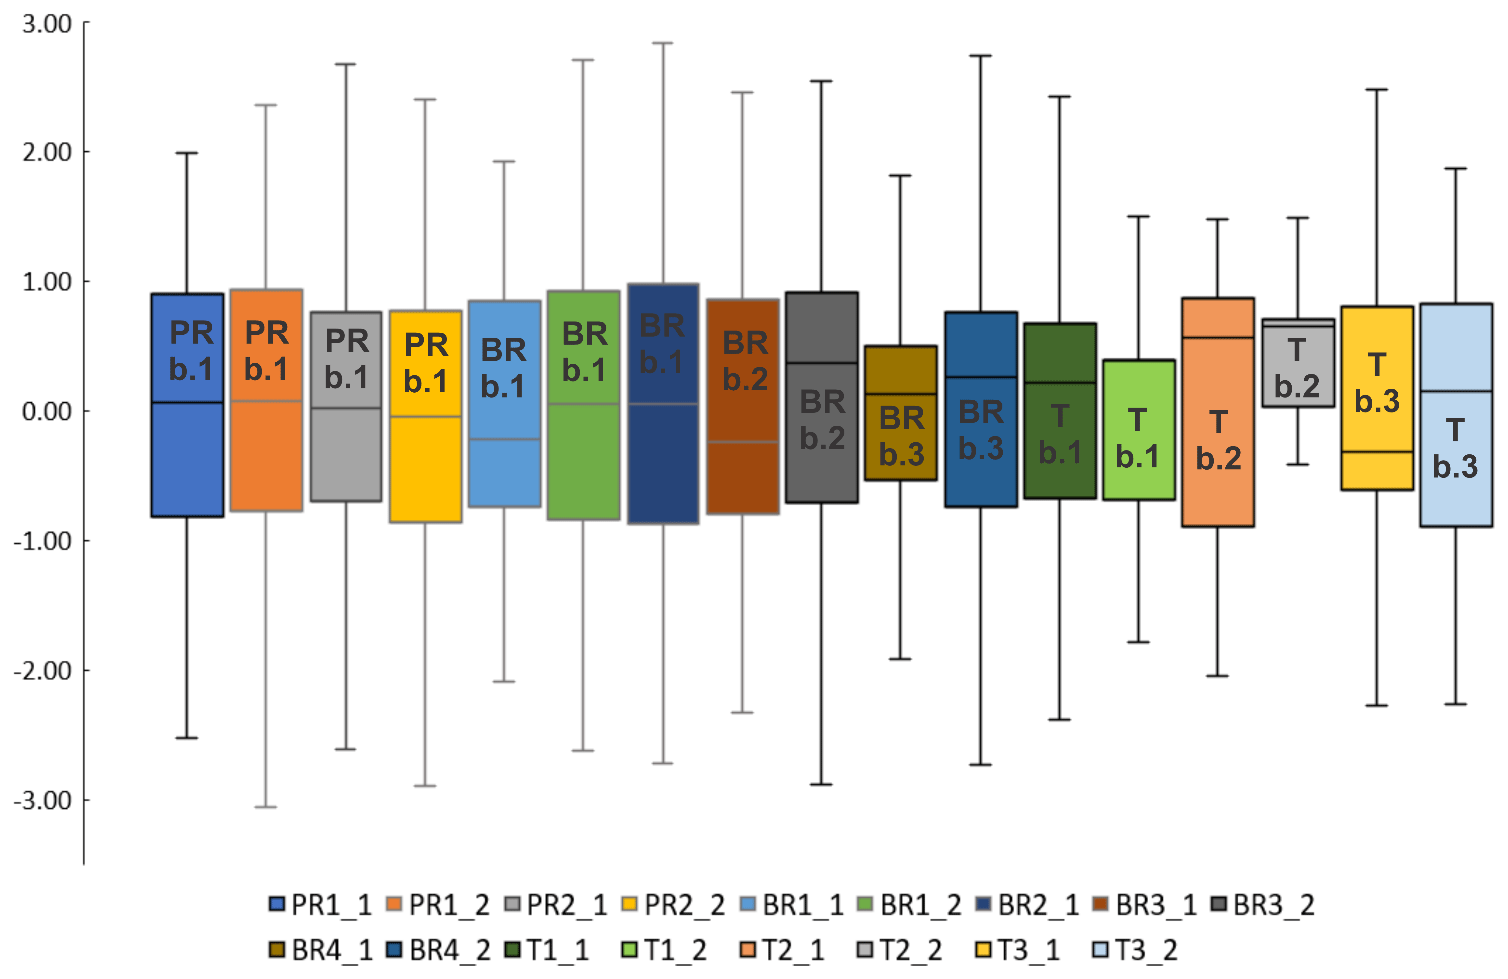
Figure 8Boxplots of crackmeter position data. To compare the different positions of the measurements, the data were standardised. The boxplots show the max/min of the crackmeter position, median, first, and third quartile. The abbreviations inside the boxplots define the crackmeter locations. PR: Pastýřská rock, BR: Branická rock, T: Tašovice. Specific blocks are defined by numbers b.1–b.3. These correspond to the blocks displayed in Fig. 3.
The amplitude of the position of the crackmeters differs between the individual sites and blocks (Table 4, Fig. 8). These differences are caused by different blocks dimensions, time series length, crackmeter placement, and the regime of destabilisation.
To date, crackmeter amplitudes (Fig. 8, Table 4) higher than 1 mm have been measured on Block 1 (approximately 170 m3) at the Pastýřská rock site (PR1_1, PR1_2), and on Block 1 (approximately 16 m3) at the Branická rock site (BR1_1, BR1_2, BR2_1). These blocks are the two largest instrumented. The measured crackmeter amplitude is reversible and is therefore caused by thermal expansion/contraction of the block. The relatively small Block 3 at the Branická rock site (BR4_1, BR4_2) shows movements larger than 0.5 mm, although it has only been instrumented since the summer of 2020. Such a large amplitude suggests that the block is unstable, and this hypothesis should be confirmed by further monitoring.
The blocks instrumented at the Tašovice site seem to be more stable (Table 4, Fig. 8). Only Block 3 shows 0.85 mm of reversible movement. By further analysis of the graphs and statistical trends, possible irreversible trends of the blocks should be revealed. Destabilisation of a single block should be visible as irregularities in the time series of the position of the crackmeter not strictly related to thermal dilatation. Two crackmeters at the Tašovice site show large amplitudes of movement (T2_2, T3_2); however, these movements were fully reversible and short lasting (1 h measurement). They were probably caused by external forces, such as the weight of snow cover deforming the crackmeter body or deformations of the anchoring point during maintenance. Larger blocks (PR b.1, BR b.1; BR b.2) show the largest overall amplitude of movement. The remaining smaller blocks show smaller overall amplitudes. However, these seem to be more influenced by short-term diurnal temperature changes. Sensitivity to fast heating/cooling makes these blocks more susceptible to temperature-induced irreversible movements.
Commonly used rock stability monitoring systems are often designed to provide an early warning (Jaboyedoff et al., 2004, 2011; Crosta et al., 2017), aiming primarily at identifying a hazard and not at investigating the causes or thresholds of the movement acceleration. The presented monitoring system is designed to contribute to explaining various meteorological and temperature related influences on the destabilising processes, which lead to the triggering of a rockfall event (Viles, 2013). Fantini et al. (2016) concluded that it is the temperature variations (rather than precipitation or wind) that cause changes in internal strain within the rock mass leading to its destabilisation. Other factors, such as climate change, former rockfall, seismic stress, or hydrological processes are more responsible for rockfall triggering than for short-term strain field modification (Krautblatter and Moser 2009). However, to assess the strain changes within the rock mass, it is necessary to have information on the temperature distribution inside the rock slope depth. This is the crucial advantage of the presented monitoring system, as the borehole compound temperature probe short- and long-term temperature changes up to 3 m in depth to be identified.
To observe individual thermally induced strain changes related to rock mass temperature and solar radiation, we placed the monitoring systems on rock slopes with various slope aspects (different insolation and its diurnal and annual changes) and composition of different rocks (sandstone, granite, and limestone) to include the influence of heat conductivity, capacity, and colour of the rock. While there are numerous laboratory studies on rock conductivity (Saez Blásquez et al., 2017), modelling of heat flow based on surface observation (Hall and André, 2001, Marmoni et al., 2020), and large-scale experiments usually aiming at heat management in the thermal energy industry (Zhang et al., 2018), there are only a few experiments concerning the shallow (first metres) subsurface zone of rock slopes (Greif et al., 2017, Magnin et al., 2015a), even though this is the most short-term thermally strained and weathered part of the natural rock mass (Marmoni et al., 2020). Moreover, thermal conductivity or rock strength may be determined from heating/cooling rates of rock slope surfaces using a thermal camera (Pappalardo et al., 2016; Pappalardo and D'Olivo, 2019; Fiorucci et al., 2018; Guerin et al., 2019; Loche et al., 2021). Our approach is aimed at combining these methods, with the ultimate goal of creating numerical thermomechanical models of the monitored rock slopes/partial unstable blocks.
The structural properties of the rocks were analysed using two approaches: (i) traditional field measurements using a geological compass and (ii) DSE software for automatic discontinuity extraction from the digital surface model (DSM) (Riquelme et al., 2014). While generally the results were similar, the DSM analysis did not include discontinuities that are not forming the surface of the rock face. This effect is visible mainly in the case of the Tašovice rock slope 3-D model, where the structural setting is not as straightforward as it is at the Branická rock and Pastýřská rock sites, formed by sedimentary rock layers.
The proposed monitoring system is compact, made of low-price and easily accessible off-the-shelf components (Tables 1 and 2), and is easy to modify according to the specific conditions of the given site. The performance of the monitoring system is so far without major issues related to the components or general reliability. However, one crackmeter datalogger was damaged and one pyranometer was destroyed by a rockfall triggered by a severe thunderstorm. Maintenance consists of changing datalogger batteries and cleaning rain gauge buckets. Online data transfer via SigFox IoT network (crackmeters) and GSM (weather stations) works without any issues.
A disadvantage of the used crackmeters is that they only provide one-dimensional displacement data. However, the device is quite low priced, with good precision and temporal resolution (Table 2). To amend the 1-D displacement measurement, we place several crackmeters at each instrumented site. Depending on the spatial configuration of the crackmeters, even 3-D data on the spatiotemporal behaviour of the monitored blocks may be obtained. Additionally, 3-D data about larger displacements are acquired using UAV SfM photogrammetry and TLS campaigns.
In terms of the environmental monitoring, there are clearly observable differences between the sites caused by the slope aspect and local microclimate. When temperature data from the boreholes are compared, differences between the monitored sites are apparent (Fig. 6). Both diurnal (up to approximately 150 cm in depth) and annual temperature cycles (up to 3 m in depth) for each site may be defined. These differences are caused by a combination of the different rock slope aspects and the physical properties of the different rock types. In further research, we plan to use time-lapse thermal camera observation to extend the information to the whole rock slope surface (Racek et al., 2021).
Solar radiation balance is not directly comparable due to the different aspects and slopes of the instrumented rock slabs. However, the temporal shift in maximum radiation caused by the rock slope aspect is visible from the solar radiation chart (Fig. 5). When complete annual data on the solar radiance will be available (summer/autumn of 2021), a thorough investigation of the differences will be performed. Consequently, the effects of long-term solar radiation cycles on the rock slope dynamics will be possible.
It is necessary to mention that the destabilisation processes are rather slow and have a low magnitude in the central European midlatitude climate, because of lower temperature amplitudes, shorter periods of active freeze–thaw cycles and lower precipitation (Krautblatter and Moore, 2014; Hermans and Longva, 2012; Viles, 2013). Therefore, monitoring is necessary. To observe the processes in more extreme conditions, we have recently installed a new monitoring site in the Krkonoše mountains (north Czechia) at an elevation of 1270 m a.s.l. Here, in this mountainous environment, we expect to observe block destabilisation processes with greater intensity.
Another factor contributing to the course of climatic conditions on the observed sites, is the various climatic cycles of different length, amplitude, and depth reach, ranging from diurnal cycles up to long-term cycles linked with solar activity or climatic oscillations (Gunzburger et al., 2005; Sass and Oberlechner, 2012; Pratt et al., 2019). The most prominent of these are the diurnal and annual cycles (Marmoni et al., 2020). The diurnal cycles have a shallower reach (Fig. 6) but are fast and therefore cause intensive strain on the surficial rock layer. Annual cycles are slower but with a higher amplitude and depth reach (Hall and André, 2001). In-depth temperature data will help to clarify the role of thermally induced stress on rock disintegration. Temperature changes cause irregular heating and cooling of the rock mass. These lead to irregularities in rock mass dilatation at the surface and at depth, which causes thermally induced stress/strain, which may eventually lead to discontinuity evolution and breakage of the rock mass surface layers. Thermally driven disintegration also acts on a grain-size scale, where grains of different minerals expand differently and induce stresses on the rock mass (Hall and André, 2001, 2003).
At all of the sites, the highest diurnal measured crackmeter movements are recorded in the spring and autumn, when diurnal rock slope surface temperature changes have the largest magnitude. The conditions, especially when crossing freezing temperatures twice a day, cause the development of freeze–thaw cycles, and consequent destabilisation of the rock slopes. We expect that the irreversible displacement trends will mostly occur during these periods.
Several works using similar monitoring instrumentation and approaches have been published (Matsuoka 2008; Bakun-Mazor et al., 2013, 2020; Dreabing, 2020; Draebing et al., 2017; Nishi and Matsuaoka 2010). Nevertheless, thermally induced rock slope destabilisation monitoring is still a relatively marginally studied field. Matsuoka (2008) presented long-term data of crackmeter monitoring. These data were collected on rock slopes in a high mountainous alpine environment. Similarly, to our results, the displacement dynamics presented by Matsuoka (2008) were influenced by in situ air and rock mass temperature, reaching the highest values in the spring and autumn. On a relatively long crackmeter time series (10 years), Matsuoka (2008) observed a gradual, temperature-driven joint opening. The most significant changes in crackmeter position are explained by freeze–thaw conditions. Nevertheless, even in the dynamic alpine environment, the joint opening is slow, measuring approximately 0.4 mm in 2 years of continuous monitoring. It is expected that in a temperate climate these processes are even slower. Nishi and Matsuaoka (2010) described the influence of temperature on the temporal displacement of a large rockslide. They noted a large displacement (over 1 m) during 3 years of monitoring, while the accelerations were linked to the highest precipitation periods. However, these values were observed in very different conditions from our experimental sites. Bakun-Mazor et al. (2013, 2020) proposed a monitoring system to distinguish thermally and seismically induced joint movements in limestone and dolomites at the Masada cultural heritage site. The measured amplitude of thermally induced irreversible joint movements reached approximately 0.3 mm in 1 year. The authors described the concept of a thermally driven wedging–ratcheting mechanism. The estimated annual irreversible joint opening at Masada was approximately 0.2 mm.
We assume that in the long-term (several years), we will be able to observe a similar wedging–ratcheting mechanism with lower amplitude at our sites. During colder periods, this mechanism may be complemented by frost shattering.
Draebing et al. (2017) and Draebing (2020) monitored a crack opening in an alpine environment. In this extreme environment, they observed an ice-wedging-driven crack opening of up to 1 mm over several days during the snowmelt period. By comparing the joint measurements of temperature and dilatation, the authors established an irreversible gradual joint opening of approximately 0.1 mm yr−1. Our data from the 2020/21 winter period and the newly instrumented site in the Krkonoše mountains should show similar results. However, with the lack of active permafrost and permanently ice-filled joints at our sites, these movements should have a lower magnitude.
Measuring the temperature of dry unfrozen rock mass depth is still a rarely used approach. Magnin et al. (2015a) measured rock mass temperature inside 10 m deep boreholes. This research was oriented mainly to active permafrost depth estimation and its spatiotemporal behaviour. In the shallow subsurface zone, they measured an annual temperature amplitude of approximately 5 ∘C at a depth of 3 m. Our data from subhorizontal boreholes show a rock mass temperature amplitude of approximately 10 ∘C at a depth of 3 m. This is probably caused by the different climatic setup of our sites.
Fiorucci et al. (2018) studied short-term temperature profiles on an experimental limestone quarry rock slope. The diurnal temperature cycles in their case reached a maximum depth of approximately 20–30 cm. These results correspond to our measurements. We are able to observe diurnal temperature cycles of up to 50 cm in depth during the summer, when the rock mass surface is intensively heated by solar radiation. It is necessary to mention that a comparison of these results is not straightforward due to the diverse climatic setup.
The three sites will be continuously measured for a period of 1–2 years. Based on this, we will be able to show that the system is capable of observing the influence of thermal stress on the response of the monitored blocks (Fig. 7). However, to exclude seasonality, the time series of the crackmeter positions should be longer than 2–3 years. In a longer period, we expect to observe the process of long-term rock slope destabilisation represented by a gradual irreversible trend of crack opening/closure, which alludes to partial block destabilisation. Longer time series also allow seasonal statistical trend tests to be used to describe trends in the monitored joint dynamics. The influence of meteorological variables on the stability of the rock blocks will be statistically analysed to determine how individual meteorological variables influence the dynamic of the joints. In-depth temperatures will be analysed to find differences in thermal conductivity, diffusivity, and seasonal temperature trends between the monitored sites. Differences in the thermomechanical behaviour of the different rock slopes will be studied using numerical modelling. Furthermore, the monitoring system will be continuously upgraded. Installation of in situ strain gauges is planned to directly observe changes in the rock mass surface strain.
A newly designed rock slope stability monitoring system was presented. This system combines monitoring of meteorological variables with 3 m deep in-rock thermal profiles and dilatation of the unstable rock block joints. It provides a unique opportunity to observe long-term gradual changes within the rock face, leading to rock slope destabilisation.
The design of the system allows for easy installation at various locations without major adjustments or modifications. All components of the system are available off the shelf at a relatively low price and are easy to replace with low skill requirements. The environmental data are transferred via GSM to a remote server, and the dilatation data are sent via the IoT SigFox network or may be downloaded remotely from several tens of metres. Therefore, maintenance visits to the sites may be limited to intervals of several months.
The monitored sites are easily comparable as identical monitoring setup and equipment are used. Therefore, we are monitoring the reaction of various rock types on a certain climatic event and observing the differences and similarities on particular sites. This concerns not only movements or expansion of the rock mass but also the heat advance into the rock, its velocity, and amplitude, which are otherwise very difficult to measure. Significant differences in the shallow surface rock mass zone are observable from 3 m borehole thermocouple probe data.
Further development of this project should include the implementation of in situ rock surface strain monitoring using in situ strain gauges. In the following research, in situ data will be used for numerical modelling of heat flow and heat-induced strain within the rock mass.
Joint movement measurements combined with temperature and other external influencing factors will be analysed to understand the contribution of the individual processes leading to rock slope destabilisation. The whole system will be gradually maintained and placed at other suitable sites.
Data are available at https://data.mendeley.com/datasets/4t38tvb4yn/draft?a=f9020d9b-fbd3-4489-a1ca-0e4ffd623212 (Racek, 2021).
OR, JB, and FH designed the system and directed the instrumentation of the sites, and continuously processed data and maintained the monitored sites. OR processed the crackmeter data. JB processed in-depth temperature data and environmental data. FH supervised all work, helped with the graphic parts of the manuscript, and participated in setting up the monitoring.
The authors declare that they have no conflict of interest.
Publisher's note: Copernicus Publications remains neutral with regard to jurisdictional claims in published maps and institutional affiliations.
We would like to thank Charles University and the Czech Academy of Sciences for their financial support. We would also like to thank the reviewers and the editor for their beneficial remarks that lead to the improvement of this paper.
This research was performed in the framework of the long-term conceptual development research organisation RVO: 67985891, TAČR project no. SS02030023 “Rock environment and resources” within the programme “Environment for life”, internal financing from Charles University Progress Q44 and SVV (SVV260438) and the Charles University Grant Agency (GAUK 359421).
This paper was edited by Anette Eltner and reviewed by two anonymous referees.
Ansari, M. K., Ahmed, M., Singh, T. N. R., and Ghalayani, I.: Rainfall, A Major Cause for Rockfall Hazard along the Roadways, Highways and Railways on Hilly Terrains in India, in: Engineering Geology For Society And Territory, Vol. 1, Springer, Cham, 457–460, 2015.
Bakun-Mazor, D., Hatzor, Y. H., Glaser, S. D., and Santamarina, J. C.: Thermally vs. seismically induced block displacements in Masada rock slopes, Int. J. Rock Mech. Min., 61, 196–211, https://doi.org/10.1016/j.ijrmms.2013.03.005, 2013.
Bakun-Mazor, D., Keissar, Y., Feldheim, A., Detournay, C., and Hatzor, Y. H.: Thermally-Induced Wedging – Ratcheting Failure Mechanism in Rock Slopes, Rock Mech. Rock Eng., 53, 2521–2538, https://doi.org/10.1007/s00603-020-02075-6, 2020.
Barton, M. E. and McCosker, A. M.: Inclinometer and tiltmeter monitoring of a high chalk cliff, in: Inclinometer And Tiltmeter Monitoring Of A High Chalk Cliff, edited by: Barton, M. E. and McCosker, A. M., Landslides In Research, Theory And Practice: Proceedings Of The 8th International Symposium On Landslides, Cardiff, 26–30 June 2000, Thomas Telford Publishing, Abstract no. 20, 127–132., 2000.
Blikra, L. and Christiansen, H. H.: A field-based model of permafrost-controlled rockslide deformation in northern Norway, Geomorphology, 208, 34–49, https://doi.org/10.1016/j.geomorph.2013.11.014, 2014.
Burjanek, J., Gassner-Stamm, G., Poggi, V., Moore, J. R., and Faeh, D.: Ambient vibration analysis of an unstable mountain slope, Geophys. J. Int., 180, 820–828, https://doi.org/10.1111/j.1365-246X.2009.04451.x, 2010.
Burjanek, J., Gischig, V., Moore, J. R., and Fah, D.: Ambient vibration characterization and monitoring of a rock slope close to collapse, Geophys. J. Int., 212, 297–310, https://doi.org/10.1093/gji/ggx424, 2018.
Chen, T., Deng, J., Sitar, N., Zheng, J., Liu, T., Liu, A., and Zheng, L.: Stability investigation and stabilization of a heavily fractured and loosened rock slope during construction of a strategic hydropower station in China, Eng. Geol., 221, 70–81, https://doi.org/10.1016/j.enggeo.2017.02.031, 2017.
Coccia, S., Kinscher, J., and Vallet, A.: Microseismic and meteorological monitoring of Séchilienne (French Alps) rock slope destabilisatio, in: 3. International Symposium Rock Slope Stability (Rss2016), November 2016, Lyon, France, 31–32, 2016.
Collins, B. and Stock, G. M.: Rockfall triggering by cyclic thermal stressing of exfoliation fractures, Nat. Geosci., 9, 395–400, https://doi.org/10.1038/ngeo2686, 2016.
Collins, B. D., Stock, G. M., and Eppes, M. C.: Progressive Thermally Induced Fracture of an Exfoliation Dome: Twain Harte, California, USA, in: Isrm Progressive Rock Failure Conference, 5–9 June 2017, Ascona, Switzerland, 2017.
Crosta, G. B., Agliardi, F., Rivolta, C., Alberti, S., and Dei Cas, L.: Long-term evolution and early warning strategies for complex rockslides by real-time monitoring, Landslides, 14, 1615–1632, https://doi.org/10.1007/s10346-017-0817-8, 2017.
D'Amato, J., Hantz, D., Guerin, A., Jaboyedoff, M., Baillet, L., and Mariscal, A.: Influence of meteorological factors on rockfall occurrence in a middle mountain limestone cliff, Nat. Hazards Earth Syst. Sci., 16, 719–735, https://doi.org/10.5194/nhess-16-719-2016, 2016.
Dewez, T. J. B., Girardeau-Montaut, D., Allanic, C., and Rohmer, J.: Facets: A cloudcompare plugin to extract geological planes from unstructured 3d point clouds, Int. Arch. Photogramm., 41, 799–804, 2016.
do Amaral Vargas, E., Velloso, R. Q., Chávez, L. E., and Gusmao, L.: On the Effect of Thermally Induced Stresses in Failures of Some Rock Slopes in Rio de Janeiro, Brazil, Rock Mech. Rock Eng., 46, 123–134, https://doi.org/10.1007/s00603-012-0247-9, 2013.
Draebing, D.: Identification of rock and fracture kinematics in high alpine rockwalls under the influence of elevation, Earth Surf. Dynam., 9, 977–994, https://doi.org/10.5194/esurf-9-977-2021, 2021.
Draebing, D., Krautblatter, M., and Hoffmann, T.: Thermo-cryogenic controls of fracture kinematics in permafrost rockwalls, Geophys. Res. Lett., 44, 3535–3544, https://doi.org/10.1002/2016GL072050, 2017.
Du, Y., Xie, M.-wen, Jiang, Y.-jing, Li, B., and Chicas, S.: Experimental Rock Stability Assessment Using the Frozen–Thawing Test, Rock Mech. Rock Eng., 50, 1049–1053, https://doi.org/10.1007/s00603-016-1138-2, 2017.
Eppes, M., Magi, B., Hallet, B., Delmelle, E., Mackenzie-Helnwein, P., Warren, K., and Swami, S.: Deciphering the role of solar-induced thermal stresses in rock weathering, Geol. Soc. Am. Bull., 128, 1315–1338, https://doi.org/10.1130/B31422.1, 2016.
Fantini, A., Fiorucci, M., Martino, S., Marino, L., Napoli, G., Prestininzi, A., Salvetti, O., Sarandrea, P., and Stedile, L.: Multi-sensor system designed for monitoring rock falls: the experimental test-site of Acuto (Italy), Rendiconti Online Societa Geologica Italiana, 41, 147–150, https://doi.org/10.3301/ROL.2016.115, 2016.
FEATool: Multiphysics v1.13, User's Guide, Precise Simulation Ltd., available at: https://www.featool.com (last access: 10 October 2021), 2020.
FIEDLER: Elektronika pro ekologii, https://www.fiedler.company/ (last access: 21 September 2020), 2020.
Fiorucci, M., Marmoni, G. M., Martino, S., and Mazzanti, P.: Thermal Response of Jointed Rock Masses Inferred from Infrared Thermographic Surveying (Acuto Test-Site, Italy), Sensors, 18, 2221, https://doi.org/10.3390/s18072221, 2018.
GEFRAN: Position Transducers, 1st Edn., 25050 Provaglio d'Iseo (BS) Italy, GEFRAN, Provaglio D'Iseo, 2020.
Girard, L., Beutel, J., Gruber, S., Hunziker, J., Lim, R., and Weber, S.: A custom acoustic emission monitoring system for harsh environments: application to freezing-induced damage in alpine rock walls, Geosci. Instrum. Method. Data Syst., 1, 155–167, https://doi.org/10.5194/gi-1-155-2012, 2012.
Girardeau-Montaut, D.: CloudCompare, CloudCompare, https://www.danielgm.net/cc (last access: 20 January 2021), 2016.
Greif, V., Brcek, M., Vlcko, J., Varilova, Z., and Zvelebil, J.: Thermomechanical behavior of Pravcicka Brana Rock Arch (Czech Republic), Landslides, 14, 1441–1455, https://doi.org/10.1007/s10346-016-0784-5, 2017.
Gruber, S., Hoelzle, M., and Haeberli, W.: Permafrost thaw and destabilization of Alpine rock walls in the hot summer of 2003, Geophys. Res. Lett., 31, L13504, https://doi.org/10.1029/2004GL020051, 2004.
Guerin, A., Jaboyedoff, M., Collins, B. D., Derron, M.-H., Stock, G. M., Matasci, B., Boesiger, M., Lefeuvre, C., and Podladchikov, Y. Y.: Detection of rock bridges by infrared thermal imaging and modeling, Sci. Rep., UK9, 13138–13138, https://doi.org/10.1038/s41598-019-49336-1, 2019.
Gunzburger, Y. and Merrien-Soukatchoff, V.: Near-surface temperatures and heat balance of bare outcrops exposed to solar radiation, Earth Surf. Proc. Land., 36, 1577–1589, https://doi.org/10.1002/esp.2167, 2011.
Gunzburger, Y., Merrien-Soukatchoff, V., and Guglielmi, Y.: Influence of daily surface temperature fluctuations on rock slope stability: case study of the Rochers de Valabres slope (France), Int. J. Rock Mech. Min., 42, 331–349, https://doi.org/10.1016/j.ijrmms.2004.11.003, 2005.
Hall, K. and Andre, M. F.: New insights into rock weathering from high-frequency rock temperature data: an Antarctic study of weathering by thermal stress, Geomorphology, 41, 23–35, https://doi.org/10.1016/S0169-555X(01)00101-5, 2001.
Hall, K. and André, M. F.: Rock thermal data at the grain scale: applicability to granular disintegration in cold environments, Earth Surf. Proc. Land., 28, 823–836, https://doi.org/10.1002/esp.494, 2003.
Hellmy, M. A. A., Muhammad, R. F., Shuib, M. K., Fatt, N. T., Abdullah, W. H., Abu Bakar, A., and Kugler, R.: Rock Slope Stability Analysis based on Terrestrial LiDAR and Scanline Survey on Karst Hills in Kinta Valley Geopark, Perak, Peninsular Malaysia, Sains Malays., 48, 2595–2604, https://doi.org/10.17576/jsm-2019-4811-29, 2019.
Hermans, R. L. and Longva, O.: Rapid rock-slope failures, in: Landslides: Types, Mechanisms And Modeling, Cambridge university press, Cambridge, 59–70, 2012.
Hoelzle, M., Azisov, E., Barandun, M., Huss, M., Farinotti, D., Gafurov, A., Hagg, W., Kenzhebaev, R., Kronenberg, M., Machguth, H., Merkushkin, A., Moldobekov, B., Petrov, M., Saks, T., Salzmann, N., Schöne, T., Tarasov, Y., Usubaliev, R., Vorogushyn, S., Yakovlev, A., and Zemp, M.: Re-establishing glacier monitoring in Kyrgyzstan and Uzbekistan, Central Asia, Geosci. Instrum. Method. Data Syst., 6, 397–418, https://doi.org/10.5194/gi-6-397-2017, 2017.
Isaka, B. L. A., Gamage, R. P., Rathnaweera, T. D., Perera, M. S. A., Chandrasekharam, D., and Kumari, W. G. P.: An Influence of Thermally-Induced Micro-Cracking under Cooling Treatments: Mechanical Characteristics of Australian Granite, Energies, 11, 1338, https://doi.org/10.3390/en11061338, 2018.
Jaboyedoff, M., Ornstein, P., and Rouiller, J.-D.: Design of a geodetic database and associated tools for monitoring rock-slope movements: the example of the top of Randa rockfall scar, Nat. Hazards Earth Syst. Sci., 4, 187–196, https://doi.org/10.5194/nhess-4-187-2004, 2004.
Jaboyedoff, M., Oppikofer, T., Derron, M. H., Blikra, L. H., Böhme, M., and Saintot, A.: Complex landslide behaviour and structural control: a three-dimensional conceptual model of Åknes rockslide, Norway, Geol. Soc. Sp., 351, 147, https://doi.org/10.1144/SP351.8, 2011.
Janeras, M., Jara, J.-A., Royan, M. J., Vilaplana, J.-M., Aguasca, A., Fabregas, X., Gili, J. A., and Buxo, P.: Multi-technique approach to rockfall monitoring in the Montserrat massif (Catalonia, NE Spain), Eng. Geol., 219, 4–20, https://doi.org/10.1016/j.enggeo.2016.12.010, 2017.
Klimes, J., Rowberry, M. D., Blahut, J., Briestensky, M., Hartvich, F., Kost'ak, B., Rybar, J., Stemberk, J., and Stepancikova, P.: The monitoring of slow-moving landslides and assessment of stabilisation measures using an optical–mechanical crack gauge, Landslides, 9, 407–415, https://doi.org/10.1007/s10346-011-0306-4, 2012.
Krautblatter, M. and Moore, J. R.: Rock slope instability and erosion: toward improved process understanding, Earth Surf. Proc. Land., 39, 1273–1278, https://doi.org/10.1002/esp.3578, 2014.
Krautblatter, M. and Moser, M.: A nonlinear model coupling rockfall and rainfall intensity based on a four year measurement in a high Alpine rock wall (Reintal, German Alps), Nat. Hazards Earth Syst. Sci., 9, 1425–1432, https://doi.org/10.5194/nhess-9-1425-2009, 2009.
Kromer, R., Walton, G., Gray, B., and Lato, M.: Development and Optimization of an Automated Fixed-Location Time Lapse Photogrammetric Rock Slope Monitoring System, Remote Sens-Basel, 11, 1890, https://doi.org/10.3390/rs11161890, 2019.
Lazar, A., Beguž, T., and Vulič, M.: Monitoring of the Belca rockfall, Acta Geotech. Slov., 15, 2–15, https://doi.org/10.18690/actageotechslov.15.2.2-15.2018, 2018.
Li, A., Xu, N., Dai, F., Gu, G., Hu, Z., and Liu, Y.: Stability analysis and failure mechanism of the steeply inclined bedded rock masses surrounding a large underground opening, Tunn. Undergr. Sp. Tech., 77, 45–58, https://doi.org/10.1016/j.tust.2018.03.023, 2018.
Loche, M., Scaringi, G., Blahůt, J., Melis, M. T., Funedda, A., Da Pelo, S., Erbì, I., Deiana, G., Meloni, M. A., and Cocco, F.: An infrared 595 thermography approach to evaluate the strength of a rock cliff, Remote Sens., 13, 1265, https://doi.org/10.3390/rs13071265, 2021.
Loew, S., Gischig V., Willengerg, H., Alpiger, A., and Moore, J. R.: 24 Randa: Kinematics and driving mechanisms of a large complex rockslide, in: Landslides: Types, Mechanisms and Modeling, 297–309, Cambridge university press, Cambridge, https://doi.org/10.1017/CBO9780511740367.025, 2012.
Loew, S., Gschwind, S., Gischig, V., Keller-Signer, A., and Valent, G.: Monitoring and early warning of the 2012 Preonzo catastrophic rockslope failure, Landslides, 14, 141–154, https://doi.org/10.1007/s10346-016-0701-y, 2017.
Ma, C., Li, T., and Zhang, H.: Microseismic and precursor analysis of high-stress hazards in tunnels: A case comparison of rockburst and fall of ground, Eng. Geol., 265, 105435, https://doi.org/10.1016/j.enggeo.2019.105435, 2020.
Macciotta, R., Martin, C. D., Edwards, T., Cruden, D. M., and Keegan, T.: Quantifying weather conditions for rock fall hazard management, Georisk, 9, 171–186, https://doi.org/10.1080/17499518.2015.1061673, 2015.
Magnin, F., Deline, P., Ravanel, L., Noetzli, J., and Pogliotti, P.: Thermal characteristics of permafrost in the steep alpine rock walls of the Aiguille du Midi (Mont Blanc Massif, 3842 m a.s.l), The Cryosphere, 9, 109–121, https://doi.org/10.5194/tc-9-109-2015, 2015a.
Magnin, F., Krautblatter, M., Deline, P., Ravanel, L., Malet, E., and Bevington, A.: Determination of warm, sensitive permafrost areas in near-vertical rockwalls and evaluation of distributed models by electrical resistivity tomography, J. Geophys. Res.-Earth, 120, 745–762, https://doi.org/10.1002/2014JF003351, 2015b.
Marmoni, G. M., Fiorucci, M., Grechi, G., and Martino, S.: Modelling of thermo-mechanical effects in a rock quarry wall induced by near-surface temperature fluctuations, Int. J. Rock Mech. Min., 134, 104440, https://doi.org/10.1016/j.ijrmms.2020.104440, 2020.
Matano, F., Pignalosa, A., Marino, E., Esposito, G., Caccavale, M., Caputo, T., Sacchi, M., Somma, R., Troise, C., and De Natale, G.: Laser Scanning Application for Geostructural analysis of Tuffaceous Coastal Cliffs: the case of Punta Epitaffio, Pozzuoli Bay, Italy, Eur. J. Remote Sens., 48, 615–637, https://doi.org/10.5721/EuJRS20154834, 2015.
Matsuoka, N.: Frost weathering and rockwall erosion in the southeastern Swiss Alps: Long-term (1994–2006) observations, Geomorphology, 99, 353–368, https://doi.org/10.1016/j.geomorph.2007.11.013, 2008.
Matsuoka, N.: A multi-method monitoring of timing, magnitude and origin of rockfall activity in the Japanese Alps, Geomorphology, 336, 65–76, https://doi.org/10.1016/j.geomorph.2019.03.023, 2019.
Nishii, R. and Matsuoka, N.: Monitoring rapid head scarp movement in an alpine rockslide, Eng. Geol., 115, 49–57, https://doi.org/10.1016/j.enggeo.2010.06.014, 2010.
Noetzli, J. and Pellet, C.: 20 years of mountain permafrost monitoring in the Swiss Alps: key results and major challenges, in: EGU General Assembly Conference Abstracts, 10903, EGU, Munich, 2020.
Pappalardo, G., Mineo, S., Zampelli, S. P., Cubito, A., and Calcaterra, D.: InfraRed Thermography proposed for the estimation of the Cooling Rate Index in the remote survey of rock masses, Int. J. Rock Mech. Min., 83, 182–196, https://doi.org/10.1016/j.ijrmms.2016.01.010, 2016.
Pappalardo, M. and D'Olivo, M.: Testing A Methodology to Assess Fluctuations of Coastal Rocks Surface Temperature, Journal of Marine Science and Engineering, 7, 315, https://doi.org/10.3390/jmse7090315, 2019.
Pasten, C., M. García, M., and Cortes, D. D.: Physical and numerical modelling of the thermally induced wedging mechanism, Geotech. Lett., 5, 186–190, 2015.
Pratt, C., Macciotta, R., and Hendry, M.: Quantitative relationship between weather seasonality and rock fall occurrences north of Hope, BC, Canada. B. Eng. Geol. Environ., 78, 3239–3251, https://doi.org/10.1007/s10064-018-1358-7, 2019.
Raback, P. and Malinen, M.: Overview of elmer, CSC-IT Centre for Science, 2016.
Racek, J.: Use of rock mass classifications for rock fall susceptibility analysis in the conditions of the Bohemian Massif (BS), Praha, 2020.
Racek, O.: Rock slope monitoring data, Mendeley Data [data set], https://doi.org/10.17632/4t38tvb4yn.2, 2021.
Racek, O., Blahůt, J., and Hartvich, F.: Monitoring of thermoelastic wave within a rock mass coupling information from IR camera and crack meters: a 24 h experiment on “Branická skála” Rock in Prague, Czechia, in: Understanding And Reducing Landslide Disaster Risk: Volume 3 Monitoring And Early Warning, Springer International Publishing, Cham, https://doi.org/10.1007/978-3-030-60311-3_3, 2021.
Ravanel, L., Magnin, F., and Deline, P.: Impacts of the 2003 and 2015 summer heatwaves on permafrost-affected rock-walls in the Mont Blanc massif, Sci. Total Environ., 609, 132–143, https://doi.org/10.1016/j.scitotenv.2017.07.055, 2017.
Reiterer, A., Huber, N. B., and Bauer, A.: Image-based point detection and matching in a geo-monitoring system, Allgemeine Vermessungsnachrichten, 117, 129–139, 2010.
Riquelme, A., Abelian, A., Tomas, R., and Jaboyedoff, M.: A new approach for semi-automatic rock mass joints recognition from 3D point clouds, Comput. Geosci., 68, 38–52, https://doi.org/10.1016/j.cageo.2014.03.014, 2014.
Sarro, R., Riquelme, A., Carlos Garcia-Davalillo, J., Maria Mateos, R., Tomas, R., Luis Pastor, J., Cano, M., and Herrera, G.: Rockfall Simulation Based on UAV Photogrammetry Data Obtained during an Emergency Declaration: Application at a Cultural Heritage Site, Remote Sens.-Basel, 10, 1923, https://doi.org/10.3390/rs10121923, 2018.
Sass, O. and Oberlechner, M.: Is climate change causing increased rockfall frequency in Austria?, Nat. Hazards Earth Syst. Sci., 12, 3209–3216, https://doi.org/10.5194/nhess-12-3209-2012, 2012.
Saez Blázquez, C., Farfan Martin, A., Martin Nieto, I., Carrasco Garcia, P., and Sanchez Perez, L. S., Gonzalez Aguilera, D.: Thermal conductivity map of the Avila region (Spain) based on thermal conductivity measurements of different rock and soil samples, Geothermics, 65, 60–71, 2017.
Scaioni, M., Marsella, M., Crosetto, M., Tornatore, V., and Wang, J.: Geodetic and Remote-Sensing Sensors for Dam Deformation Monitoring, Sensors, 18, 3682, https://doi.org/10.3390/s18113682, 2018.
Selby, M. J.: A rock mass strength classification for geomorphic purposes: with tests from Antarctica and New Zealand, Z. Geomorphol., 24, 31–51, 1980.
Tertium Technology: Gego Crack meter, Pisa, Italy, available at: https://www.tertiumtechnology.com/downloads/schede_prodotti_eng/TERTIUM_Geko_datasheet_ENG.pdf (last access: 20 January 2021), 2019.
Thiele, S. Grose, L., and Micklethwaite, S.: Compass: A CloudCompare workflow for digital mapping and structural analysis, in: EGU General Assembly Conference Abstracts, 5548, EGU, Munich, 2018.
Tripolitsiotis, A., Daskalakis, A., Mertikas, S., Hristopulos, D., Agioutantis, Z., and Partsinevelos, P.: Detection of small-scale rockfall incidents using their seismic signature, Third International Conference on Remote Sensing and Geoinformation of the Environment, 9535, 1–9, International Society for Optics and Photonics, Belingham, 2015.
Vasile, M. and Vespremeanu-Stroe, A.: Thermal weathering of granite spheroidal boulders in a dry-temperate climate, Northern Dobrogea, Romania, Earth Surf. Proc. Land., 42, 259–271, https://doi.org/10.1002/esp.3984, 2017.
Vespremeanu-Stroe, A. and Vasile, M.: Rock Surface Freeze-Thaw and Thermal Stress Assessment in two Extreme Mountain Massifs: Bucegi and Măcin Mts., Revista de Geomorfologie, 12, 2010.
Viles, H.: Linking weathering and rock slope instability: non-linear perspectives, Earth Surf. Proc. Land., 38, 62–70, https://doi.org/10.1002/esp.3294, 2013.
Vonder Muehll, D., Noetzli, J., and Roer, I.: PERMOS – a comprehensive monitoring network of mountain permafrost in the Swiss Alps, Proceedings of the 9th International Conference on Permafrost, Fairbanks, US, 1869–1874, 2008.
Warren, K., Eppes, M.-C., Swami, S., Garbini, J., and Putkonen, J.: Automated field detection of rock fracturing, microclimate, and diurnal rock temperature and strain fields, Geosci. Instrum. Method. Data Syst., 2, 275–288, https://doi.org/10.5194/gi-2-275-2013, 2013.
Weber, S., Beutel, J., Faillettaz, J., Hasler, A., Krautblatter, M., and Vieli, A.: Quantifying irreversible movement in steep, fractured bedrock permafrost on Matterhorn (CH), The Cryosphere, 11, 567–583, https://doi.org/10.5194/tc-11-567-2017, 2017.
Weber, S., Beutel, J., Faillettaz, J., Meyer, M., and Vieli, A.: Acoustic and micro-seismic signal of rockfall on Matterhorn., in: 5th European Conference On Permafrost, Book Of Abstracts, Laboratoire EDYTEM, Université de Savoie Mont-Blanc, Chamonix, 944–945, 2018.
Weigand, M., Wagner, F. M., Limbrock, J. K., Hilbich, C., Hauck, C., and Kemna, A.: A monitoring system for spatiotemporal electrical self-potential measurements in cryospheric environments, Geosci. Instrum. Method. Data Syst., 9, 317–336, https://doi.org/10.5194/gi-9-317-2020, 2020.
Westoby, M. J., Brasington, J., Glasser, N. F., Hambrey, M. J., and Reynolds, J. M.: “Structure-from-Motion” photogrammetry: A low-cost, effective tool for geoscience applications, Geomorphology, 179, 300–314, https://doi.org/10.1016/j.geomorph.2012.08.021, 2012.
Yan, Y., Li, T., Liu, J., Wang, W., and Su, Q.: Monitoring and early warning method for a rockfall along railways based on vibration signal characteristics, Sci. Rep., UK9, 6606–6606, https://doi.org/10.1038/s41598-019-43146-1, 2019.
Yavaşoğlu, H. H., Alkan, M. N., Bilgi, S., and Alkan, Ö.: Monitoring aseismic creep trends in the İsmetpaşa and Destek segments throughout the North Anatolian Fault (NAF) with a large-scale GPS network, Geosci. Instrum. Method. Data Syst., 9, 25–40, https://doi.org/10.5194/gi-9-25-2020, 2020.
Zangerl, C., Eberhardt, E., and Perzlmaier, S.: Kinematic behaviour and velocity characteristics of a complex deep-seated crystalline rockslide system in relation to its interaction with a dam reservoir, Eng. Geol., 112, 53–67, https://doi.org/10.1016/j.enggeo.2010.01.001, 2010.
Zhang, F., Zhao, J., Hu, D., Skoczylas, F., and Shao, J.: Laboratory Investigation on Physical and Mechanical Properties of Granite After Heating and Water-Cooling Treatment, Rock Mech. Rock Eng., 51, 677–694, https://doi.org/10.1007/s00603-017-1350-8, 2018.