the Creative Commons Attribution 4.0 License.
the Creative Commons Attribution 4.0 License.
 | 05 Apr 2022
Wind speed influences corrected Autocalibrated Soil Evapo-respiration Chamber (ASERC) evaporation measures
Bartosz M. Zawilski
Soil evaporation concerns water and our life support sources, which are important for agriculture or for climate change prediction science. A simple instrument based on the nonsteady-state (NSS) technique for soil evaporation measurement appears suitable. However, because the NSS chamber technique is highly invasive, special care should be provided to correct the wind speed influence on the evaporation process. Soil evaporation is a complex process that involves many soil and air characteristics. Measurement chamber installation on the soil and its head deployment may perturb these characteristics. We therefore had to minimize differences or to correct the measurements. Most of the differences between bare soil and soil with a deployed chamber head can be minimized, except for the wind speed influences that are not reproducible inside a chamber head. Meanwhile, as the wind influences depend on numerous variables that are not monitorable in real time, a self-calibrating chamber with a corresponding protocol called the Autocalibrated Soil Evapo-respiration Chamber (ASERC) was developed to make the measurements easily corrigible on bare soil with a unique variable (wind speed, WS), regardless of the soil composition, soil texture, and other soil or air meteorological variables. A simple protocol followed by this chamber allows us to determine the soil evaporation wind speed susceptibility (Z) and to correct the measurements achieving 0.95 as the coefficient of determination. Some interesting findings on sandy and clayey soil evaporation measured during laboratory calibration and “slow” sensor simulation will also be reported in the two appendices.
- Article
(2614 KB) - Full-text XML
- Companion paper
- BibTeX
- EndNote


In the context of rising global temperature, as water is our main life support key resource for food production, and water vapor is one of the most abundant greenhouse gases in the Earth's atmosphere, it is important to gather knowledge about soil evaporation. Soil evaporation may be a major source of soil moisture loss. On the one hand, the global direct soil evaporative annual precipitation losses are as high as 20 %, and the other 40 % of precipitation losses are due to vegetation transpiration (Oki and Kanae, 2006). In arid and semiarid regions, soil evaporation may reach up to 75 % of the precipitation (Riou, 1997) when total soil evaporation along with vegetation transpiration, so-called evapotranspiration, may dissipate up to 90 % of the annual precipitation (Pilgrim et al., 1988; Wilcox et al., 2003). On the other hand, soil evaporation consumes approximately 20 % of solar radiation energy (Trenberth et al., 2009). Energy absorbed on the soil surface or in the soil subsurface during the evaporation process, lowering soil temperature, is released later in the higher atmosphere layer when condensing, warming up the air. Water vapor is the most important greenhouse gas in the atmosphere not because of its efficiency but because it is the most abundant; 60 % of the total greenhouse effect (Trenberth et al., 2009; Schmidt et al., 2010) and its recently measured upper-tropospheric concentration increase are directly attributable to human activities (Choung et al., 2014). Good et al. (2015) showed that the main water vapor source (65 %) was the soil surface, not the water surface.
Water vapor effluxes are commonly measured using different techniques. The widely used eddy covariance technique is a relatively expensive but minimally invasive way to estimate soil evaporation on bare soil and other trace gas fluxes. This technique consists of a high-frequency air analysis, typically by a nondispersive infrared (NDIR) or infrared gas analyzer (IRGA) at 10 or 20 Hz along with a high-frequency air velocity measurement by an ultrasonic anemometer. From these measurements, a covariance is deduced that allows us to compute the trace gas fluxes. As with every measurement technique, eddy covariance has its pros and cons. Eddy covariance provides evaporation estimation when the air flow is turbulent enough, which means only when the wind is strong enough, which is usually not the case at night. Additionally, these measurements are not precisely localized, and the provenance is approximative. This point is often a force since the measurements reflect the mean process but not when a precise provenance is sought after. However, eddy covariance cannot be implemented everywhere. The site should be flat and big enough (please see the book edited by Aubinet et al., 2012, a book dedicated to eddy covariance which describes this technique and its requirements from a practical point of view). Additionally, a systemic underestimation of eddy covariance CO2 flux compared to fluxes measured using the closed-chamber technique was pointed out by numerous authors (Goulden et al., 1996; Norman et al., 1997; Law et al., 1999; Hollinger et al., 1999; Janssens et al., 2000; Pavelka et al., 2007; Zha et al., 2007; Myklebust et al., 2008; Schrier-Uijl et al., 2010). Nevertheless, we must keep in mind that chamber measurements have to be carefully considered and, in the same way as for evaporation, other gas efflux measurements have to be corrected versus the wind speed. Under calm conditions, due to internal fan perturbations, closed chambers may have a tendency to overestimate possible soil efflux (Schneider et al., 2009; Brændholt et al., 2017).
In the case of the presence of vegetation, to separate transpiration from soil evaporation, an experimental isotopic mass balance approach can be adopted (Ferretti et al., 2003). This technique requires frequent air sampling and laboratory analysis or expensive and voluminous analyzer use. Eddy covariance measurements give total (soil evaporation and vegetation transpiration) evapotranspiration. Coupled with partitioning according to a model (see Koola et al., 2014 for a review), a separation of soil and vegetation contributions is possible. Each specific model may be accurate but only for a specific plant, making it difficult to apply the model to a mixed plant cover. Moreover, even for a specific plant, there are numerous models giving different results. For maize, there are over 29 models (Kimball et al., 2019). Additionally, each model requires more or less numerous variable injections, which make some models difficult to apply since the required variables are not known (Kustas and Agam, 2014).
Another widely used technique for direct soil evaporation measurements is lysimeters from microlysimeters for bare soil evaporation measurements and large-scale lysimeters to measure the total evapotranspiration (listed by Liu et al., 2002). This technique consists roughly of weighing a hold soil colon, giving a direct evaporation or evapotranspiration measurement if the surface of the soil colon is large enough to hold supplementary vegetation. However, this apparatus should be deeply buried, making this measurement relatively hard to implement, especially when frequent apparatus displacements are necessary, as is the case on an agricultural plot (tillage and other soil operations). Lysimeters also require deep enough soil, which is not the case with the presence of shallow rock and even simple stones, and provide a timely averaged measurement because the weight variation caused by water evaporation needs to be important enough compared to the total enclosed soil weight.
Relatively recently, a heat-balance-based method using heat pulse probes was proposed by Sauer et al. (2007) and Heitman et al. (2008, 2017). This technique assumes that the heat budget disclosure is due only to water evaporation and allows measurements only in the subsurface, leaving surface evaporation unmeasurable. However, this technique is the only technique that allows us to track subsurface evaporation with depth.
Therefore, an exclusive, fast and easy-to-implement bare soil evaporation measurement is suitable. A dynamic closed nonsteady-state (NSS) technique used for soil trace gas efflux measurements may also be used for soil evaporation assessment. However, for these measurements, probably more than for other soil efflux measurements, measured data must be carefully corrected. Indeed, this technique is not a direct measurement and is highly invasive. By shearing the roots, the collar alters the behavior of the enclosed soil (Heinemeyer et al., 2011), thus limiting the autotrophic respiration component. Moreover, the chamber presence, particularly during chamber head deployment when the enclosed soil is isolated from the external meteorological conditions, such as the wind, perturbs the behavior of the enclosed soil (see Rochette et al., 1997; Rochette and Hutchinson, 2005 for chamber technique description). Notably, motivated by the measurement of the soil surface energy budget imbalance and a probable subsurface evaporation contribution, a simple and versatile soil evaporation measurement instrument was developed. Based on an automatic nonsteady-state (NSS) chamber technique, special attention is given to solar radiation heating, pressure variation preservation and wind speed influence. Chamber construction and its characteristics, the developed protocol for evaporation calculations, and the developed calculation algorithms are reported. Wind speed influence is different on sandy and clayey soil, which could be explained by bay soil water vapor sorption and will be discussed along with unexpected inertia behavior. The latter phenomena require some precautions but allow us to assess the chamber head air mixing time. Finally, the wind speed influence correction function is presented.
This study is based on over 1000 measurement cycles (that is, over 10 000 chamber deployments over 2 years) and, after calibration of the wind speed influence on the evaporation and chamber perturbation correction, shows reasonable agreement between chamber measurements and real evaporation rate with R2>0.95. The same correction formula is used for sandy and clayey soils regardless of the soil moisture.
The wind influence on soil water vapor efflux is well known and widely studied (Thornthwaite and Holzman, 1942; Hanks and Woodruff, 1958). Even if a nondiffusive regime for a soil evaporation process were explored more than a half century ago (Fukuda, 1955), considering a gusty wind influence from the theoretical point of view by a sinusoidal representation, concluding with a negligibility of the phenomenon, other authors studied and experimented with wind-influenced evaporation (Farrell et al., 1966; Scotter and Raats, 1968) and concluded, on the contrary, that a nondiffusive regime had great importance. Recently, both experimental and nondiffusive regimes such as thermal and solutal dispersion (Davarzani et al., 2014; Roland et al., 2015), convection and advection, or pressure fluctuations have an important or even the most important role for gas movement through porous media (soil); see Sánchez-Cañete et al. (2016) and the references given there. One of the major gas movement causes is wind pumping, which includes three effects:
-
The Venturi effect (Xu et al., 2005; Bain et al., 2005; Suleau et al., 2009) gives rise to mass transfer by establishing a pressure gradient.
-
Natural gradient concentration disturbances (Le Dantec et al., 1999; Longdoz et al., 2000; Lai et al., 2012) play an important role during very calm conditions, and a highly stratified boundary layer slows the diffusion efflux and, once disturbed by the head space mixing fan, releases an unusual high apparent efflux.
-
Eddy pressure fluctuations cause gas dispersion (Maier et al., 2010; Mohr et al., 2016; Brændholt et al., 2017; Pourbakhtiar et al., 2017; Poulsen et al., 2017; Mohr et al., 2017), which may be a very important gas transport regime. This effect is more or less screened by chamber deployment, depending mainly on the wind importance versus the internal head air mixing fan disturbances.
All these effects may be altered by a deployed chamber head and then affect the closed chamber measurements versus natural soil efflux. As the wind cannot be reproduced inside the chamber heads, the only possibility is to minimize the differences and to correct the data by calibrating the measurements versus the wind speed, which is the aim of this paper in presenting an adapted nonsteady-state dynamic chamber technique and wind speed corrected for the water vapor efflux measurement.
The wind characteristics, such as friction velocity, have a very important influence on evaporation, contributing to evaporating water vapor from the boundary layer and maintaining a low ambient air humidity (Monin–Obukhov similarity theory; see, for example, Hill, 1989). Then, as the water vapor demand is complementary to relative humidity (RH), low RH means high water demand and consequent water vapor production. If the air humidity is high, with or without important friction velocity, the soil evaporation is low. Turbulence (quantified by friction velocity) has a great influence on air humidity (quantified by water vapor demand), which has a great influence on soil evaporation. As described in further sections of this paper, the chamber operation protocol is optimized for initial air humidity preservation, preserving the initial water vapor demand. Consequently, one can reasonably assume that the chamber measurements do not have to be corrected versus the air water vapor transport ability (friction velocity).
Another consequence of the presence of turbulence is pressure oscillations. As the chamber head includes an expansion room equalizing pressures between the deployed chamber head internal volume and the exterior pressure, there is no special correction to perform for the pressure fluctuations.
The only pertinent wind characteristic that appears to be important but not preserved is the wind speed.
3.1 Chamber construction
The chamber described later in this paper was constructed in the laboratory (please see Fig. 1).
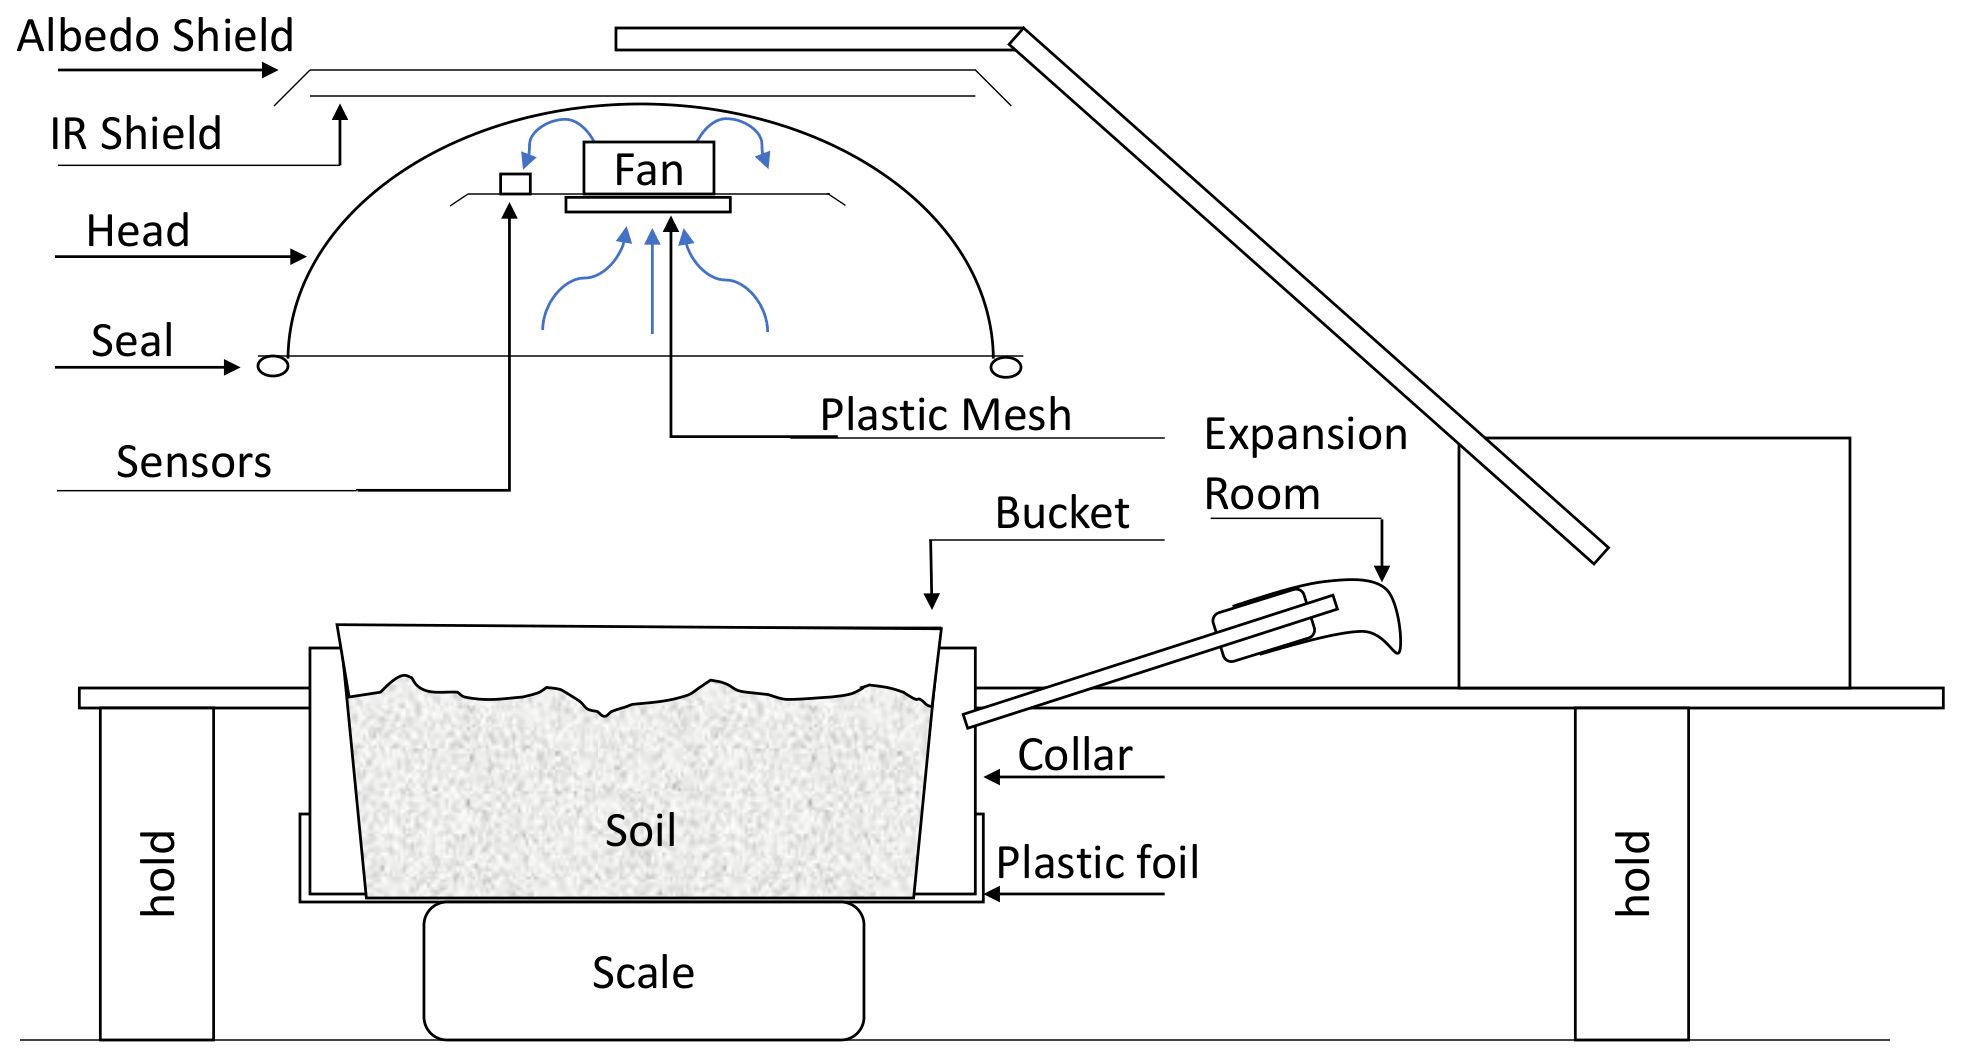
Figure 1Scheme of the chamber and experimental setup. In this sketch, the chamber head is not deployed.
When the chamber head is deployed, the cloche with embedded fan is firmly put down on the base, insulating the collar with the bucket and a well delimited air volume. Inside this finite air volume, due to soil evaporation, the relative air moisture RH will rise more or less quickly up to the saturation value, which is important depending on the soil matrix suction.
The internal fan, which is the core of the device, is a Maglev fan PSD1204 PKB 3-A 40 mm × 40 mm × 20 mm (Sunonwealth Electric Machine Industry Company Limited, Qianzhen, District Kaohsiung, Taiwan) with pulse width modulation (PWM) control and rotation sensor driven by a generic PWM generator able to generate a signal of a given frequency and a given duty on demand, communicating with a data logger (CR1000 from Campbell Scientific, Logan, UT, USA) by a UART TTL bus. The main humidity sensor (because there were three humidity sensors of different response time for comparison) is a P14 Rapid mounted on a Linpicco plate with a PT1000 sensor for simultaneous humidity and temperature measurements (Innovative Sensor Technology IST AG, Ebnat-Kappel, Switzerland). The pressure, temperature and humidity inside the chamber head were monitored using a BME280 (Bosch Sensortec GmbH, Reutlingen, Germany) digital sensor under an Arduino-Uno control (I2C bus) forwarding these measures to the main data logger CR1000 via the UART TTL bus. The fan, mounted on a holding plate along with all the sensors, aspirated the air from the bottom of the chamber head through a plastic mesh (opening percentage 47 %). The digital scale used was a WA30002Y from W&J Instrument Co., Ltd., Mudu Jiangsu, China, with a continuous RS-232 bus output and 0.01 g resolution.
The NSS technique has been known for almost one century, described first by Bornemann (1920) and used for measurements of trace gas efflux such as CO2, N2O or CH4. Its operating principle is simple and consists of monitoring the rise in the concentration of the gas of interest when a well delimited soil part (delimited by an inserted collar) is covered by a cloche (chamber head). Numerous variants of this technique are used for trace gas efflux measurements, continually improved and described as follows:
-
respiration chambers (Pavelka et al. 2018),
-
open top chambers (Fang and Moncrieff 1998),
-
forced diffusion chambers (Risk et al. 2011).
The NSS technique is invasive, and the conditions of the measurements may be different from the real conditions, meaning “not chamber head deployed” conditions. This difference may affect the measurements. Then, for precise measurements, we must minimize the differences if we can or correct the measurements.
General issues concerning closed chamber techniques, construction, operation and wind speed corrections will be listed elsewhere. In this paper, only special issues and solutions concerning the evaporation chamber ASERC technique corrected versus the wind speed are reported explicitly, but the experimental setup also implicitly includes some general solutions adopted for the closed chamber technique.
A usual assumption concerns soil efflux, which results from the migration of the gas of interest through the soil, assumed to be pure molecular diffusion as described by Fick's laws. However, as liquid water is transformed into gaseous water vapor during evaporation, the volume is strongly increased approximately 1250-fold. Evaporation efflux is then a mass flow, not a diffusion. A device allowing an additional gas volume to emerge from the soil into the chamber head, without raising the internal pressure as well, needs to be implemented. Different solutions are possible and actually concern all the closed chambers since soil evaporation is always present even if water vapor is not the gas of interest. One of the most commonly used devices is an open vent tube, which gives rise to another problem: the Venturi effect, listed later in this text as wind-speed-induced influence. Another solution consists of an expansion room implementation that allows expansion of the chamber head volume while maintaining the internal pressure in equilibrium with the external air pressure. The expansion room is not subject to the Venturi effect. The late solution was then adopted for ASERC. This device allows equalization of the internal chamber head pressure and external ambient pressure even if the external pressure is changing, which is important to preserve the external turbulence influences.
All internal metallic parts were coated with a high polytetrafluoroethylene (PTFE, i.e., Teflon) content paint to reduce the water vapor sorption on a metallic surface as much as possible and to not affect the initial RH.
Inside the collar a pipe was inserted allowing the air entrapped by the chamber head during chamber deployment to flow freely through to a nitrile finger cot (expansion room) to equilibrate the inside and outside pressure and allow a small chamber volume expansion to compensate for the mass flow from the soil. Compared to the chamber head volume, during chamber head deployment, the volume increase is very small and does not bias the calculations. This expansion room also allows equal pressures inside and outside the deployed chamber head, which is important for pressure pumping conservation (described later in the text).
As heating from solar radiation may strongly affect the evaporation process by artificially raising the chamber head temperature, special attention is given to shielding the chamber head with an albedo shield made from a white painted stainless-steel plate. This shield screens direct radiation; however, its temperature will rise, and its infrared radiation may reach the chamber head as well. A well-known technique used for cryogenic fluid operation was then adapted by interposing a second infrared (IR) shield made from a plastic plate coated with a thick aluminum foil on both sides. In this way, the closed chamber head internal temperature is assumed to be equal to the external ambient temperature.
3.2 Measurement protocol
For all the calibration measurements, the chamber was placed on holds, and the collar bottom, normally inserted into the soil, was hatched with elastic plastic foil. An electronic scale was placed just below this foil, and a bucket with a studied soil was placed inside the collar reposing on the scale configured to never turn off (power save disabled) with the plastic foil between the bucket and the scale plate. A basic scheme depicts the chamber and experimental setup function (Fig. 1). With this setup, the bucket mass diminution (due to enclosed soil water evaporation) was relatively well monitored and provided the real evaporation rate (ER) under isothermal conditions.
An external fan blows the air on the chamber, and an ultrasonic anemometer WindSonic 2D (Gill Instruments Limited, Lymington Hampshire, UK) allows monitoring and recording (on the data logger CR1000) of the resulting wind speed 5 cm above the sample soil surface. The 2 m s−1 measured 5 cm above the surface equals approximately 6.5 m s−1 measured 2 m above the surface (logarithmic profile).
The data logger CR1000 was programmed to command closure (chamber head deployment) or opening of the chamber, to record the measured humidity and temperature along with the pressure, to control the embedded fan rotation speed inside the chamber head, and to monitor the external wind speed before and during the deployment. Before each chamber deployment, a prior 120 s flushing with a 100 % duty operated embedded fan was performed. Between each PWM change for measurements, the chamber was opened, flushed for 1 min and then closed again. Every 6 h, a measurement cycle was initiated. Any measurement cycle consists of measuring the absolute humidity accumulation in a closed chamber head with the embedded fan powered from PWM = 10 % duty to PWM = 100 % duty by steps of 10 %, giving 10 consecutive chamber deployments. Each chamber deployment for each PWM takes approximately 10 min. With a flushing time between the deployments, the whole cycle takes over 2 h. The 6 h delay between each measurement cycle was adopted to avoid strongly perturbing the natural evaporation process. This protocol and 10 different PWM measurements are for the purpose of internal fan influence characterization study only. The real measurement protocol, as described below, is much shorter, allowing more frequent chamber deployment.
The studied soil is either sandy, meaning rough sand (0.1–3 mm) or clayey (high clay content soil 50 % clay, 40 % silt, 10 % sand). The real evaporation rate is deduced by weighing the bucket with the studied soil and calculating the corresponding MB mass variation. Soil moisture w was determined by the following ratio:
where M0 is the bucket mass with dry soil, and Ms is the dry soil mass only (without the bucket mass). This definition, gravimetric water content, is not a usual volumetric water content provided by all soil water content (SWC) probes but is often used for clayey soils since the soil volume changes and the crack formation yields a very complicated volume calculation.
Indeed, an additional difficulty concerns the volume determination for clayey soils, as the volume is subject to change with the soil moisture content (swelling soils). Additionally, the crack appearance makes volume determination and even its definition particularly difficult. Are the cracks part of the soil sample or not? For these studies, the gravimetric water content is more usable.
3.3 Flux calculation algorithms
To estimate the water vapor efflux by the NSS technique, the absolute water vapor concentration q is monitored. Measured concentration versus time gives a curve regressed by an exponential rise (ER) formula very widely presented in all physical processes, as it reflects a variation versus time dC dt, where C is the scalar of interest and is proportional to the gap between the instant scalar value and the stable limit value Cl:
This differential equation describes widely spread physical behavior and has a general solution of the following form:
with A and B being constants.
With initial and final conditions, we can determine these constants using C0 as the initial value and τ as the characteristic time, also called response time :
This variation behavior is very often observed in nature, including electronic and sensor responses to measured variable C changes. The measured evaporation rate (ME) is, by definition, determined by temporal derivation of the absolute water vapor concentration q multiplied by chamber head volume V and divided by collar surface S:
The water vapor (and other gases emanating from the soil) accumulation rate inside the deployed chamber head is not constant. Only the initial evaporation rate (t=0, which means at the beginning of chamber head deployment) is then retained (ql is the absolute water concentration limit, q0 is the initial absolute water concentration, and τ is the characteristic time of q evolution).
As in the case of all other soil trace gas measurements, the measured absolute water vapor concentration rise in a closed chamber head is not linear with time but rather follows an exponential rise (ER) law. Usually, due to the complexity of the accumulation and feedback process, the exponential law does not perfectly describe the measurements, and some deviations are observed, making the regression results sensitive to the starting point, duration and end point. This observation is generally intrinsically tied to the closed chamber technique (Nakano et al., 2004). Concerning water evaporation, the measurement curve and the ER fit for a sufficiently long time present three well-defined cross points due to a noninstantaneous sensor measurement, as shown in Appendix B. For this study, to stabilize the numerical regression conditions (fit), the starting point is systematically chosen at the first cross point and the end point at the third cross point (Fig. 2b). In other words, a double fit is needed. A first fit on the whole disponible length provides the starting and the end points, and then a second exponential rise fit is performed between these two points to provide every sought value. Only the result of the second fit is considered reliable. Of course, in some cases, such as a very slow evaporation, we do not observe the third cross point. In these cases, the retained interval is between the first cross point and the last available point.
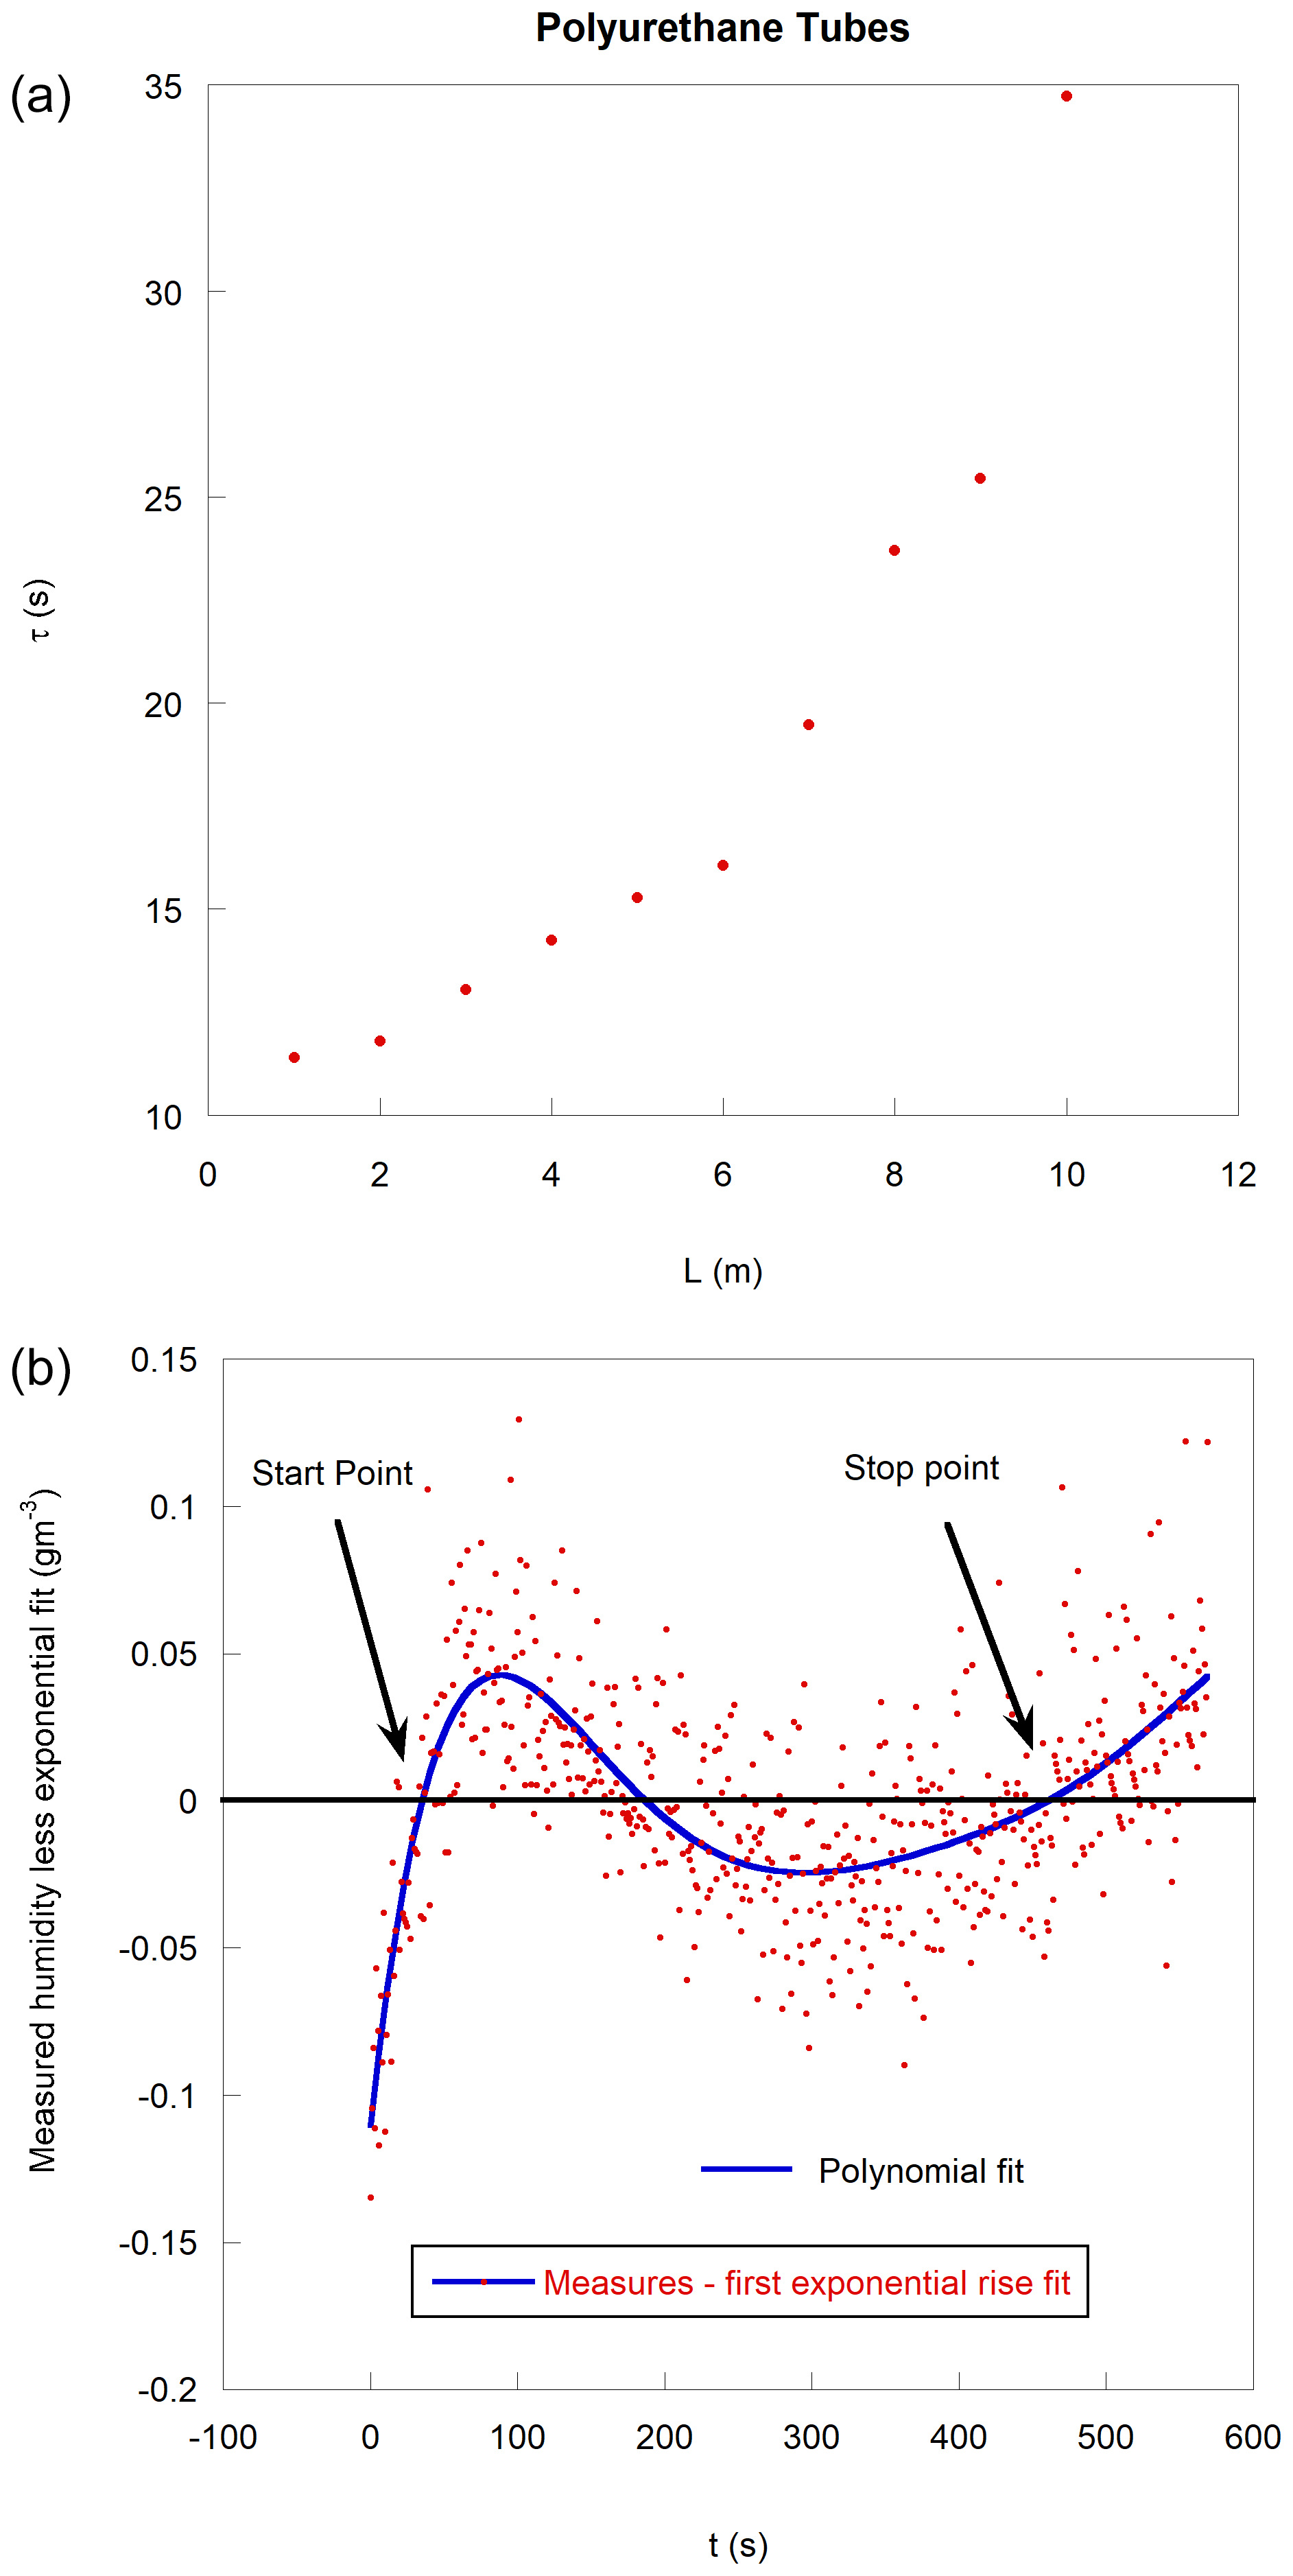
Figure 2(a) Apparent response time of the polyurethane tubes versus the length of the tubes. (b) Measured absolute humidity less exponential fit (residuals), giving start and stop points for a second regression.
All calculations were automated using LabView 2015 programming (National Instruments Corporation, Austin, TX, USA). The regression functions enforce the Levenberg–Marquardt algorithm for the ER fits over the whole acquired interval, and the singular-value decomposition (SVD) algorithm gives residuals for polynomial fits with the least square method for optimizing fitting parameters. Then, the calculated polynomial roots are determined by a function based on a Riders algorithm. The first root gives the starting point (first cross point between the real measurement curve and the ER regressed curve), and the third root (third cross point) gives the limiting time for new ER fit.
3.4 Sensor characteristics
The evaporation process is relatively fast, and then the humidity sensors should be even faster; otherwise, the deduced efflux may be biased. Figure 3a shows the accumulated effluxes measured by three sensors with different response times. Different response times of different sensors bias the results thereof. A simple simulation, described in Appendix B and depicted in Fig. 3b, calculates the signal given by a sensor with different response times along with an artificial start delay imposed by the operator (in the case of a leading pipe, we must wait until after the chamber deployment before recording air analysis data from a distant analyzer). As shown, a possible underestimation but also an overestimation of deduced efflux is observed. Such overestimation may be committed with a relatively fast (as in P14 Rapid) but not very fast sensor (as in FTUTA 34) and a long recording time. This possible overestimation vanishes with delay resulting from the leading pipes or from a slow head space air mixing delay, as shown later in this text. In the case of the leading pipe presence, the imposed time delay depends on the pipe diameter and the air debit importance. Flowing air is always mixed with the enclosed air of the pipe, making the calculated time delay rather approximate and not very well defined. An embedded sensor is always preferable. The fastest reliable air moisture and air temperature sensor used is a P14 Rapid (response time τ63<1.5 s) on a Linpicco plate holding a PT1000 sensor providing simultaneous RH (%) and air temperature Ta (∘C) measurements.
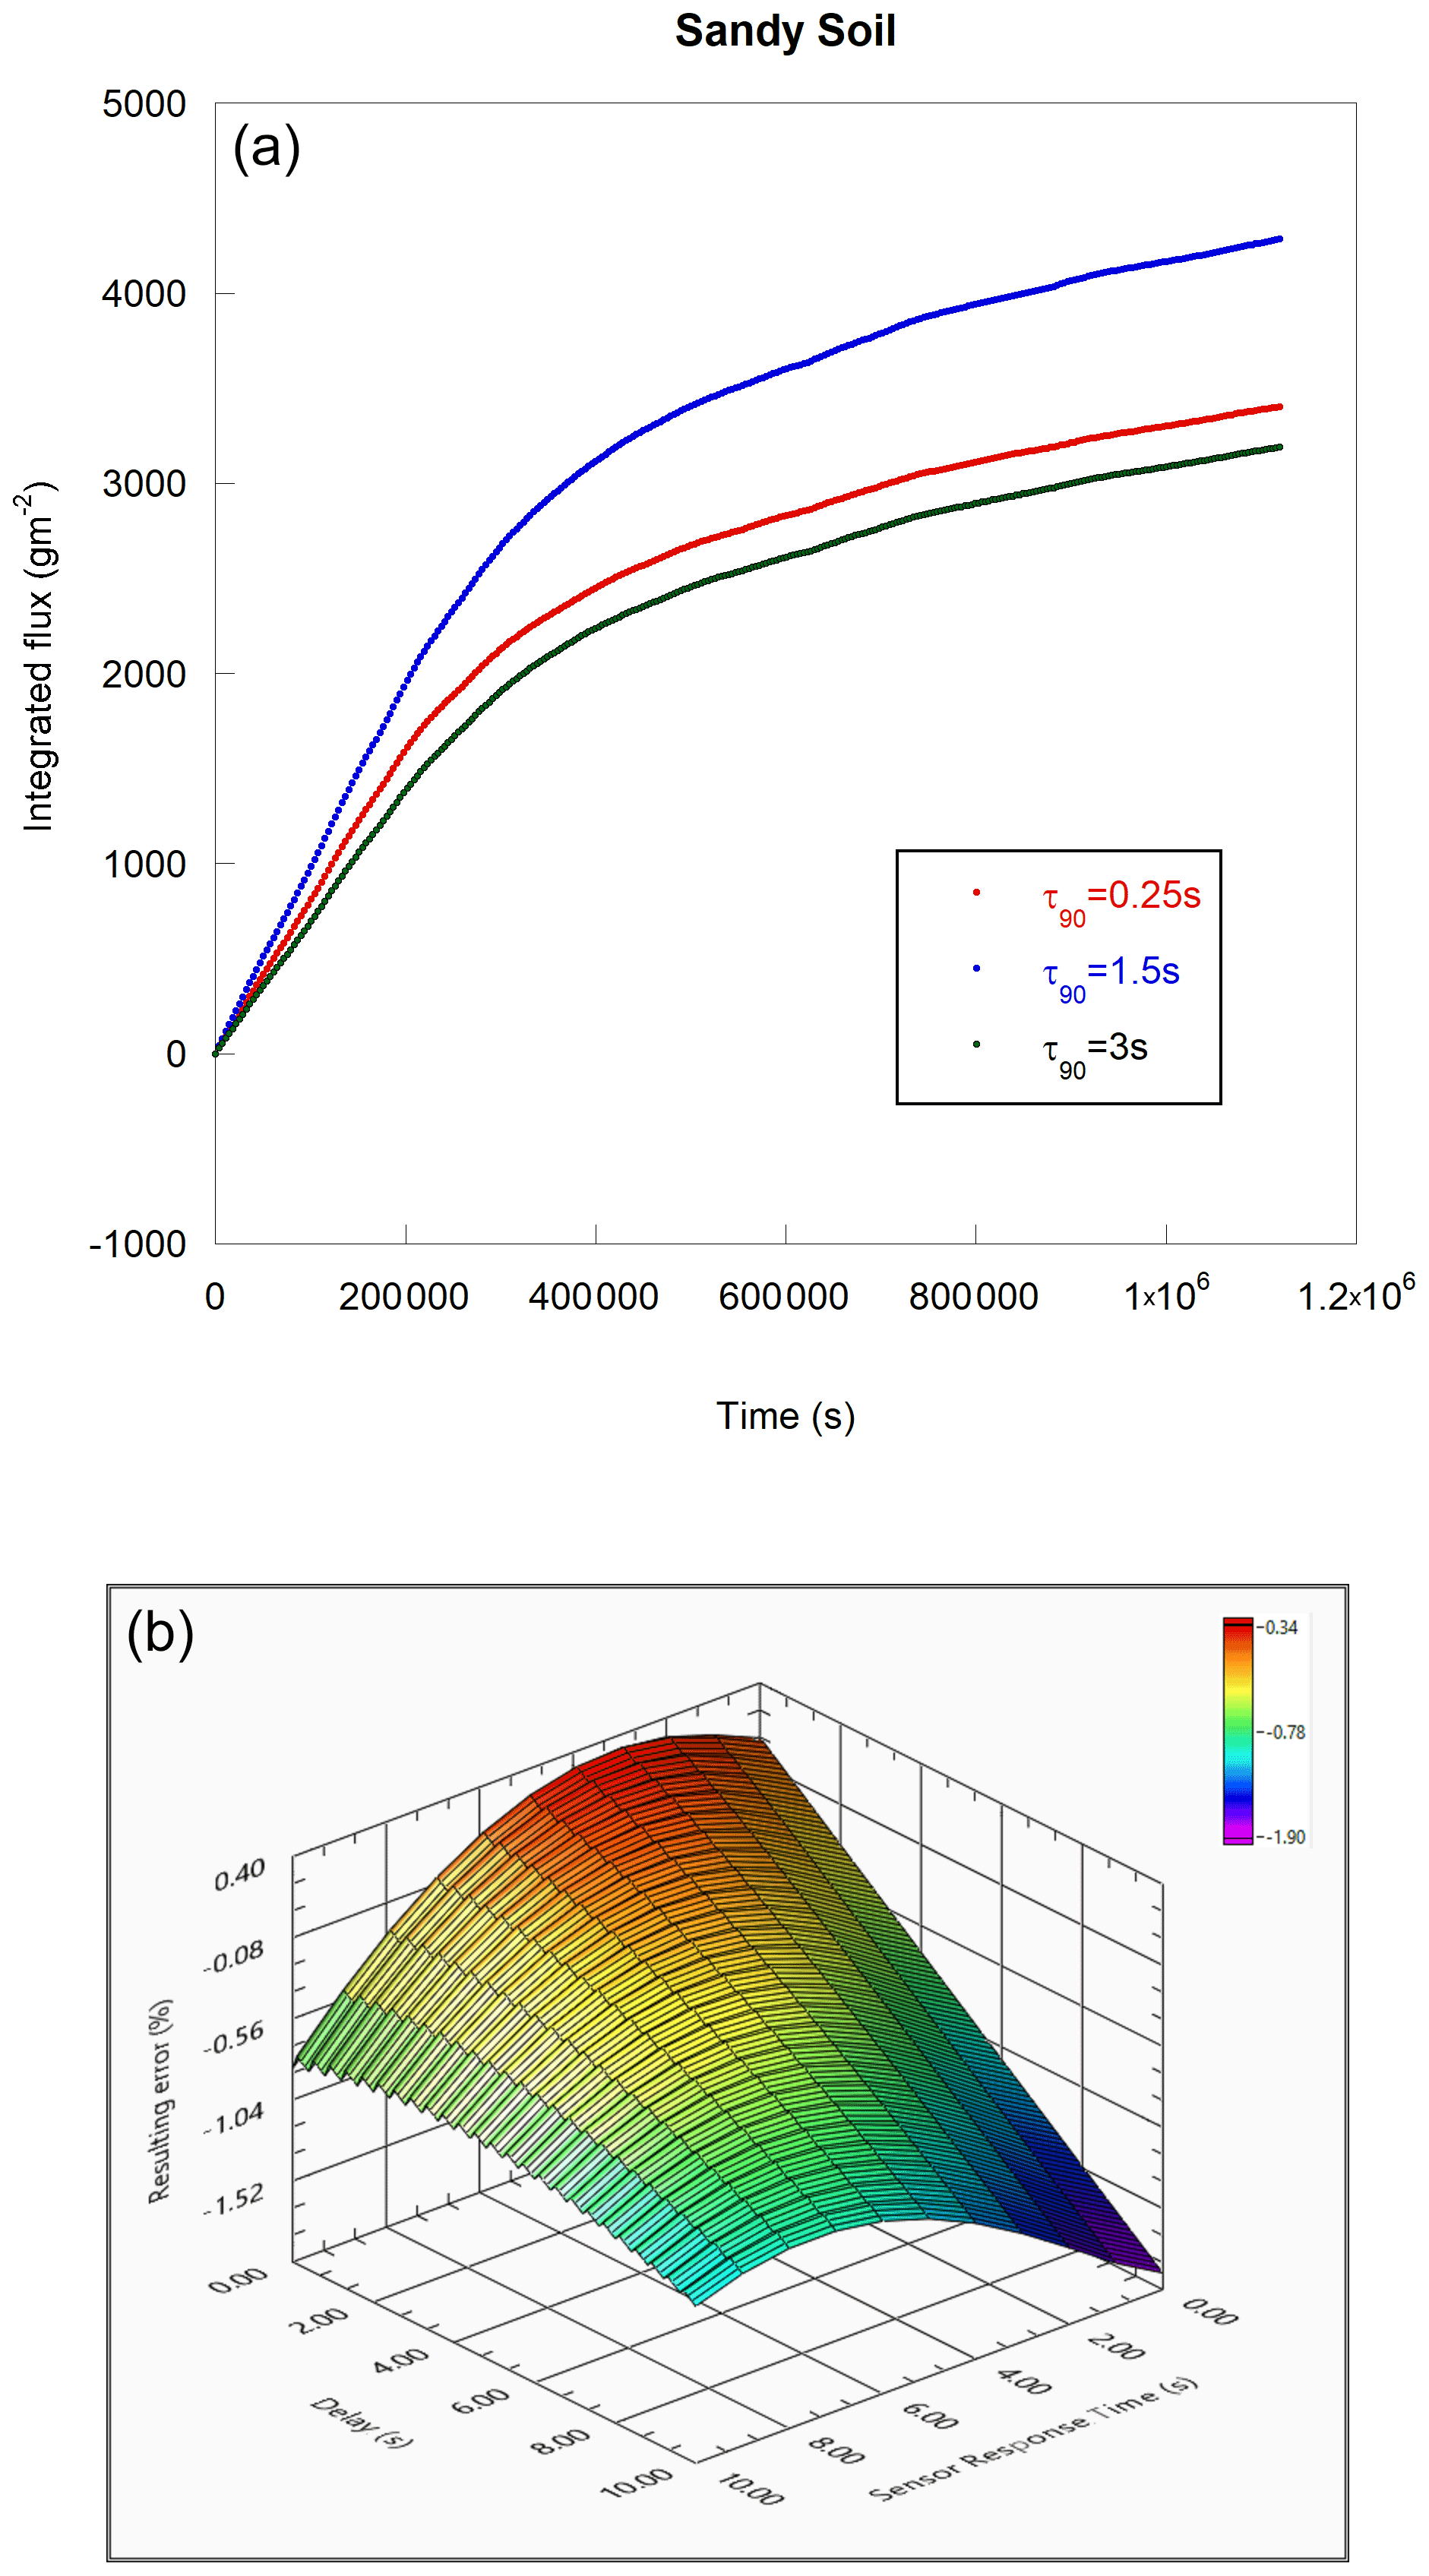
Figure 3(a) Integrated ME given by three different sensors with different response times. BME280 and 3 s response time, P14 Rapid with 1.5 s response time and F-Tuta 34 which has the faster response time of 0.25 s. Unfortunately, this sensor quickly malfunctioned and then was discarded. (b) Simulation of the ER regression error due to a slow sensor and introduced waiting delay with the origin of the time change.
A simple calculation based on an empirical water saturation pressure versus temperature law published by Wagner (1995) gives the absolute humidity q (g m−3). This formula is accurate to within 0.1 % over the temperature range −30 to +35 ∘C:
An external sensor such as IRGA provides better accuracy but requires use of a leading pipe between the chamber head and the IRGA with an external pump. The leading pipes may seriously bias the measures by adsorption problems, condensation problems and time lag between the chamber closure and the corresponding air sample measurement. Additionally, a heating problem arises since any IRGA is heating, thus necessitating cooling down the analyzed air sample reinjected back to the chamber.
The usual polyurethane (PU) pneumatic tubes were checked. Figure 2a shows an apparent characteristic time variation of a measured absolute humidity rise by a fast IRGA (Li-840A, LI-COR Biosciences, Lincoln, NE, USA) on one edge of the leading pipes when a step such as humidity rise or fall is induced (by a Li-610 portable dew point generator, LI-COR Biosciences) plugging or unplugging on the other edge of the leading pipes versus the length of the pipes. The apparent characteristic time increases strongly with the leading pipe length, reflecting a strong sorption problem with the PU pipes. Teflon pipes are preferable but need to be insulated anyway to prevent the possibility of condensation and always inducing a lag problem between the chamber closure time and the incoming air sample time from the chamber to the analyzer, which needs to be precisely known, as it may again bias the regression results.
An embedded, fast and accurate sensor is then preferable.
Once the experimental setup was truly built, the operation condition was chosen, the regression points were stabilized and the wind speed influence was studied. The scale allows the real evaporation rate (RE) measurement and sensor monitoring of closed chamber head air moisture, allowing the measured evaporation (ME) determination by ER fit and initial slope calculation. Calibration lies in the comparison between ME and RE.
The soil evaporation measurement technique described in this paper is based on an adapted NSS technique principle. The sensor characteristics, exact chamber configuration, regression calculations and wind speed influence are of great importance.
As special attention was given to the design of the chamber to avoid affecting the internal chamber head temperature by solar radiation screening and IR radiation screening and to not affect the pressure variations incorporating an “expansion volume”, the differences in the temperature or the pressure inside the chamber head or outside were quite similar. In other words, chamber measurements do not have to be corrected versus temperature or pressure. The initial air humidity is also assumed to be the same, as the chamber fan is engaged just before chamber head deployment to flush the sensor. Only air movements cannot be preserved, and their influence on soil evaporation must be corrected
The wind influence on soil evaporation depends on numerous variables, such as the soil temperature and moisture, the air temperature and the humidity, and the soil composition and the soil texture. These variables may change more or less quickly, and some of them, such as the soil texture, are not monitorable in real time.
Consequently, even if we succeed in modeling the wind effect, we will not be able to use this wind effect for chamber data corrections. An autocalibrating chamber would be considered a solution. The target is not to measure every variable and inject it into a complex model but rather to measure the “susceptibility” of the soil evaporation to the wind and correct the chamber measurements against the measured wind. The following protocol gives very simple yet relatively accurate results.
4.1 Fundamental finding
At a fixed internal fan speed (PWM constant), the measured evaporation rate (ME) is not directly proportional to the real evaporation rate (RE) during a soil drying process with a stable wind (Fig. 4).
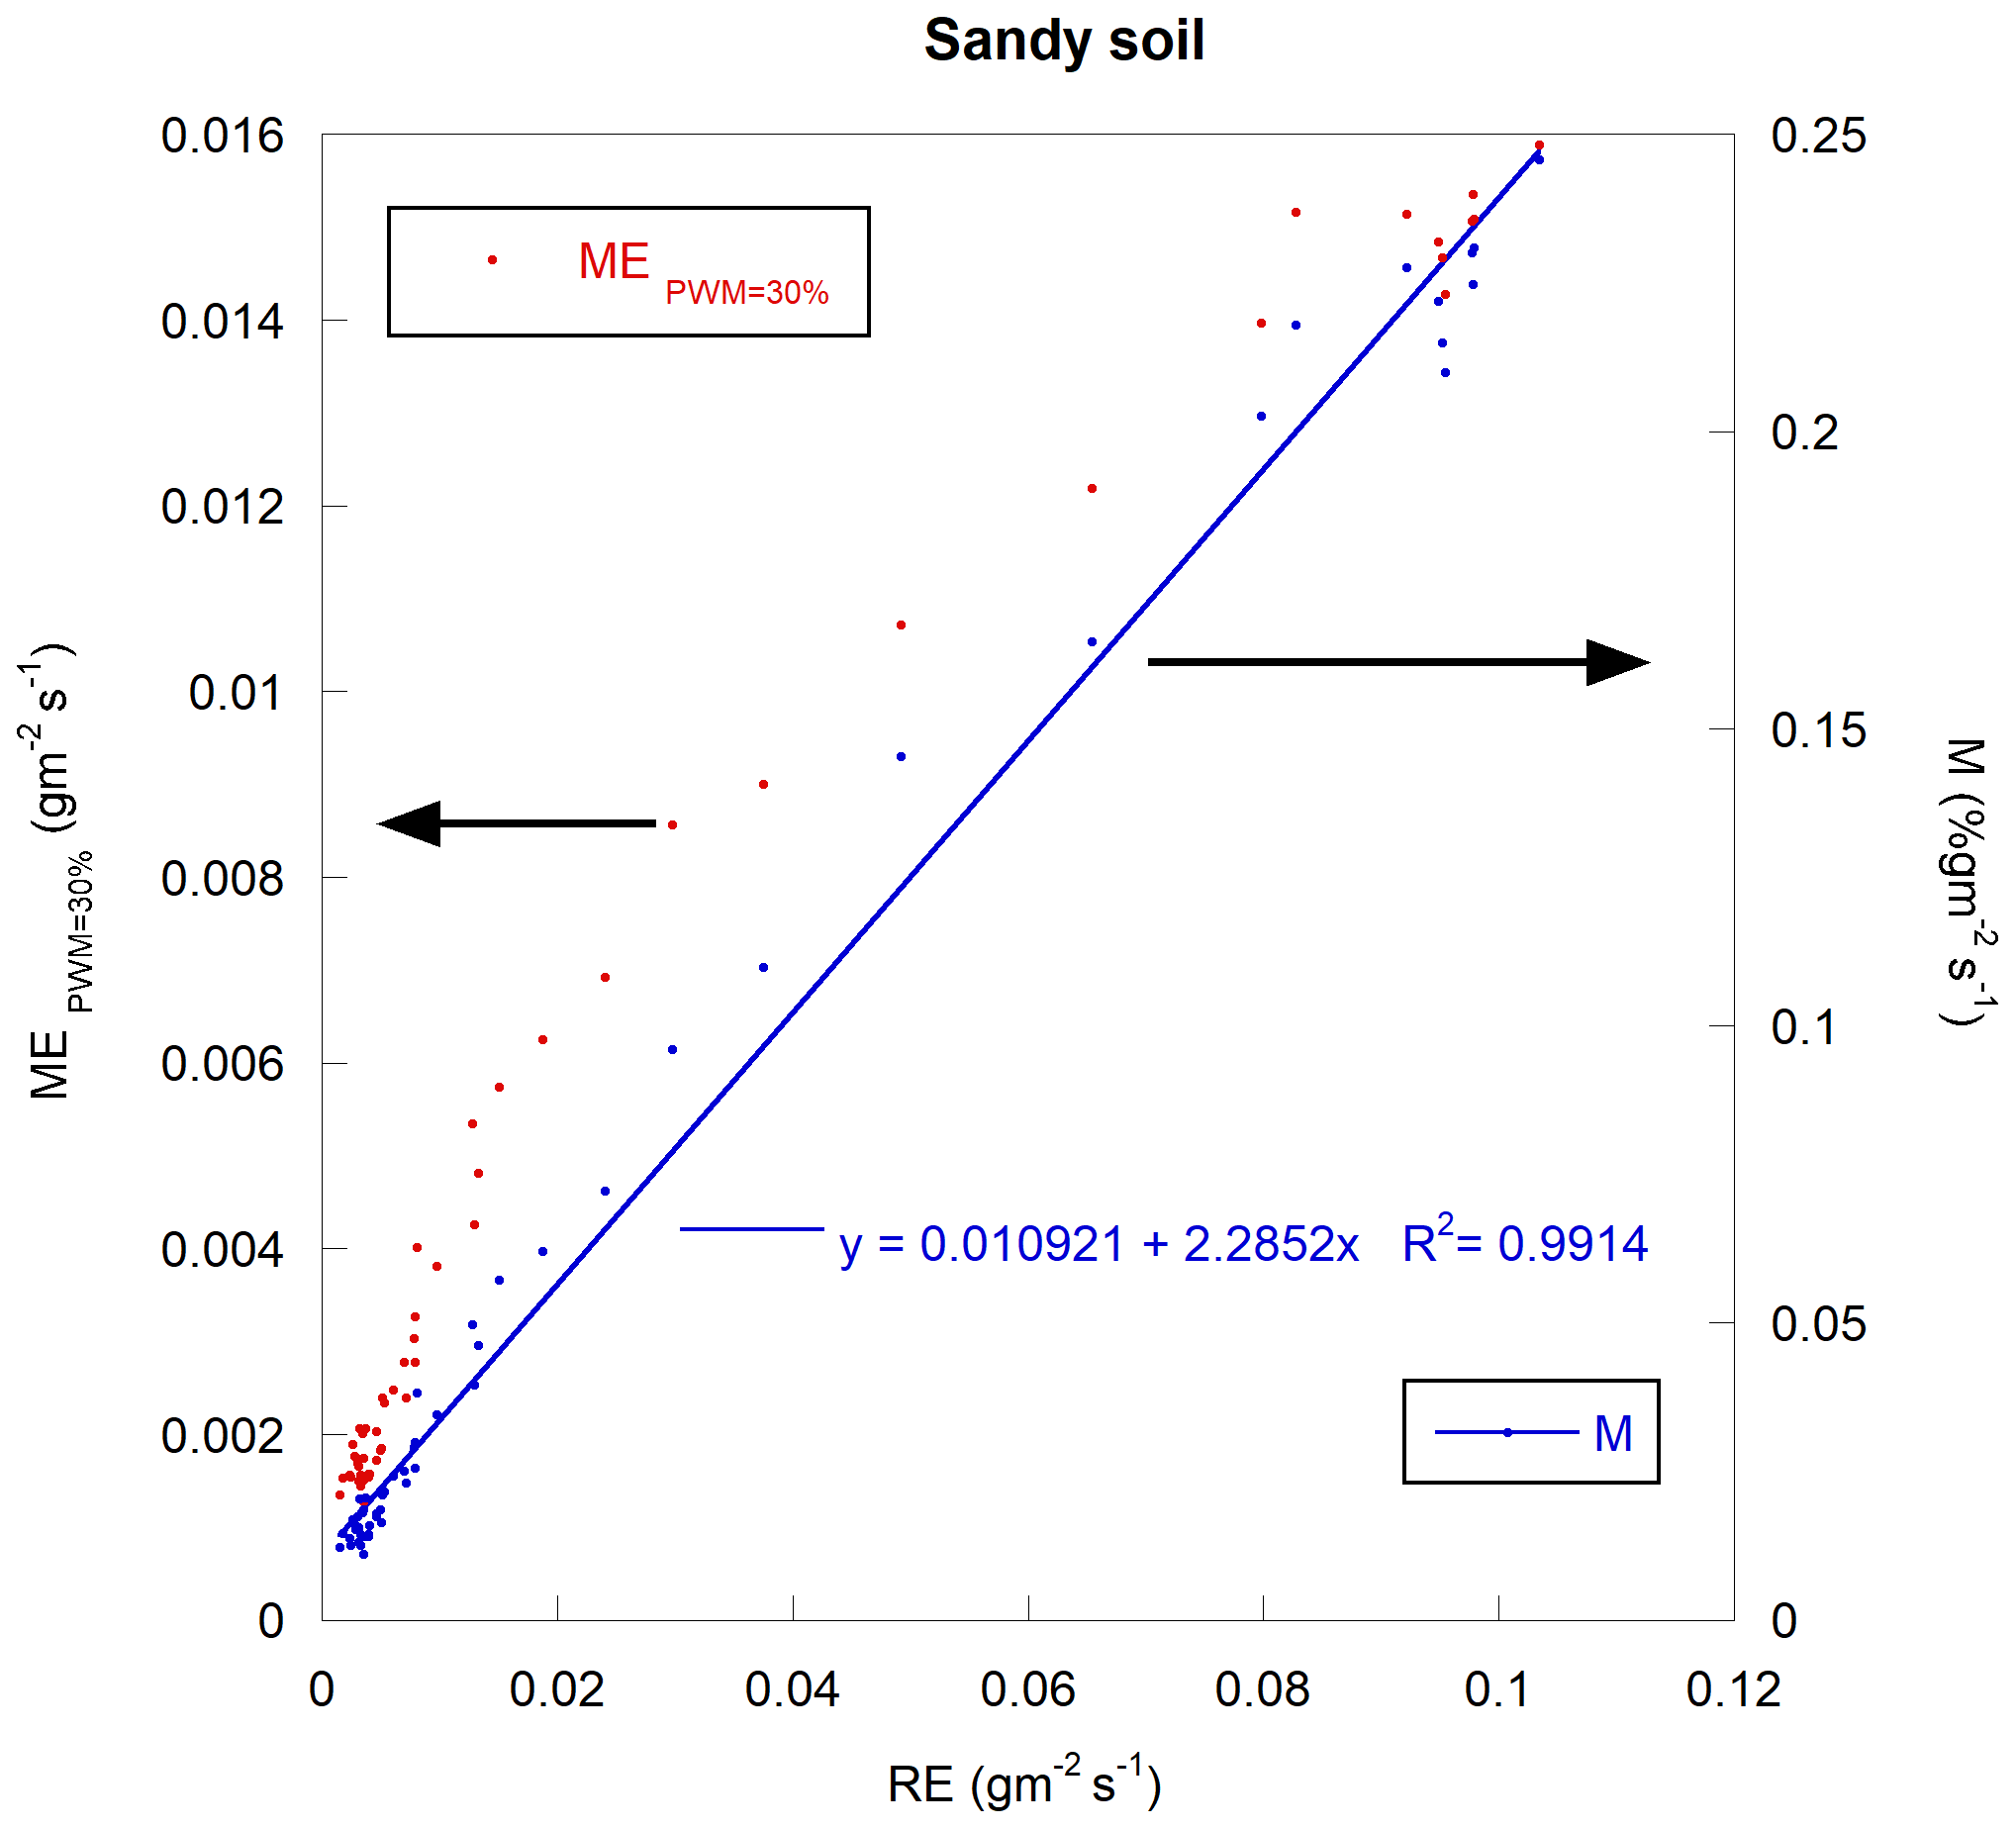
Figure 4Measured evaporation rate versus real evaporation rate (red dots on the left-side axis) and M, averaged measure multiplied by the Z factor, along with a linear regression (blue dots on the right-side axis) for sandy soil under a 1.15 m s−1 wind speed.
This nonlinearity changes with the soil composition and even with the soil texture, making it impossible to correct any data for all soil compositions and textures with a unique formula based only on the wind speed.
4.2 Embedded fan influence check
Figure 5 also shows the recorded water vapor efflux with sandy and clayey soil versus the fan PWM duty control. Both soil results are very well described by an exponential law:
A and Z are constant for a given soil sample and external conditions. In the adopted chamber head configuration, the internal fan influence is similar to the external wind influence – similar but not identical, since the wind brings some fresh air when a fan can only mix the internal head space air with a progressively rising water vapor concentration.
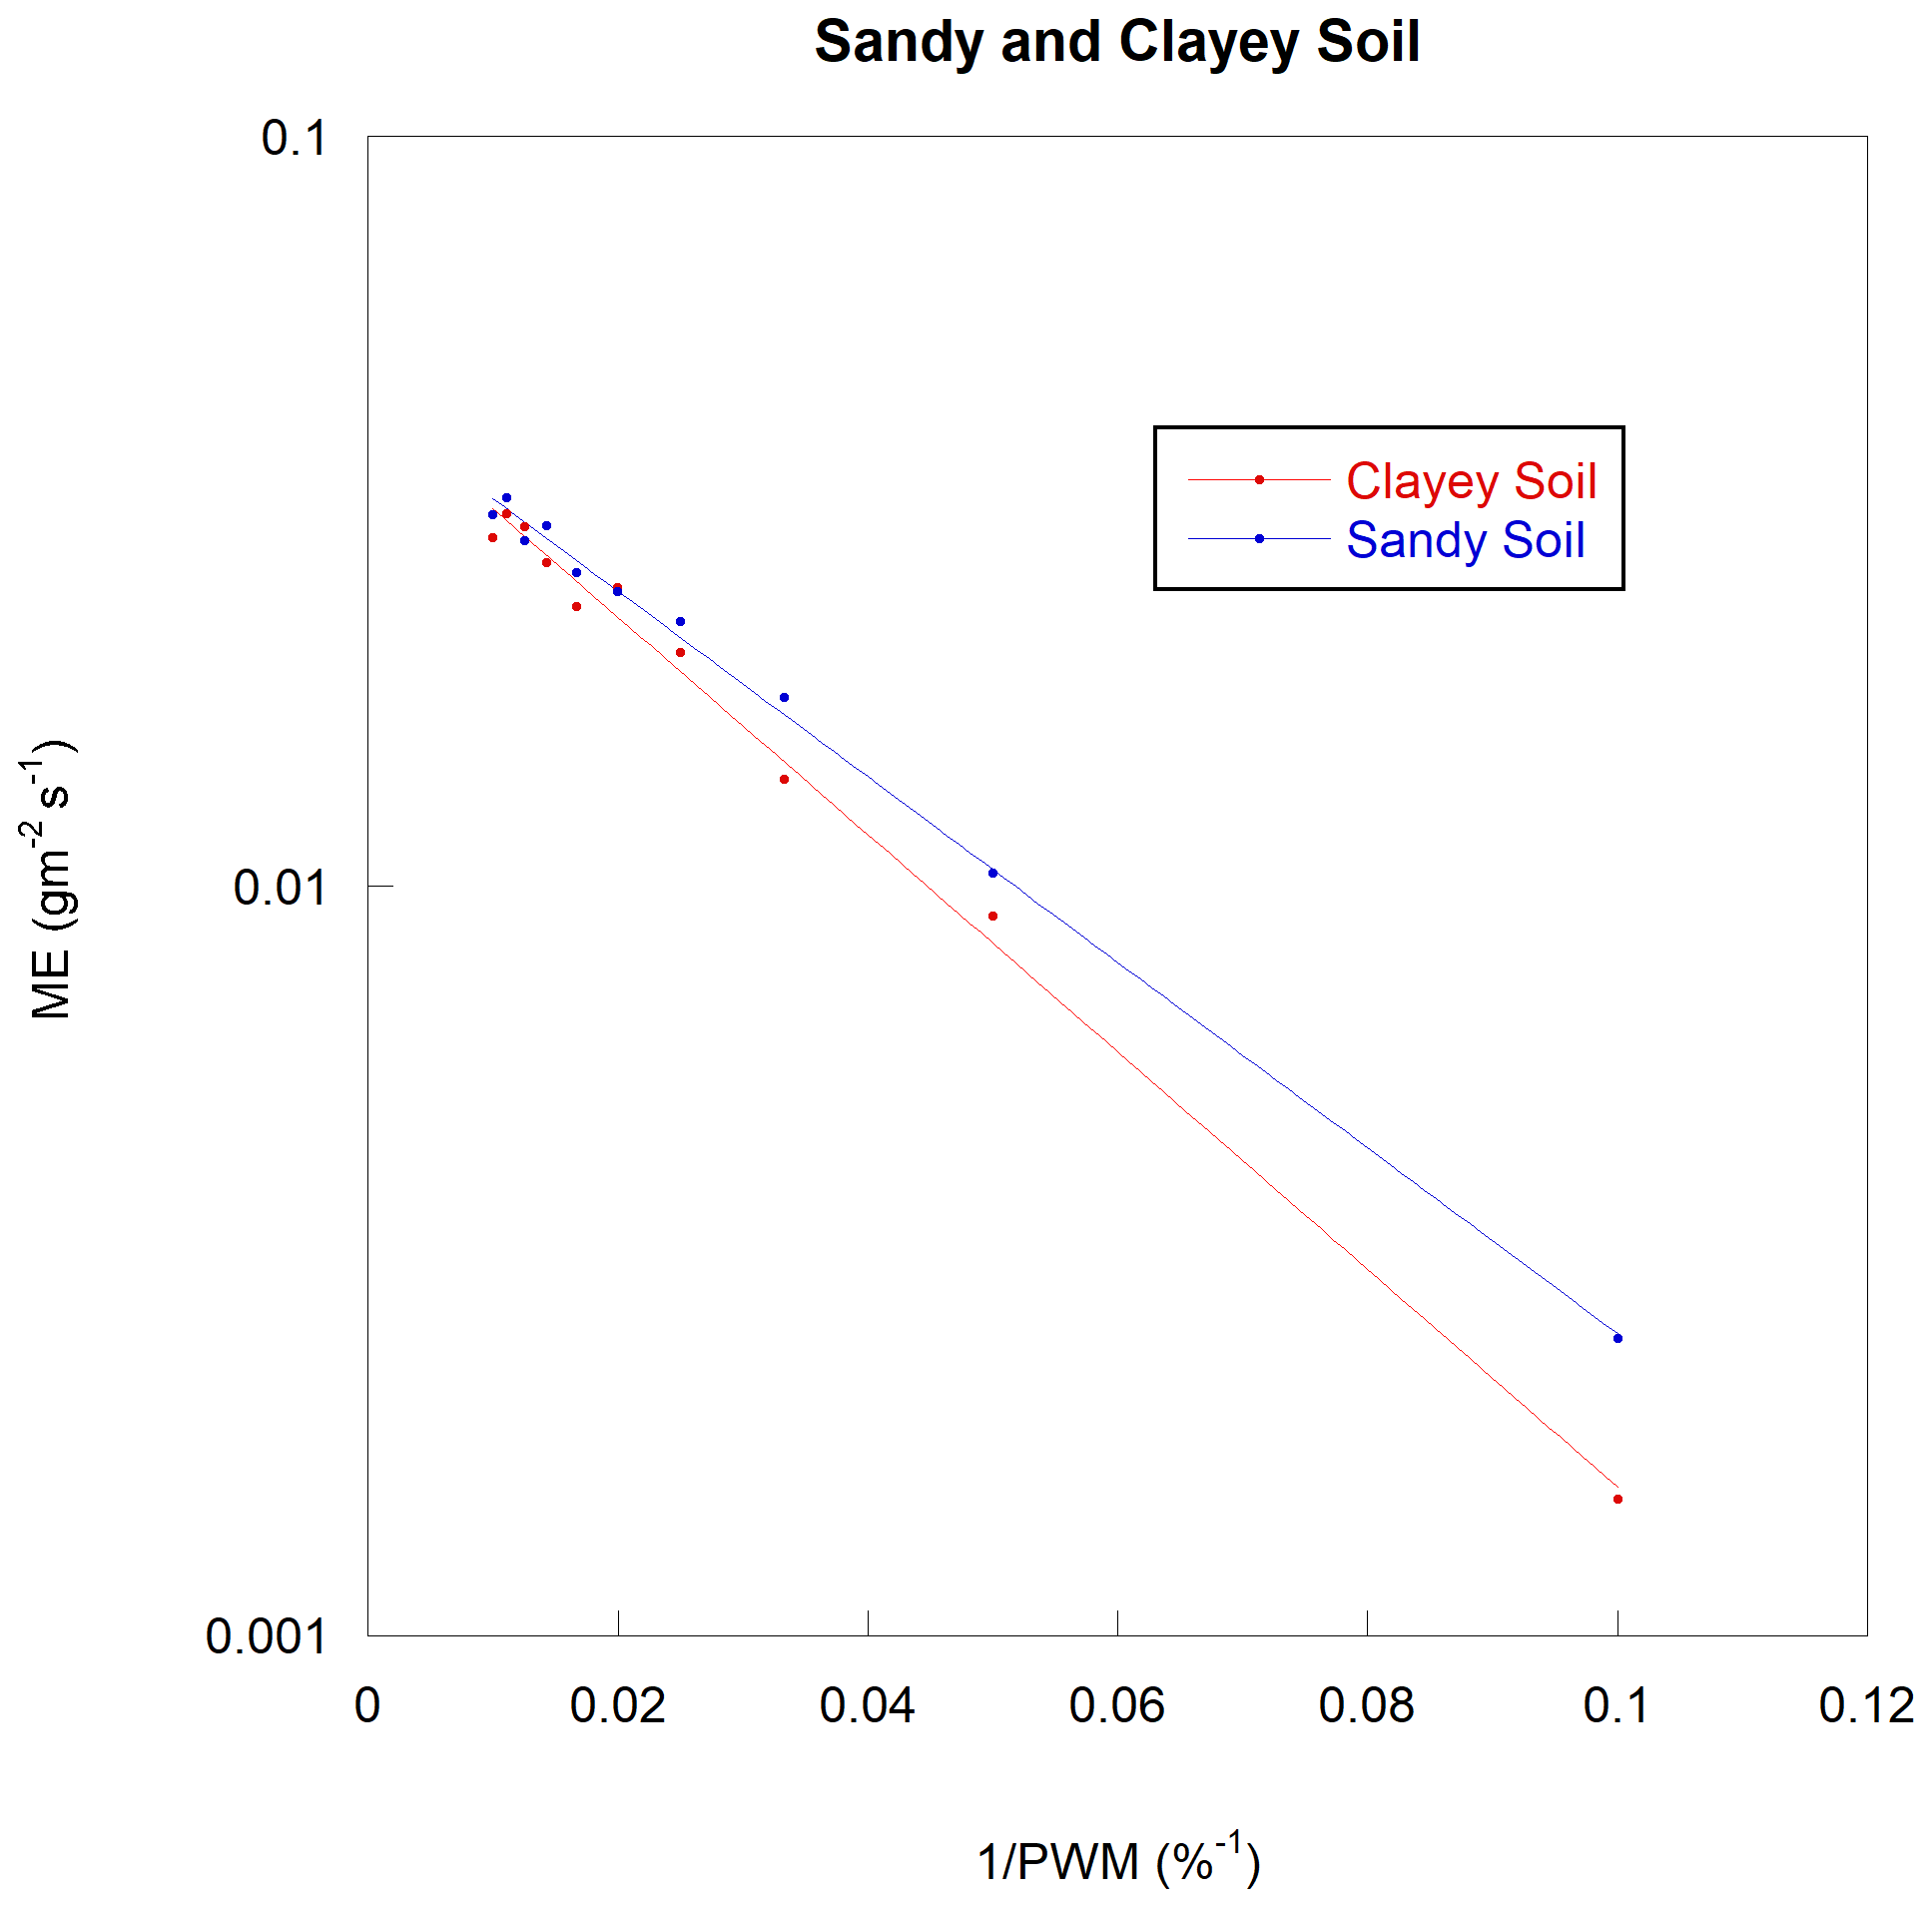
Figure 5Measured evaporation rate versus 1 PWM for sandy soil under 0.72 m s−1 wind and for clayey soil under 0.8 m s−1 wind speed.
The constant A reflects the amplitude of the evaporation for a given soil and weather conditions, and the constant Z reflects a soil susceptibility to the internal fan mixing flow. By similitude, one can assume Z reflects the soil evaporation susceptibility to the wind speed.
The most effective way to determine Z is to perform numerous measurements with a different PWM value and apply an exponential regression to all these results (Ztotal). However, this method is time-consuming, and resulting perturbations do not allow a high sampling rate. Two-point measurements used for Z determination are of a relatively good concordance if the first fan speed used is low, such as PWM = 10 %, and the second speed is significantly higher, such as PWM = 30 % (Fig. 6).
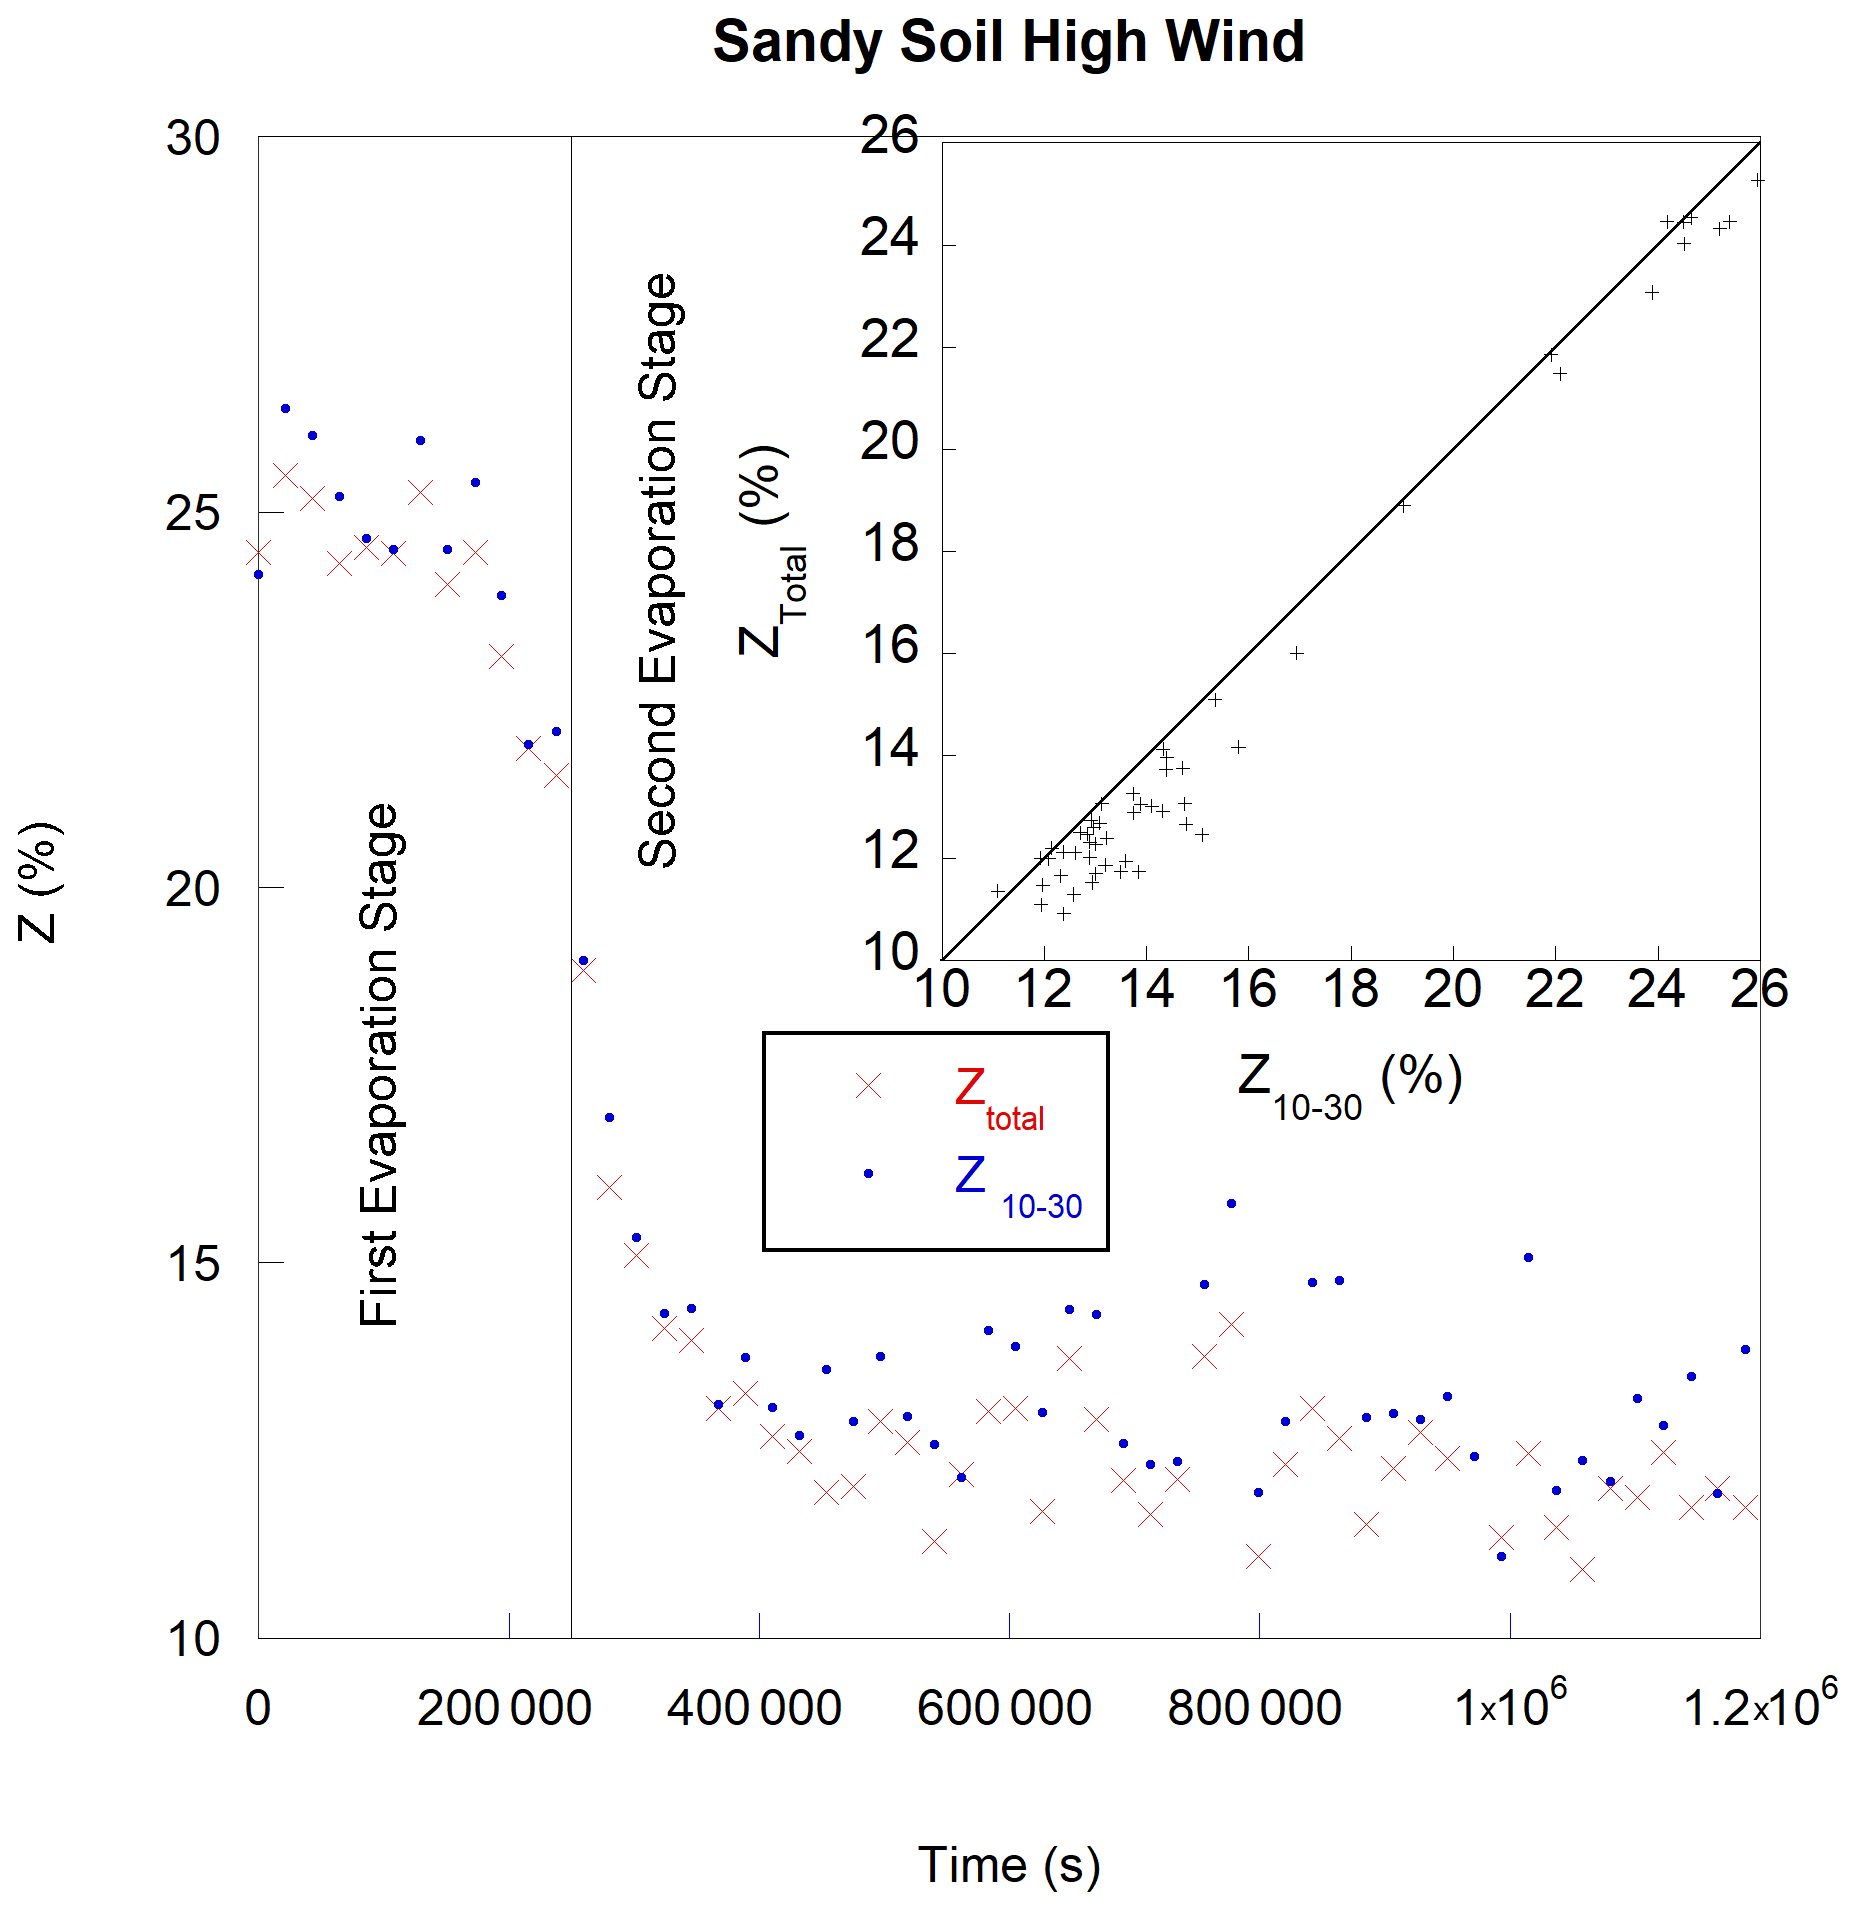
Figure 6Ztotal and Z10−30 versus time for sandy soil at a relatively strong wind of 1.15 m s−1. Insert, the same values of Ztotal versus Z10−30.
A visible Z drop between the first evaporation stage and the second evaporation stage is observed. The best results for a correction were given by the function M, which is the average of ME10 measurements at PWM = 10 % and ME30 measurements at PWM = 30 % multiplied by Z10−30 obtained by an exponential regression of the two-point measurement ME10 and ME30 versus by an exponential Eq. (7):
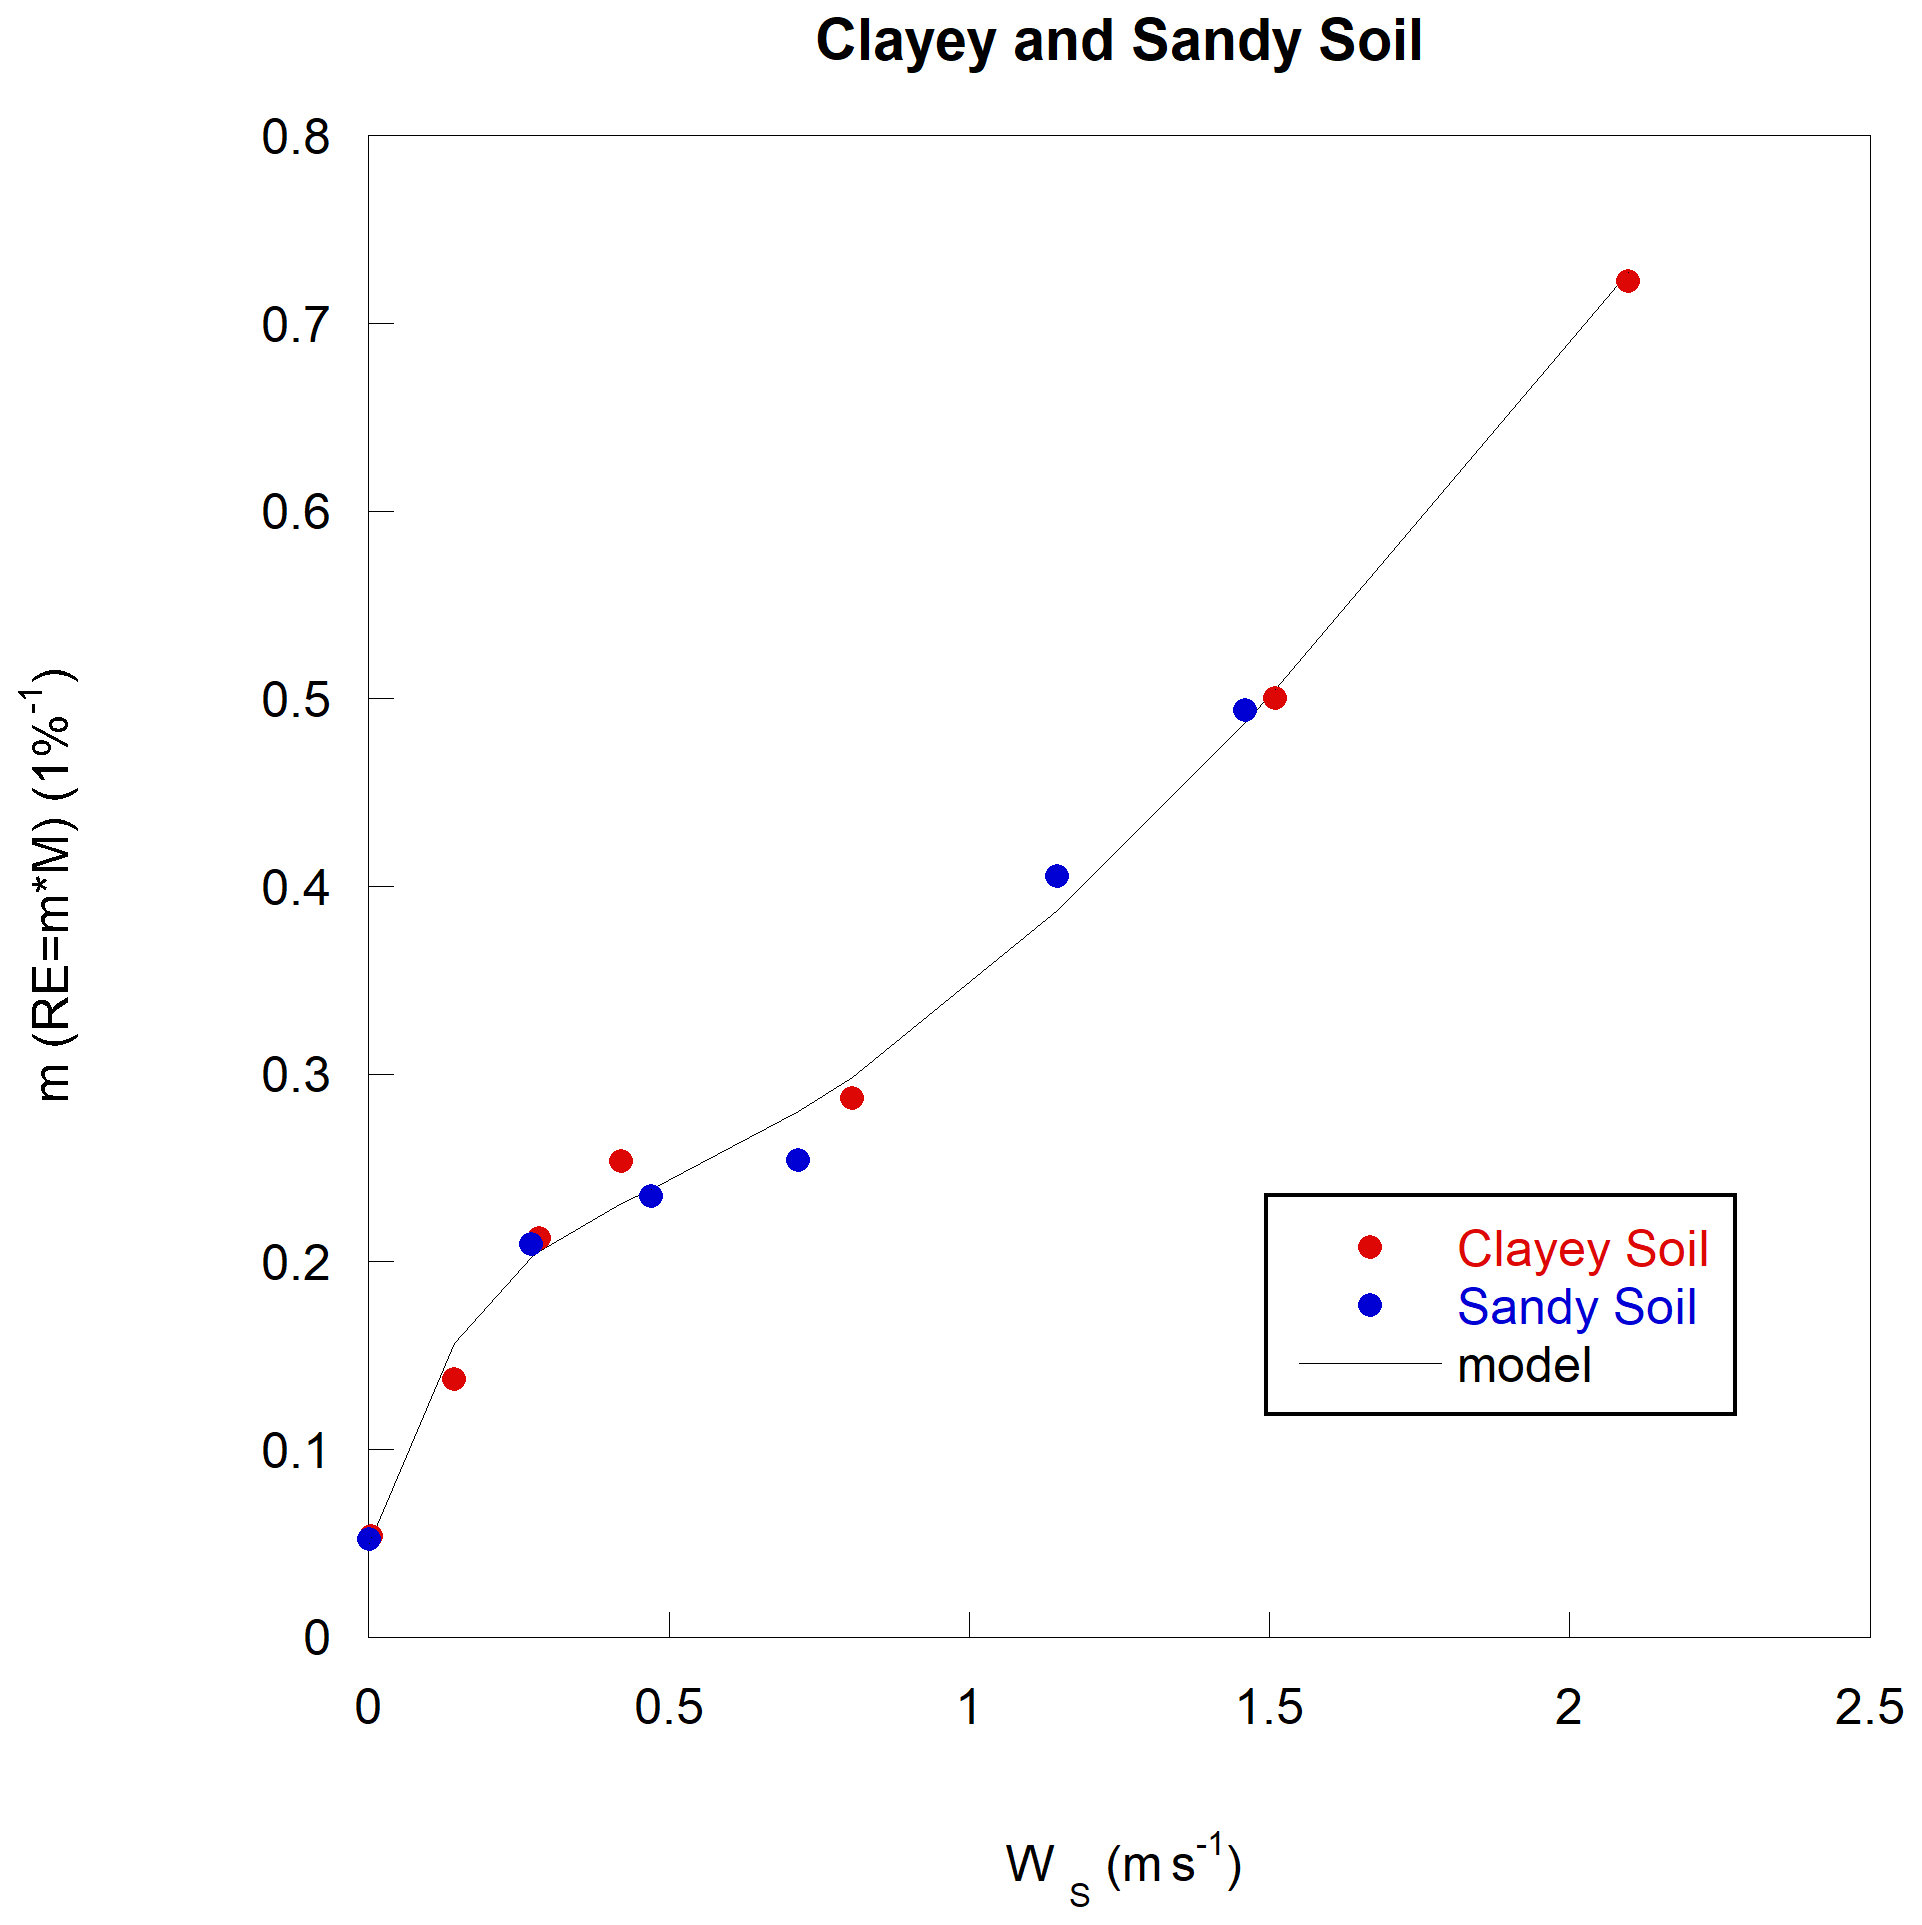
Figure 4 shows that RE is nearly proportional to M (defined by Eq. 8), and Fig. 7 shows that this proportionality constant, hereafter called m, depends on the wind speed and not on the soil composition, which is the main benefit of Z introduction. Only M depends on the soil composition, soil texture, or soil and air meteorological variables pertinent for soil evaporation measurements.
B is a constant of a very small amplitude useful only for very dry soil.
We can then decompose Eq. (9) into three terms:
-
m(WS)is a correction coefficient that depends only on the wind speed, the only pertinent variable affected by the chamber head deployment.
-
reflects soil evaporation depending on all pertinent variables, such as SWC, air water vapor demand, air and soil temperature, and pressure, which are not affected by chamber head deployment under fixed boundary layer air movement.
-
Z reflects the soil evaporation susceptibility to the wind speed, as with the same wind speed, soil evaporation is not the same depending on the soil composition, soil texture, etc.
The m dependence of the wind speed is not trivial. The plateau at approximately w=0.5 m s−1 probably corresponds to the fan perturbation concordance at PWM = 20 % (an average between PWM = 10 % and PWM = 30 %) comparable to the wind speed of 0.5 m s−1 perturbations. This particular value is tied to the chamber design and cannot be used as a universal value. The other limitation is the high wind speed. As shown by Smits et al. (2015), for wind speeds superior to a threshold value WS max, the evaporation process is not much more affected by wind. Then, m(WS) is probably no longer linear with WS>WS max.
For the studied range of the wind speed, the adopted adjustment formula for m(WS) is of the following form:
with a, b, c, d and g constants determined empirically.
As a validity check for the studied wind speed in the range of zero to 2 m s−1, Fig. 8a shows all raw data (RE versus uncorrected ME10−30 (average of ME10 measured with PWM = 10 %, and ME30 measured with PWM = 30 %) used for calibration), and Fig. 8b shows all the available data corrected using m(WS); the unique function for the composition of all soils and texture depends only on the wind speed. A linear regression shows reasonable concordance with R2 = 0.95. Without wind speed corrections, ME is approximately 10 times smaller than RE.
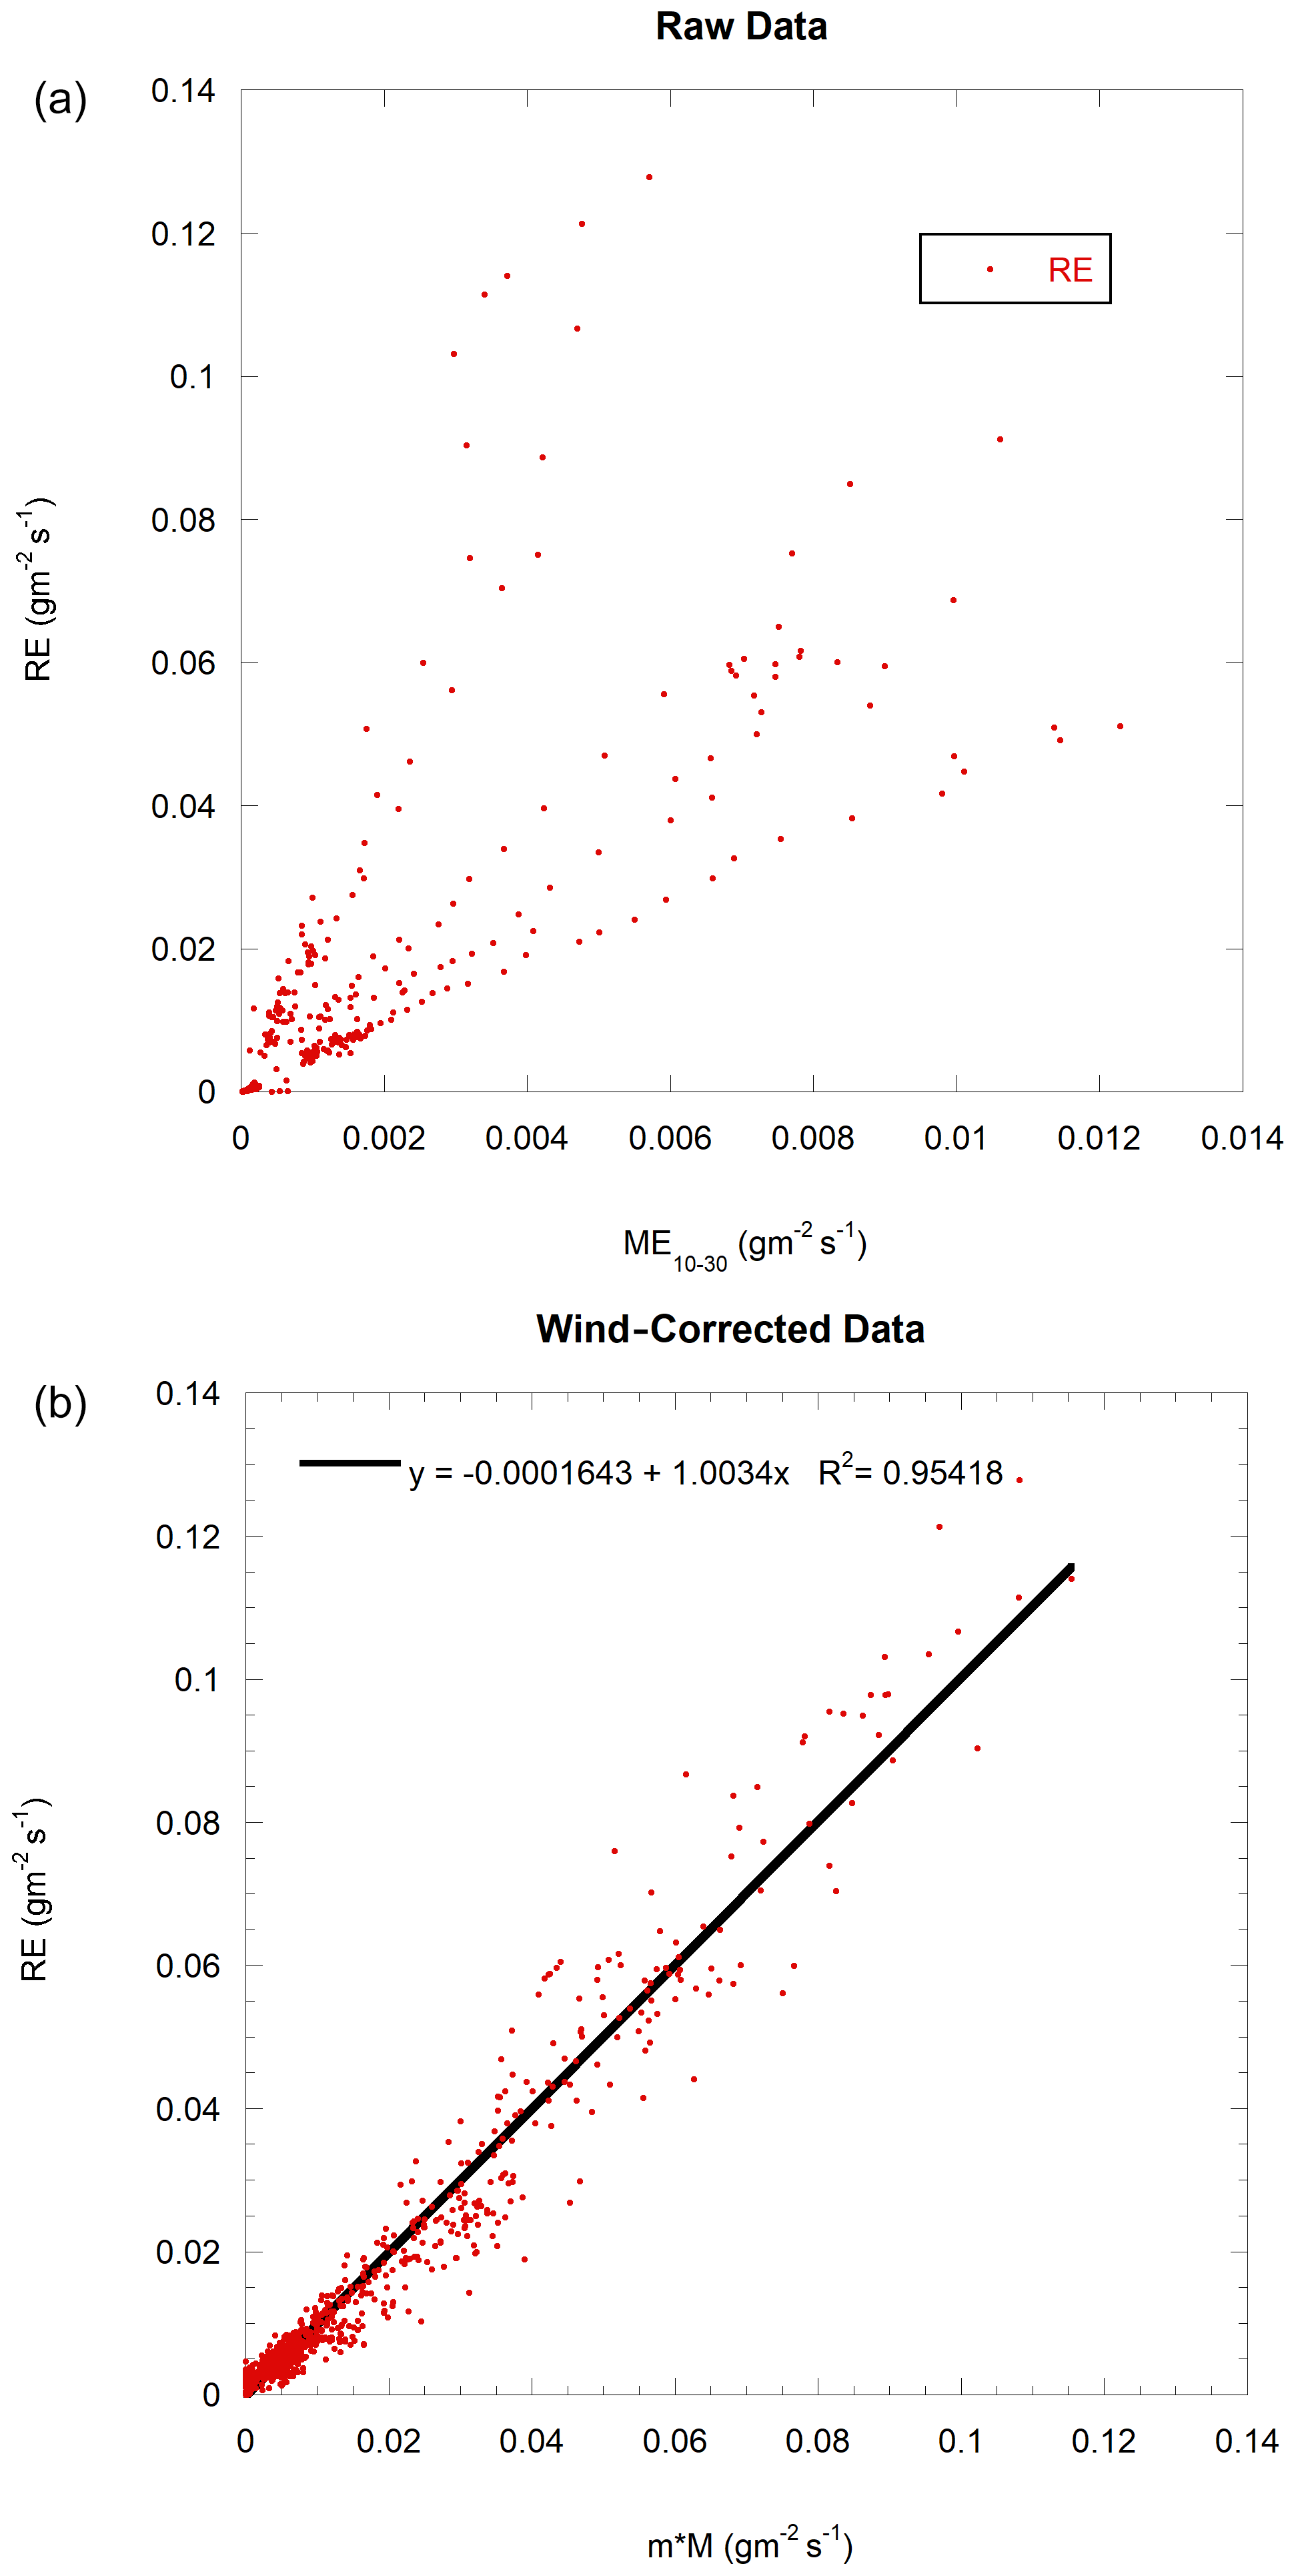
Figure 8(a) RE versus ME (raw data, average between PWM = 10 and PWM = 30 % measurements). (b) RE versus wind speed corrected ME for all disponible data along with a linear regression.
4.3 Wind-speed-affected ME
This section describes the differences between RE and ME under a strong wind. Two phenomena were identified: water vapor sorption by wind-dried soil and inertial water vapor effluxes after chamber head deployment. Special attention should be given to clayey soils under changing wind and to the first 60 s of measurements after chamber head deployment.
4.3.1 Water vapor sorption
Figure 9 shows the resumed ME versus the soil moisture for sandy soil (a) and clayey soil (b). For sandy soil, as we can expect, since the measurements are done under a chamber cloche that isolates the soil from the wind, the measures do not display a clear wind dependence. In contrast, for clayey soil, in contrast to RE, ME decreases with increasing wind speed. This finding may be explained by two facts.
Similarly to trace gas effluxes such as CO2, CH4 or N2O effluxes, the water vapor efflux RE has two source sink components: production (P) and stock (S) from the soil pores, dissolution into the soil water, or sorption (absorption plus adsorption).
Real surface efflux is then a result of the production less stock variation.
The wind may have a great influence on the efflux by forcing to unstock but much less or even nil influence on the production itself in the case of trace gases such as CO2, N2O or CH4 and the deep subsurface evaporation with a low porosity soil.
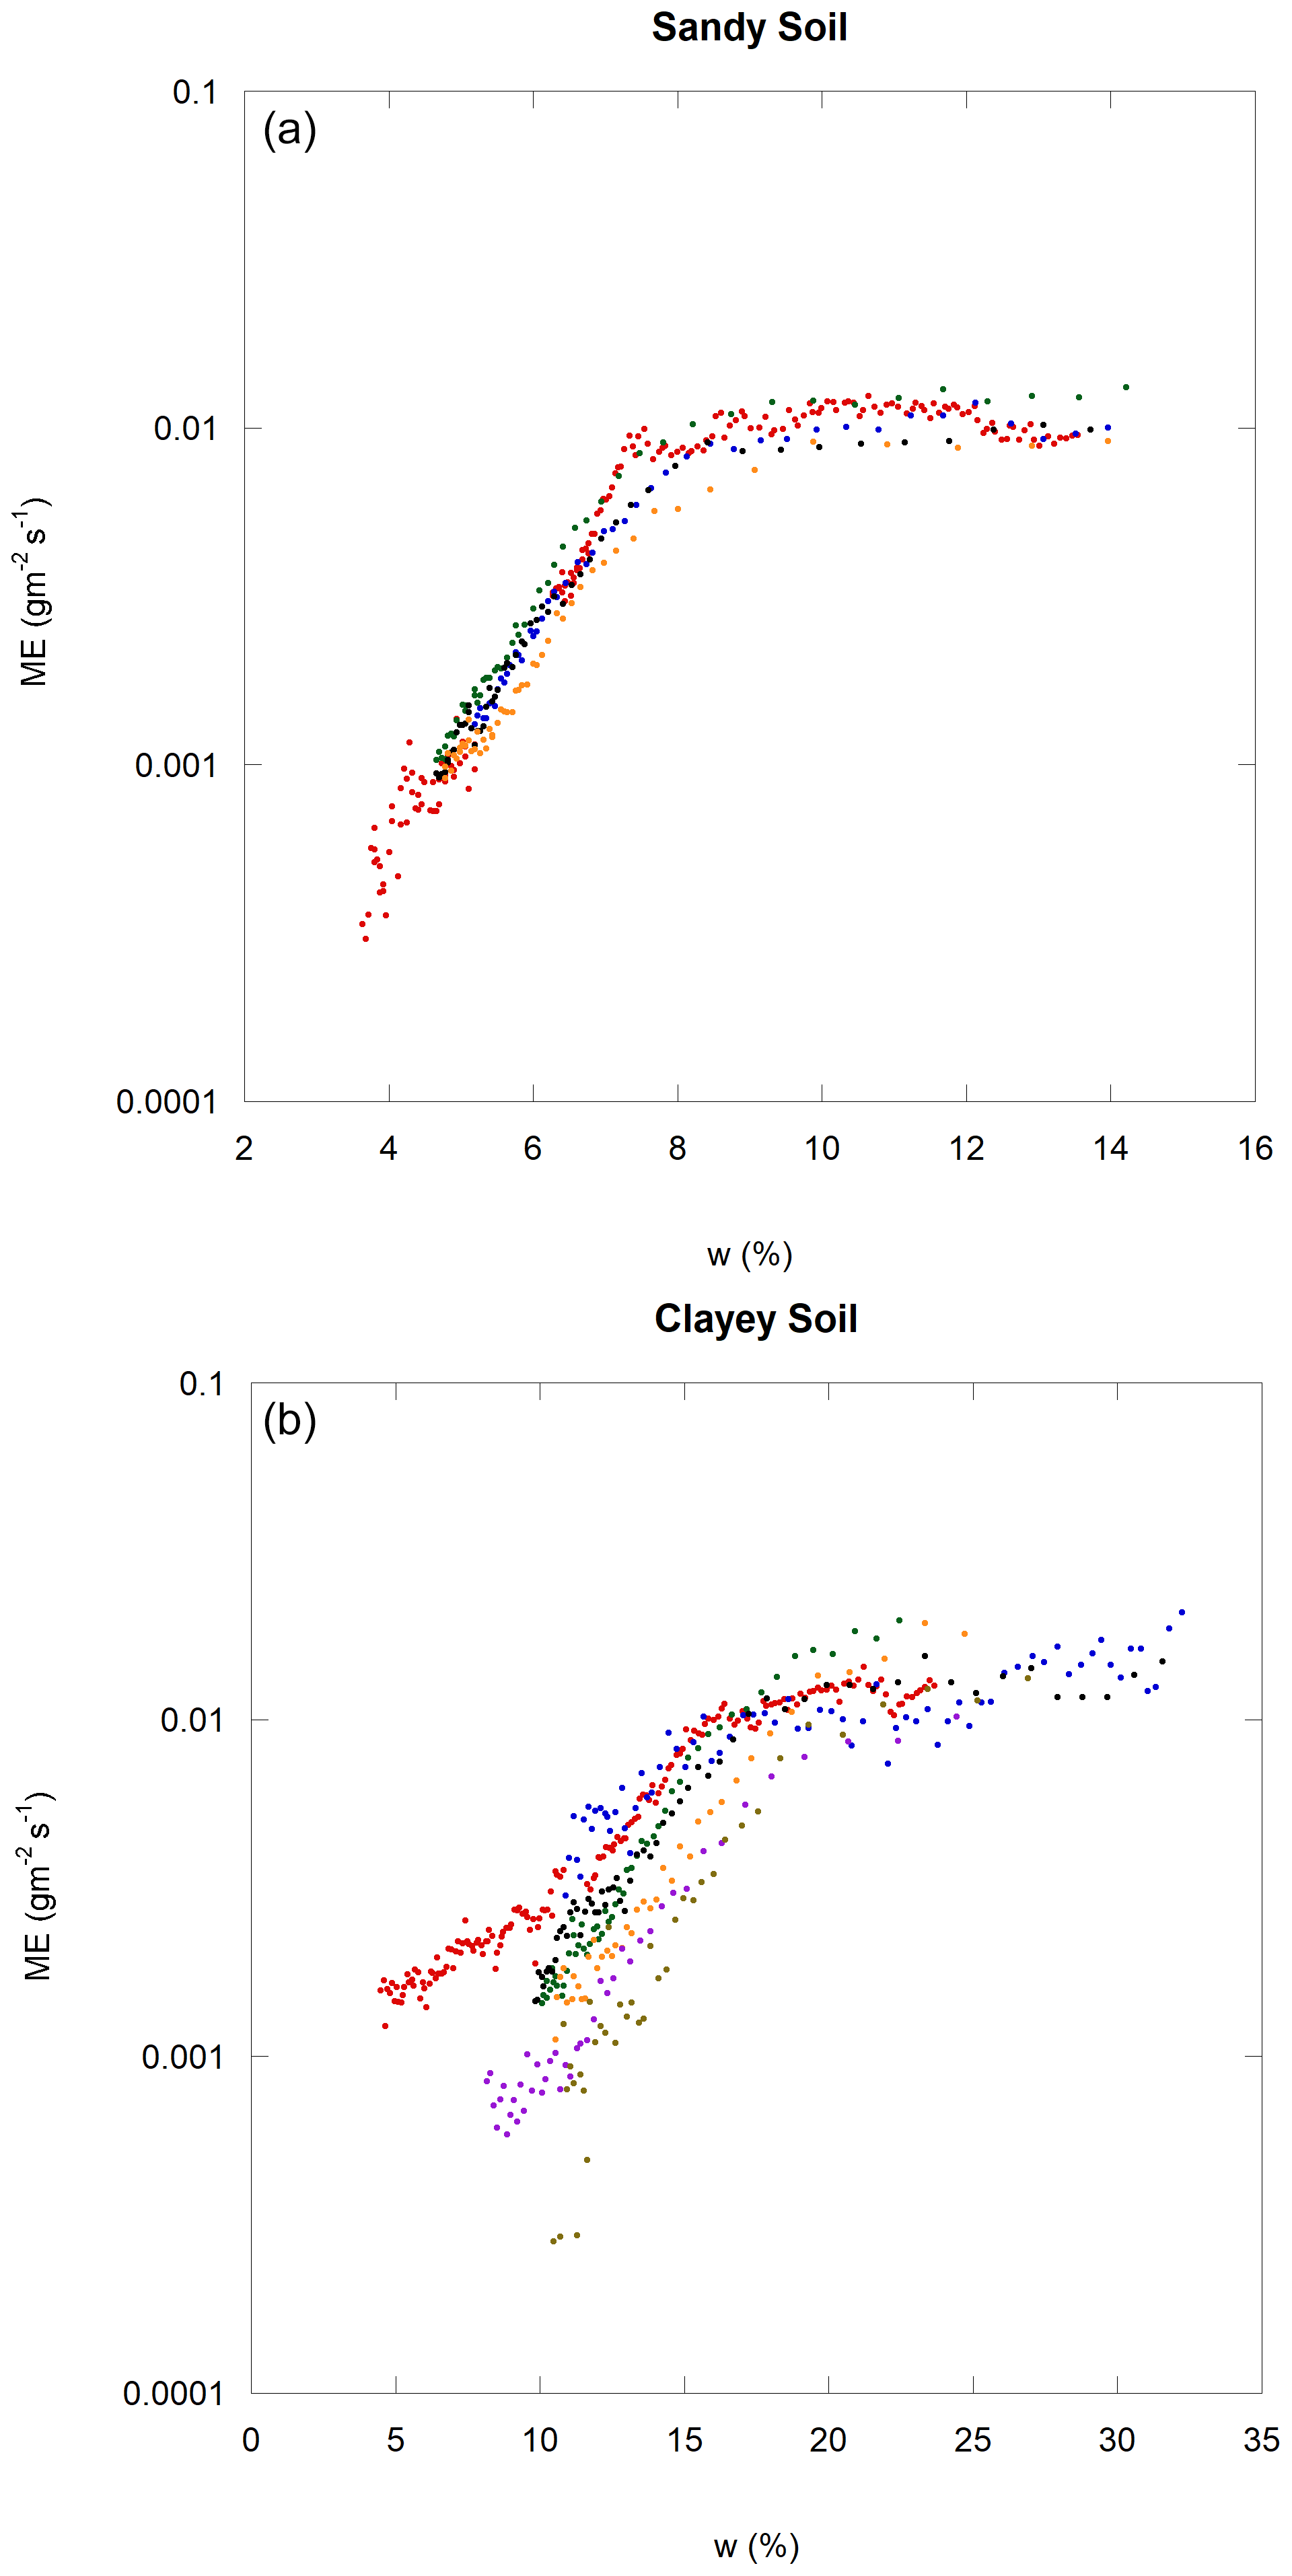
Figure 9Measured evaporation rate ME versus gravimetric soil moisture (PWM = 30 %): (a) sandy soil and (b) clayey soil at several wind speeds.
In the case of water vapor efflux, the soil water vapor stocking ability exists as well in the case of a dry soil layer formation (DSL) (Balugani et al., 2018) that concerns mainly sandy soils under arid or semiarid climates (Wang, 2015), as in the case of simply nonsaturated soil (vadose zone) (Balugani et al., 2016). In both cases, stockage is realized in soil pores saturated with water vapor or by soil (mainly clay) sorption. The migration of water vapor from this undersurface zone is the predominant RE process in the evaporation second stage (Geistlinger et al., 2018). Moreover, on the one hand, concerning evaporation, wind may directly influence production in the shallow subsurface (Harris, 1916; Smits, 2015; a quasiexhaustive list of evaporation factors is given by Suleman et al., 2017), and on the other hand, the soil is able to absorb water vapor from a deeper and wetter evaporating soil layer or from the air, making stock S dependent not only on soil water vapor production P but also on the soil–atmosphere surface interaction (Amer, 2015). This last point may explain why the sandy soil chamber-based measurements are independent of the external wind when the clayey soil gives the measurements of the water vapor effluxes decreasing with the increasing external wind.
Indeed, the ability of soil to absorb water vapor increases with decreasing particle size (Chiorean, 2017), or by definition, sand particles are several magnitudes larger than clay particles. Sandy soil is then much less able to absorb water vapor than clayey soil, for which water vapor sorption is well known and documented from an experimental and theoretical point of view (Johansen and Dunning, 1957; Likos and Lu, 2002; Leelamanie, 2010; Arthur et al., 2016). Under windy conditions, the soil moisture top layer moisture is an equilibrium between wind pumping and the soil water absorption and retention forces. When the wind ceases, another equilibrium must be reached with a lower soil layer which has higher moisture. Short-term water vapor sorption by the previously wind-dried soil layer may significantly, but only temporarily, lower the apparent evaporation rate RE (Jabro, 2009). Consequently, ME behavior is very different for sandy soil and for clayey soil. When the chamber head is deployed, the external wind speed influence is stopped, and the internal fan influence is started. Sandy soil adapts almost immediately to the new conditions but not clayey soil. This point is important for real measurements of clayey soil evaporation under changing wind speed, as the measured results correspond to the pondered integration of previous wind speed influences and not only to the wind speed of the moment.
Figure 10a shows ME behavior at a constant fan speed (PWM = 20 %) over wet sandy or clayey soil after one day of a strong wind that ceases immediately after the first measurement engagement (30 measurements, each chamber deployment for 10 min interspersed with chamber opening and head space flushing for 1 min).
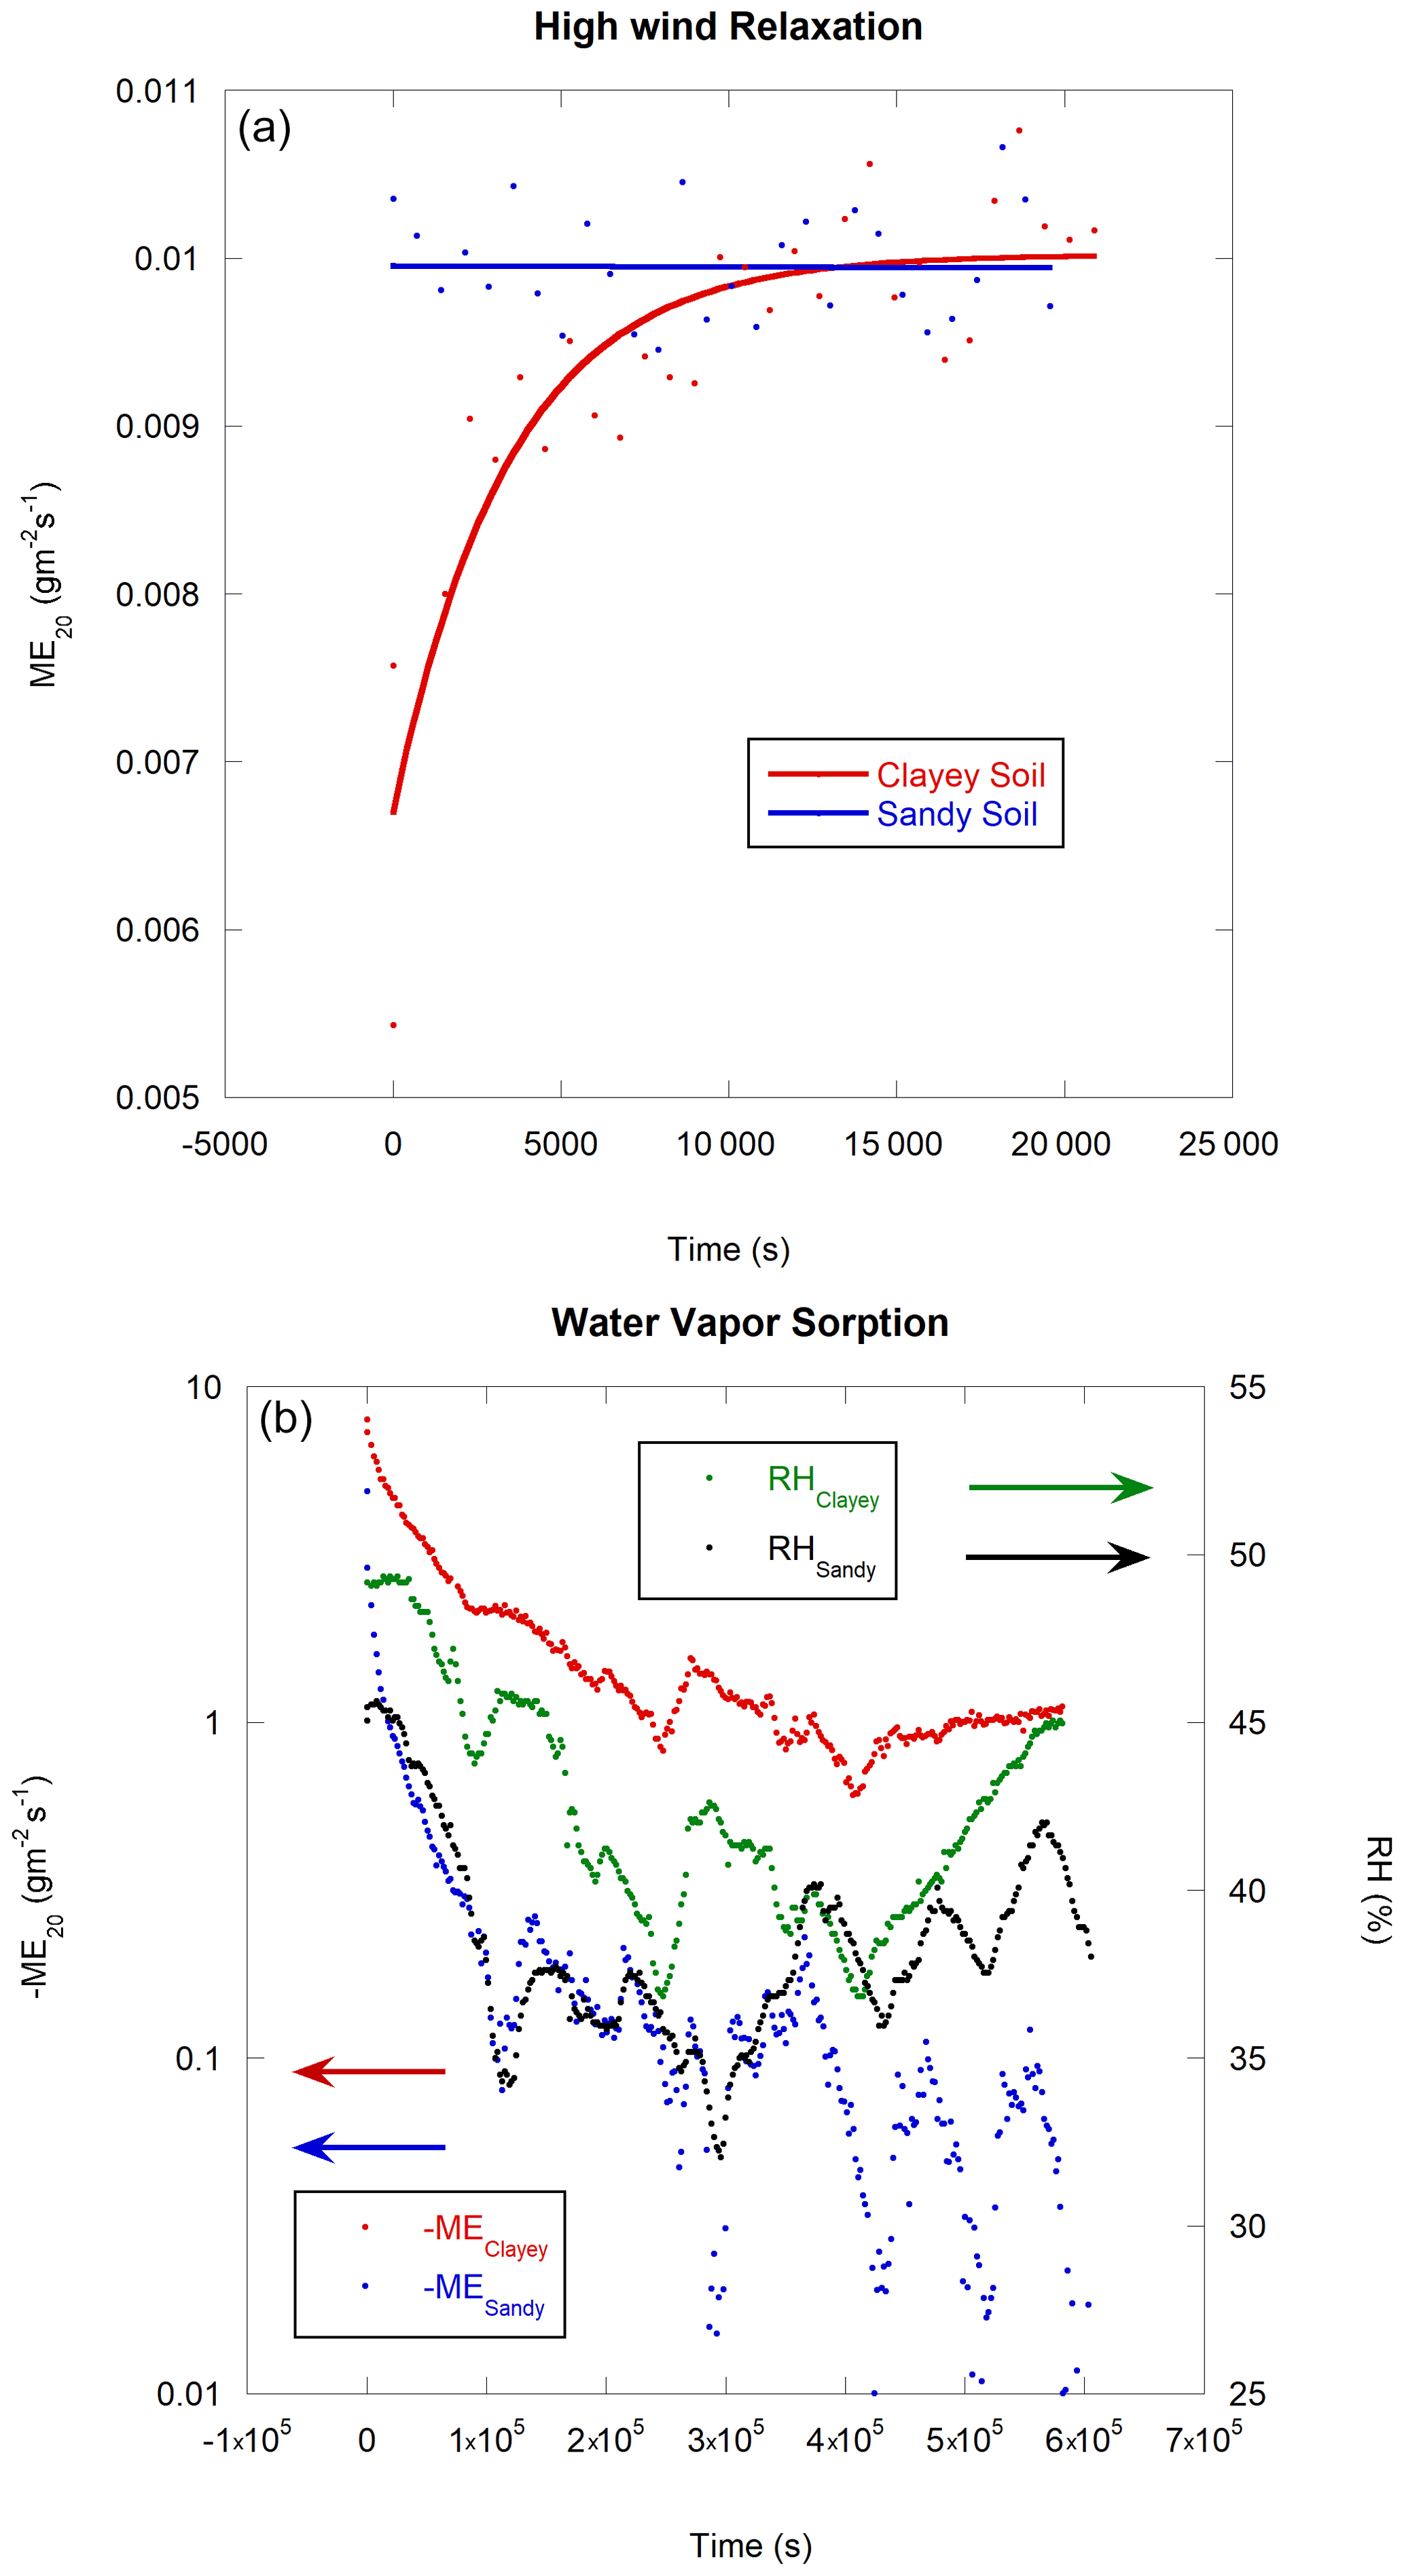
Figure 10Measured (at PWM = 20 %) evaporation ME versus time (a) after a strong wind (WS=2 m s−1) for clayey and sandy soil. The slide line represents a linear regression for sandy soil and an exponential rise regression for clayey soil. (b) After oven drying for 24 h at 105 ∘C.
For sandy soil, the wind dries the soil sample, but chamber deployment, even if it insulates the soil sample from the external wind, does not give an opportunity to the shallow, wind-dried layer of sandy soil to reabsorb water vapor from the air or from the deeper soil and does not limit the measured evaporation rate (Fig. 10). For both sandy soil and clayey soil, the difference in the real evaporation rate is approximately one decade between the zero-wind evaporation rate and small-wind evaporation rate, which can be attributed to a shallow boundary air layer over the soil that is disturbed by any wind. Without wind, this boundary has a high water vapor content, limiting evaporation from the soil by molecular diffusion. A slow advection is also present (water vapor is lighter than the air), but this transport is visibly very slow.
For clayey soil, the wind dries the soil sample in the same way as for the sandy soil. However, after chamber deployment, a previously wind-dried clayey soil layer absorbs water vapor from the deeper wetter soil, reducing the net water vapor efflux ME. The measured surface efflux is real, but the conditions are not. We are in a transition regime caused by chamber deployment and the measured soil portion isolation from the external wind. In the sandy soil case, this transition period is very short (ME is wind independent) and does not affect the measurement when, in the case of a clayey soil, this transition period is long and the characteristic time deduced from an exponential rise regression is approximately 1 h long. The clayey soil sample needs approximately 4 h to reach equilibrium under a wind speed WS = 2 m s−1 to new equilibrium under a nil wind speed WS ≈ 0 m s−1.
Figure 10b displays the ME behavior at PWM = 20 %, but this time, the soil sample was oven-dried for 24 h at 105 ∘C. The bucket with dried soil samples was sealed and opened just before the first measurement. Both the clayey soil and the sandy soil sorb the water vapor from the atmosphere (negative ME), but the sandy soil sorption quickly falls to nearly zero when clayey soil sorption is enduring and is inversely proportional to the air water demand.
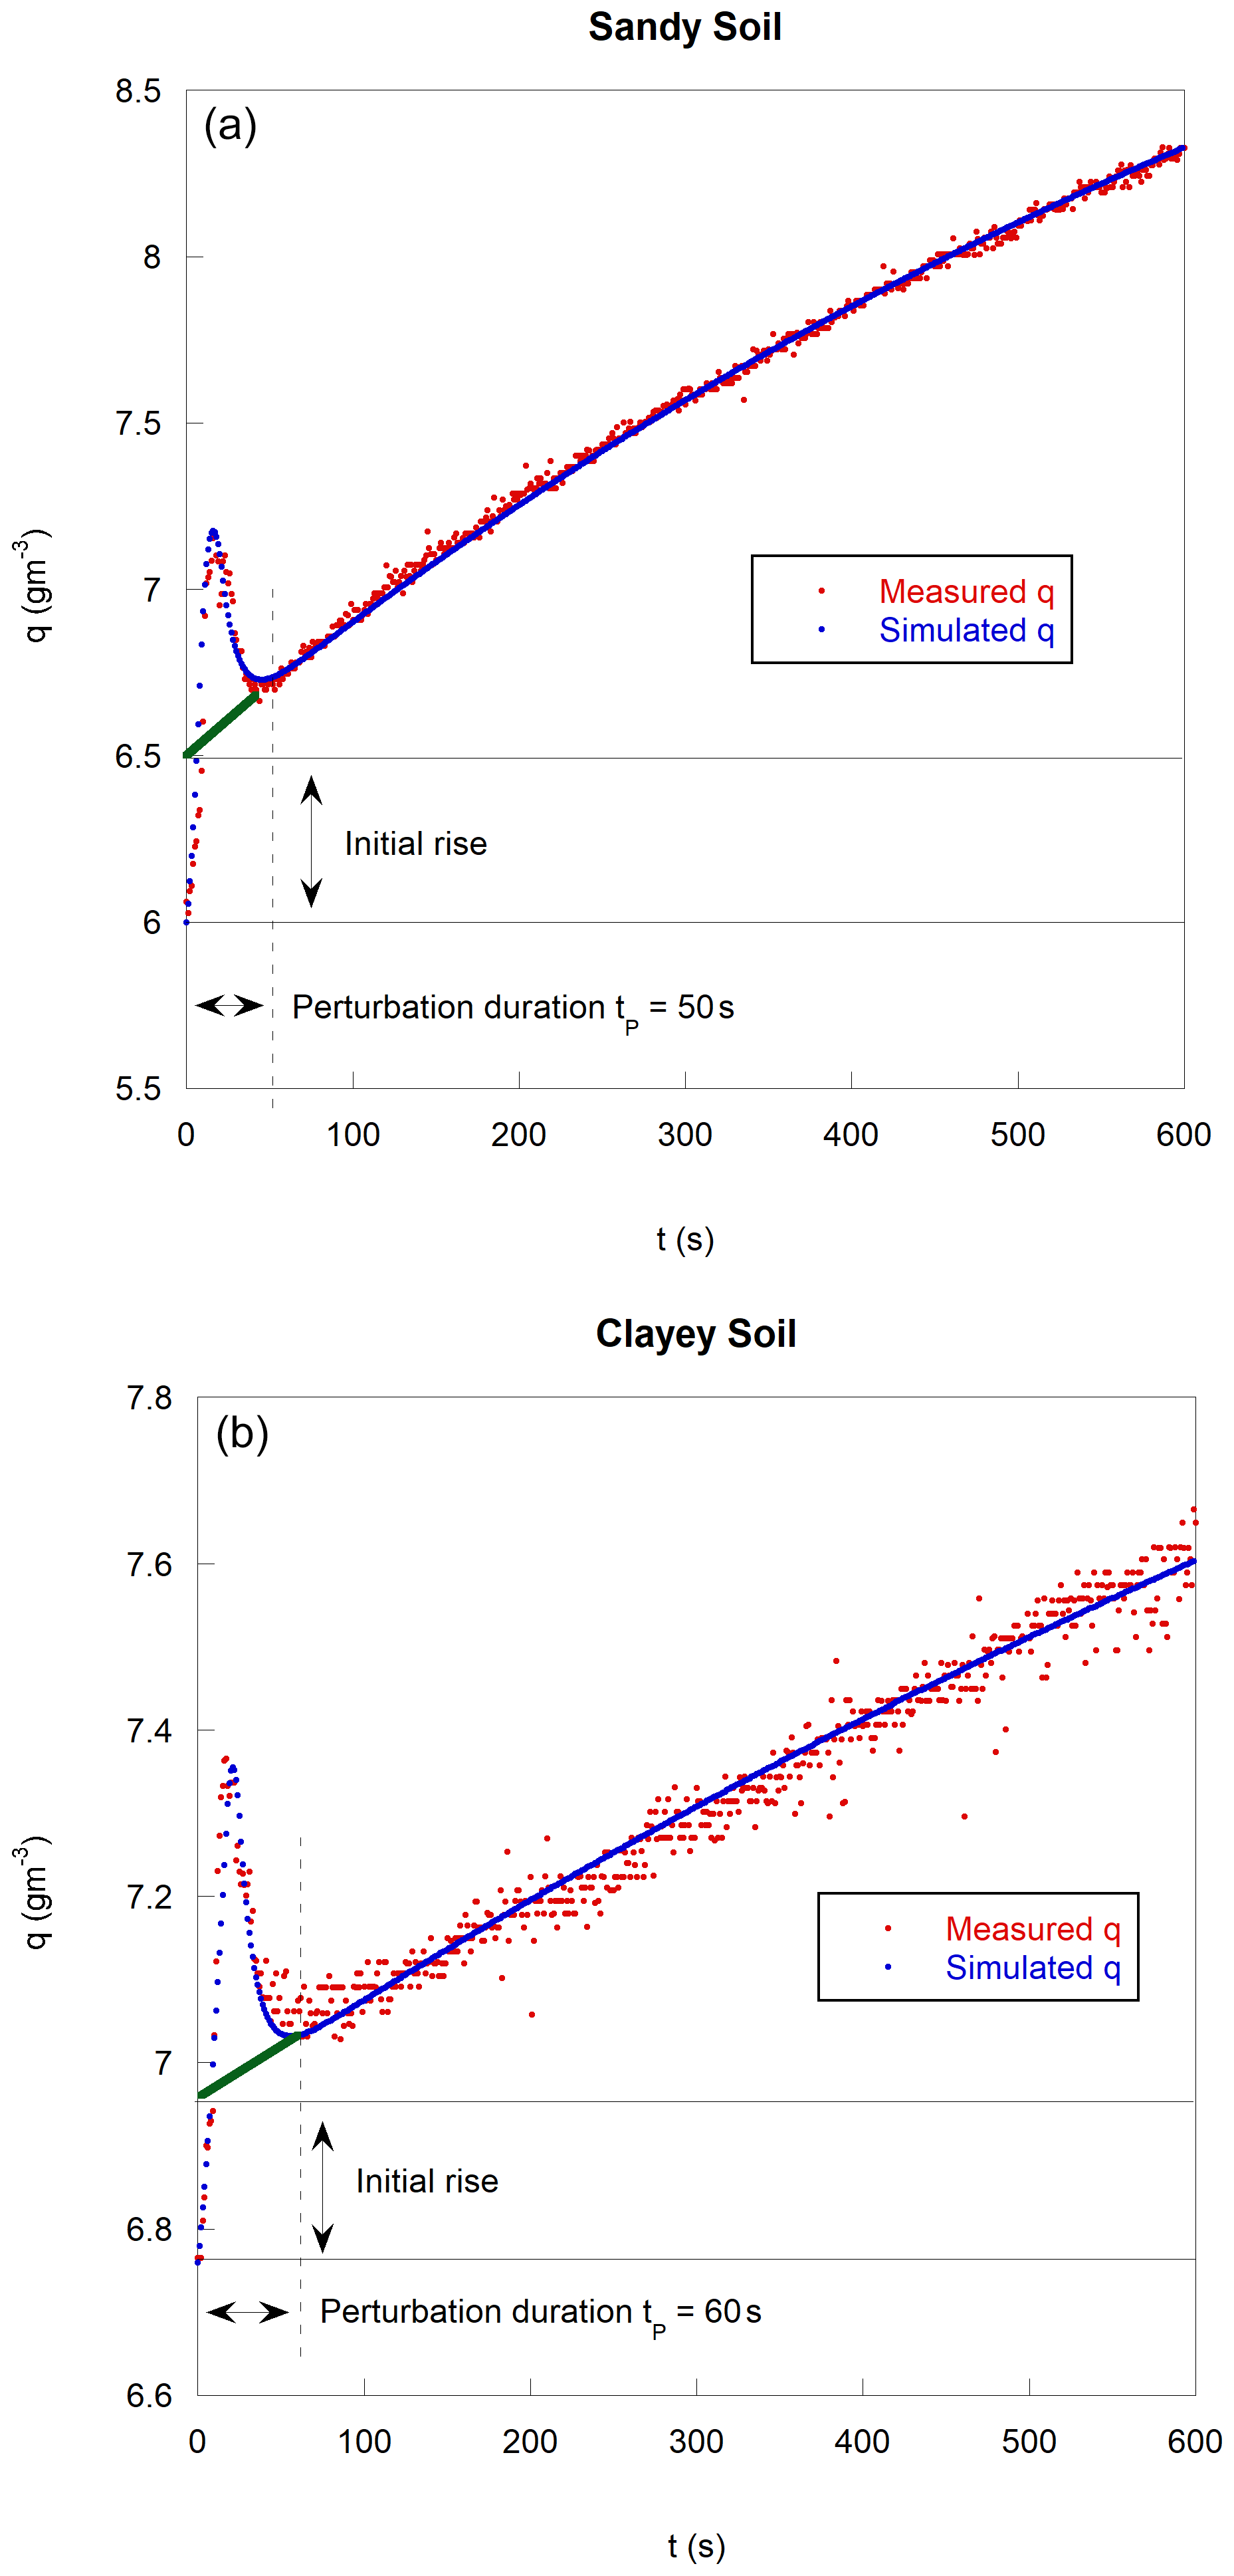
Figure 11Absolute water vapor concentration versus time. Measured concentration and simulated concentration: (a) sandy soil and (b) clayey soil.
4.3.2 Soil evaporation inertia and chamber head air mixing time
During chamber head deployment with a high-speed wind and a relatively wet soil, an initial peak is observed in the enclosed air absolute humidity curve versus time (Fig. 11a for sandy soil and Fig. 11b for clayey soil).
This observation is a direct consequence of noninstantaneous head space air mixing coupled with a high-water vapor efflux in the boundary layer over the soil forced by the wind and is qualitatively well described by a very simple model of mixed closed space air. A larger volume of low-humidity air (chamber head) mixed with the smallest volume of high-humidity air (boundary layer volume) taken linearly increases the humidity, reaching a maximum, and then rapidly decreasing, reaching a usual ER evolution (see the scheme in Fig. 13a). This mixing process may be described by the following equation:
where C(t) is the measured concentration of interest, a is the mixing ratio defined by the proportion of the recycled air divided by the proportion of the air coming from the boundary layer and S(t) is the concentration within this layer. S(t) is the sum of the usual ER evolution with an overage of the water vapor due to the residue of a high wind forced efflux SR(t). This overage concentration is modeled starting from zero, reaching a linear maximum value during approximately half of the perturbation delay tP and then decreasing quickly and always linearly over time (Fig. 12b).
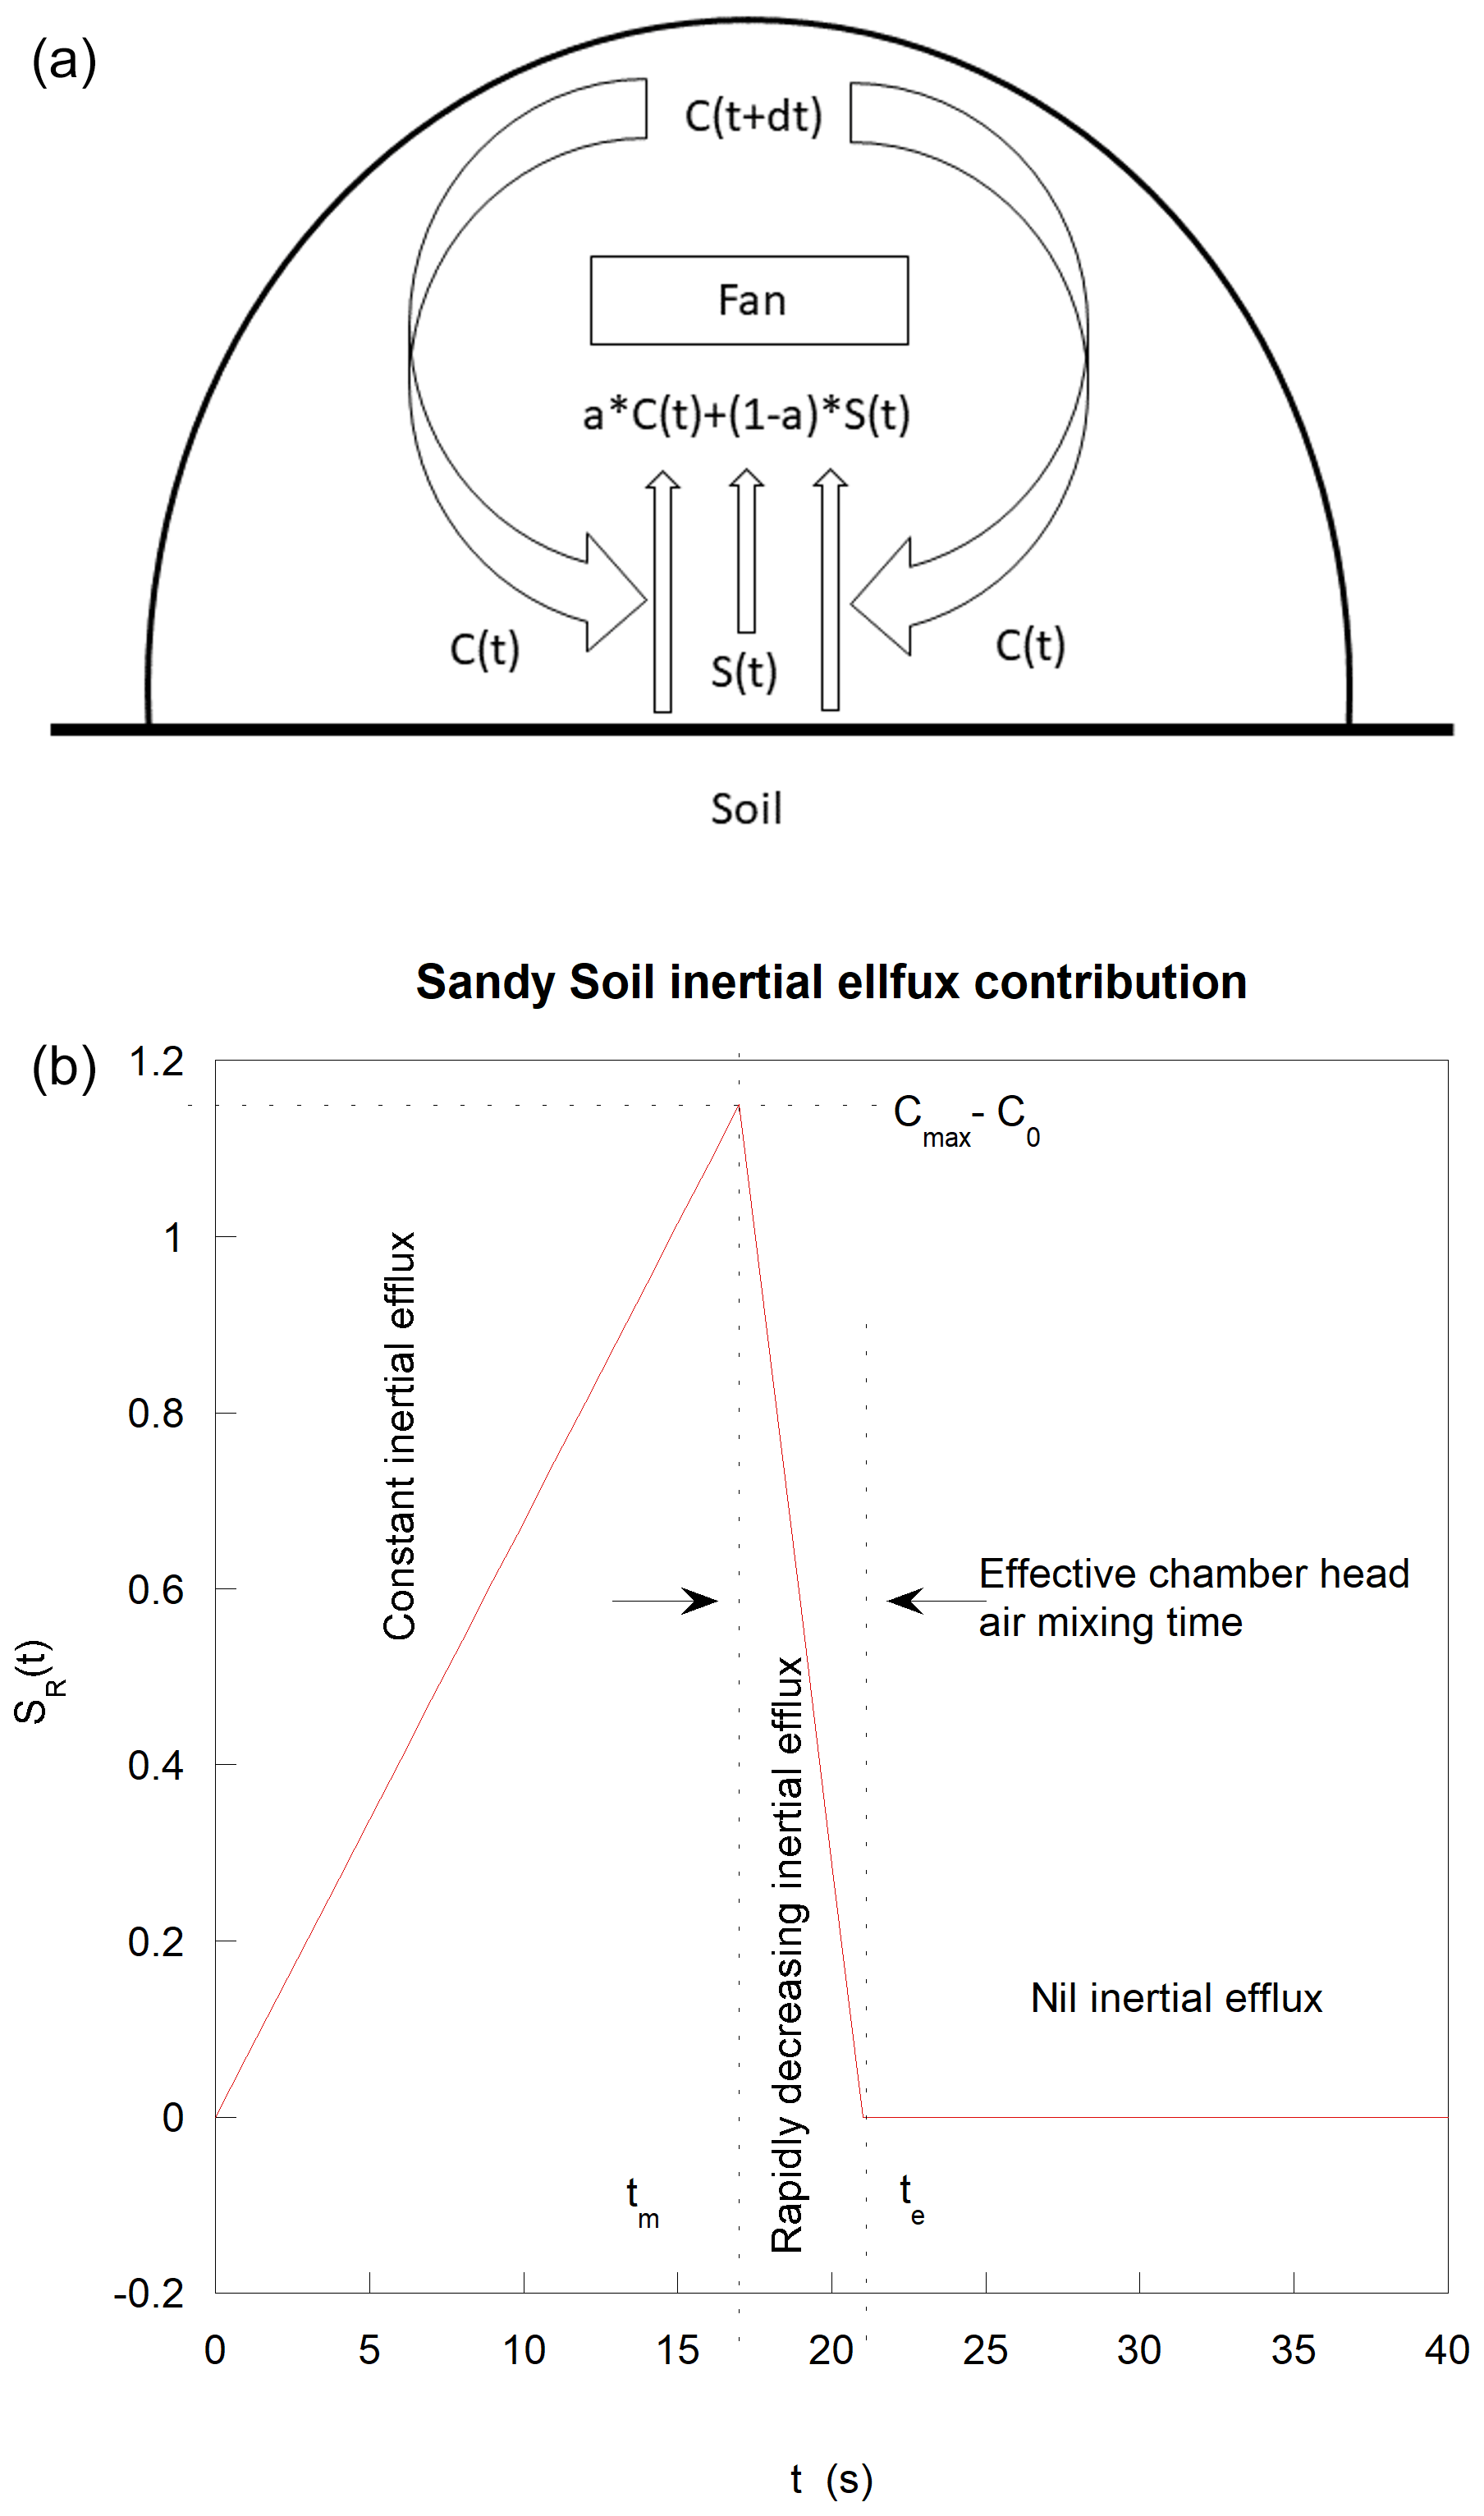
Figure 12(a) Chamber head air mixing principle. (b) Residual water vapor efflux to the boundary layer water vapor concentration SR versus time.
This process reflects a boundary air layer of high moisture that is formed by a strong wind-forced water vapor efflux, which is not immediately stopped by chamber head closure (residual efflux). The resulting perturbation ceases after 50 s of chamber head deployment for sandy soil. This initial peak vanishes with a lower wind speed, a lower soil humidity or a higher fan speed. For example, under PWM = 20 %, the initial peak is hard to spot and is no longer visible with higher fan speeds regardless of the wind speed (in the studied range) or the soil humidity. The peak vanishes, but an initial quick humidity rise inside the deployed chamber head is still visible.
Figure 11 also displays a simulation of the resulting absolute water concentration inside the chamber head (a) for sandy soil and (b) for clayey soil. Figure 12 provides the adjustment constants definitions:
-
C0 is the starting concentration within the chamber head air (ambient concentration).
-
C1 is the maximum concentration within the air boundary layer due to the residual inertial efflux enrichment in competition with the chamber head enclosing the air mixing by the embedded fan.
-
CS is the concentration resulting from the initial concentration raised by the residual inertial efflux (SR is the residual surplus of the boundary concentration due only to the residual inertial contribution), a is the fan mixing ratio, tm is the residual efflux duration, te is time of the residual efflux duration enhanced by the effective mixing time (13 s in our case) and τ0 is the resulting characteristic time for an ER concentration evolution.
-
CL is the concentration of the boundary layer but on the soil side (limit of the concentration within the deployed chamber head after an infinite duration).
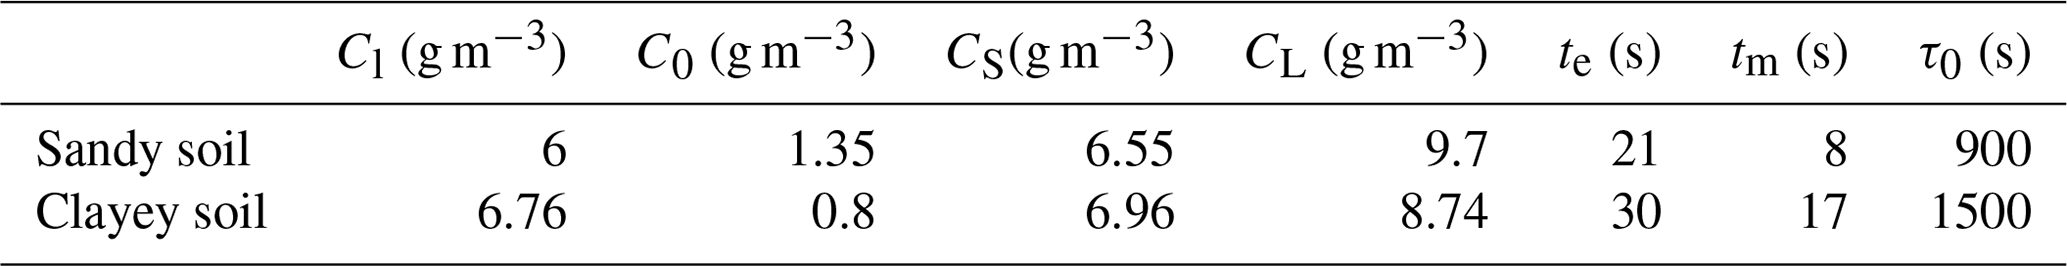
Table 1Sandy soil and clayey soil inertial evaporation constants.
Indeed, the same measurement (PWM = 10 % under a high wind and soil moisture) performed with clayey soil (Fig. 11b) also shows an initial peak, but compared to sandy soil (Fig. 11a), this peak, as the whole evaporation rate, is of the smallest amplitude since the water vapor efflux, as discussed previously, is absorbed by the topsoil layer initially dried by wind pumping. With clayey soil, the initial peak perturbation duration is also slightly longer (60 s) than the initial peak perturbation of sandy soil (50 s).
This initial peak requires special attention during the ER regression calculations to avoid biased results. An initial short time lap exclusion, 50–60 s in this case, may be necessary. The data points should be discarded, but it is important not to shift the time origin because it may lead to an important flux calculation bias (5 % in this sandy soil case). The amount of water vapor released during the first 50 s significantly increases the initial water vapor concentration measurements and the total water vapor content inside the chamber head (initial rise) but does not impact further efflux calculations.
For both simulations, the constants tied to the chamber design, such as a=0.9 and effective mixing time s, are the same, and only constants tied to the soil sample composition change (Table 1).
Compared to sandy soil, the residual efflux due to wind has the smallest amplitude but is longer.
The aim of these studies was to build a self-calibrating chamber based on an NSS technique and a simple working protocol to correct the measured data versus the wind. The proposed chamber design along with a deployment and correction protocol allows R2=0.95 confidence on sandy or clayey bare soil for the surface wind in the range of 0 to 2 m s−1. The correction function has only one variable; the wind speed measured a few centimeters above the soil surface regardless of any other parameter, such as soil composition, soil texture, soil temperature or meteorological variable. However, a study of higher wind speeds is suitable but exceeds the ability of the present experimental setup. The presented results are valid for a bare soil chamber-based measurement. In the vegetative plot case, the measured wind speed at the chamber level will be comparatively slow; however, the wind influence is still important and forced below the canopy wind speed through eddy pressure fluctuations (Kimball and Lemon, 1970, 1971; Baldocchi and Meyers, 1991; Takle et al., 2004; Maier et al., 2010; Mohr et al., 2016; Poulsen et al., 2017; Mohr et al., 2017). The wind eddy pressure fluctuations generated by the above canopy penetrate below the canopy, forcing soil gas efflux. This so-called pressure pumping may be responsible for up to 50- to 100-fold enhanced effluxes. In other words, the most relevant way to correct the chamber-based measurements below the canopy is to correct it with the pressure fluctuation power spectrum or a pressure pumping coefficient (PPC) defined by Mohr et al. (2017) measured at the soil level. However, for bare soil, such as PPC, and the correlated wind speed, without the presence of vegetation, wind speed measurements remain valid for chamber-based measurement correction.
An important experimental campaign concerning CO2 effluxes measured by the NSS technique is currently in progress, and the first results are showing that the described methodology (several consecutive measurements with a different fan speed to deduce real efflux) is not directly applicable to other gas efflux measurements by the NSS technique such as CO2 or N2O, probably because, contrary to the evaporation, the wind speed is acting mainly on the stock and not on the production of these gases. However, a similar technique is not excluded.
During the calibration measurements, some interesting observations concerning the sandy soil evaporation process and chiefly clayey soil evaporation process are reported.
All the soil samples under all the studied winds display two evaporation stages: the first stage is almost constant with lowering soil moisture and is greatly affected by wind, and the second stage is less affected by wind with exponential behavior versus soil moisture. These two evaporation stages are well described by Z variations, which are higher in the first stage. Both soil samples display a decade of RE difference without the wind and with a very small wind due to the air boundary layer perturbation.
Sandy soil does not display a consequent ability to absorb water vapor, and its stocking capacities are limited. However, the apparent evaporation inertia is conspicuous on the relatively wet soil under a relatively strong wind.
In contrast, clayey soil displays a great sorption ability and water vapor stocking or unstocking capacities with a characteristic time in the hourly range. The inertia is partially screened by the sorption magnitude, and a strong external wind is necessary. As described in Appendix A, in the second soil evaporation stage, regardless of the soil, evaporation follows an exponential law versus w. In clayey soil, the evaporation curve versus SWC w shows a common point (CP, w=15.5 % and RE = 0.024 gm−2 s−1) for every wind and soil texture value but nil wind speed. The curve evaporation versus water content below the CP changes its slope. This point seems to correspond to the matrix air entry value (MAEV).
The calibration process requires extensive and comprehensive real soil evaporation measurements. Preceding RE measurement data, two interesting points were remarked and are briefly reported: exponential evaporation behavior for both soils in the second evaporation stage and a common point in the clayey soil.
A1 Real evaporation rate RE on the second stage
Soil evaporation is well known and shown to be able to be divided into three stages (Introduced by Philip, 1959; Wilson et al., 1994 or Hiller, 2004). Wet soil, water-saturated or near water-saturated, evaporates at a constant rate depending greatly on the wind. With progressively drying soil, a second stage appears after the so-called air entry value (AEV) and shows the smallest wind dependence. A third stage concerns very dry soils with a constant extremely low evaporation rate and was not truly observed in this study except in the zero-wind sand evaporation record, which took over 2 months of constant monitoring. To compare measurements under different wind speeds, such as the real evaporation rate from sandy and clayey soils, a semilogarithmic scale versus soil moisture is probably the most relevant method (Fig. A1). In these figures, we can notice that regarding the sand, the first stage is important compared to the clayey soil, where the evaporation quickly falls to the second stage. This behavior is characteristic of relatively low-rate evaporation on sandy soil (Holmes, 1961). The second stage displays a very linear behavior for the sand and for the clayey soil on the logarithmic scale: in the second stage, the evaporation rate is an exponential function of the soil moisture w.
where C depends slightly on the wind speed, and D is a constant almost independent of the wind speed for sandy soil.
Indeed, regarding sandy soil, regardless of the wind, the slopes are the same, and the curves are parallel but remain slightly wind-affected since they are not superimposed.
For the clayey soil, the second-stage evaporation rates are higher for the higher wind. There is a visible common point where the evaporation rates are the same regardless of the wind. For lower moisture, the curves clearly diverge as the slopes are different. The common point existence is discussed in the next section.
The difference between sandy soil and clayey soil drying processes is certainly affected by the micro- and later macrodesiccation crack appearances in clayey soils (Lau, 1987; Morris et al., 1992; Kodikara et al., 2002). These cracks may be considered an effective soil–air interface surface increase and then an additive water vapor exchange surface that may significantly increase the evaporation rate under wind (Nachshon et al., 2012). Another difference between these soils is the grain size difference and then intergrain void space and the resulting matrix suction amplitude, as discussed later in this paper.
A2 Clayey soil cracking and common point
Crack formation in drying clayey soil, also called desiccation soil cracks, has a great influence on the total evaporation up to 50 % enhancement according to Hatano et al. (1988), and under windy conditions, the total evaporation may even be increased by 2 orders of magnitude (Nachshon et al., 2012). This phenomenon is widely studied and relatively well documented, as its consequences for engineering (Fredlund, 1967; Lytton et al., 1976; Daniel et al., 1993; Kodikara et al., 2002; Rodriguez et al., 2007; Stirling et al., 2017) and agriculture (Dexter, 1988; Pal et al., 2012; Kurtzman et al., 2016) are very important. Figure A2 shows the clayey soil sample in its dry state: (a) dried under a moderate wind and (b) dried under no wind. During this study, different crack patterns were obtained with different wind speeds and drying ratios. An obvious wind importance effect on the cracking pattern was noticed. The cracks are more numerous with higher wind in accordance with existing studies (Corte and Higashi, 1960; Tang et al., 2008, 2010; Costa et al., 2013), and the coarsest cracks are always in accordance with previous studies (Corte and Higashi, 1960; Lau, 1987; Wilson et al., 1997; Kodikara et al., 2000; Nahlawi and Kodikara, 2006; Tang et al., 2008, 2010; Costa et al., 2013) due to an important matrix suction increase with the drying ratio in clayey soil. This is a part of so-called dynamic effects. The studied clayey soil sample can lose up to 15 % of its initial volume, and its observation drying under different wind speeds allows us to point out an interesting finding, which is the existence of a common point (CP) and a change in the evaporation ratio versus soil moisture slope below this point under all wind speeds but nil. The clayey soil sample cracks under wind but dries as a whole block, almost without cracks, under calm conditions (Fig. A1b), creating a void space between the soil block and the bucket wall.
CP corresponds to a well-defined RE of approximately 0.024 g m−2 s−1 at a soil moisture w of approximately 15.5 %. CP also corresponds to the RE versus w slope change for drying soil. At the current research advancement point, one can only propose a hypothesis to explain this phenomenon tied with the clayey soil matrix air entry value (MAEV) corresponding to air seepage through the soil matrix, but the present study does not allow us to prove it. Soil RE slows down as the soil moisture decreases; however, in the swelling clayey soil case, the soil moisture decreases cause microcracks and hollow formation, depending on the expansive clay content (smectite minerals, including montmorillonite and bentonite) and, more precisely, its vertisol character (Ahamad, 1996; Everest et al., 2016), increasing the effective soil–atmosphere interaction surface (Bronswijk, 1988).
This fact agrees with a relatively less pronounced transition between the first and second stages of evaporation observed in clayey soil versus sandy soil (Fig. A1). As the importance of the wind influence on the RE goes together with the interaction surface, any change in the latter is visible in the former. Crack formation in the soil would increase RE by changing the RE versus w ratio and may then explain the apparent slope change observed in Fig. A1b. However, the cracks transform the soil sample to a fractured medium and are visible well before the CP point, as shown by Song et al. (2016). Cracking forms a so-called cracking air entry value (CAEV) on the moistest, almost saturated, clayey soil, and their formation is progressive, which is rather incompatible with a brusque slope change. The concerned soil moisture point CP seems to correspond rather to a soil matrix air entry value (Azam et al., 2013) below which the soil acts as a porous medium. The crack formation causing the first AEV (CAEV) on a soil moisture characteristic curve is followed by the matrix AEV (MAEV) formation on a drier soil and is very similar to a bimodal grain-size distribution curve (Satyanaga et al., 2013), where grains of both large and small sizes are present in the soil with two intergrain void space sizes. These two points, cracks and matrix AEV, occur in a drying clayey under the wind before the final void ratio stabilization (Dinka and Lascano, 2012; Péron et al., 2006) and affect an evaporation ratio that is one order of magnitude larger than the order of magnitude of no wind evaporation. Since, under no wind, the CP is not visible, one can deduce that cracks and/or wind presence are necessary
The response of a slow sensor to step-like variations in physical variable S is usually very close to an exponential rise evolution between the initial value M0 and the final value Mf and characterized by the characteristic time τm (see Eq. 3). If the measured variable also follows a known exponential law (characteristic time τs, to simulate the slow sensor-provided signal), one can proceed by discretization dividing the considered time interval into several equal short intervals Δt. For example, if the considered physical variable evolution takes 100 s, we can start a simulation working with Δt=1 s.
Then, for each interval, we can calculate the real signal amplitude:
In equilibrium at the beginning, M0=S0, the sensor will follow the real signal S evolutions with some delay deforming it. For each time interval, we can approximate its measurement evolution as an exponential rise evolution between the last reached state and a new state.
As the results are dependent on Δt magnitude, this interval can be made increasingly smaller, for example, dividing it by 2 each time. With progressively smaller intervals Δt, each simulation will give results that became stable and do not change notably. At this time, we can consider the results accurate.
Figure B1 shows a simulation of a slow sensor (τm=10 s) that measures an exponential-rise-like signal (τs=30 s) fitted by an exponential rise adjustment. The insert represents a zoom of the initial variations. The calculated fluxes are the product of the variation amplitude (asymptotic level less initial level) by the initial slope. The fit of slow sensor measurements has a lower slope, but the adjustment optimization process tends to overestimate the variation amplitude. There is a local maximum of that product. That is, a moderately slow sensor may lead to an overestimation of the flux.
In Fig. B1, we can see the three intersections between the measured signal and the fit, which are used to settle the second fitted interval, as shown in Fig. 2.
| AEV | Air entry value |
| ASERC | Auto-calibrated Soil Evapo-Respiration Chamber |
| CAEV | Cracking air entry value |
| CP | Common point |
| ER | Exponential rise |
| IR | Infrared |
| IRGA | Infrared gas analyzer |
| m (WS) | Correction factor depending on wind speed |
| M | Measurement average multiplied by Z (gm−2 s−1) |
| Mx | Measurement with PWM = x % (gm−2s−1) |
| M10−30 | Average of the measurement with PWM = 10 % |
| and measurement with PWM = 30 % | |
| MB | Bucket with soil mass (g) |
| M0 | Bucket with dry soil mass (g) |
| Ms | Dry soil mass (g) |
| MAEV | Matrix air entry value |
| ME | Measured evaporation rate (gm−2 s−1) |
| NDIR | Non-dispersive infrared |
| NSS | Non-steady state |
| P | Water vapor production (gm−2 s−1) |
| PTFE | Polytetrafluoroethylene |
| PU | Polyurethane |
| PWM | Pulse wide modulation (unitless and |
| expressed in %) | |
| q | Absolute air humidity (gm−3) |
| R2 | Coefficient of determination |
| RE | Real evaporation rate (gm−2s−1) |
| RH | Relative air moisture (unitless but expressed in %) |
| S | Soil water vapor stock (gm−2) |
| SWC | Soil water content |
| Ta | Air temperature (∘C) |
| τ63 | Response time (time necessary to reach 63 % |
| of final signal) (s) | |
| W | Gravimetric soil water content (unitless |
| expressed in %) | |
| WS | Wind speed (m s−1) |
| Z | Soil evaporation wind susceptibility |
| (unitless and expressed in %) | |
| Z10−30 | Z calculated using only two measurements |
| with PWM = 10 % and PWM = 30 % | |
| Ztotal | Z calculated using all 10 measurements |
| with PWM from 10 % to 100 % (step 10 %) |
The data and source code used for these studies can be obtained by contacting the author.
The contact author has declared that there are no competing interests.
Publisher’s note: Copernicus Publications remains neutral with regard to jurisdictional claims in published maps and institutional affiliations.
I would like to acknowledge Tiphaine Tallec (CESBIO, Toulouse, France) for her useful discussions. Special thanks are due to Valérie Le Dantec (CESBIO, Toulouse, France), who greatly contributed to the motivation for this work. I am particularly grateful to Katia Bonne (LI-COR Biosciences GmbH, Bad Homburg, Germany) and Jason Hupp (LI-COR Biosciences, Nebraska, USA) for discussions and communications.
This research has been supported by ICOS France and OSR. Anna Zawilski was a key contributor to this study's funding.
This paper was edited by Ciro Apollonio and reviewed by three anonymous referees.
Ahamad, N.: Occurrence of distribution of Vertisols, in: Vertisols and Technologies for their Management, edited by: Ahmad, N. and Mermut, A., Dev. Soil Sci., 24, 1–41, https://doi.org/10.1016/S0166-2481(96)80003-1, 1996.
Amer, A. M.: Wetting and Wettability, chap. 1: Water Vapor Adsorption and Soil Wetting, Edited by Aliofkhazraei M., Tarbiat Modares University, Iran, https://doi.org/10.5772/60953, 2015.
Arthur, E., Tuller, M., Moldrup, P., and de Jonge, L. W: Evaluation of theoretical and empirical water vapor sorption isotherm models for soils, Water Resour. Res., 52, 190–205, https://doi.org/10.1002/2015WR017681, 2016.
Aubinet, M., Vesala, T., and Papale, D.: Eddy Covariance, A Practical Guide to Measurement and Data Analysis, Springer Dordrecht Heidelberg London New York, https://doi.org/10.1007/978-94-007-2351-1, 2012.
Bain, W. G., Hutyra, L., Patterson, D. C., Bright, A. V., Daube, B. C., Munger, J. W., and Wofsy, S. C.: Wind-induced error in the measurement of soil respiration using closed dynamic chambers, Agr. Forest Meteorol., 131 225–232, https://doi.org/10.1016/j.agrformet.2005.06.004, 2005.
Baldocchi, D. and Meyers, T.: Trace gas exchange above the floor of a deciduous forest: 1. Evaporation and CO2 efflux, J. Geophys. Res.-Atmos., 96, 7271–7285, https://doi.org/10.1029/91JD00269, 1991.
Balugani, E., Lubczynski, M. W., and Metselaar, K.: A framework for sourcing of evaporation between saturated and unsaturated zone in bare soil condition, Hydrol. Sci. J., 61, 1981–1995, https://doi.org/10.1080/02626667.2014.966718, 2016.
Balugani, E., Lubczynski, M. W., van der Tol, C., and Metselaar, K.: Testing three approaches to estimate soil evaporation through a dry soil layer in a semi-arid area, J. Hydrol., 567, 405–419, https://doi.org/10.1016/j.jhydrol.2018.10.018, 2018.
Bornemann, F.: Kohlensaure und Pflanzenwachstum, edited by: Ed. Parey, P., Berlin, Mitt. Dtsch. Landwirtsch-Ges., 35–363, 1920.
Brændholt, A., Steenberg Larsen, K., Ibrom, A., and Pilegaard, K.: Overestimation of closed-chamber soil CO2 effluxes at low atmospheric turbulence, Biogeosciences, 14, 1603–1616, https://doi.org/10.5194/bg-14-1603-2017, 2017.
Bronswijk, J. J. B.: Modeling of water balance, cracking and subsidence of clay soils, J. Hydrol., 97, 199–212, https://doi.org/10.1016/0022-1694(88)90115-1, 1988.
Chiorean, V.-F.: Determination of Matric Suction and Saturation Degree for Unsaturated Soils, Comparative Study – Numerical Method versus Analytical Method, 2017 IOP Conf. Ser.-Mater. Sci. Eng., 245, 032074, https://doi.org/10.1088/1757-899X/245/3/032074, 2017.
Chung, E.-S., Soden, B., Sohnb, B. J., and Shic, L.: Upper-tropospheric moistening in response to anthropogenic warming, P. Natl. Acad. Sci. USA, 111, 11636–11641, https://doi.org/10.1073/pnas.1409659111, 2014.
Corte, A. and Higashi, A.: Experimental Research on Desiccation Cracks in Soil, Research Report, 66. Technical Report, Wilmette, Illinois, US Army Snow Ice and Permafrost Research Establishment, 1960.
Costa, S., Kodikara, J. K., and Shannon, B.: Salient factors controlling desiccation cracking of clay in laboratory experiments, Géotechnique, 63, 18–29, https://doi.org/10.1680/geot.9.P.105, 2013.
Daniel, D. E. and Wu, Y. K.: Compacted Clay Liners and Covers for Arid Sites, J. Geotech. Eng.-ASCE, 119, 223–237, https://doi.org/10.1061/(ASCE)0733-9410(1993)119:2(223), 1993.
Davarzani, H., Smits, K., Tolene, R. M., and Illangasekare, T.: Study of the effect of wind speed on evaporation from soil through integrated modelling of the atmospheric boundary layer and shallow subsurface, Water Resour. Res., 50, 661–680, https://doi.org/10.1002/2013WR013952, 2014.
Dexter, A. R.: Advances in characterization of soil structure, Soil Till. Res., 11, 199–238, https://doi.org/10.1016/0167-1987(88)90002-5, 1988.
Dinka, T. M. and Lascano, R. J.: Review Paper: Challenges and Limitations in Studying the Shrink-Swell and Crack Dynamics of Vertisol Soils, Open J. Soil Sci., 2, 82–90, https://doi.org/10.4236/ojss.2012.22012, 2012.
Everest, T. and Ozcan, H.: The properties and comparison of the vertisol soils formed on different physiographies, J. Ponte, 72, https://doi.org/10.21506/j.ponte.2016.12.12, 2016.
Fang, C. and Moncrieff, J. B.: An open-top chamber for measuring soil respiration and the influence of pressure difference on CO2 efflux measurement, Funct. Ecol., 12, 319–325, https://doi.org/10.1046/j.1365-2435.1998.00189.x, 1998.
Farrell, D. A., Greacen, L. E., and Gurr, C. G.: Vapor Transfer in Soil due to Air Turbulence, Soil Sci., 102, 305–313, 1966.
Ferretti, D. F., Pendall, E., Morgan, J. A., Nelson, J. A., LeCain, D., and Mosier, A. R.: Partitioning evapotranspiration fluxes from a Colorado grassland using stable isotopes: Seasonal variations and ecosystem implications of elevated atmospheric CO2, Plant Soil, 254, 291–303, https://doi.org/10.1023/A:1025511618571, 2003.
Fredlund, D. G.: Comparison of soil suction and one dimensional consolidation characteristics of a highly plastic clay, M. Sc. thesis, University of Alberta, Edmonton, National Research Council of Canada, https://doi.org/10.4224/20378888, 1967.
Fukuda, H.: Air and water Vapor movement in soil due to wind gustiness, Soil Sci., 79, 249–258, 1955.
Geistlinger, H. and Leuther, F.: Evaporation Study for real soils based on HYPROP hydraulic functions and micro-CT measured pore-size distribution, Vadose Zone J., 17, 180041, https://doi.org/10.2136/vzj2018.02.0041, 2018.
Good, S. P., Noone, D., and Bowen, G.: Hydrologic connectivity constrains partitioning of global terrestrial water fluxes, Science, 349, 175–177, https://doi.org/10.1126/science.aaa5931, 2015.
Goulden, M. L., Munger, J. W., Fan, S.-M., Daube, B. C., and Wofsy, S. C.: Measurements of carbon sequestration by long-term eddy covariance: methods and a critical evaluation of accuracy, Glob. Change Biol., 2, 169–182, https://doi.org/10.1111/j.1365-2486.1996.tb00070.x, 1996.
Hanks, R. J. and Woodruff, N. P.: Influence of Water Vapor Transfer Trough Soil, Gravel, and Straw Mulches, Soil Sci., 86, 160–164, https://doi.org/10.1097/00010694-195809000-00010, 1958.
Harris, F. S.: Factors Affecting the Evaporation of Moisture from the Soil, J. Agric. Res., VII, 439–461, https://naldc.nal.usda.gov/download/IND43965633/PDF (last access: 8 March 2022), 1916.
Hatano, R., Nakamoto, H., Sakuma, T., and Okajima, H.: Evapotranspiration in cracked clay field soil, Soil Sci. Plant Nutr., 34, 547–555, https://doi.org/10.1080/00380768.1988.10416470, 1988.
Heinemeyer, A., Di Bene, C., Lloyd, A.R., Tortorella, D., Baxter, R., Huntley, B., Gelsomino, A., and Ineson, P.: Soil respiration: implications of the plant-soil continuum and respiration chamber collar-insertion depth on measurement and modelling of soil CO2 efflux rates in three ecosystems, Eur. J. Soil Sci., 62, 82–94, https://doi.org/10.1111/j.1365-2389.2010.01331.x, 2011.
Heitman, J. L., Xiao, X., Horton, R., and Sauer, T. J.: Sensible heat measurements indicating depth and magnitude of subsurface soil water evaporation, Water Resour. Res., 44, W00D05, https://doi.org/10.1029/2008WR006961, 2008.
Heitman, J. L., Zhang, X., Xiao, X., Ren, T., and Horton, R.: Advances in heat-pulse methods: Measuring soil water evaporation with sensible heat balance, Method. Soil Anal., 2, 1371–1375, https://doi.org/10.2136/msa2015.0029, 2017.
Hill, R. J.: Implications of Monin–Obukhov Similarity Theory for Scalar Quantities, J. Atmos. Sci., 46, 2236–2244, https://doi.org/10.1175/1520-0469(1989)046<2236:IOMSTF>2.0.CO;2, 1989.
Hollinger, D. Y., Goltz, S. M., Davidson, E. A., Lee, J. T., Tu, K., and Valentine, H. T.: Seasonal patterns and environmental control of carbon dioxide and water vapor exchange in an ecotonal boreal forest, Glob. Change Biol., 5, 891–902, https://doi.org/10.1046/j.1365-2486.1999.00281.x, 1999.
Holmes, R. M.: Estimation of soil moisture content using evaporation data. Proceedings of Hydrology Symposium, No. 2 Evaporation, Queen's Printer, Ottawa, Department of Northern Affairs and National Resources, Water Resources Branch, 184–196, 1961.
Jabro, J. D.: Water Vapor Diffusion Through Soil as Affected by Temperature and Aggregate Size, Transp. Porous Med., 77, 417–428, https://doi.org/10.1007/s11242-008-9267-z, 2009.
Janssens, I. A., Kowalski, A. S., Longdoz, B., and Ceulemans, R.: Assessing Forest soil CO2 efflux: an in-situ comparison of four techniques, Tree Phys., 20, 23–32, https://doi.org/10.1093/treephys/20.1.23, 2000.
Johansen, R. T. and Dunning, H. N.: Water-vapor adsorption on clays, Clays Clay Miner., 6, 249–258, 1957.
Kimball, B. A. and Lemon, E. R.: Spectra of Air Pressure Fluctuation at the Soil Surface, J. Geophys. Res., 75, 6771–6777, https://doi.org/10.1029/JC075i033p06771, 1970.
Kimball, B. A. and Lemon, E. R.: Theory of soil air movement due to pressure fluctuations, Agr. Meteorol., 9, 163–181, https://doi.org/10.1016/0002-1571(71)90020-3, 1971.
Kimball, B. A., Boote, K. J., Hatfield, J. L., Ahuja, L. R., Stockle, C., Archontoulis, S., Baron, C., Basso, B., Bertuzzi, P., Constantin, J., Deryng, D., Dumont, B., Durand, J-L., Ewert, F., Gaiser, T., Gayler, S., Hoffmann, M. P., Jiang, Q., Kim, S-H., Lizaso, J. S., Moulin, Nendel, C. P., Parker, Palosuo, T., Priesack, E., Qi, Z., Srivastava, A., Stella, T., Tao, F., Thorp, K. R., Timlin, D., Twine, T. E., Webber, H., Willaume, M., and Williams, K.: Simulation of maize evapotranspiration: An inter-comparison among 29 maize models, Agr. Forest Meteorol., 271, 264–284, https://doi.org/10.1016/j.agrformet.2019.02.037, 2019.
Kodikara, J. K., Barbour, S. L., and Fredlund, D. G.: Desiccation cracking of soil layers. In Proceedings of the Asian Conference on Unsaturated Soils, UNSAT-Asia, Singapore, Balkema, 693–698, https://www.researchgate.net/profile/ (last access: 8 March 2022), 2000.
Kodikara, J. K., Barbour, S. L., and Fredlund, D. G.: Structure development in surficial heavy clay soils: A synthesis of mechanisms, Australian Geomechnics, 37, 25–40, 2002.
Koola, D., Agam, N., Lazarovitch, N., Heitman, J. L., Sauer, T. J., and Ben-Gal, A.: A review of approaches for evapotranspiration partitioning, Agr. Forest Meteorol., 184, 56–70, https://doi.org/10.1016/j.agrformet.2013.09.003, 2014.
Kurtzman, D., Baram, S., and Dahan, O.: Soil–aquifer phenomena affecting groundwater under vertisols: a review, Hydrol. Earth Syst. Sci., 20, 1–12, https://doi.org/10.5194/hess-20-1-2016, 2016.
Kustas, W. P. and Agam, N.: Soil Evaporation, Enc. Nat. Resour., https://doi.org/10.1081/E-ENRL-120049129, 2014.
Lai D. Y. F., Roulet, N. T., Humphreys, E. R., Moore, T. R., and Dalva, M.: The effect of atmospheric turbulence and chamber deployment period on autochamber CO2 and CH4 flux measurements in an ombrotrophic peatland, Biogeosciences, 9, 3305–3322, https://doi.org/10.5194/bg-9-3305-2012, 2012.
Lau, J. T. K.: Desiccation cracking of clay soils, MSc Thesis, Department of Civil Engineering, University of Saskatchewan, Canada, https://harvest.usask.ca/handle/10388/etd-03242010-112414 (last access: 8 March 2022), 1987.
Law, B. E., Baldocchi, D. D., and Anthoni, P. M.: Belowcanopy and soil CO2 fluxes in a ponderosa pine forest, Agr. Forest Meteorol., 94, 171–188, https://doi.org/10.1016/s0168-1923(99)00019-2, 1999.
Le Dantec, V., Epron, D., and Dufrênen, E.: Soil CO2 efflux in a beech forest: comparison of two closed dynamic systems, Plant Soil, 214, 125–132, 1999.
Leelamanie, D. A. L.: Changes in Soil Water Content with Ambient Relative Humidity in Relation to the Organic Matter and Clay, Trop. Agr. Res. Ext., 13, 6–10, https://doi.org/10.4038/tare.v13i1.3130, 2010.
Likos, W. J. and Lu, N.: Water vapor sorption behavior of smectite-kaolinite mixtures, Clays Clay Miner., 50, 553–561, https://doi.org/10.1346/000986002320679297, 2002.
Liu, C., Zhang, X., and Zhang, Y.: Determination of daily evaporation and evapotranspiration of winter wheat and maize by large-scale weighing lysimeter and micro-lysimeter, Agr. Forest Meteorol., 111, 109–120, https://doi.org/10.1016/S0168-1923(02)00015-1, 2002.
Longdoz, B., Yernaux, M., and Aubinet, M.: Soil CO2 efflux measurements in a mixed forest: impact of chamber disturbances, spatial variability and seasonal evolution, Glob. Change Biol., 6, 907–917, https://doi.org/10.1046/j.1365-2486.2000.00369.x, 2000.
Lytton, R. L., Boggess, R. L., and Spotts, J. W.: Characteristics of expansive clay roughness of pavements, Transport Research Record, TRB, Washington, D.C., 9–23, https://onlinepubs.trb.org/Onlinepubs/trr/1976/568/568-002.pdf (last access: 8 March 2022), 1976.
Maier, M., Aubinet, M., Longdoz, B., and Parent, F.: Turbulence Effect on Gas Transport in Three Contrasting Forest Soils, Soil Sci. Soc. Am. J., 75, 1518–1528, https://doi.org/10.2136/sssaj2011.0376, 2011.
Mohr, M., Laemmel, T., Maier, M., and Schindler, D.: Gas Concentrations within a Scots Pine Forest, Atmosphere, 7, 125, https://doi.org/10.3390/atmos7100125, 2016.
Mohr, M., Laemmel, T., Maier, M., and Schindler, D.: Spatial variability of wind-induced air pressure fluctuations responsible for pressure pumping, Tellus B, 69, 1361757, https://doi.org/10.1080/16000889.2017.1361757, 2017.
Morris, P. H., Graham, J., and Williams, D. J.: Cracking in drying soils, Can. Geotech. J., 29, 263–277, https://doi.org/10.1139/t92-030, 1992.
Myklebust, M. C., Hipps, L. E., and Ryel, R. J.: Comparison of eddy covariance, chamber, and gradient methods of measuring soil CO2 efflux in an annual semi-arid grass, Bromus tectorum, Agr. Forest Meteorol., 148, 1894–1907, https://doi.org/10.1016/j.agrformet.2008.06.016, 2008.
Nachshon U., Dragila, M., and Weisbrod, N.: From atmospheric winds to fracture ventilation: Cause and effect, J. Geophys. Res., 117, G02016, https://doi.org/10.1029/2011JG001898, 2012.
Nahlawi, H. and Kodikara, J. K.: Laboratory experiments on desiccation cracking of thin soil layers, Geotech. Geol. Eng., 24, 1641, https://doi.org/10.1007/s10706-005-4894-4, 2006.
Nakano T., Sawamoto, T., Morishita, T., Inoue, G., and Hatano, R.: A comparison of regression methods for estimating soil–atmosphere diffusion gas fluxes by a closed-chamber technique, Soil Biol. Biochem., 36, 107–113, https://doi.org/10.1016/j.soilbio.2003.07.005, 2004.
Norman, J. M., Kucharik, C. J., Gower, S. T., Baldocchi, D. D., Crill, P. M., Rayment, M., Savage, K., and Striegl, R. G.: A comparison of six methods for measuring soil-surface carbon dioxide fluxes, J. Geophys. Res., 102, 28771–28777, https://doi.org/10.1029/97JD01440, 1997.
Oki, T. and Kanae, S.: Global hydrological cycles and world water resources, Science, 313, 1068–1072, https://doi.org/10.1126/science.1128845, 2006.
Pal, D. K., Bhattacharyya, T., and Wani, S. P.: Formation and management of cracking clay soils (Vertisols) to enhance crop productivity: Indian Experience, World soil resources, edited by: Lal, R. and Stewart, B. A., Francis and Taylor, 317–343, https://www.researchgate.net/publication/ (last access: 8 March 2022), 2012.
Pavelka, M., Sedlák, P., Acosta, M., Czerný, R., Taufarová, K., and Janouš, D.: Chamber techniques versus eddy covariance method during nighttime measurements, International Scientific Conference, Slovakia, edited by: Střelcová, K., Škvarenina, J., and Blaženec, M., http://www.cbks.cz/SbornikPolana07/pdf/Pavelka_et_al.pdf (last access: 8 March 2022), 2007.
Pavelka, M., Acosta, M., Kiese, R., Altimir, N., Brümmer, C., Crill, P., Darenova, E., Fuß, R., Gielen, B., Graf, A., Klemedtsson, L., Lohila, A., Longdoz, B., Lindroth, A., Nilsson, M., Jiménez, S. M., Merbold, L., Montagnani, L., Peichl, M., Pihlatie, M., Pumpanen, J., Ortiz, P. S., Silvennoinen, H., Skiba, U., Vestin, P., Weslien, P., Janous, D., and Kutsch, W.: Standardisation of chamber technique for CO2, N2O and CH4 fluxes measurements from terrestrial ecosystems, Int. Agrophys., 32, 569–587, https://doi.org/10.1515/intag-2017-0045, 2018.
Péron, H., Laloui, L., Hueckel, T., and Hu, L.: Experimental study of desiccation of soil. UNSAT 2006, ASCE Geotechnical Special Publication, edited by: Miller et al., 147, 1073–1084, https://www.researchgate.net/publication/ (last access: 8 March 2022), 2006.
Philip, J. R.: Evaporation, and Moisture and Heat Fields in the Soil, J. Atmos. Sci., 14, 354–366, https://doi.org/10.1175/1520-0469(1957)014<0354:EAMAHF>2.0.CO;2, 1957.
Pilgrim, D. H., Chapman, T. G., and Doran, D. G.: Problems of rainfallrunoff modelling in arid and semiarid regions/Problèmes de la mise au point de modèles pluie-écoulement dans les 15 régions arides et semi-arides, Hydrol. Sci. J., 33, 379–400, 1988.
Poulsen, T. G., Pourber, A., Furman, A., and Papadikis, K.: Relating wind-induced gas exchange to near-surface wind speed characteristics in porous media, Vadose Zone J., 16, 1–13, https://doi.org/10.2136/vzj2017.02.0039, 2017.
Pourbakhtiar, A., Poulsen, T. G., Wilkinson S., and Bridge, J. W.: Effect of wind turbulence on gas transport in porous media: experimental method and preliminary results, Eur. J. Soil Sci., 68, 48–56, https://doi.org/10.1111/ejss.12403, 2017.
Riou, C.: Evaporation du sol nu et répartition des pluies – Relations établies en Tunisie à partir des résultats des cases lysimétriques, Annales de l'INRAT, Vol. 50, Fasc.4, INRAT, Tunisie, 24, Also published in Cahiers de l'ORSTOM, Sér. Hydrol., Vol. 50, Fasc.4, INRAT, Tunisie, 24, Also published in Cahiers de l'ORSTOM, Sér. Hydrol., 14, 285–295, https://horizon.documentation.ird.fr/ (last access: 8 March 2022), 1977.
Risk, D., Nickerson, N., Creelman, C., McArthur, G., and Owens, J.: Forced Diffusion soil flux: A new technique for continuous monitoring of soil gas efflux, Agr. Forest Meteorol., 151, 1622–1631, https://doi.org/10.1016/j.agrformet.2011.06.020, 2001.
Rochette, P. and Hutchinson, G. L.: Measurement of Soil Respiration in situ: Chamber Techniques, Publications from USDA-ARS/UNL Faculty, 1379, Micrometeorology in Agricultural Systems (2005) Agronomy Monograph, 47, 247–286, https://digitalcommons.unl.edu/usdaarsfacpub/1379 (last access: 8 March 2022), 2005.
Rochette, P., Ellert, B., Gregorich, E. G., Desjardins, R. L., Pattey, E., Lessard, R., and Johnson, B. G.: Description of a dynamic closed chamber for measuring soil respiration and its comparison with other techniques, Can. J. Soil. Sci., 77, 195–203, 1997.
Rodríguez, R., Sánchez, M., Ledesma, A., and Lloret, A.: Experimental and numerical analysis of desiccation of a mining waste, Can. Geotech. J., 44, 644–658, https://doi.org/10.1139/T07-016, 2007.
Roland, M., Vicca, S., Bahn, M., Ladreiter-Knauss, T., Schmitt, M., and Janssens, I. A.: Importance of nondiffusive transport for soil CO2 efflux in a temperate mountain grassland, J. Geophys. Res.-Biogeo., 120, 502–512, https://doi.org/10.1002/2014JG002788, 2015.
Sánchez-Cañete, E. P., Oyonarte, C., Serrano-Ortiz, P., Curiel Yuste, J., Pérez-Priego, O., Domingo, F., and Kowalski A. S.: Winds induce CO2 exchange with the atmosphere and vadose zone transport in a karstic ecosystem, J. Geophys. Res.-Biogeo., 121, 2049–2063, https://doi.org/10.1002/2016JG003500, 2016.
Satyanaga, A., Rahardjo, H., Leong, E.-C., and Wang, J.-Y.: Water characteristic curve of soil with bimodal grain-size distribution, Comput. Geotech., 48, 51–61, https://doi.org/10.1016/j.compgeo.2012.09.008, 2013.
Sauer T. J., Ochsner, T. E., and Horton, R.: Soil heat flux plates: Heat flow distortion and thermal contact resistance, Agron. J., 99, 304–310, doi.org:10.2134/agronj2005.0038s, 2007.
Schmidt, G. A., Ruedy, R. A., Miller, R. L., and Lacis, A. A.: Attribution of the present-day total greenhouse effect, J. Geophys. Res., 15, D20106, https://doi.org/10.1029/2010JD014287, 2010.
Schneider J., Kutzbach, L., Schulz, S., and Wilmking, M.: Overestimation of CO2 respiration fluxes by the closed chamber method in low-turbulence nighttime conditions, J. Geophys. Res., 114, G03005, https://doi.org/10.1029/2008JG000909, 2009.
Schrier-Uijl, A. P., Kroon, P. S., Hensen, A., Leffelaar, P. A., Berendse, F., and Veenendaal, E. M.: Comparison of chamber and eddy covariance-based CO2 and CH4 emission estimates in a heterogeneous grass ecosystem on peat, Agr. Forest Meteorol., 150, 825–831, https://doi.org/10.1016/j.agrformet.2009.11.007, 2010.
Scotter, D. R. and Raats, P. A. C.: Dispersion of water vapor in soil due to air turbulence, Soil Sci., 108, 170–176, 1968.
Smits, K., Eagen, V., and Trautz, A.: Exploring the Effects of Atmospheric Forcings on Evaporation: Experimental Integration of the Atmospheric Boundary Layer and Shallow Subsurface, J. Vis. Exp., 100, e52704, https://doi.org/10.3791/52704, 2015.
Song, W. K., Cui, Y. J., Tang, A. M., Ding, W. Q., and Wang, Q.: Experimental study on water evaporation from compacted clay using environmental chamber, Can. Geotech. J., 53, 1293–1304, https://doi.org/10.1139/cgj-2015-0415, 2016.
Stirling, R. A., Glendinning, S., and Davie, C. T.: Modelling the deterioration of the near surface caused by drying induced cracking, Appl. Clay Sci., 146, 176–185, https://doi.org/10.1016/j.clay.2017.06.003, 2017.
Suleau, M., Debacq, A., Dehaes, V., and Aubinet, M.: Wind velocity perturbation of soil respiration measurements using closed dynamic chambers, Eur. J. Soil Sci., 60, 515–524, https://doi.org/10.1111/j.1365-2389.2009.01141.x, 2009.
Suleman, K. F. and Shahid, A.: Determination of the desiccation behavior of clay slurries, Int. J. Min. Sci. Technol., 27, 981–988, https://doi.org/10.1016/j.ijmst.2017.06.010, 2017.
Takle, E. S., Massman, W. J., Brandle, J. R., Schmidt, R. A., Zhou, X., Litvina, I. V., Garcia, R., Doyle, G., and Rice, C. W.: Influence of high-frequency ambient pressure pumping on carbon dioxide efflux from soil, Agr. Forest Meteorol., 124, 193–206, https://doi.org/10.1016/j.agrformet.2004.01.014, 2004.
Tang, C. S., Shi, B., Liu, C., Zhao, L., and Wang, B.: Influencing factors of geometrical structure of surface shrinkage cracks in clayey soils, Eng. Geol., 101, 204–217, https://doi.org/10.1016/j.enggeo.2008.05.005, 2008.
Tang, C. S., Cui, Y. J., Tang, A. M., and Shi, B.: Experiment evidence on the temperature dependence of desiccation cracking behavior of clayey soils, Eng. Geol., 114, 261–266, https://doi.org/10.1016/j.enggeo.2010.05.003, 2010.
Thornthwaite, C. W. and Holzman, B.: Measurement of Evaporation from Land and Water Surfaces, U.S. Dept. Agr. Tech. Bull., 817, 1–143, 1942.
Trenberth, K. E., Fasullo, J., and Kiehl, J.: Earth's global energy budget, Bull. Am. Meteorol. Soc., 90, 311–323, https://doi.org/10.1175/2008BAMS2634.1, 2009.
Wagner, W. and Pruß, A.: The IAPWS Formulation 1995 for the Thermodynamic Properties of Ordinary Water Substance for General and Scientific Use, J. Phys. Chem. Ref. Data, 31, 387535, https://doi.org/10.1063/1.1461829, 2002.
Wang, X.: Vapor Flow Resistance of Dry Soil Layer to Soil Water Evaporation in Arid Environment: An Overview, Water, 7, 4552–4574 https://doi.org/10.3390/w7084552, 2015.
Wilcox, B., Seyfried, M., and Breshears, D.: The water balance on rangelands, Encyclopedia of water science, edited by: Dekker, M., New York, ISBN 0824709489, ISBN 9780824709488, ISBN 0824709470, ISBN 9780824709471, ISBN 0824742419, ISBN 9780824742416, 791–794, 2003.
Wilson, G. W., Fredlund, D. G., and Barbour, S. L.: Coupled soil-atmosphere modelling for soil evaporation, Can. Geotech. J., 31, 151–161, https://doi.org/10.1139/t94-021, 1994.
Wilson: G. W., Fredlund, D. G., and Barbour, S. L.: The effect of soil suction on evaporative fluxes from soil surfaces, Can. Geotech. J., 34, 145–155, https://doi.org/10.1139/cgj-34-1-145, 1997.
Xu, L., Furtaw, M. D., Madsen, R. A., Garcia, R. L, Anderson, D. J., and McDermitt, D. K.: On maintaining pressure equilibrium between a soil CO2 flux chamber and the ambient air, J. Geophys. Res., 111, D08S10, https://doi.org/10.1029/2005JD006435, 2006.
Zha, T., Niinisto, S., Xing, Z., Wang, K. Y., Kellomäki, S., and Bar,r A. G.: Total and component carbon fluxes of a Scots pine ecosystem from chamber measurements and eddy covariance, Ann Bot., 99, 45–53, https://doi.org/10.1093/aob/mcl266, 2007.
- Abstract
- Introduction
- Wind influence considerations
- Materials and methods
- Results and discussion
- Conclusions
- Appendix A: Laboratory-measured soil evaporation RE
- Appendix B: Slow sensor simulation
- Appendix C: Frequently used acronyms and units if applicable
- Code and data availability
- Competing interests
- Disclaimer
- Acknowledgements
- Financial support
- Review statement
- References