the Creative Commons Attribution 4.0 License.
the Creative Commons Attribution 4.0 License.
 | 27 Jan 2022
Measuring electrical properties of the lower troposphere using enhanced meteorological radiosondes
R. Giles Harrison
In atmospheric science, measurements above the surface have long been obtained by carrying instrument packages, radiosondes, aloft using balloons. Whilst occasionally used for research, most radiosondes – around 1000 are released daily – only generate data for routine weather forecasting. If meteorological radiosondes are modified to carry additional sensors, of either mass-produced commercial heritage or designed for a specific scientific application, a wide range of new measurements becomes possible. A programme to develop add-on devices for standard radiosondes, which retains the core meteorological use, is described here. Combining diverse sensors on a single radiosonde helps interpretation of findings and yields economy of equipment, consumables and effort. A self-configuring system has been developed to allow different sensors to be easily combined, enhancing existing weather balloons and providing an emergency monitoring capability for airborne hazards. This research programme was originally pursued to investigate electrical properties of extensive layer clouds and has expanded to include a wide range of balloon-carried sensors for solar radiation, cloud, turbulence, volcanic ash, radioactivity and space weather. For the cloud charge application, multiple soundings in both hemispheres have established that charging at the boundaries of extensive layer clouds is widespread and likely to be a global phenomenon. This paper summarises the Christiaan Huygens medal lecture given at the 2021 European Geosciences Union meeting.
- Article
(17805 KB) - Full-text XML
- BibTeX
- EndNote


This paper is based on material presented in my Christiaan Huygens medal lecture at the 2021 meeting of the European Geosciences Union. The original lecture was called “Perspicacity… and a degree of good fortune: opportunities for exploring the natural word”. This title was inspired by Christiaan Huygens' own words reflecting on scientific progress in 1687:
…difficulties… cannot be overcome except by starting from experiments… much hard work remains to be done and one needs not only great perspicacity but often a degree of good fortune. (Huygens, 1687)
Huygen's contention that both luck and insight are a critical combination in scientific progress was far-sighted. It feels especially relevant to experimental atmospheric science, in which the circumstances are entirely beyond the control of the experimenter. This paper describes some attempts to confront this and other challenges in exploring electrical properties of the lower atmosphere, with a particular focus on measuring the electric charge associated with extensive layer clouds. Unlike thunderclouds, which can separate substantial charges, the charge on layer clouds (e.g. stratus or stratocumulus clouds) is very weak, and hence the signals to be investigated are small. Layer clouds are, however, relatively abundant, and play a role in the electrical balance within the Earth's atmosphere (Harrison et al., 2020) as well as in the energy balance of the climate system. To investigate them, sensors, instruments, platforms and the interpretation of indirect or related measurements are all required.
Progress in making related instruments and measurements is described here, with co-workers at the University of Reading. This programme has applied modern electronic methods to one of the oldest experimental topics in atmospheric science. New measurements aloft have been obtained by enhancing standard meteorological balloon systems and, more recently, by instrumenting uncrewed aircraft. This paper describes the principles of the measurement technology (Sect. 2) and the application to extensive layer clouds (Sect. 3), and reviews the applications beyond atmospheric electricity, to radioactivity, space weather, turbulence, dust electrification and optical cloud detection (Sect. 4). The overall findings concerning layer clouds are summarised in Sect. 5, with general conclusions on the value of the enhanced radiosonde strategy given in Sect. 6. Initially, to provide context and motivation with which to close this introductory section, early historical developments in atmospheric electricity and electrostatics are briefly described, followed by outlining the scientific questions around the possible relationship between space weather, ionisation and clouds.
1.1 Early atmospheric electrostatics
A convenient starting point is the defining year in atmospheric electricity, 1752, which is associated with Benjamin Franklin's famous kite experiment. Some exact details remain debated, but it provoked wider investigations of cloud electricity (Berger and Ait Amar, 2009). Less well known, however, are the findings about the electricity of fair weather and non-thunderstorm clouds, which emerged around the same time. For example, by 1753, the pioneer investigator John Canton1 had observed that
The air without-doors I have sometimes known to be electrical in clear weather. (Canton, 1753).
For this, Canton had devised his own detection device for experiments, an electroscope (Fig. 1), which operated by repulsion or attraction between charges induced on lightweight pieces of orange pith. With this apparatus, Canton determined the charge and polarity of clouds overhead, by comparing reference electrical effects generated from amber and sealing wax.
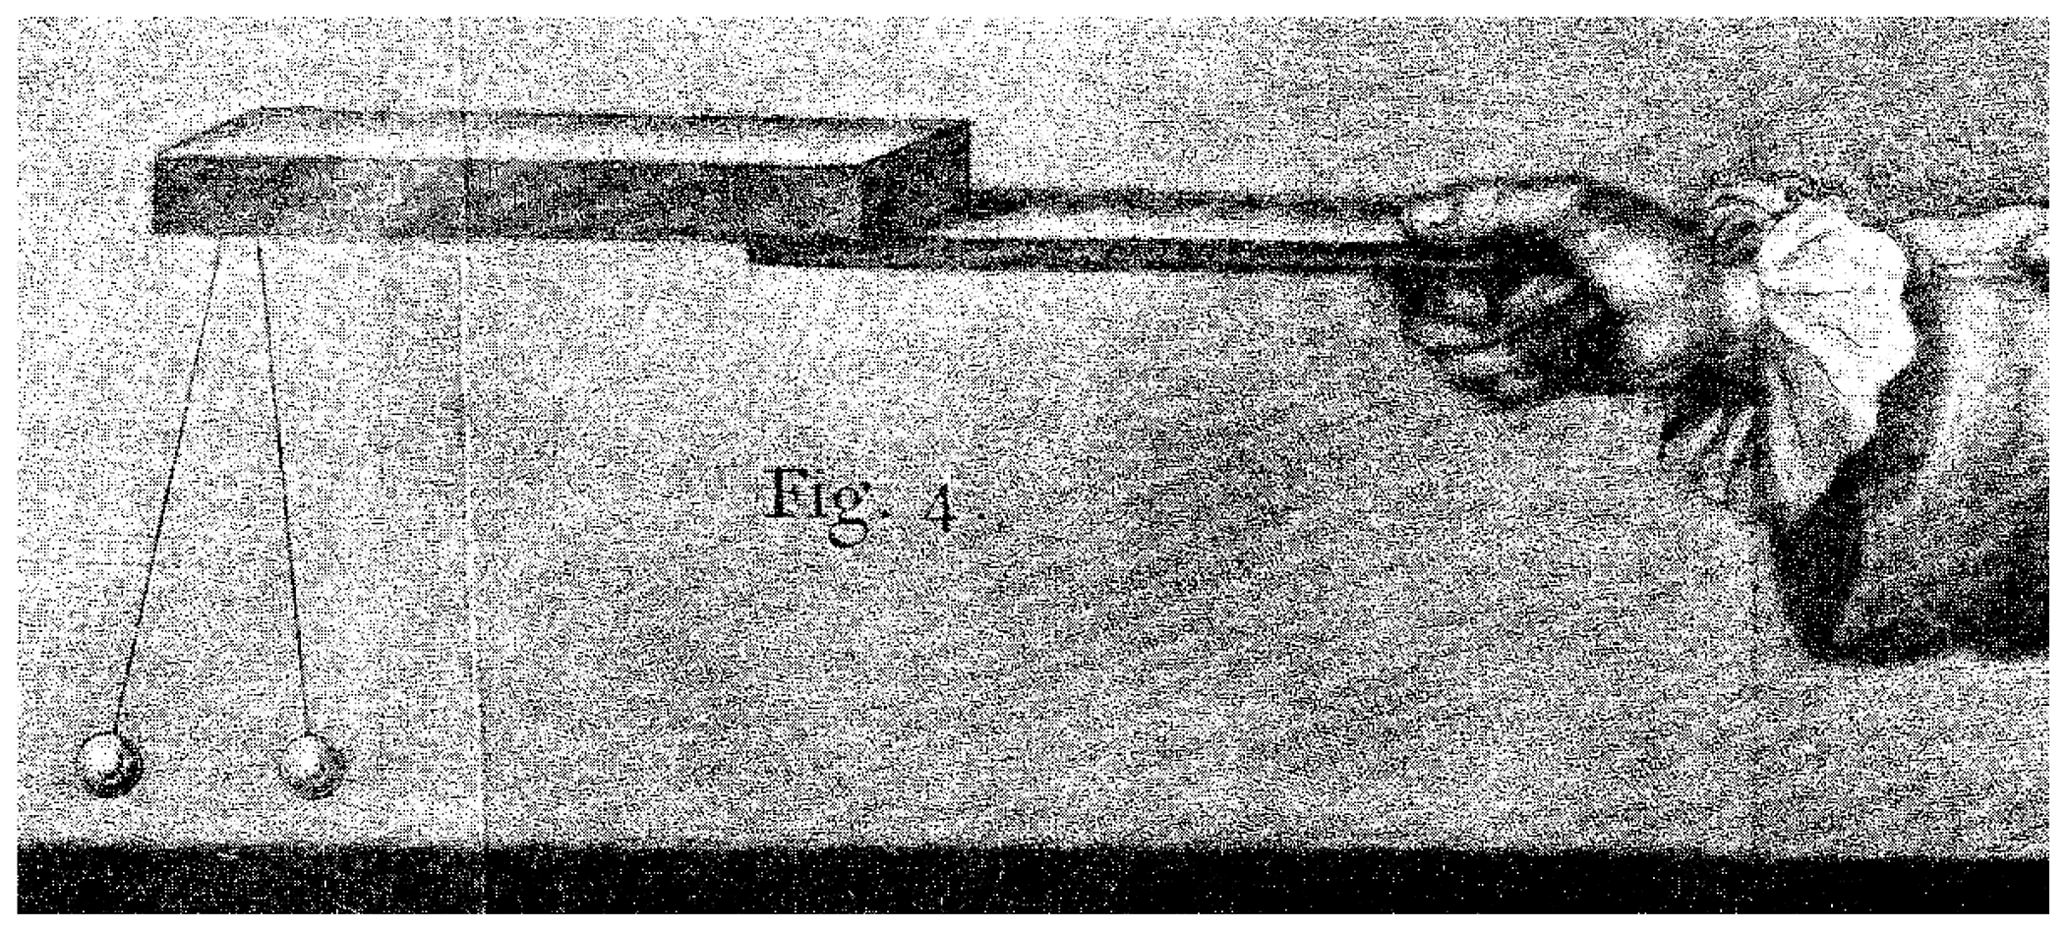
Figure 1The pith ball electrometer described by John Canton in 1753 to detect electrical changes (from Canton, 1753).
Since Canton's time, the major topics of research in atmospheric electricity have been the study of lightning as a natural hazard and the quest to understand the fundamental origin of the electric field observed in fair weather2, now understood to be due to continuous distribution of charge by the global atmospheric electric circuit. In this, thunderclouds have received the main attention. Other cloud types have nevertheless been suggested to be electrically influenced, for example, in the treatise by Luke Howard (Howard, 1843), whose cloud classification system is still in widespread use. It is therefore not surprising that the pioneering 19th century balloonists James Glaisher and Henry Coxwell3 carried an electrometer on their flights, with the electrical and meteorological measurements ultimately published together (Glaisher, 1862). Studying the physical behaviour of individual charged droplets also has a long history. For example, Lord Kelvin (William Thomson) calculated the electrical forces between droplets which are charged and free to polarise (Thomson, 1853), and Lord Rayleigh (John Strutt) observed that charged droplets were more inclined to coalesce than neutral droplets (Strutt, 1879).
1.2 Weather and ionisation
A key scientific motivation in clouds and atmospheric electricity is establishing whether the electrical interactions which constantly occur between ions, aerosols and drops can yield material effects in the atmosphere, and, especially, within clouds. This question presented itself during my PhD work on the charging of radioactive aerosols4, provoked by the radioactive aerosols observed following the Chernobyl disaster and transported across Europe in weather systems. Theory showed that such aerosols would become charged through the emission of decay particles and the collection of ions (Clement and Harrison, 1992)5. Investigating other effects of radioactivity on weather, from releases of radioactive gas during nuclear reprocessing, raised further questions about electric charge effects (e.g. Harrison and ApSimon, 1994). Both topics illustrated the need for more experimental and theoretical research on electrical aspects of non-thunderstorm clouds.
Increased attention on the relationship between ionisation, aerosols, charge and droplet behaviour followed from the correlation published between global satellite retrievals of cloud and galactic cosmic ray (GCR) variations (Svensmark and Friis-Christensen, 1997). This opened a vigorous discussion on whether cosmic rays could directly influence clouds and climate. Although the detailed technical aspects fell between the conventional boundaries of atmospheric science, aerosol science and high-energy physics, this did not prevent confident opinions being expressed. A possible series of processes linking GCR variability into weather phenomena through enhancement of droplet freezing by charged aerosols had in fact previously been suggested by Brian Tinsley (Tinsley and Deen, 1991), building on the considerable solar cycle modulation of lower atmosphere ionisation which had been recognised by Ney (1959) and Dickinson (1975). However, these papers – and indeed our own (Carslaw, Harrison and Kirkby, 2002, hereafter CHK02, and Harrison and Carslaw, 2003) – also highlighted the limited knowledge of charge in non-thunderstorm atmospheric processes. CHK02 identified two physical routes linking high-energy ionisation and clouds for further investigation, the “ion–aerosol clear-air” mechanism, leading to the formation of new cloud condensation nuclei (CCN), and the “ion–aerosol near-cloud” mechanism, leading to enhanced droplet charges. The strongest correlation with GCR was later identified to be with low level liquid water cloud (e.g. Marsh and Svensmark, 2000). Building on this, a proposal was made to the CERN laboratory to begin an entirely new seam of experimental work (Fastrup et al., 2000) – the “Cosmics Leaving OUtdoor Droplets” or CLOUD experiment. This international proposal was exciting to contribute to initially, although the final facility did not begin operation until 2009. CLOUD has since explored ion-induced aerosol nucleation in impressive detail, by firing a controlled energetic proton beam into an exquisitely instrumented experimental chamber.
An important outcome of the CLOUD experiment is the conclusion that variations in CCN from GCR, ie the CHK02 “ion–aerosol clear-air” mechanism, are too weak to influence clouds and climate (Pierce, 2017). In comparison, CHK02's “ion–aerosol near-cloud” mechanism has received far less attention, perhaps because the atmospheric situation is much less able to be represented by laboratory investigations. Such gaps in understanding of the detailed behaviour of clouds6 are undesirable because the associated potential contributions to climate remain unquantified. This allows extravagant claims to be made where caution is more appropriate (e.g. Harrison et al., 2007). As some of the atmospheric electricity equipment originally developed for surface use seemed highly suitable for filling the gap in providing the relevant in situ measurements required, this encouraged me, quite possibly too enthusiastically, to propose undertaking my own “…experiments with weather balloons” (Pearce, 1998).
Much of the instrumentation, techniques, measurements and analysis described here follow from pursuing this apparently well-defined, but technically surprisingly difficult, scientific goal.
Measurements of cloud and droplet charge require appropriate sensors combined with registering or recording devices. In general, whilst electroscopes simply indicate the presence of charge, electrometers are measuring instruments capable of registering exceptionally small charges and currents, or able to provide voltage measurements whilst drawing negligible current and therefore with minimal loading of the source. Measurements based on either mechanical or electronic principles are possible.
2.1 Mechanical
Mechanical detectors, such as the pith ball electroscope of Canton or indicating devices which used straw or gold leaf, combined the sensing and registering aspects, providing a visible response to the electric force. Probably the earliest identifiable example of an instrument employing this principle is the versorium of William Gilbert,
…make yourself a rotating needle electroscope, of any sort of metal, three or four fingers long, pretty light and poised on a sharp point of a magnetic pointer. (Gilbert, 1600).
A later example of the electric force approach was the delicate torsion electrometer developed by Lord Kelvin, also likely to be the device loaned to James Glaisher. To this electrometer, Kelvin added a sensor able to obtain the air's local electric potential, through charge transfer of water drops falling from an insulated tank. By projecting the electrometer's deflection onto photographic paper, the “water dropper” and electrometer combination made continuous recording of the atmospheric electric field possible (Aplin and Harrison, 2013)7.
Mechanical deflection technologies remain useful and were used in the 20th century for atmospheric electricity measurements (e.g. Wilson, 1908) and in the discovery of cosmic rays (Hess, 1912). Deflection also provided an experimental method to determine droplet charge on the Millikan principle, by photographing the motion of falling drops in an electric field (Twomey, 1956; Allee and Phillips, 1959).
2.2 Electronic
Mass-produced sensors are now typically integrated within chips providing amplification and a standard digital interface, but for low-volume science research sensors, implementing customised analogue signal conditioning circuitry is still necessary. This is especially the case in electrometry, where the packaging of the parts is a critical aspect because of the leakage currents which can arise. Early electronic methods depended on thermionic valves, in general making the electrometer part of current flow in a circuit or across which a voltage is developed.
Electrometers are now readily constructed using modern semiconductors, in particular operational amplifiers (or “op amps”) which, from their origins in performing mathematical operations, provide a very large multiplication of the voltage difference between two input terminals. If the op amp is selected to have an especially small input bias current (∼ 1 fA) – and such devices are often specifically marketed as electrometer op amps – very small currents of only thousands of electronic charges per second or even less become measurable. With a particularly simple circuit configuration, an op amp can be used to measure the voltage developed across an ultra-high source resistance, such as air in fair weather. Typical electrometer op amps generally only have a relatively small dynamic range, but circuit configurations can considerably extend this (e.g. Harrison, 1996).
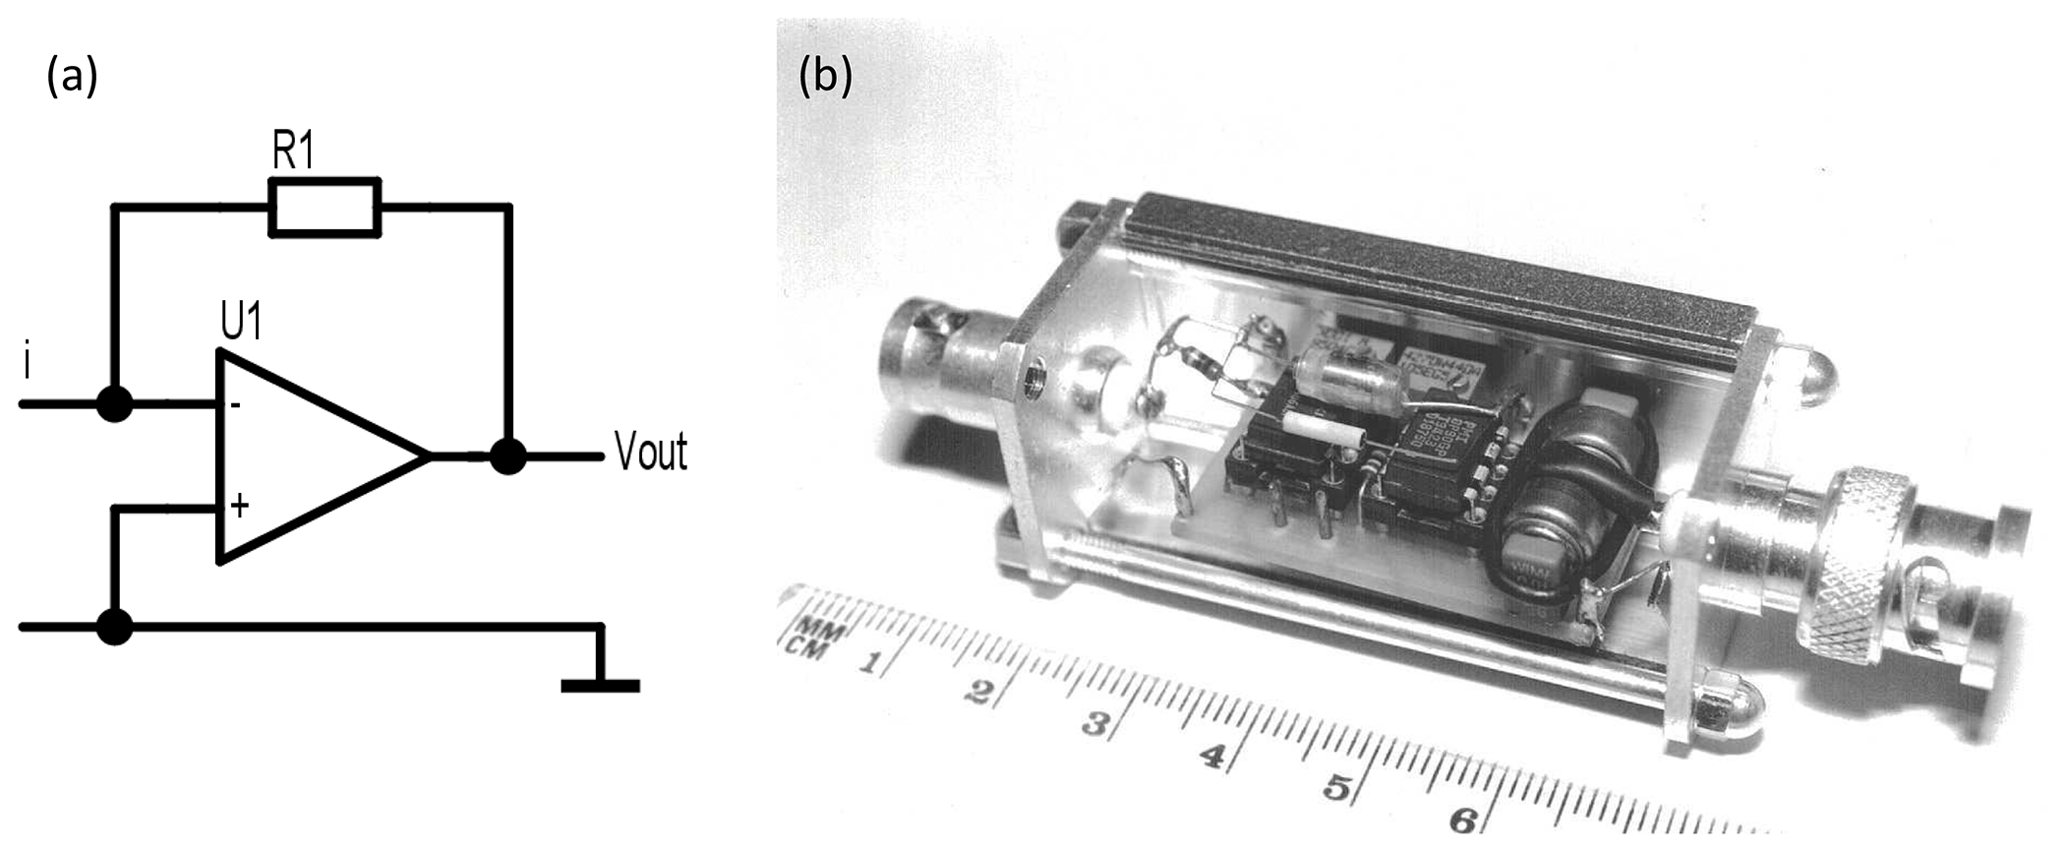
Figure 2Current measurements. (a) Principle of a current-to-voltage converter based on an operational amplifier (U1) and a resistor (R1). (b) Implementation of a battery-powered current-to-voltage converter, built within a small in-line case, with the input current (∼ pA) presented on the left connector and the voltage output (∼ mV) on the right. (The tubular air-wired component in front of the polystyrene capacitor is a high-value resistor; from Harrison, 1995a.)
An op amp can be used to convert a current to a voltage, by adding a single feedback resistor in a “transresistance” circuit (Fig. 2a). The advantage of this configuration over just measuring the voltage across the resistor is that the circuit's input is always at the same potential, essentially the circuit ground, which ensures the loading of the current source remains constant whatever current is flowing. A practical difficulty with such circuits is in maintaining scrupulous insulation, to prevent errors from leakage currents swamping the measurement current. It can also be troublesome to obtain and calibrate suitably large value resistors8; e.g. a 1012 Ω feedback resistor is needed to convert 10−12 A (i.e. 1 pA) to 1 V. Figure 2b shows the physical implementation of a current-to-voltage converter using through-hole technology electronic parts. This device was powered by internal button cells and constructed entirely within a screened box. The input current connection was air-wired (i.e. positioned above the circuit board) to minimise leakage. A second op amp allowed the gain to be adjusted to compensate for inaccuracies in the 109 Ω feedback resistor, using a ratiometric matching method implemented with readily obtained smaller value precision resistors (Harrison, 1995a).
Further refinements to these basic measurement themes have been needed, e.g. to extend electrometer voltmeter measurements from about 10 V into the range 100 V to 10 kV (Harrison, 1995b, 1997, 2002), to reject 50 Hz interference (Harrison, 1997), to permit computer control of switching between current and voltage (Harrison and Aplin, 2000a) and to implement a logarithmic response across a wide range of currents (Marlton et al., 2013). Methods of calibration are also an important aspect, such as by bridge ratio methods for resistances (Harrison, 1997), or differentiating a steadily changing voltage to generate a defined small current (Harrison and Aplin, 2000b).
2.3 Examples of surface instruments
The importance of these electronic approaches is that they provide inexpensive routes to measure weak signal sources in environmental conditions without the need to put laboratory-grade equipment at risk. They can be used directly for science applications in atmospheric electricity, and are sufficiently simple and compact (e.g. Fig. 2b) to be mounted physically within instruments or indeed even considered disposable. Figure 3 shows examples of surface instruments employing these techniques, mostly constructed in Reading. The Geometrical Displacement and Conduction Current Sensor (GDACCS) (Fig. 3a) uses a combination of flat and shaped electrodes to monitor the vertical current density flowing in the global circuit, which is typically ∼ 2 pA m−2 (Bennett and Harrison, 2008). Figure 3b shows a Programmable Ion Mobility Spectrometer (PIMS), which determines positive and negative air ion properties by deflection with an electric field to cause ion flow to a collecting electrode (Aplin and Harrison, 2001).
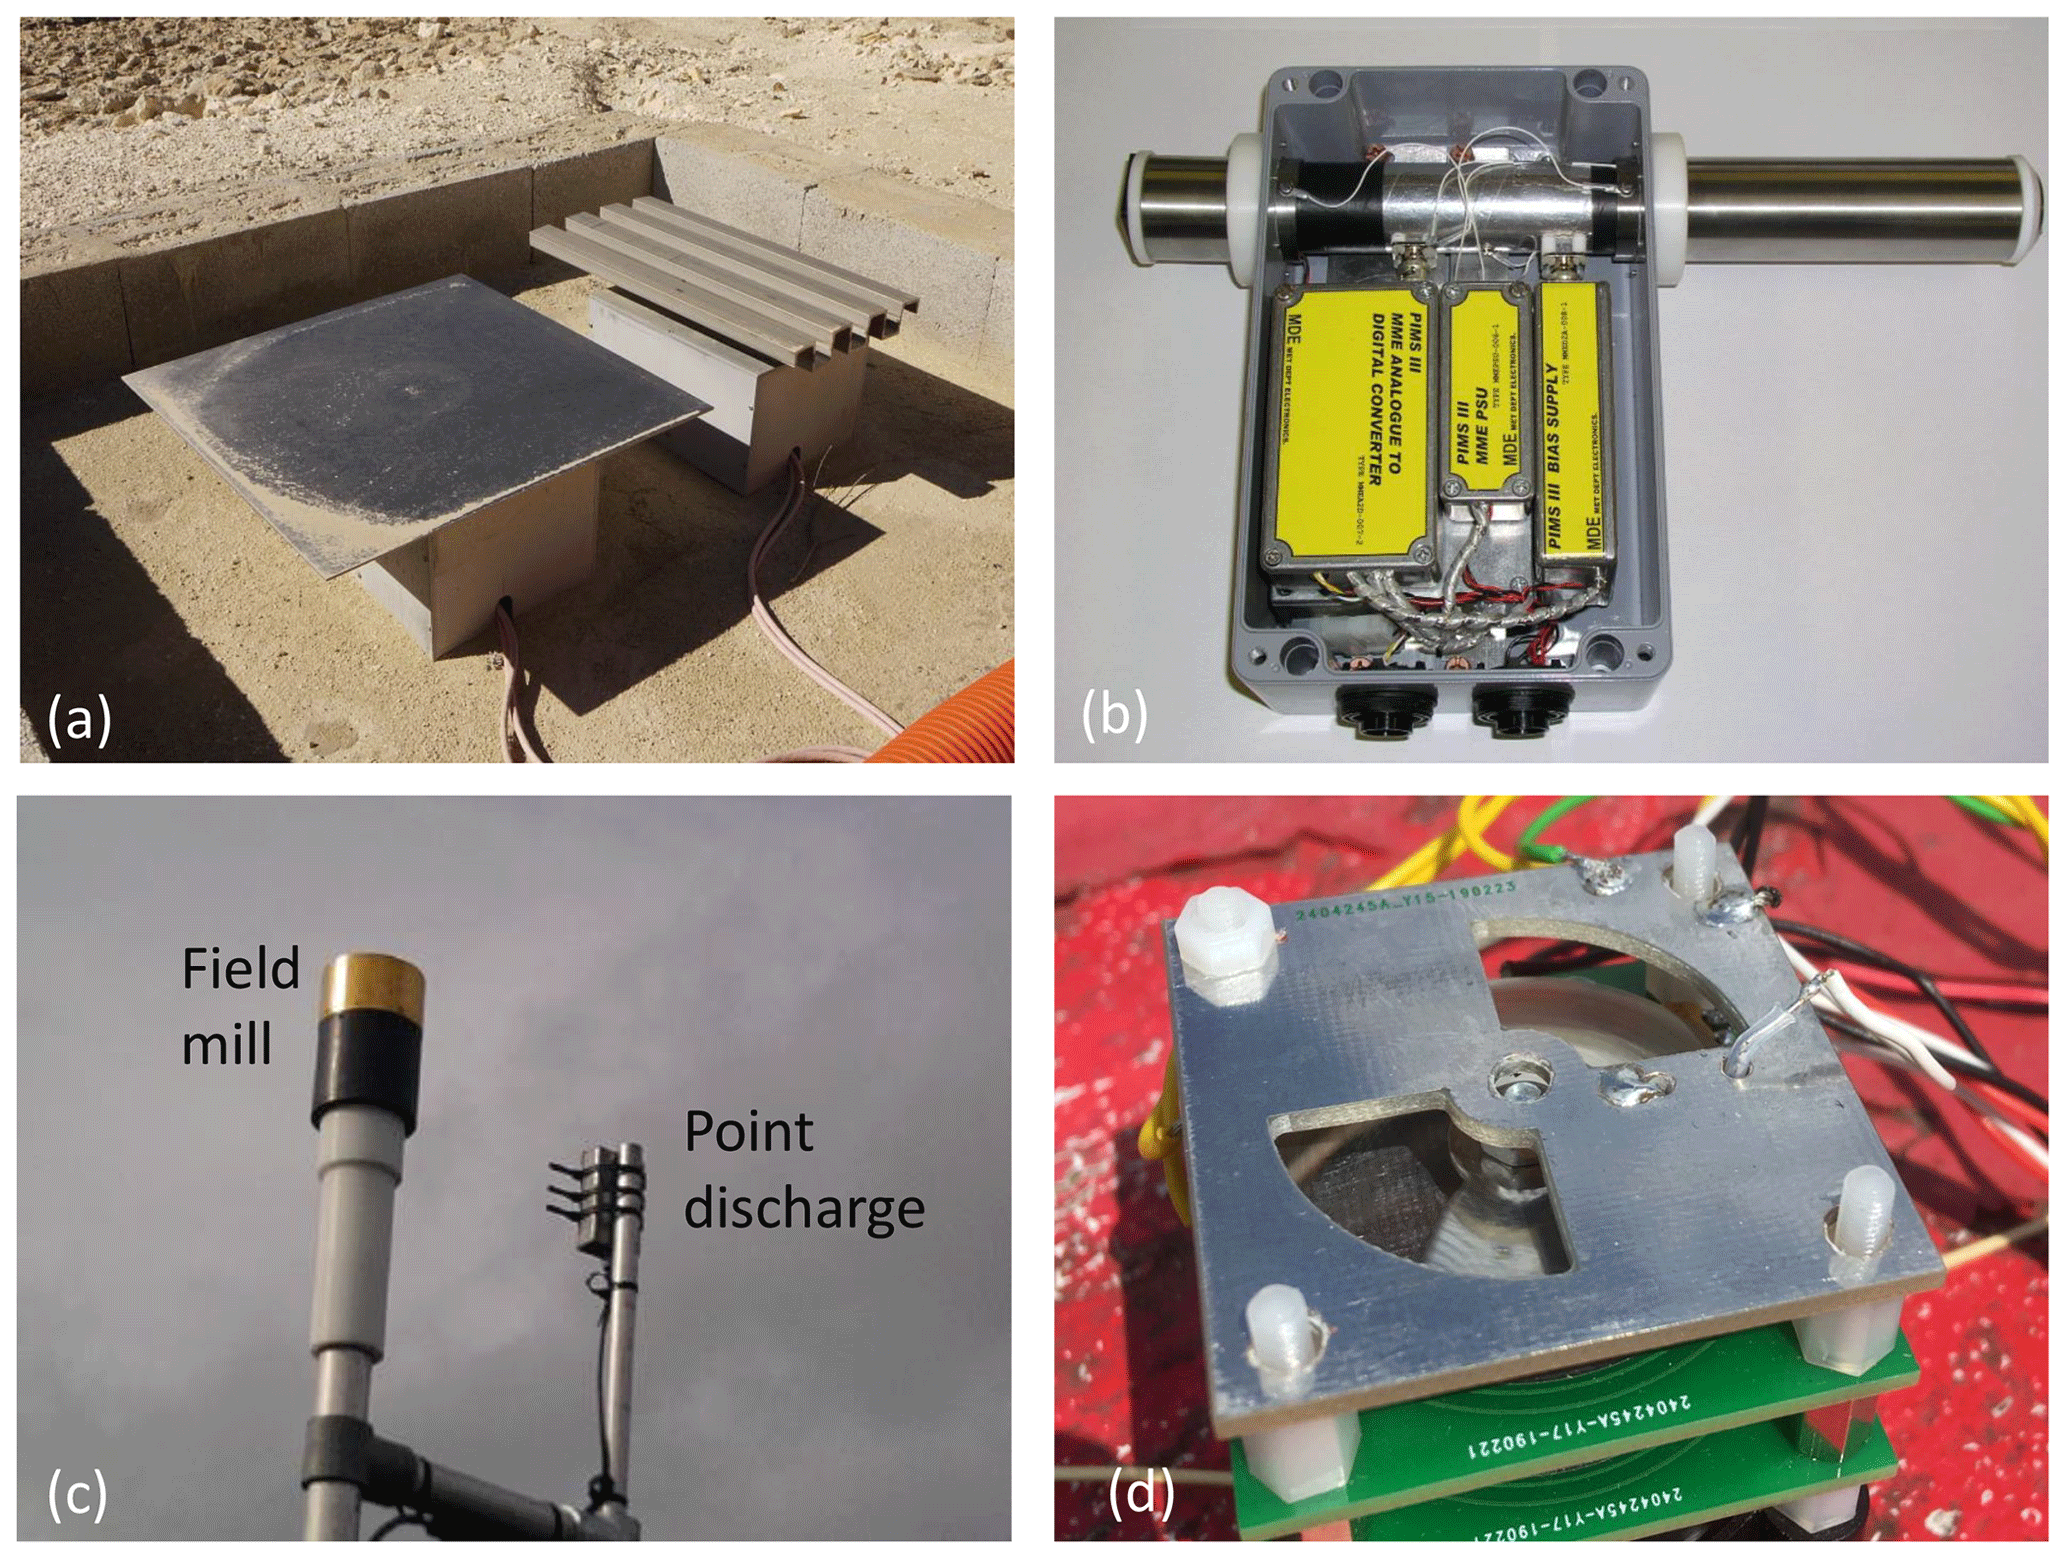
Figure 3A selection of atmospheric electricity instruments. (a) Vertical current density sensor (GDACCS), using plate and corrugated electrodes, in the Negev desert. (b) Programmable Ion Mobility Spectrometer (PIMS) to determine electrical properties of air. (c) Electric field mill with sensing surfaces uppermost, and upward-pointing point discharge needle (not visible) with logarithmic current amplifier. (d) Miniature field mill with internal calibration electrodes.
An electrometer voltmeter can measure an electric field by determining the corresponding charge induced in an exposed electrode of known geometry. This offers the possibility of non-contact voltage measurement. A voltmeter operating in this way was first described by Harnwell and Van Voorhis (1933), using a motor to alternately expose and screen the electrode by rotating an earthed shutter. Devices made on this “field mill” differencing principle have been found especially suitable for atmospheric electric field measurements (Lueder, 1943; Mapleson and Whitlock, 1955). Through improvements which removed the brushes earthing the rotating shutter (and therefore reduced the associated wear), field mills have become able to operate continuously in disturbed weather conditions (Chubb, 1990, 1999). Figure 3c shows an upward-pointing commercial field mill of durable design, the JCI131, at the Reading University Atmospheric Observatory. It is mounted alongside a point discharge tip (a fine steel needle) connected to a logarithmic electrometer which can measure across the wide range of currents encountered in disturbed weather (Marlton et al., 2013). Figure 3d shows a small field mill operating on the brushless principle, developed for balloon use, which can also generate reference electric fields internally for calibration (Harrison and Marlton, 2020).
The explanation for the positive electric potential consistently observed near the surface in fair weather is found through the global atmospheric electric circuit, originally postulated by Charles Thomas Rees – but always known as “CTR” – Wilson (1921, 1929). The global circuit allows currents to flow from generating regions (driven by thunderstorms, shower clouds and vertical charge exchange), to fair weather regions, through which the current passes to complete the circuit. The conduction from generator regions occurs through the more strongly ionised parts of the atmosphere, and through the Earth's surface, which, compared with the atmosphere, is a relatively good conductor. As indicated above, the concept of the fair weather branch of the circuit is well established.
Figure 4 summarises current flow in the global circuit and illustrates the situation which can readily arise when the fair weather current flowing encounters an electrically quiescent layer cloud. The cloud will present a more resistive region than the clear air surrounding it; hence, the cloud to clear air interface can be understood to provide a transition in electrical resistance. If the layer cloud is extensive horizontally, the current must pass through it. As it does so, local space charge is generated at the cloud–clear air boundary, yielding positive charge at the cloud top and negative charge at cloud base. These circumstances are conveniently referred to as semi-fair weather conditions (Harrison et al., 2020).
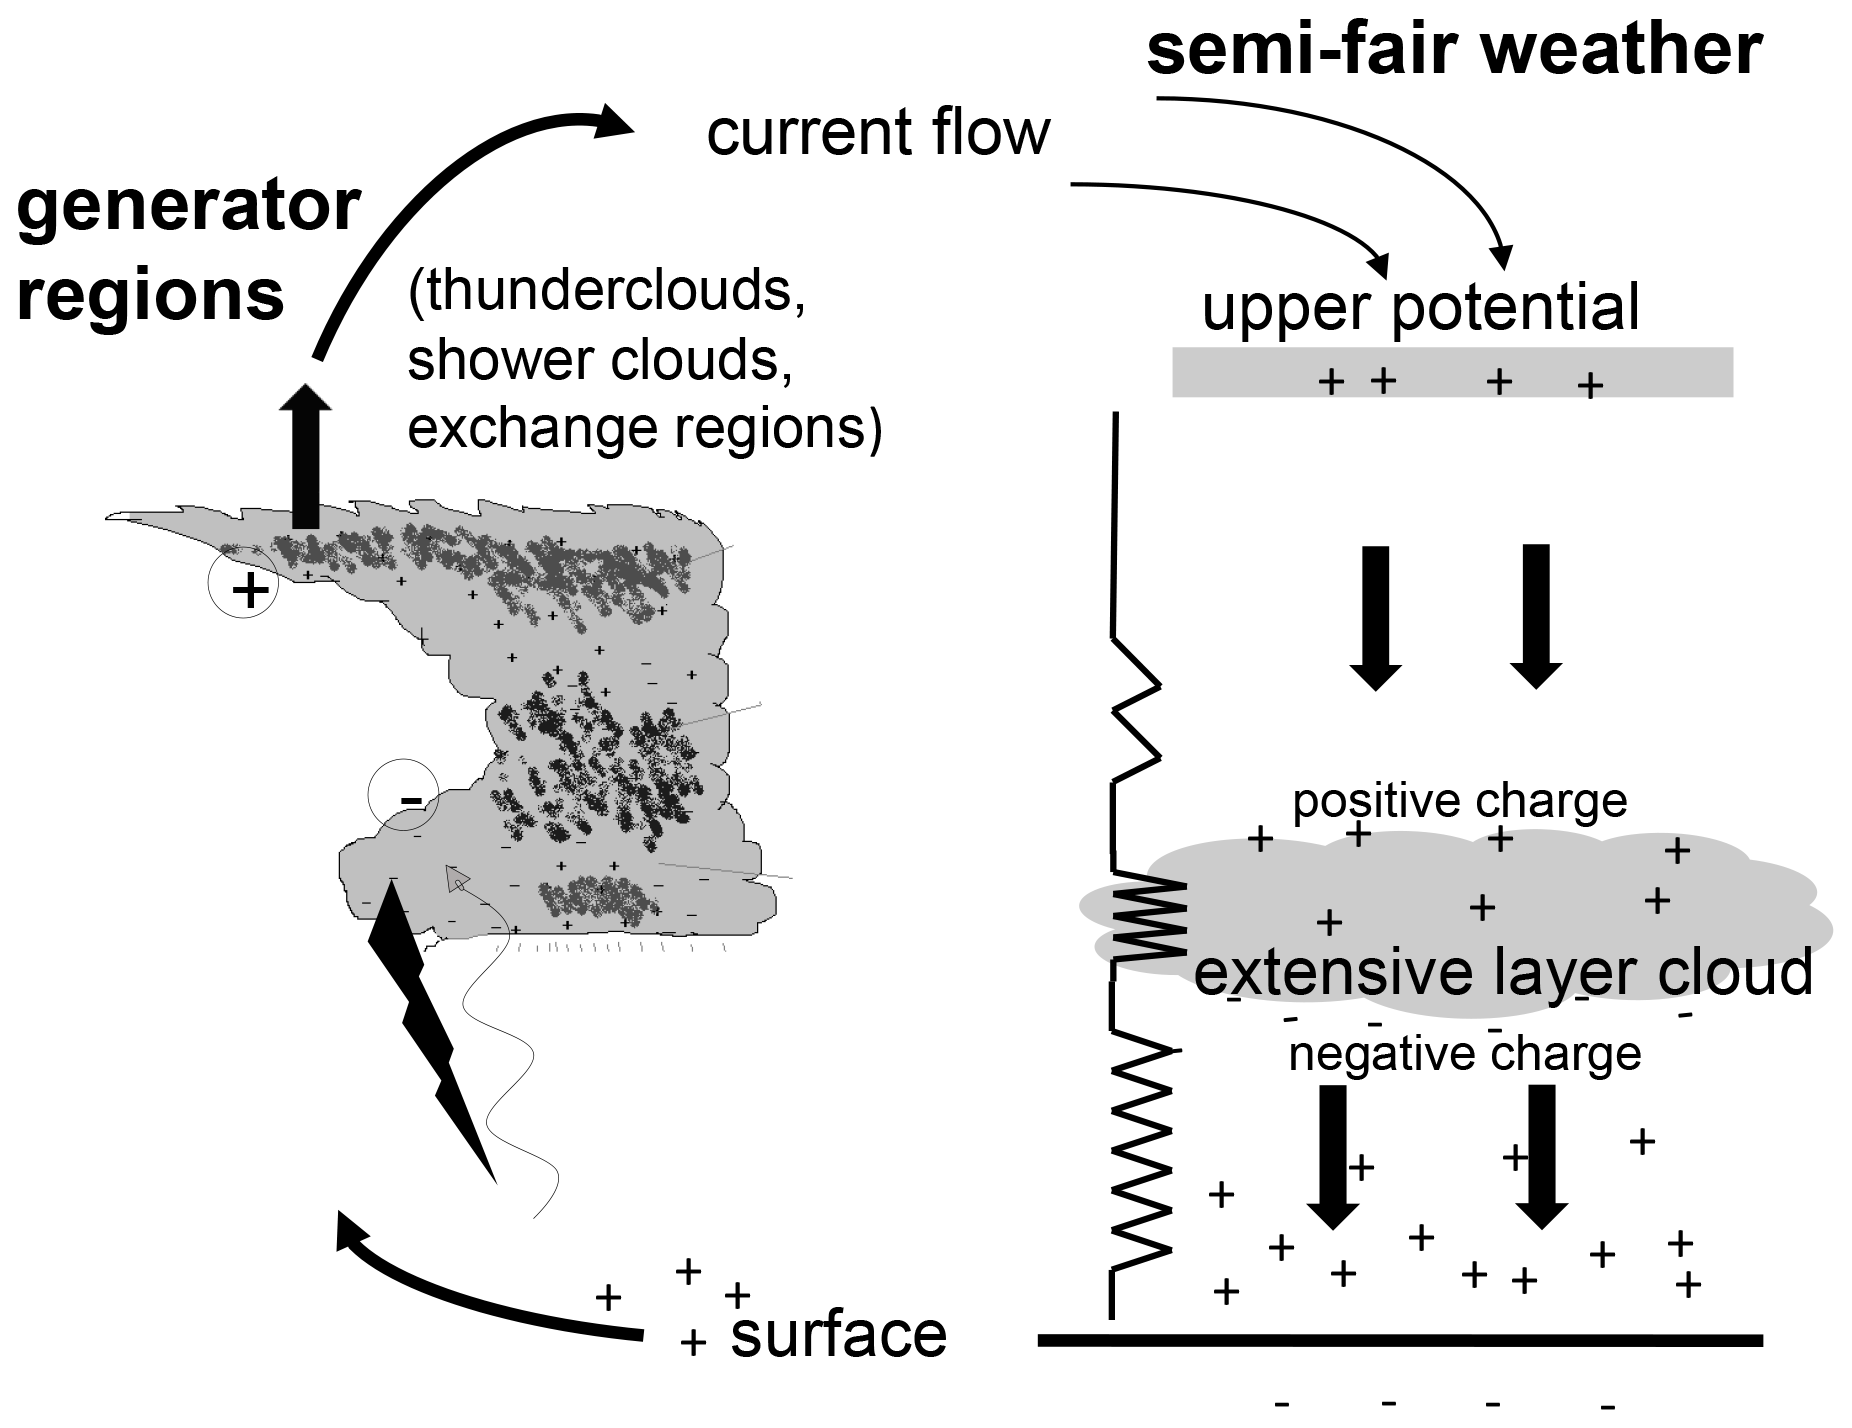
Figure 4Conceptual picture of the global atmospheric electric circuit in which a current is generated in disturbed weather regions and returns through distant fair weather and semi-fair weather regions. As the current returns through extensive layer clouds, charge accumulates at their upper and lower boundaries.
Because of the global nature of the current flowing in the circuit, charge at the boundaries of layer clouds is expected to occur widely. Direct observations of layer cloud charge have, however, rarely been made. Observing just the lower cloud charge, can, in principle, be achieved by using surface instrumentation such as that of Fig. 3c, because of the influence of the lower charge region on the surface electric field. (This is reminiscent of Canton's approach with an electroscope, described in Sect. 1.1 above.) In persistent and extensive layer clouds, the cloud base charge only varies slowly, hence fluctuations in the cloud base position can be regarded as representing the motion of a steady charge, causing changes in the electric field sensed at the surface.
Conventionally, the electric potential gradient (PG) has been recorded at the surface in fair weather rather than the electric field9. Under a persistent extensive layer cloud, the PG is found to be suppressed when the cloud base height is lower than about 1000 m (Harrison et al., 2017a). By determining the cloud height using an optical time of flight measurement, as provided by a laser ceilometer, variations of the cloud base height and PG can be compared. Figure 5 shows an example of a thin (∼ 300 m) and low extensive cloud layer, in which the cloud base fluctuations are closely correlated with the surface PG changes (Harrison et al., 2019). This demonstrates both the existence and persistence of the lower cloud charge, by a remote sensing approach. Direct measurement within a cloud is needed, however, if the vertical charge structure is to be examined and quantified.
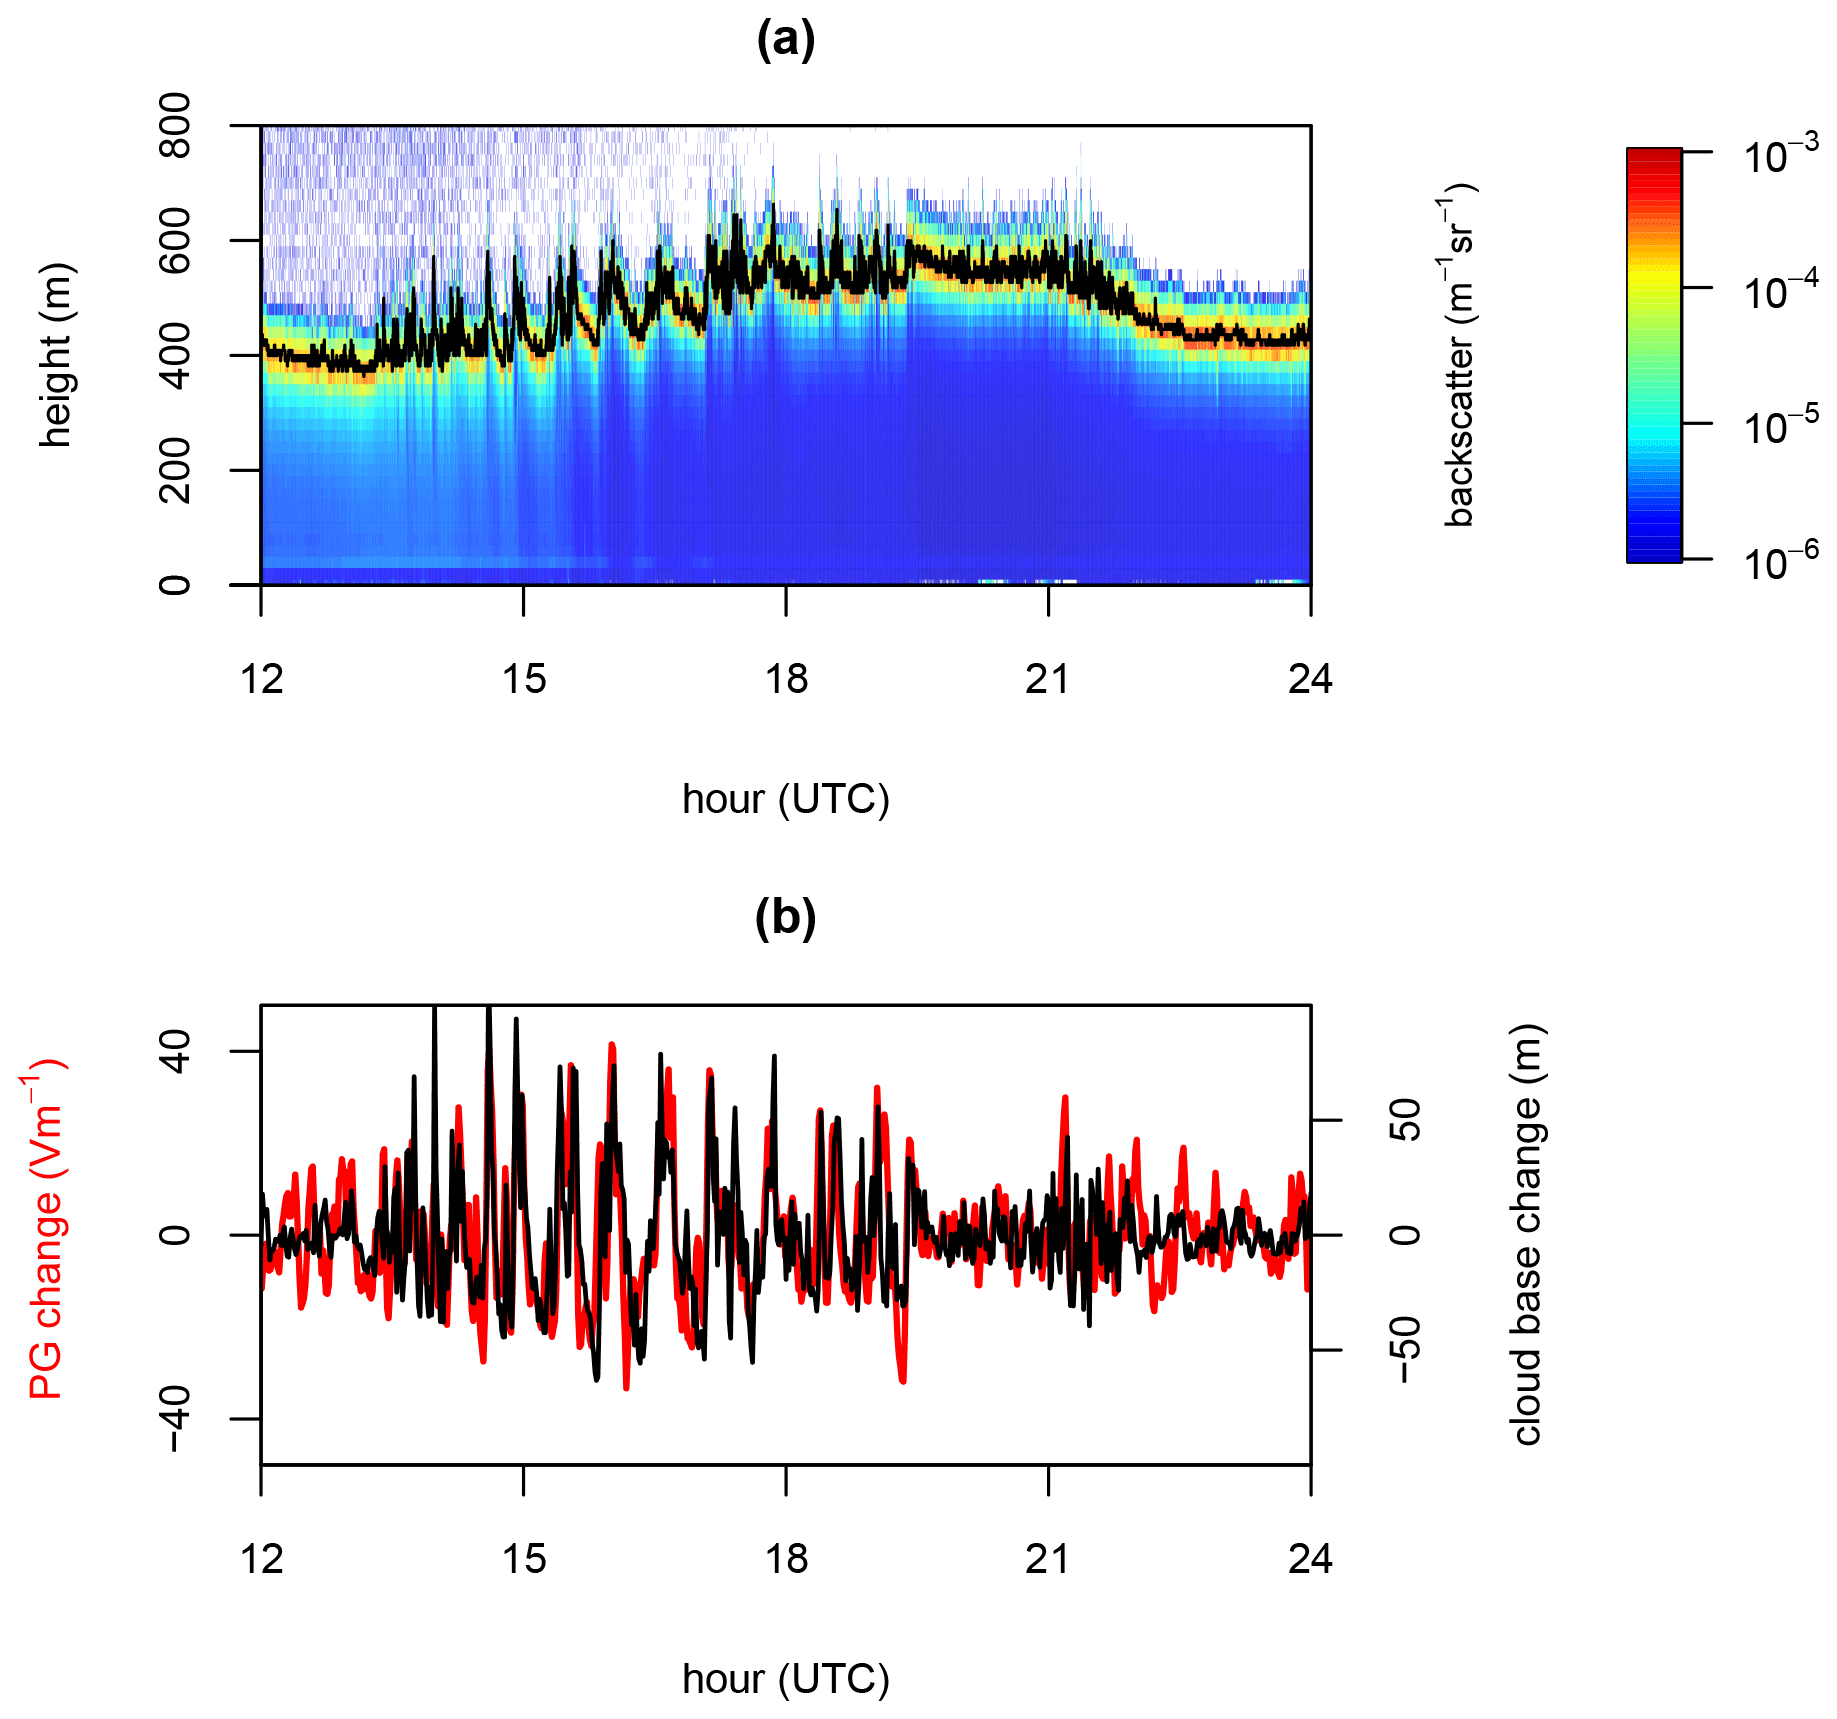
Figure 5Measurements from Reading University Atmospheric Observatory on 19 March 2015 showing (a) ceilometer backscatter from cloud base (at 400 to 500 m) and (b) fluctuations in the atmospheric electrical potential gradient (PG, thick red line) and cloud base height (thin black line). (Adapted from Harrison et al., 2019.)
Access to a cloud clearly requires an airborne platform of some kind, other than for the special cases of mountain top clouds, or surface studies of fog. The transient nature of fogs and the low base typical of extensive layer clouds make aircraft flight plans difficult, which are required well in advance. An alternative is to take advantage of the standard meteorological method of sending instrument packages – radiosondes – aloft by weather balloons (Fig. 6a) and return the measurements by radio. These devices, originally known as radiometeorographs, were developed in the 1920s to replace mechanical recording devices (e.g. Idrac and Bureau, 1927) and rapidly found widespread use (Wenstrom, 1934). Commercial devices followed, notably developed by Vilho Väisälä (1932), whose name is carried by the Finnish company he founded.
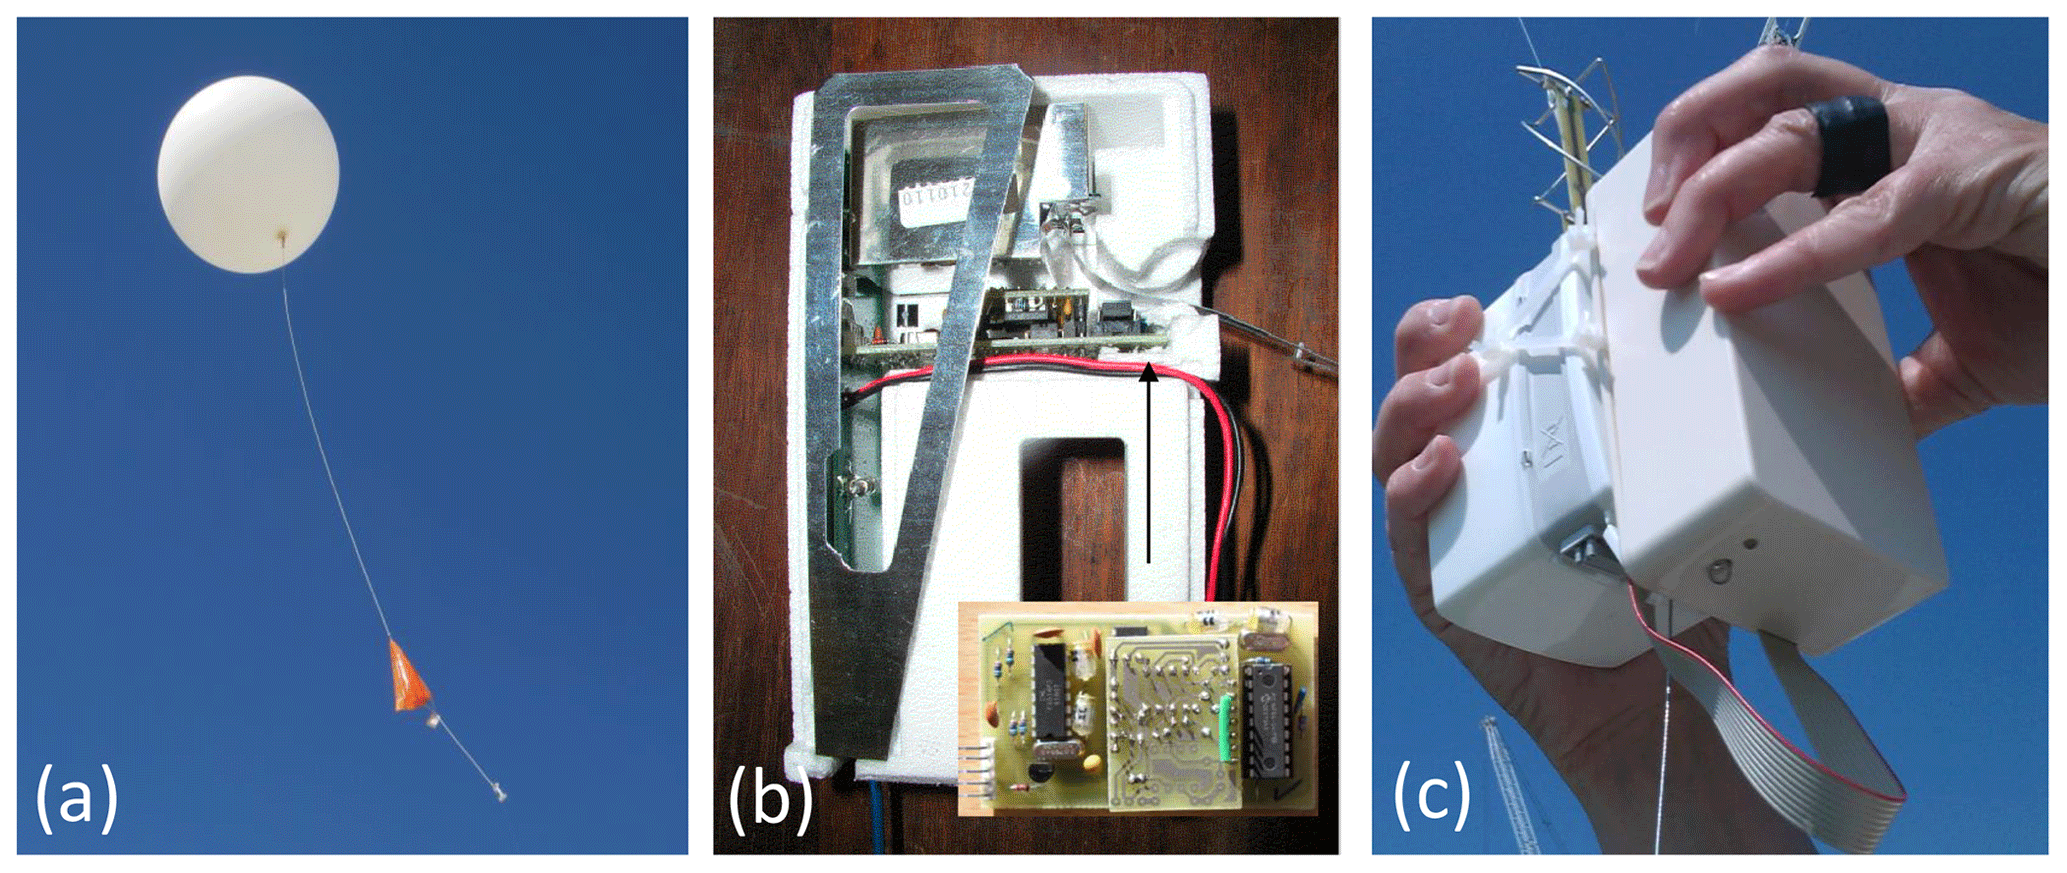
Figure 6(a) Radiosonde in flight, showing the carrier balloon and parachute for the descent. (b) RS80 radiosonde partially disassembled, showing the data acquisition system (RS80DAS) mounted within an internal cavity. (Inset photograph shows the RS80DAS circuit board.) (c) PANDORA system fixed to a RS92 radiosonde immediately pre-launch, showing the ribbon cable data connection to the radiosonde ozone interface connector.
Radiosondes have a well-established global role in obtaining routine meteorological data and can, at some sites at least, be launched rapidly in response to conditions under well-established regulations. However, standard radiosonde systems typically only measure the conventional thermodynamic variables of meteorology (atmospheric pressure, air temperature and relative humidity, or “PTU”) and their immediate location, from which the wind vector can be inferred. For measurements beyond these, additional sensors and data transfer systems will be required.
4.1 Research radiosondes
Radiosondes have long provided research measurements not used directly in weather forecasting, also referred to as “operational meteorology”. An example is the ozonesonde (Brewer and Milford, 1960), which carries electrochemical apparatus to determine ozone concentration in the stratosphere. Sensors for radioactivity (Koenigsfeld, 1958), turbulence (Anderson, 1957), cosmic rays (Pickering, 1943), aerosol properties (Rosen and Kjnome, 1991) and supercooled liquid water (Hill and Woffinden, 1980) have all been carried by radiosondes, and there are many more examples. Research radiosondes have also been used in atmospheric electricity, such as for charge measurements in thunderstorms (Takahashi, 1965), and for PG, conductivity and conduction current density in semi fair weather conditions (e.g. Venkiteshwaran, 1954; Jones et al., 1959; Olson, 1971; Gringel et al., 1978; Nicoll, 2012). Establishing the vertical thunderstorm charge structure by a balloon-carried recording instrument, the “alti-electrograph” (Simpson and Scrase, 1937) was especially important in the acceptance of the global circuit concept (Simpson, 1949). The long time series of cosmic ray measurements made by the Lebedev institute (Stozhkov et al., 2009) exists due to regular weekly launches of balloon-carried instruments from several sites.
Reviewing previous approaches illustrates the range of different technologies which have been used, either by adapting existing meteorological devices or, in some cases (e.g. the Lebedev instruments), developing a custom radiosonde. A disadvantage of adaptation is that one or more channels of meteorological data may be lost in providing telemetry bandwidth for a new quantity. For applications which need the meteorological data, this is clearly undesirable. Instead, if the routine radiosondes used in operational meteorology are harnessed to carry additional sensors without losing their core meteorological data, a much greater opportunity for new measurements presents itself, allowing access to the existing global launch and reception infrastructure of more than 1000 soundings daily. This has led to a new strategy of making “piggy-back” systems which provide additional measurement capability on standard meteorological radiosondes, whilst preserving the existing meteorological data. Furthermore, if the add-on devices are made straightforward to use, more launch opportunities can be obtained worldwide from those familiar with using meteorological radiosondes routinely, but who are not specialists in the research quantity sought.
The associated programme of work in Reading has mostly built on the Vaisala range of radiosondes, largely because the related equipment was already available at the university. Many other commercial radiosondes are available internationally, and the principles developed in using a programmable interface to support a range of sensors and communicate with the radiosonde are very flexible and amenable to other commercial systems too.
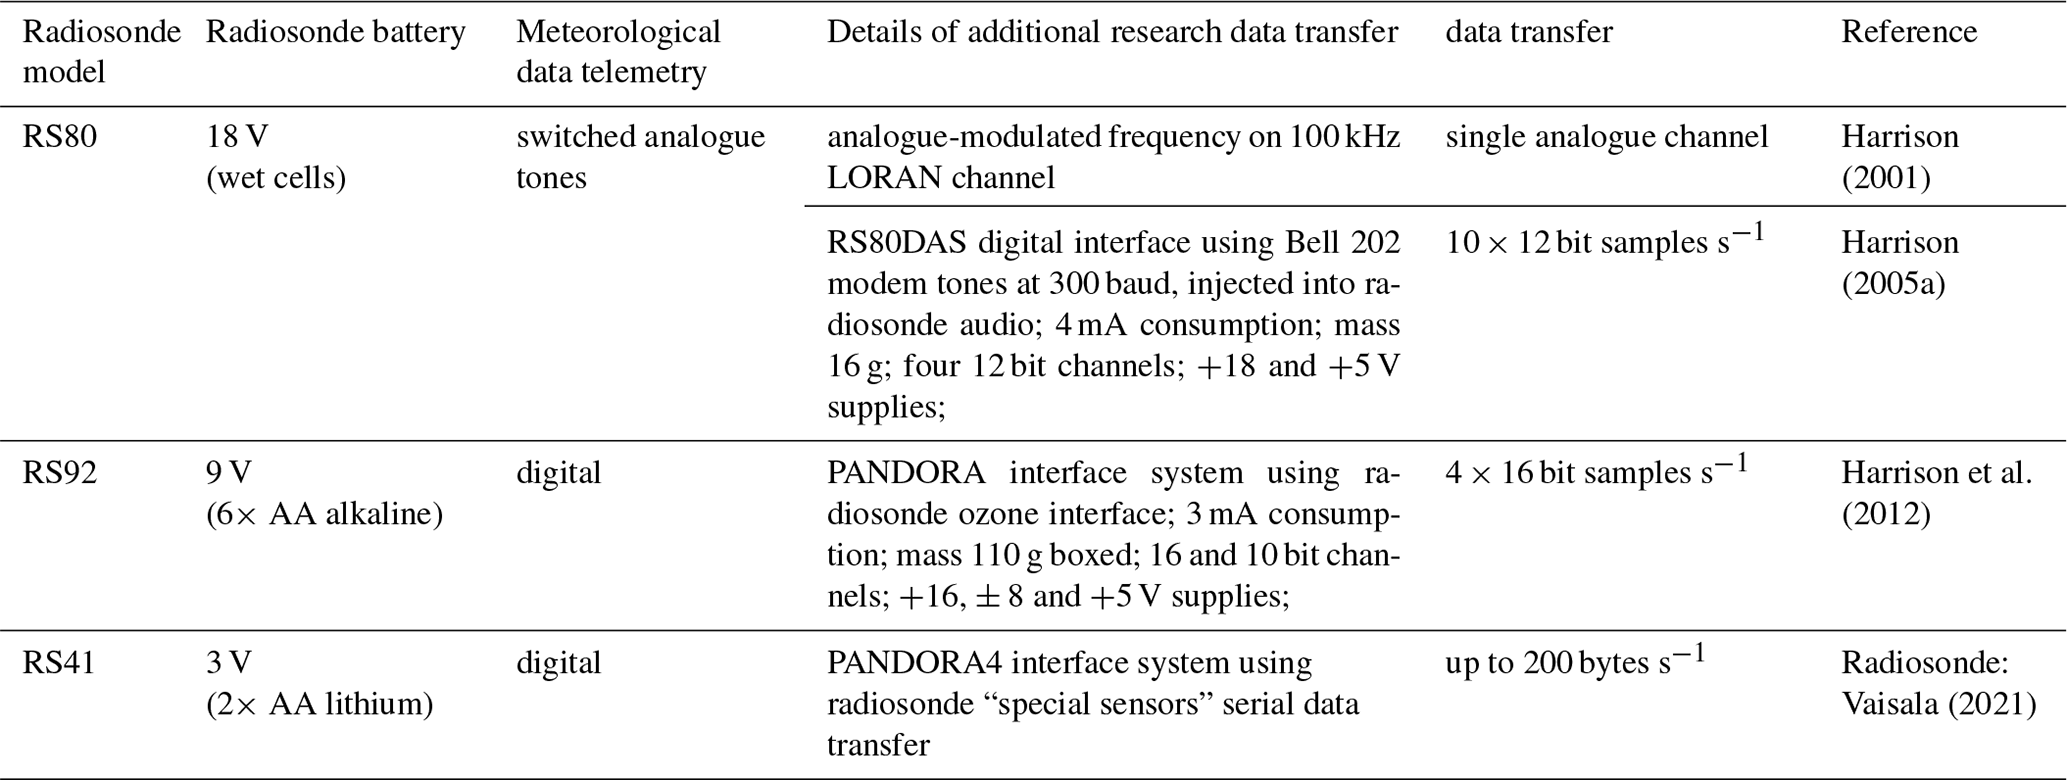
Table 1Vaisala meteorological radiosondes and their use with additional research sensors.
4.2 Interfacing and research data telemetry
Since the late 1990s, Vaisala has manufactured three major radiosonde versions: the RS80, the RS92 and the RS41. Table 1 provides a summary of how additional measurements have been obtained from each model without compromising the standard meteorological data. Systems added will encounter a wide operating temperature range, as even the polystyrene-insulated internal environment of a RS80 radiosonde can drop to at least −55 ∘C, (Harrison, 2005a). Connections and mountings need to be robustly implemented, as accelerations of ± 60 m s−2 associated with vigorous turbulence can occur (Marlton et al., 2015). There are also power constraints to consider, in that the radiosonde battery must not be excessively drained or all subsequent data transmission will be lost. The typical duration of an operational radiosonde ascent is 1 h, followed by slightly quicker descent by parachute. For each of the systems in Table 1, an operating time of 3 h was typically achieved, either by minimising the sensor current drawn (RS80 and RS92) or by including supplementary batteries (RS41). Further, the free lift of the standard balloon must not be exceeded if the equipment is ever to leave the ground. Cost, as the systems are only very rarely recovered after a flight, should also be minimised.
The first experiments were with the analogue RS80 radiosonde. The RS80 used a sequence of audio tones to send its PTU measurements, and it also provided an additional channel to relay LORAN (a LOng RAnge Navigation system using very low frequency) positioning signals, later entirely superseded by satellite GPS (Global Positioning System). As LORAN was not implemented in the Reading Meteorology Department's radiosonde system, this offered a spare channel to send additional data, through an analogue voltage-to-frequency converter varying within a few percent of 100 kHz. This signal was recovered as a voltage, by passing the modulated 100 kHz signal to a phase-locked loop (PLL), and the tracking voltage logged with a 12 bit analogue to digital converter. Time stamping of the radiosonde data and PLL data on separate logging computers allowed the two different files to be aligned. Regular switching to full scale at the radiosonde end was also applied to allow correction for non-linearity and thermal drift.
Limitations from single-channel analogue transfer led to a more extensive digital data acquisition system (RS80DAS), fitted in a cavity within the RS80 (Fig. 6b). The modem used was chosen for signalling tones (1200/2200 Hz) outside the audio frequencies already used for the RS80's meteorological data10. Samples from four 16 bit analogue-to-digital converter (ADC) channels were formatted by a microcontroller and sent to the modem for onward transmission, decoded by a further modem at the receiver to yield a serial data stream. This arrangement provided a much more temperature stable system (15 mV error in 5 V full scale across a 60 ∘C temperature change) and, importantly, could convey simultaneous data from multiple sensors (Harrison, 2005a).
When a subsequent radiosonde design, the RS92, was introduced, its smaller dimensions meant that it was no longer possible to fit the existing data acquisition interface within the radiosonde. The RS92 was digital, with special provision for sending additional data when deployed as an ozonesonde. A new data acquisition system was designed to generate a data stream which mimicked that expected from the sensor in the ozone application. For this, the data were buffered in bursts at the rapid rate required by the radiosonde, using a first-in-first-out (FIFO) shift register. The complete system was called PANDORA (for Programmable ANalogue and Digital Operational Radiosonde Accessory)11, which was physically attached to the RS92 radiosonde using cable ties (Fig. 6c). It provided four 16 bit and two 10 bit analogue channels, and regulated power supplies for the sensors connected. The radiosonde's meteorological data were shown to be unaffected by the PANDORA system's addition (Harrison et al., 2012).
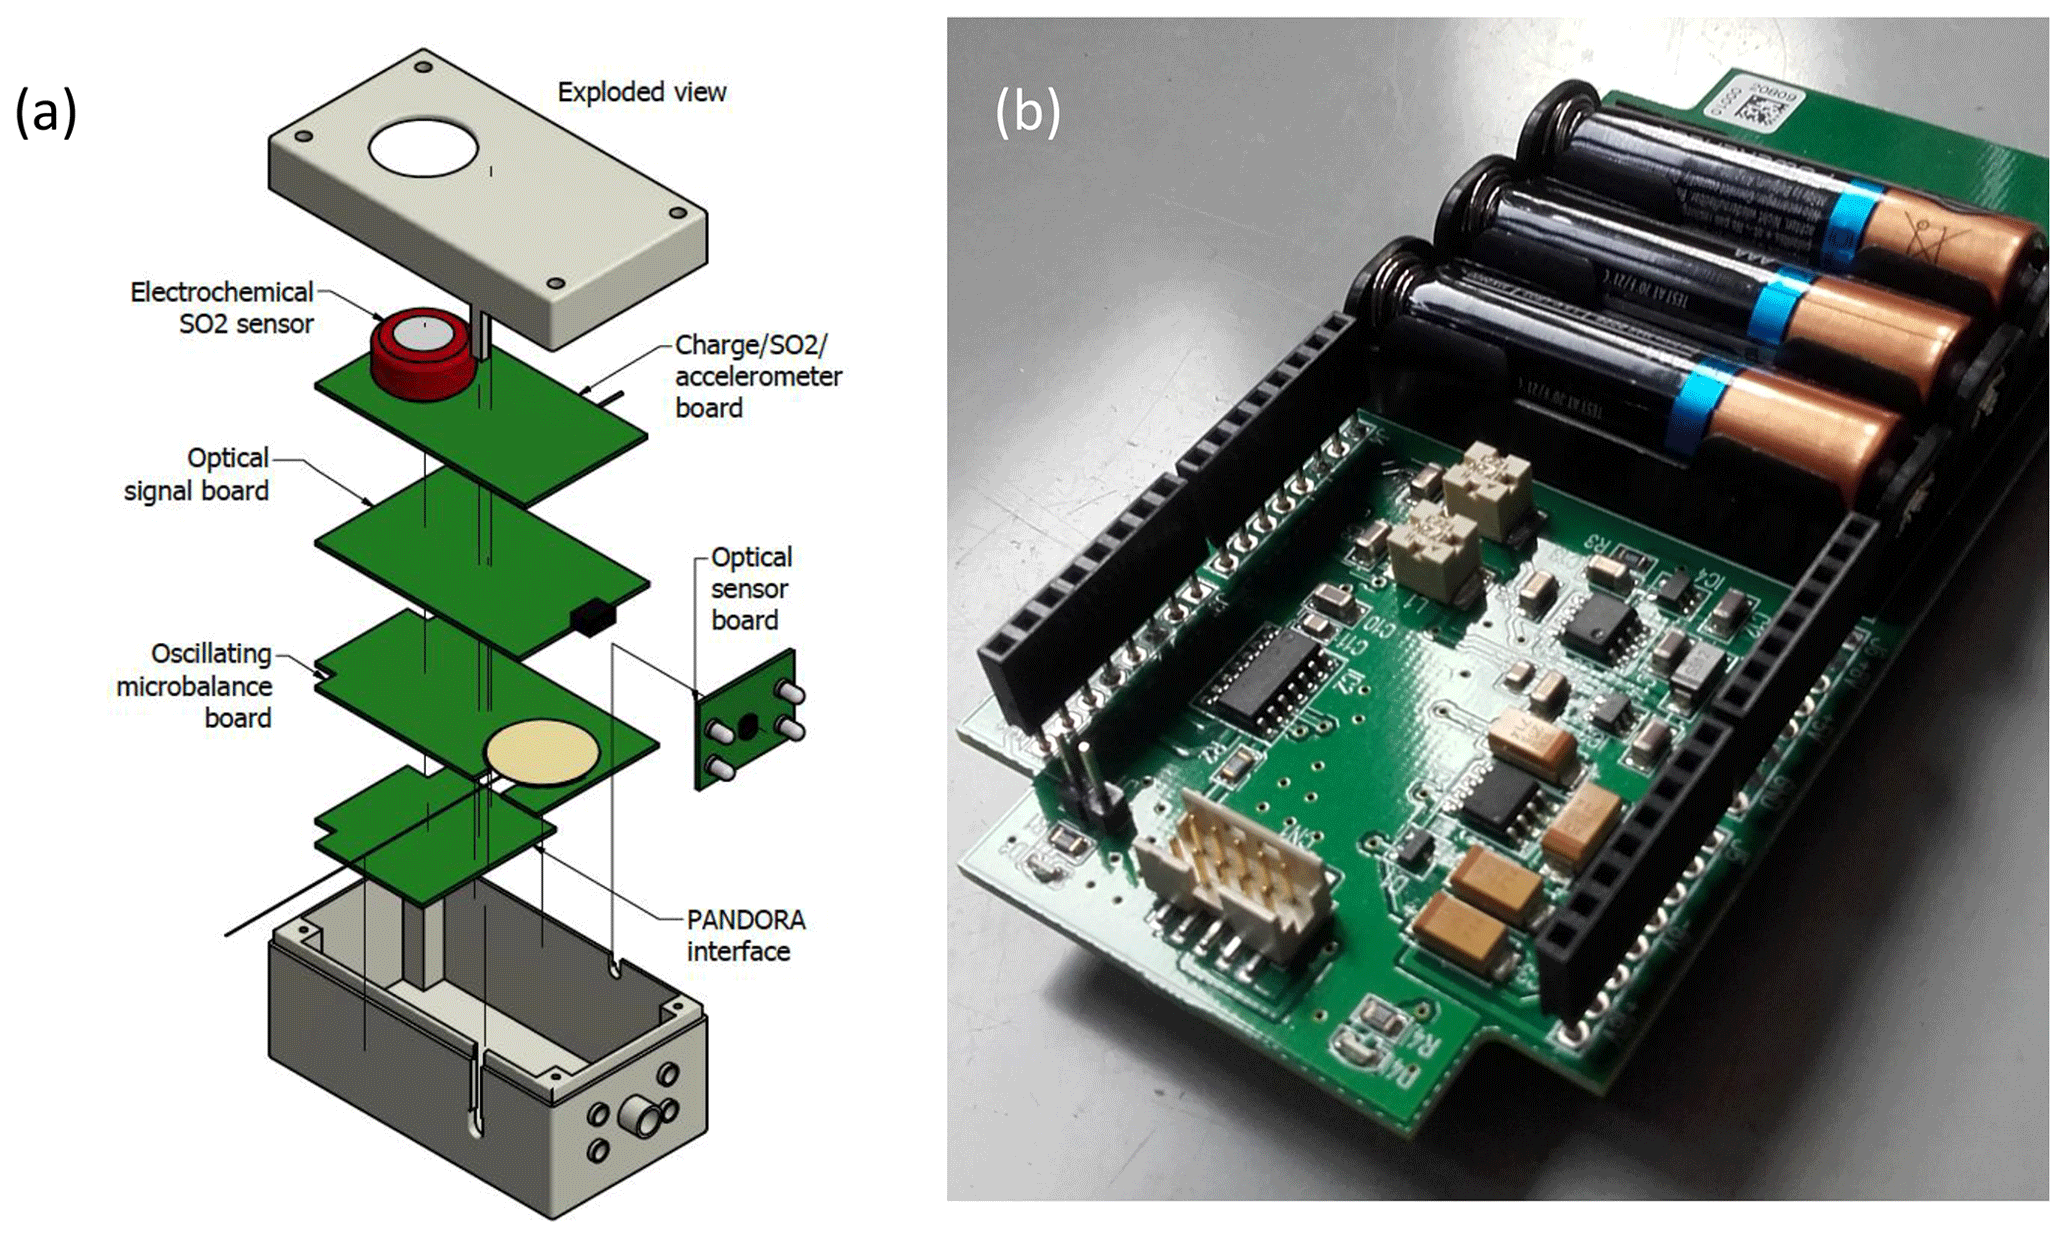
Figure 7The PANDORA4 system for support of additional radiosonde sensors. (a) Stackable arrangement of multiple sensor boards, in this example including an accelerometer, collecting wire for an oscillating microbalance, cloud, charge and gas detectors. (b) PANDORA4 data board for use with RS41 radiosonde, showing stackable connectors and additional battery supply.
With more soundings undertaken for an increasing range of different scientific objectives, the inherent versatility became time consuming to implement, as, for each custom system constructed for a particular application, individual wiring and software was required. A much more adaptable system, PANDORA4, was devised, based on stackable sensor boards mounted above each other (Fig. 7a), with a consistent physical form and arrangement of connectors on each of the sensor boards. Each sensor board carries its own microcontroller (or microcontrollers), which only returns data to PANDORA4 when polled with its specific address. This allows PANDORA4 to configure itself and format its data stream automatically for whatever combination of sensors is fitted.
As the radiosonde technology has evolved to become more compact, their battery voltage and spare battery capacity has reduced. PANDORA4 now carries three AAA cells (Fig. 7b) to power itself and associated sensors, and includes supply voltage converters to maintain compatibility with earlier PANDORA systems.
Some of the sensors devised for various atmospheric measurements, motivated originally by the cloud charge application, are now described.
4.3 Electrometer radiosondes
Measurement of atmospheric charge using a radiosonde requires a sensing electrode and electrometer able to measure the charge collected or induced, with some sort of data telemetry as described above. The potential of the radiosonde changes as it rises through the atmosphere, but more slowly than that of a small sensing electrode, causing a current to flow transiently which can be measured. One electrode configuration which has some simplicity, suitable for large electric fields, is a point electrode for corona discharge. Figure 8a shows a corona sonde from 1998, in which a needle electrode was connected to a current amplifier, following the electronic principles of Sect. 2.2. It was not, however, a convenient arrangement to launch, not least because of the proximity of the sharp needle to an inflated rubber balloon. Rounded electrodes are preferable, with the connection between the electrode and the electrometer as short as possible to reduce leakage. A novel capsule well suited to this application was found within a “Kinder egg”, housing a self-assembly toy contained within a confectionery egg. This capsule is manufactured from hydrophobic material, is strong enough to resist modest impacts and is water-tight, offering some protection to any electronics mounted within it.
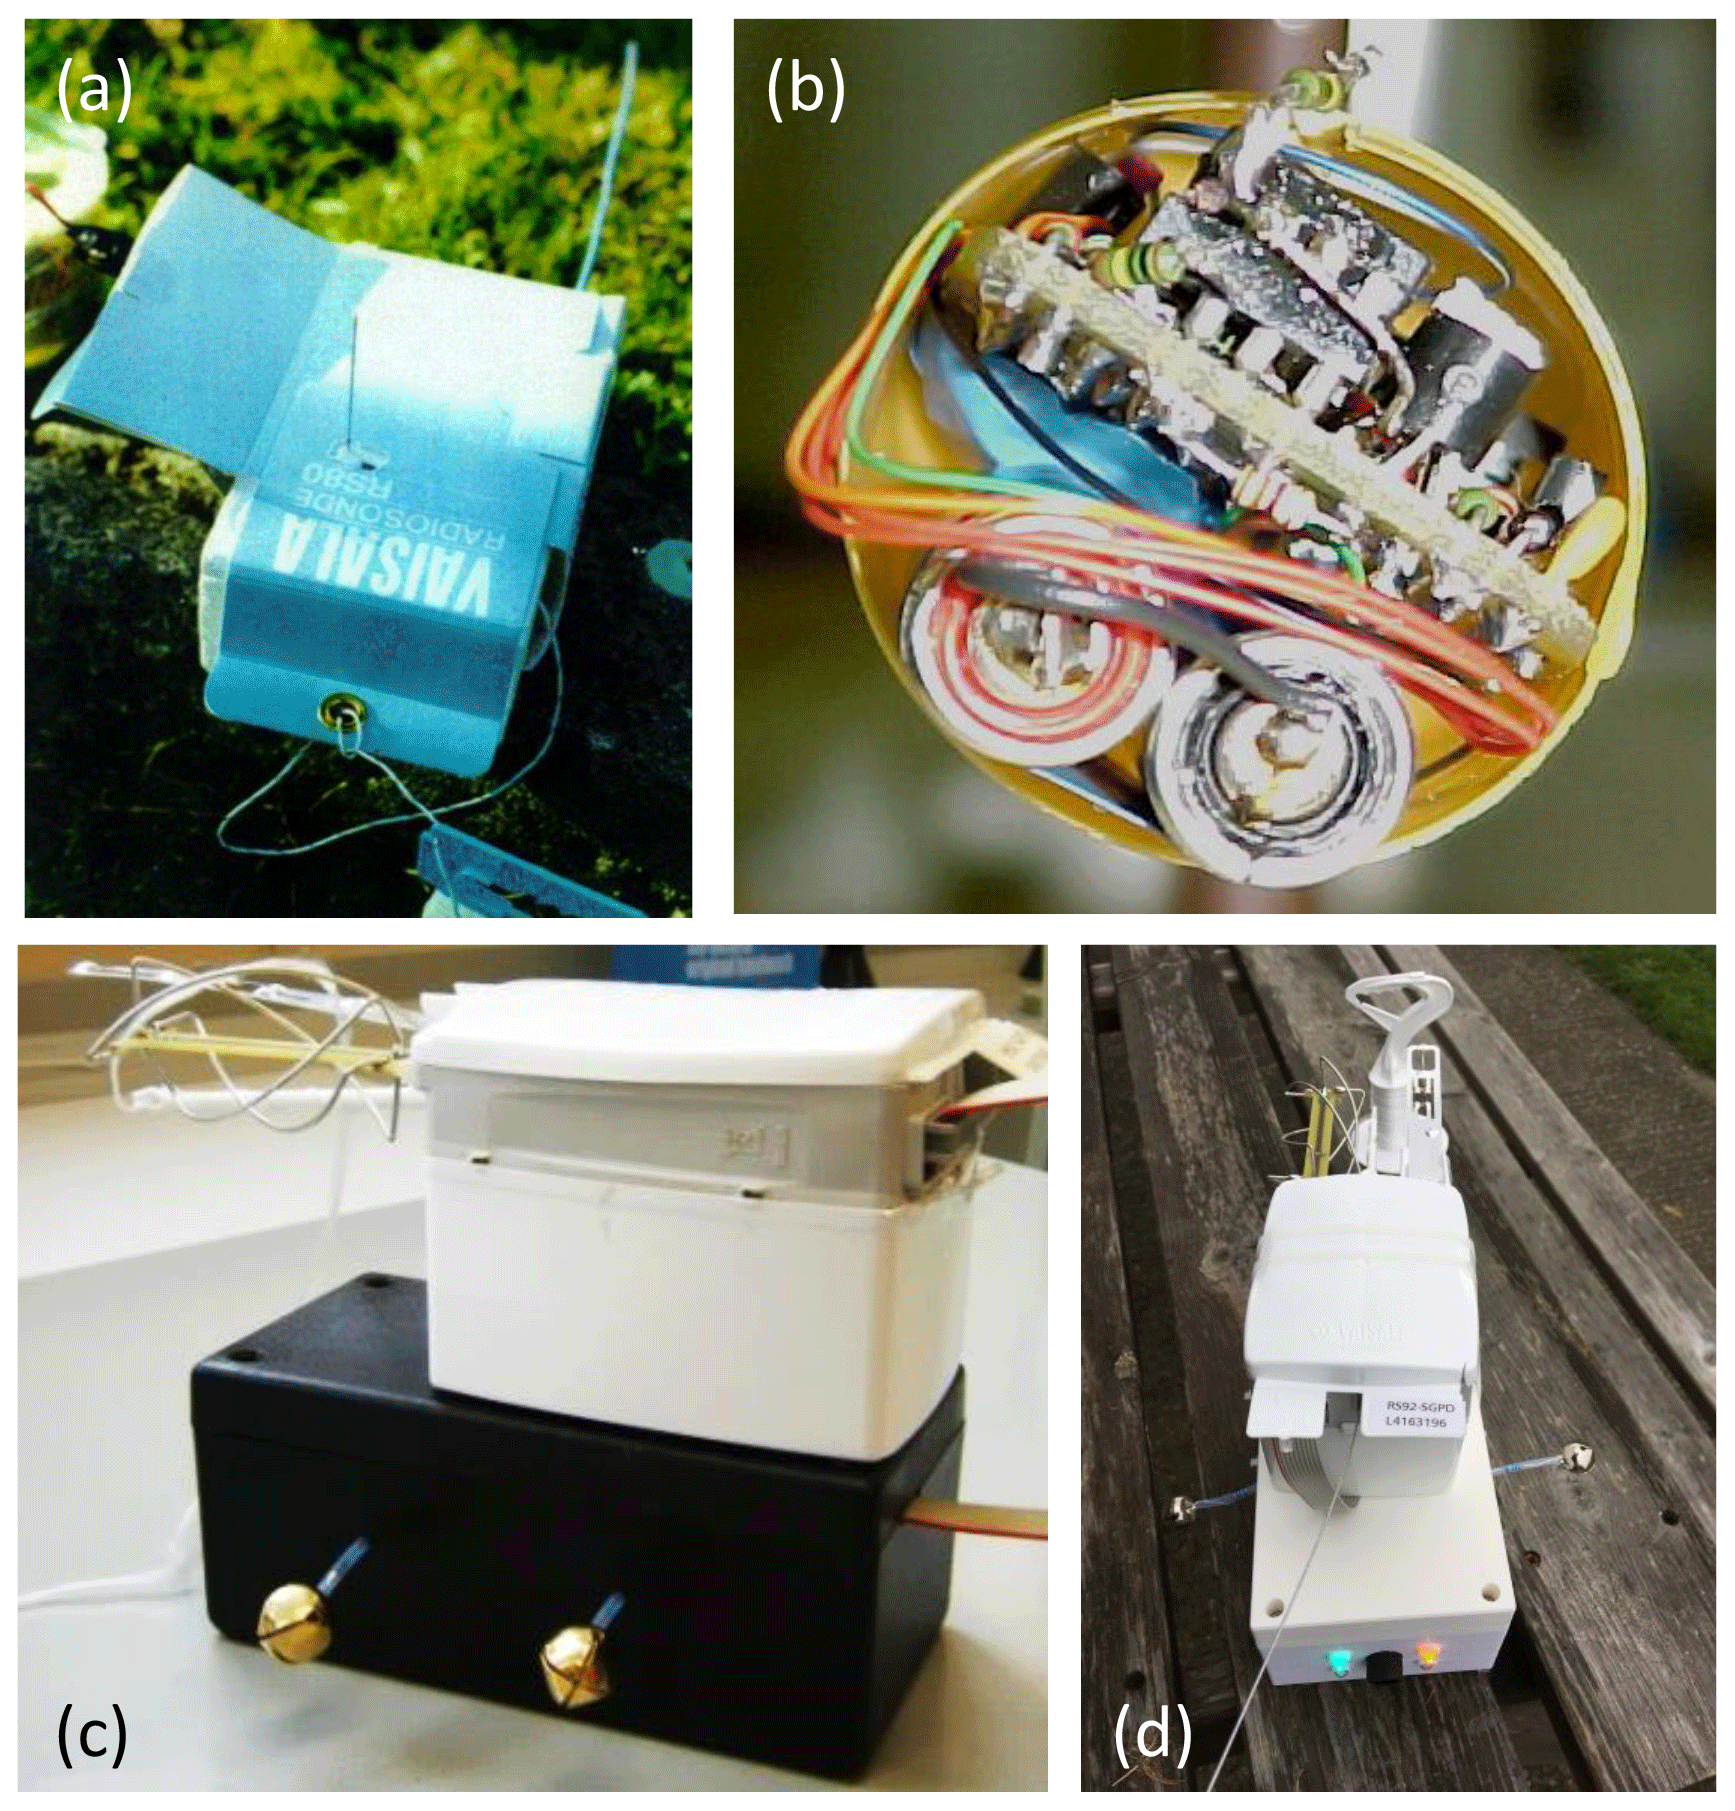
Figure 8Radiosonde electrometer sensors. (a) Corona discharge needle, protruding from a RS80 radiosonde. (b) Extended range electrometer mounted within a “Kinder egg” housing with a conductive coating applied. (c) Double electrode electrometer with different linear ranges. (d) Electrode pair with linear and logarithmic electrometers, and multi-wavelength cloud sensor.
Figure 8b shows the electrometer circuitry contained with a Kinder egg capsule (Harrison, 2001)12. A graphite conductive coating was painted on, connected electrically with silver-loaded epoxy adhesive. The wide-range electrometer was powered from car key fob batteries (giving 24 V), with the system electrically isolated and an optical connection made to the radiosonde. Because of the risk that the sensor could become irrecoverably electrically saturated early in a flight, regular reset switching was included as a precaution against data loss. A semiconductor switch with suitably negligible leakage (< 10 fA) was developed specially, using the gate-source connection of a junction field effect transistor (JFET) as a diode, across which the voltage difference was kept around 1 mV when off. This was switched on for 1 s every 10 s, also providing a regular full-scale value with which to correct for the drift inherent in the analogue telemetry.
Figure 8c shows a later version of the charge detector, using smaller spherical electrodes, again a mass-produced item, originally intended as a small (6 mm diameter) pressed metal bell. Initially, a voltmeter follower circuit was used, with reset switching as previously (Nicoll and Harrison, 2009), and the charge calculated from the capacitance. However, the smaller size led to more difficulties with saturation. It was found more satisfactory to measure the current flowing, arising from changes in the electrical environment through which the sensor passed (Nicoll, 2013). In Fig. 8c, two sensors were connected to electrometers with different ranges to allow different cloud charges to be investigated, as the optimum range had to be established empirically. Figure 8d shows a further system which combines linear and logarithmic response electrometers (Harrison et al., 2017b) to provide accuracy in one case and wide dynamic range in the other.

Figure 9Vertical soundings from Reading on (a) 24 August 2000 and (b) 3 March 2004. Points show the recovered sensor voltage (scale on lower horizontal axis), with full-scale pulses highlighted in red in panel (a). Solid blue lines and dashed dark green lines show the air temperature and dew-point temperature (temperature scale on upper horizontal axis). (Adapted from Harrison, 2001, 2004.)
Figure 9 shows examples of soundings made with the early Kinder egg sensors. Figure 9a was obtained using the analogue system, and the regular reset switching is apparent. A response in the charge sensor is apparent at about 800 m altitude, probably associated with the top of the atmospheric boundary layer. (Similar fluctuations can provide detailed information on the electrical structure throughout this atmospheric region, Nicoll et al., 2018.) Figure 9b shows an example of the complex charge structure commonly observed, although in this case, at the limit of the measurement resolution of the digital system. Both soundings, however, show that the vertical resolution of the meteorological data is relatively coarse when compared with the vertical detail in the electrical structure. Unfortunately, it was concluded that the meteorological data alone are inadequate for interpretation of the electrical measurements and that other simultaneous observations would be needed. A series of further sensors has accordingly been developed to take advantage of the additional data telemetry available in the digital data acquisition system. Above all, the most important additional requirement for determining cloud charge has been an independent method for reliable cloud identification. Other corroborating sensors, for example, reporting the motion of the radiosonde, can bring value by allowing the sensor orientation to be monitored. Development of these additional sensors measuring other quantities beyond charge is now addressed13.
4.4 Optical cloud detection
Cloud is conventionally determined on a radiosonde sounding by using humidity information, typically obtained by a capacitive relative humidity sensor. These sensors have a finite response time, which, when combined with the ascent speed of the radiosonde, prescribes a minimum thickness of cloud which can be detected. If the sensor time response is 10 s, and the ascent speed 5 m s−1, this thickness would be of order 50 m. As the soundings of Fig. 9 show, atmospheric charge layers can be much thinner than this, so the humidity method is clearly insufficient. An optical method can be expected to have a much more rapid time response, for example, using a photodiode as a detector of optical changes caused by cloud.
Two approaches for optical cloud detection have been investigated. The first method was passive, in that the photodiode was used to detect cloud-induced changes in received solar radiation, and the second active, using a bright local source of illumination to generate backscattered light when droplets are present. The first method can only work in daylight, and the second method, initially at least, was intended to be complementary, for use at night.

Figure 10Sounding of a cloud layer from Reading on 22 April 2014. (a) Solar radiation from a downward-pointing photodiode was recorded (thin orange line) simultaneously with (b) the received backscattered light from ultra-bright yellow light-emitting diodes (thick orange line), expressed in terms of equivalent visual range. The relative humidity (RH) profile (thick grey line) is shown on both plots. (Adapted from Harrison and Nicoll, 2014.)
In the passive cloud detector arrangement, an inexpensive and commonly available VT8440B photodiode (peak spectral response at 580 nm) was implemented with an amplifier circuit to provide a large signal input to the data acquisition system (Nicoll and Harrison, 2012). This essentially provided a measurement of solar radiation, falling either directly on the photodiode or as diffuse solar radiation after scattering of sunlight in cloud. The presence or absence of cloud modifies the variability in solar radiation. Within a cloud, the light is essentially isotropic, so the swinging motion of the radiosonde has little or no effect, but away from cloud, the light intensity varies strongly with direction. Figure 10a shows the change in solar radiation received by a downward-facing photodiode as it rises through low stratiform cloud. At the cloud base, the radiation begins to increase steadily with height as the optical thickness of the cloud diminishes. As the instrument emerges from the cloud top, the solar radiation variability sharply increases due to swing of the radiosonde beneath the carrier balloon. The relative humidity sensor data are provided for comparison, in which much less distinct boundaries are apparent at the cloud base and cloud top. With the relative humidity measurement alone, the cloud position would only be poorly defined.
The active cloud detection method requires strong local illumination, ideally from an open source to reduce difficulties with ice formation. In aerosol sensors, laser sources are used within chambers into which air is pumped, but an open laser source is unlikely to be safe on balloons because the direction would be variable and uncontrolled. For this application, high-intensity light-emitting diodes (LEDs) are ideal, as they are compact and highly efficient. Even so, the light scattered by water droplets in clouds generates only a small signal and substantial amplification is required. If the LED light source is modulated, the noise inherent in this process can be reduced. In addition, since modulation provides a varying signal which contrasts with the steady signal of sunlight, the modulated signal can be amplified selectively despite strong sunlight14. By designing the first amplifier stage with a small gain to allow a wide dynamic range, adding high pass filtering, further amplification and phase-sensitive detection, detection of the backscattered light even in daytime conditions becomes possible, as demonstrated in Harrison and Nicoll (2014). Figure 10b shows the active cloud detection method operating during the same ascent as for Fig. 10a. With the active method, the cloud base and cloud top are both very sharply defined, consistently with that expected from the passive detector shown in Fig. 10a.
These optical sensing methods allow cloud boundaries to be determined to much greater resolution than by the standard relative humidity sensor of a radiosonde and typically to better than ± 10 m. Consequently, by using these optical methods, some thin layers of cloud may become detectable, which would not be registered by the standard approach using a relative humidity sensor.
4.5 Turbulent motion
When a radiosonde is launched, it is common to see the ascending instrument package swinging or twisting. Through collaborating on an art project15, in which a camera transmitted images continually from a rising balloon package, it was clear that the irregular motions continued throughout the ascent and were not just associated with the launch. The motion of a radiosonde package is complex, as it responds to both the atmospheric motions encountered by the carrier balloon and a pendulum motion from the combination of the instrument package and the attachment cord.
A first attempt to monitor the radiosonde's motion was through including a small sensor for the terrestrial magnetic field, the signal from which would only vary if the instrument package was in motion. This was, essentially, a compass for a radiosonde, using a Hall effect sensor (Harrison and Hogan, 2006). With this magnetometer sonde, multiple soundings within hours of each other showed consistent magnetometer variability in the same region of the atmosphere, implying a turbulent atmospheric region (Harrison et al., 2007). Following a suggestion that the vertical magnetic variability would prove most useful (Lorenz, 2007), the three orthogonal components of the magnetic field were measured simultaneously, and rapidly, and processed on the radiosonde to conserve the amount of data sent over the radio link. Through this work, the vertical component was indeed found to be the most successful, and the response of this component from the magnetometer sonde in the lower atmosphere could be calibrated against lidar determination of the turbulence through which it passed (Harrison et al., 2009).
Later developments in semiconductors have allowed miniature accelerometers to be used instead of the Hall sensor, which directly sense the mechanical forces on the radiosonde. With these, it was found possible to calibrate the motion of the radiosonde to provide the eddy dissipation rate, a measure of atmospheric turbulence (Marlton et al., 2015).
Lorenz (2007) also commented on the relevance of the platform motion work to planetary exploration. In a later paper, Lorenz et al. (2007) reported motions of the Huygens probe as it descended through the atmosphere of Saturn's moon Titan. The power spectrum of these motions showed good agreement with that found within turbulent terrestrial clouds by Harrison and Hogan (2006), supporting arguments for turbulence within the methane clouds of Titan.
4.6 Ionisation and radioactivity
Generation of small ions in the atmosphere leads to the finite electrical conductivity of air, from which current flow in the global circuit results. In conductive air, charge on droplets and particles does not persist for long. Measuring the conductivity or the ionisation is therefore an aspect of characterising the background electrical environment.
Conductivity is conventionally measured using a “Gerdien tube”, which consists of a rod electrode, centred within an outer coaxial cylindrical electrode (e.g. Aplin and Harrison, 2000, see also Fig. 3b). For a given voltage applied across the electrodes, the current flowing between the electrodes is proportional to the conductivity. The original method used by Gerdien was to determine the rate of decay of charge on the central electrode (Gerdien, 1905). A similar approach was developed for radiosonde use (Nicoll and Harrison, 2008). However, maintaining good insulation within a droplet-laden environment proved difficult or impossible, and it became clear why there are few reliable measurements of in-cloud conductivity.
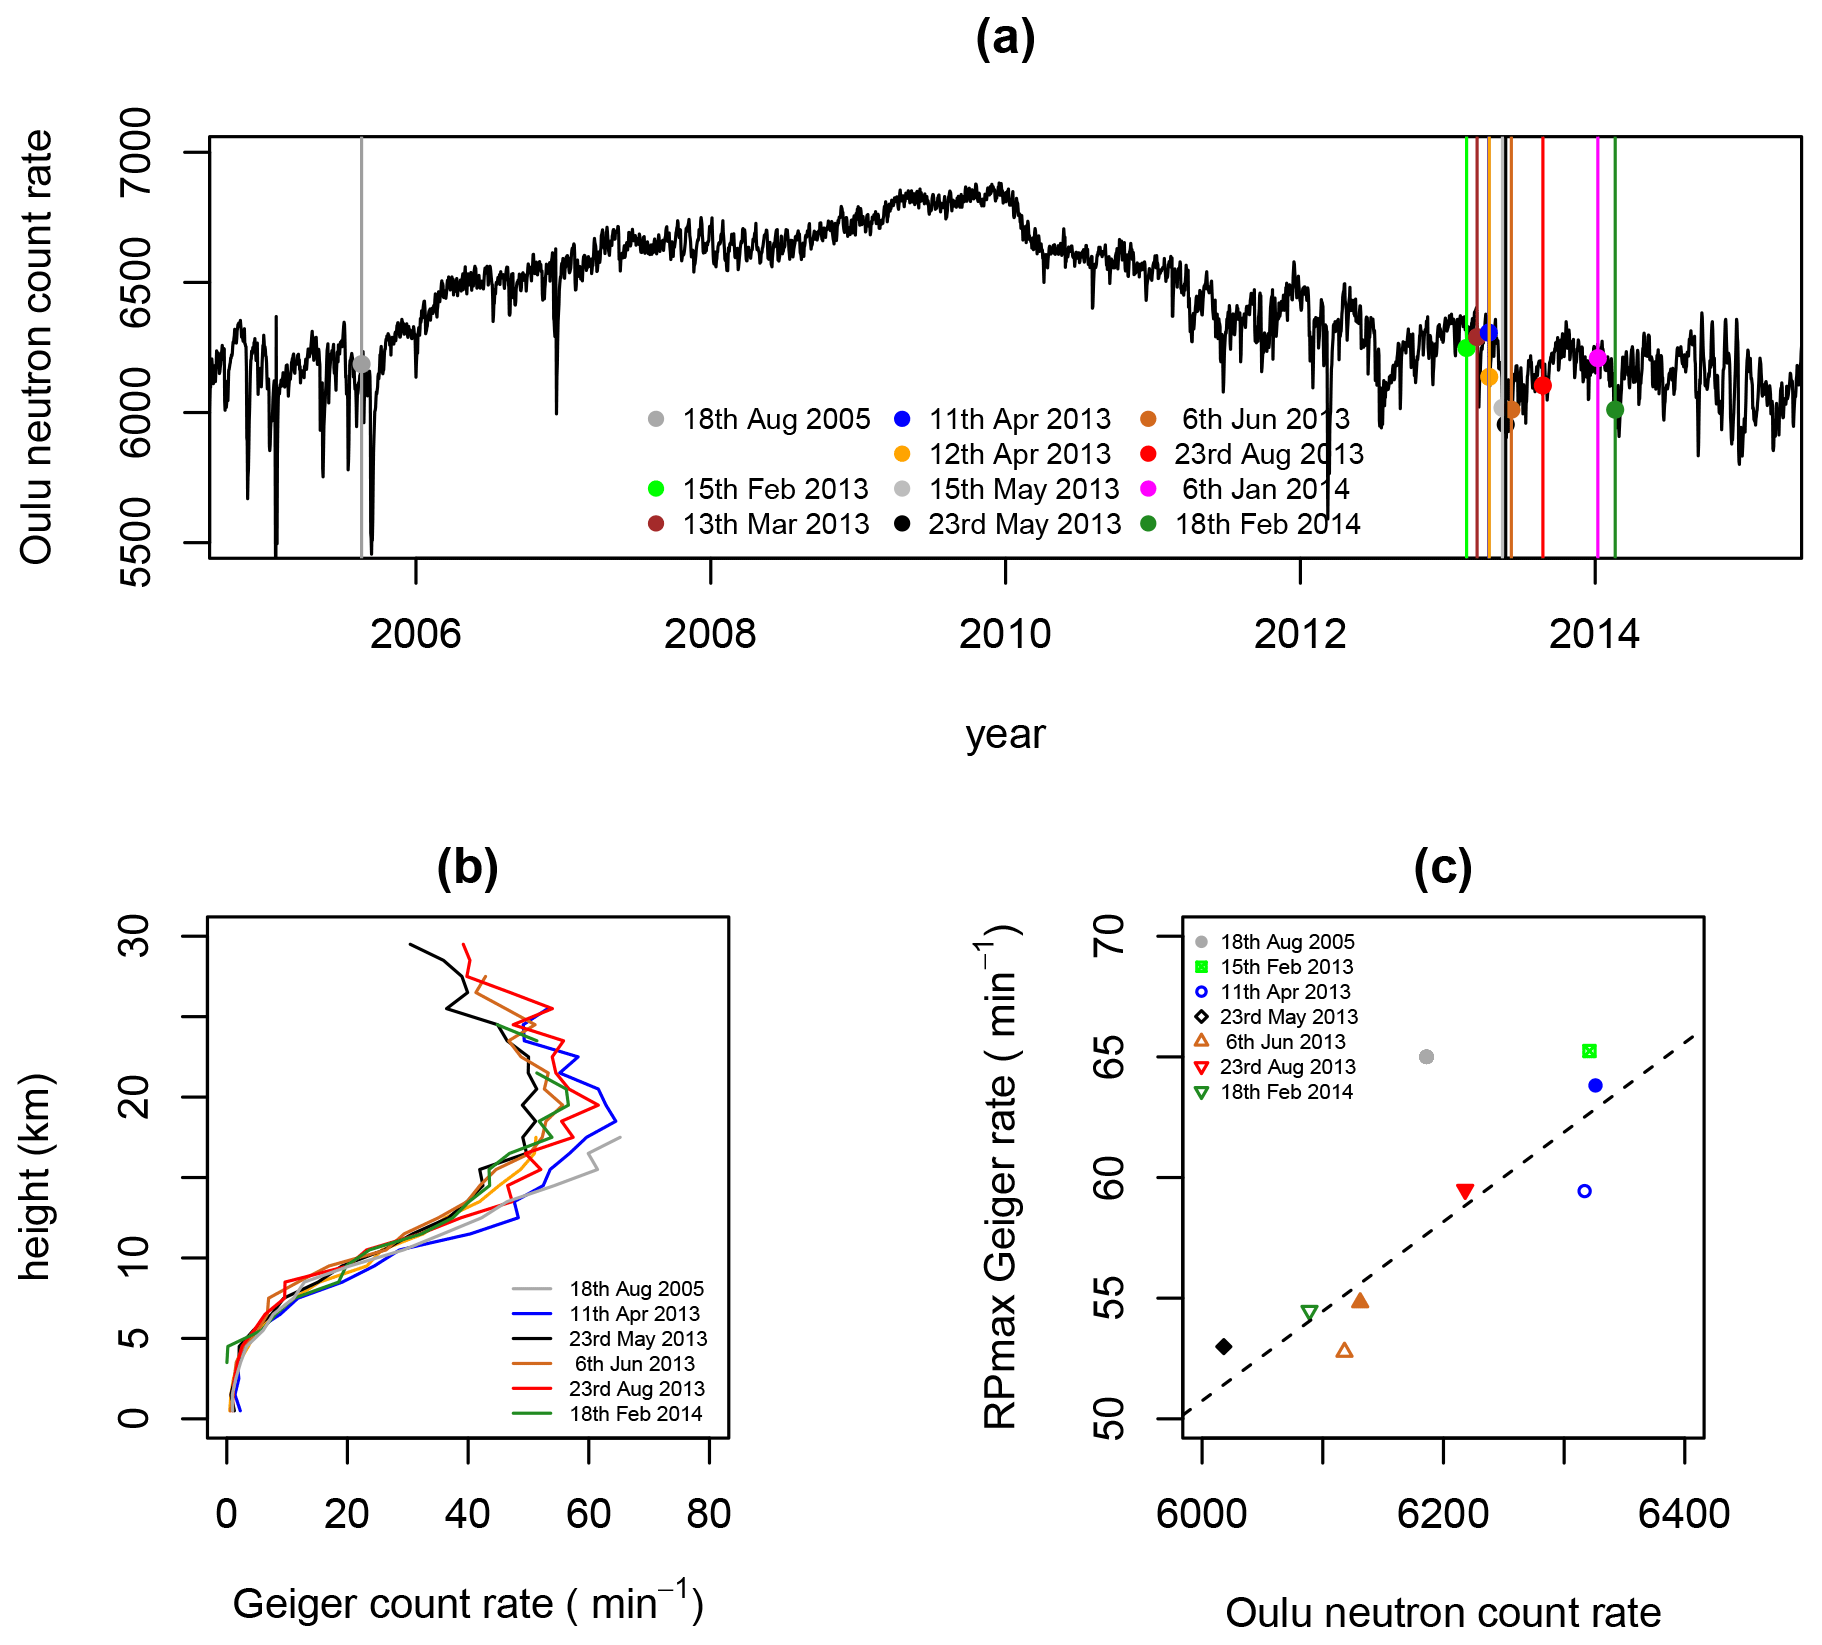
Figure 11Comparison of Geigersonde profiles with the surface neutron monitor at Oulu. (a) Oulu neutron data time series, with Geigersonde flights from Reading marked. (b) Count rate profiles from selected Geigersonde soundings, showing the increase from the surface to the Regener–Pfotzer (RP) maximum at around 20 km altitude. (c) Comparison of the RP maximum Geiger count rate (RPmax) with the Oulu neutron monitor count rate at the same time (solid symbols indicate ascent data, and hollow symbols descent). (Adapted from Harrison et al., 2014.)
A practical alternative is to measure the ion production rate at the height of the radiosonde, using a Geiger tube sensor, in a “Geigersonde”. The tube is triggered by energetic particles primarily from incoming cosmic rays, and the ionisation rate in the nearby air can be calculated from the count rate. To operate a Geiger tube, a high-tension (HT) bias is needed (300 to 500 V) and a counting device which can be read at known intervals. The dimensions of the tube determine the sampling volume and the count rate. As mentioned, this approach has been used on many research radiosondes and, most notably, supported the original indication of a maximum in ionisation – the Regener–Pfotzer (RP) maximum – in the lower stratosphere (Regener and Pfotzer, 1935).
For modern meteorological radiosondes only a relatively small Geiger tube can be carried, with supporting electronics. The neon–halogen-filled LND714 Geiger tube (22 mm long × 5 mm diameter, mass 0.8 g) has now been used in many flights. Although the count rates are relatively small – around 60 counts min−1 at the RP maximum – using a pair of tubes allows some averaging and determination of variability as well as adding confidence if the two count rates are similar. Further, coincident triggering of the two tubes can be used to detect particles which are sufficiently energetic to pass through both tubes (Aplin and Harrison, 2010), although, ideally, the orientation of the tubes should also be monitored. In the Reading Geigersonde implementation (Harrison, 2005b; Harrison et al., 20134), the HT supply is generated using voltage multiplication to avoid the weight of a transformer and separate on-board digital counters are triggered by the Geiger pulses. The counters are interrogated by the PANDORA interface, every 30 s, together with the HT voltage. Separating the counting and data transfer hardware ensures that pulses are not missed during the data transfer to PANDORA.

Figure 12Geigersonde flights during the solar flare of 11 April 2013. (a) Proton flux time series from satellite (GOES-13) detectors for proton energies greater than 10 MeV (light grey line), 30 MeV (dark grey line) and 60 MeV (black line). Vertical lines mark Geigersonde launch times from Reading for 11 and 12 April (dashed and dash dotted), and the burst time beginning the descent on 11 April (dotted). Soundings of (b) count rate and (c) tube coincidence rate from ascent and descent on 11 April (thick and medium lines), and ascent on 12 April (thin line). Grey bands show confidence range (2 standard errors) from undisturbed flights. (d) Air temperature profiles on 11 and 12 April. (Adapted from Nicoll and Harrison, 2014.)
Although the greatest particle flux is generated in the stratosphere, at the RP maximum, some of the secondary particles formed by decay of the primary particles from space reach the surface. Of these, the greatest flux at the surface is that of neutrons. A global network of neutron monitors (NMs) provides continuous monitoring of particles entering the atmosphere. Figure 11a shows the variations obtained by the NM in Oulu, Finland, around the cosmic ray maximum associated with the solar minimum of 2008. Occasional Geigersondes were launched from Reading and other sites in the latter part of this period. These sounding times are marked on Fig. 11a, with the vertical count rate profiles obtained shown in Fig. 11b. By plotting the count rates obtained at the RP maximum against the NM data at the same time, a positive correlation emerges (Fig. 11c), demonstrating the relationship between energetic particles at the surface and ionisation in the lower stratosphere. There is a much poorer, or absent, relationship between NM data and ionisation in the lower troposphere, due to the terrestrial ionisation sources present and the differences between generation of neutrons and the other ionising secondary particles.
The Geigersonde sounding in Fig. 11b with the greatest ionisation at the maximum was in fact associated with a strong solar flare, on 11 April 2013 (Nicoll and Harrison, 2014). This sounding was made opportunistically in response to the flare, with the balloon flight around the maximum of the increase in solar energetic particles, followed by a second flight the day after (Fig. 12a). Above about 9 km, the count rates of the Geigersonde were much greater than those typically found, suggesting an increased flux of ionising particles (Fig. 12b). In addition, the coincidence rate between the two Geiger tubes, which is a measure of the abundance of energetic particles, also greatly increased (Fig. 12c). The balloon burst about an hour after the launch, and the Geigersonde descent encountered reduced, although still exceptional, count and coincidence rates. The sounding made the following day was unremarkable in comparison. Considering again the proton flux variations in Fig. 12a, the lower energy (10 and 30 MeV) protons were still increasing at the time of the flight on the 11 April, but the higher energy (> 60 MeV) protons had become steady, implying that the increased coincidence rate was related to higher energy particles. Using the temperature profiles obtained from the meteorological sensors, an increase in count rates on 11 April 2013 can also be seen to have occurred in the upper troposphere.
4.7 Dusts and volcanic ash
As well as droplets, charging of dust occurs in the lower atmosphere, which is highly likely to be a characteristic of other planetary atmospheres too (Harrison et al., 2016a). Radiosondes instrumented with charge sensors provide a means of observing this. Including an optical aerosol counter allows the properties of the dust to be determined simultaneously. Such instrument packages have been used to sample Saharan dust aloft in Cabo Verde (Nicoll et al., 2011), and during the national emergency associated with the volcanic eruption plume from Eyjafjallajökull in 2010 (Harrison et al., 2010). In both cases, enhanced charging was observed in regions of increased particle concentrations.
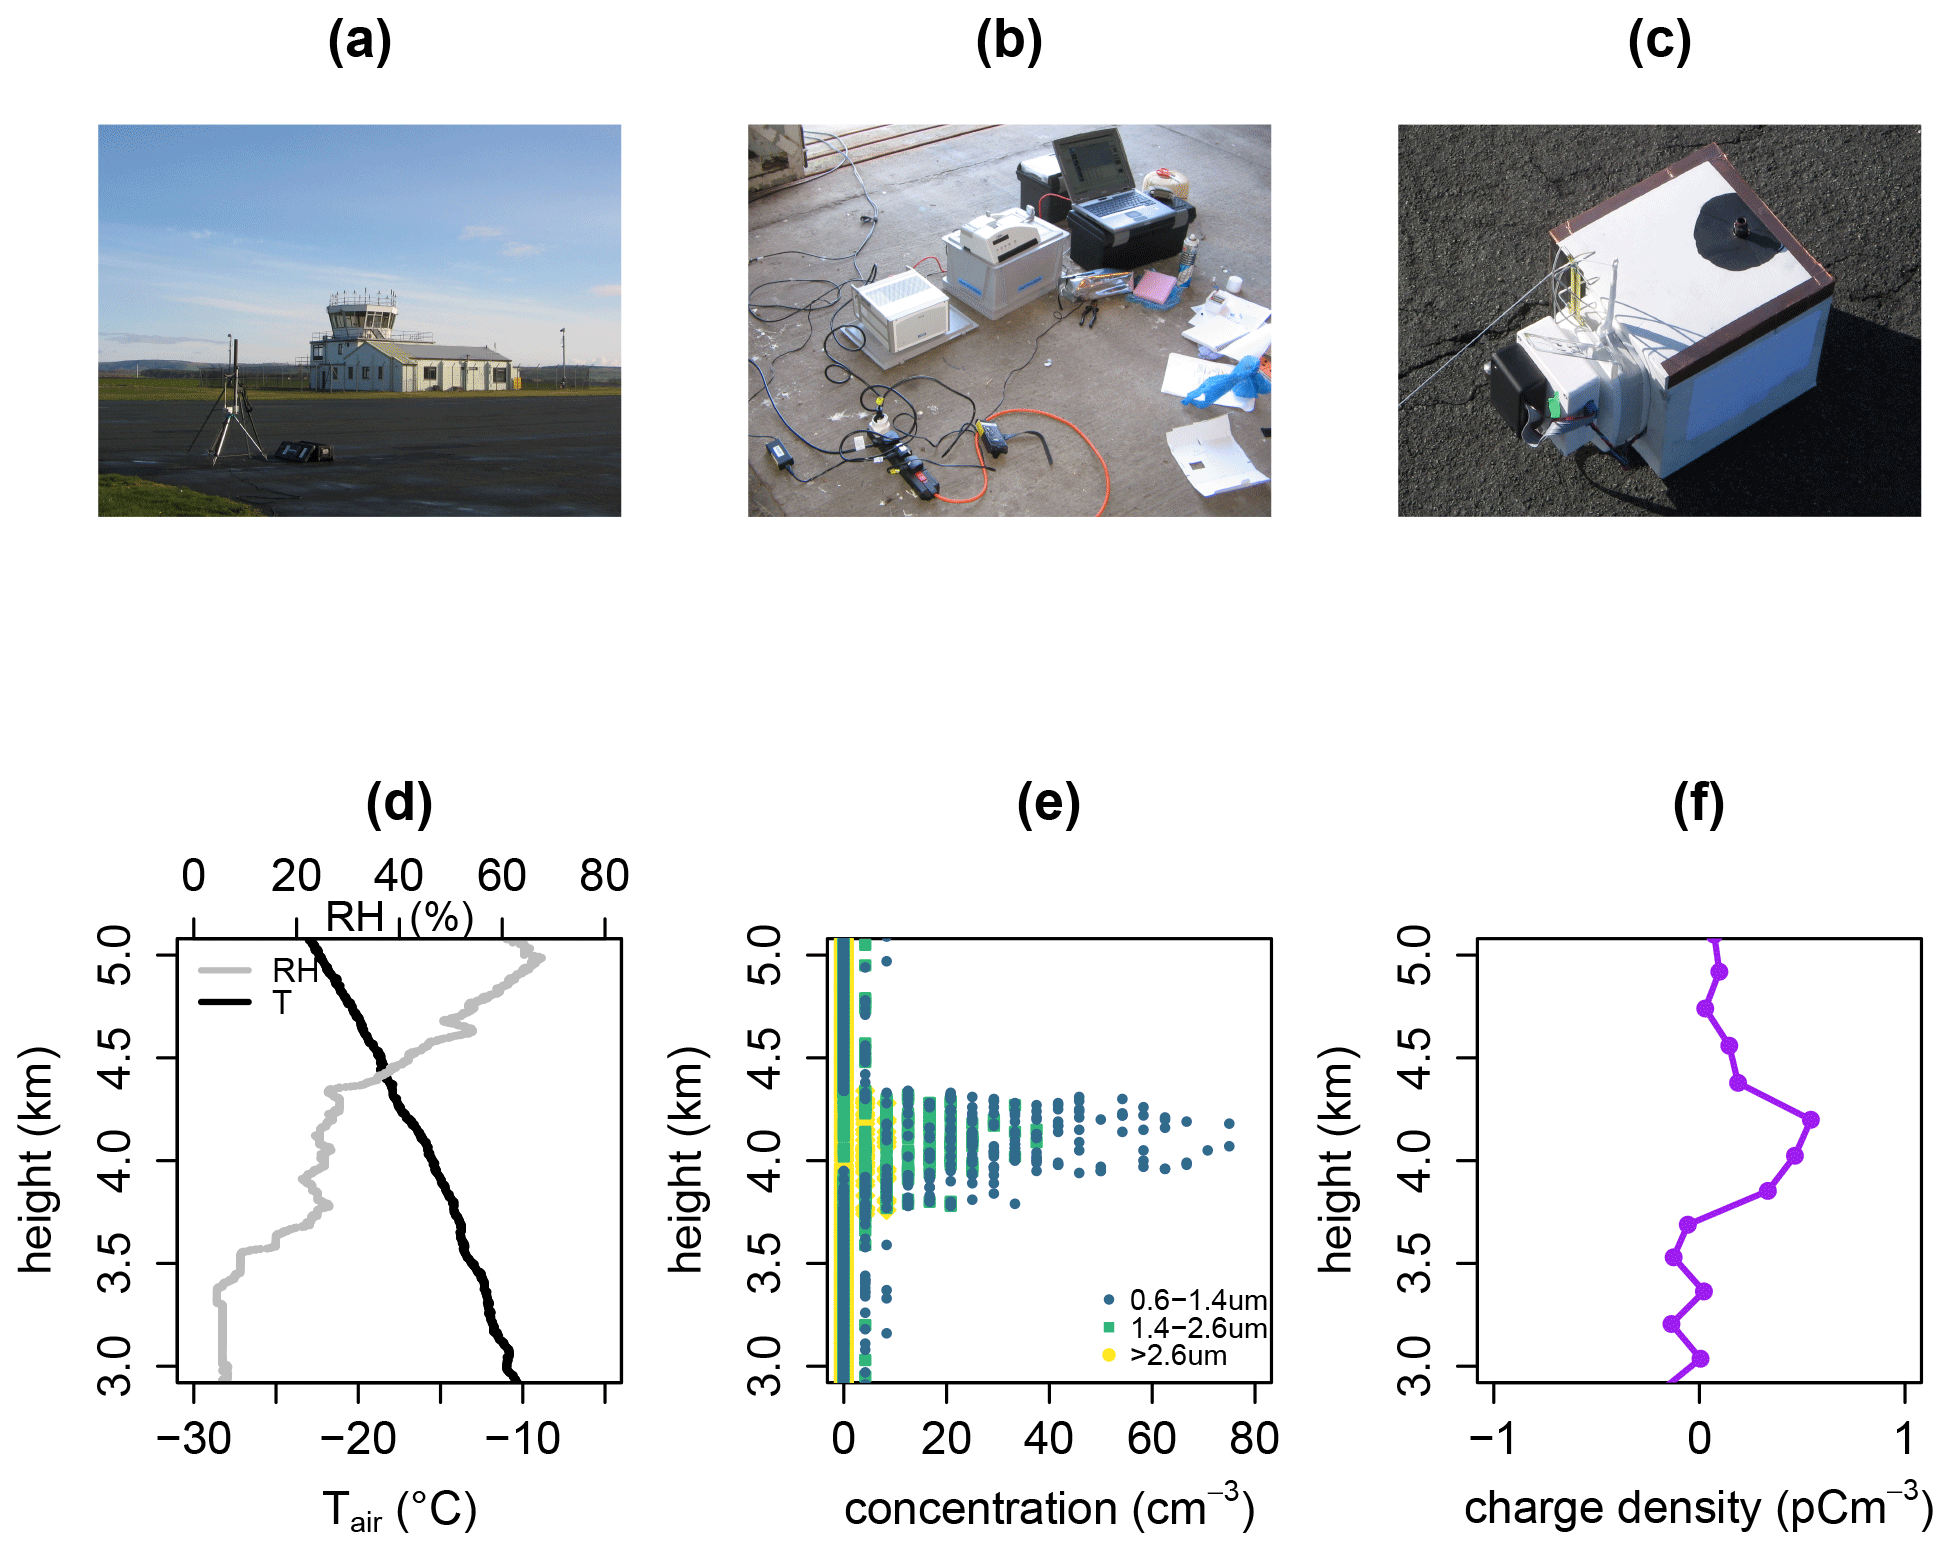
Figure 13Research radiosondes used in an emergency to locate the 2010 Eyjafjallajökull volcanic plume over the UK. (a, b) Temporary receiving station at RAF West Freugh near Stranraer, Scotland, under clear skies, for launch of an enhanced sonde able to measure particle size distribution. (d) Part of the meteorological sounding following launch at 08:30 UTC on 19 April 2010. (e) Profile of plume concentrations for micrometre diameter particles and (f) simultaneous measurement of charge density within the plume region. (Adapted from Harrison et al., 2010.)
The Eyjafjallajökull plume measurements were made following an urgent request from the UK Government, for which a special expedition was undertaken (Fig. 13a and b), using the devices designed for the work in Cabo Verde (Fig. 13c). The sounding demonstrated the presence of small particles aloft, which was not associated with cloud (Fig. 13d and e). Due to the haste16, the charge sensors used in Cabo Verde were not removed. This was fortuitous, as it allowed charge in the plume to be observed (Fig. 13f), which, given the distance from the eruption in Iceland, would have been generated during the atmospheric transport of the plume.
The hazard to aircraft of the volcanic ash is directly related to the mass concentration of the particles present, due to deposits in aircraft engines. Although estimates can be made from satellites, information on the optical properties of the ash, which vary with its composition, are also needed which may not be immediately available. An alternative approach for in situ sensing is to collect the ash and determine the mass concentration directly. One method is to use a vibrating rod method (or “oscillating microbalance”), as also used for supercooled water collection. As the mass accreted on the rod increases, its natural oscillation frequency decreases. With accurate frequency measurements and knowledge of the collection efficiency, the concentration encountered can be found. A radiosonde system for this has been developed (Airey et al., 2017), which combines hardware (phase-locked loop) and software (the fast Hartley transform) approaches for determining the free oscillation frequency. Droplet collection experiments in the Arctic have shown agreement with another vibrating rod system collecting supercooled liquid water (Dexheimer et al., 2019). In the ash collection mode, adhesive is first applied to the vibrating rod. Figure 14 shows the effect of introducing pumice into a region monitored by the optical cloud sensor, also allowing collection by the rod of the oscillating microbalance. Clearly, physical collection will require more material than for optical detection, but, as impaction is the process which presents the hazard to aircraft engines, the application to airspace security is much more direct.
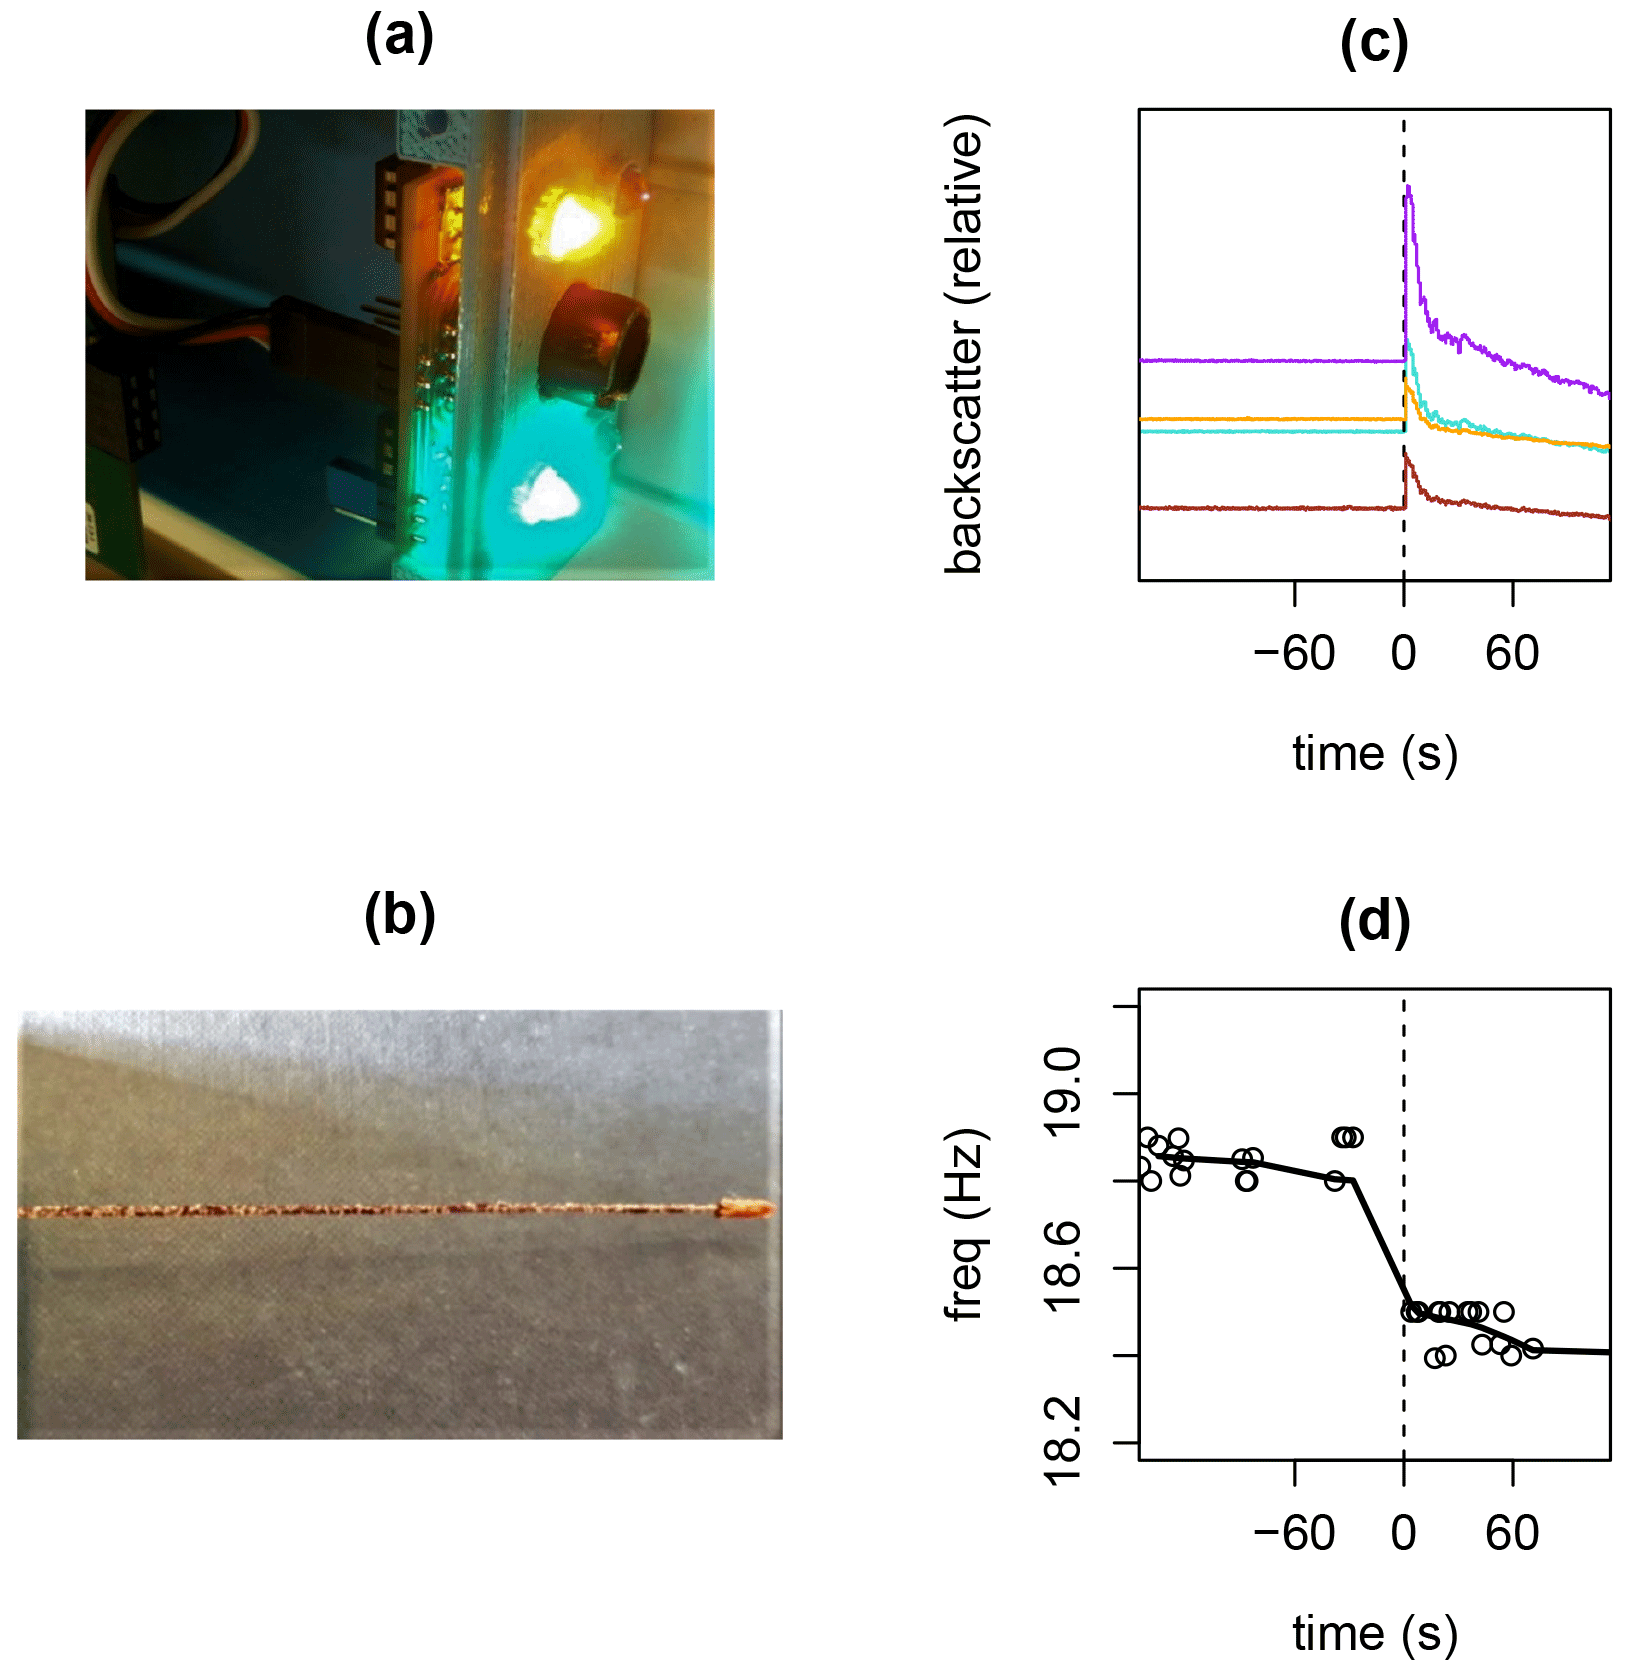
Figure 14Comparison of (a) optical detector and (b) oscillating wire ash collector, shown after the collecting wire became coated with pumice. Panel (c) shows data from the optical detector's four channels (relative responses), during which pumice was introduced, at time 0 s. Panel (d) shows the simultaneous change in vibration frequency of the adhesive-coated collecting wire, as the pumice was collected.
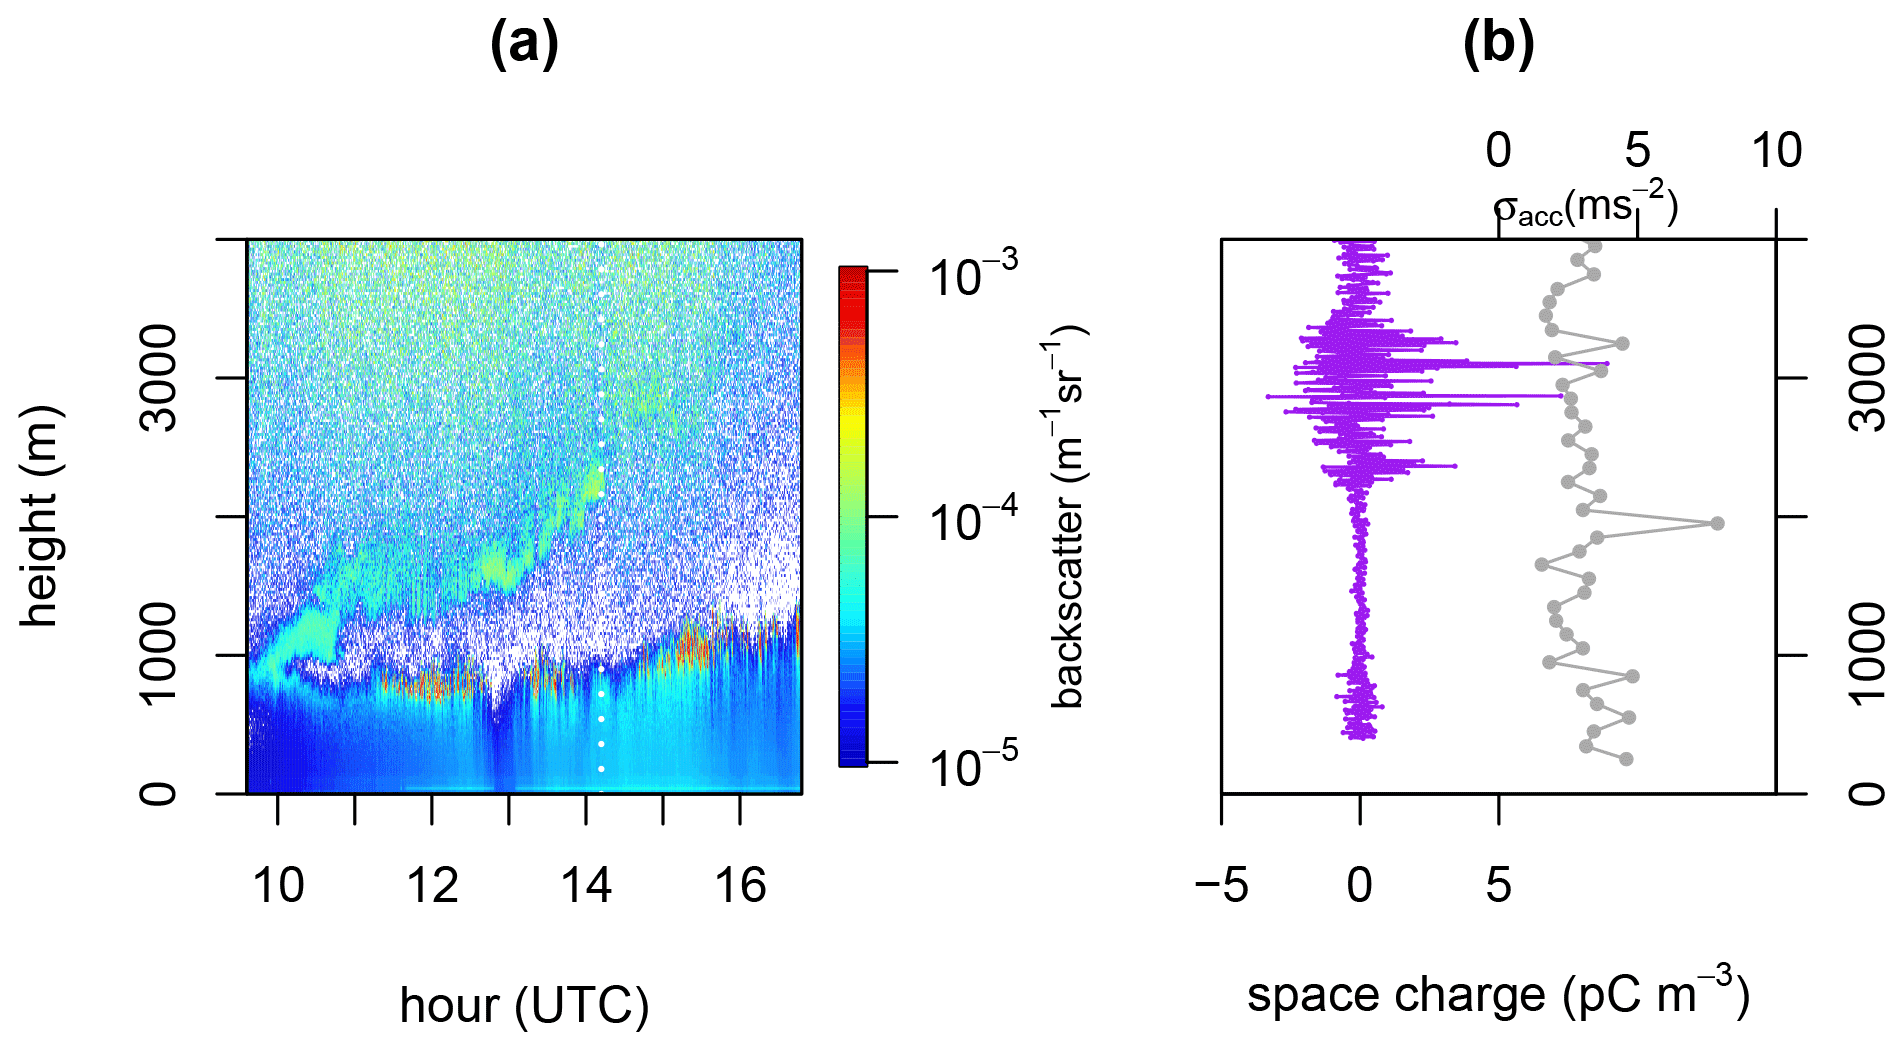
Figure 15Dust cloud over Reading, 16 October 2017, sampled by an instrumented radiosonde released at 14:12 UTC. (a) Ceilometer backscatter profiles around the time of the sounding, with broken cloud around 1000 m through which some dust fall occurred. (b) Charge profile (lines) determined by the balloon electrometer and the standard deviation of the vertical acceleration (lines and dots) encountered by the balloon package, calculated in vertical steps of 100 m. (Adapted from Harrison et al., 2018.)
A further opportunity to sample a dust plume occurred on 16 October 2017, when particles of Saharan dust and smoke from Iberian forest fires were transported across the UK. An instrumented radiosonde was prepared rapidly and launched to allow the plume to be sampled in situ (Harrison et al., 2018). Figure 15 shows a comparison data from a surface ceilometer and the radiosonde's charge and turbulence data. Turbulence was detected at the base and top of the plume, with charge variability throughout the plume. The co-located charge and turbulence supports the hypothesis of charge generation from in-plume turbulence, as for the Eyjafjallajökull plume.
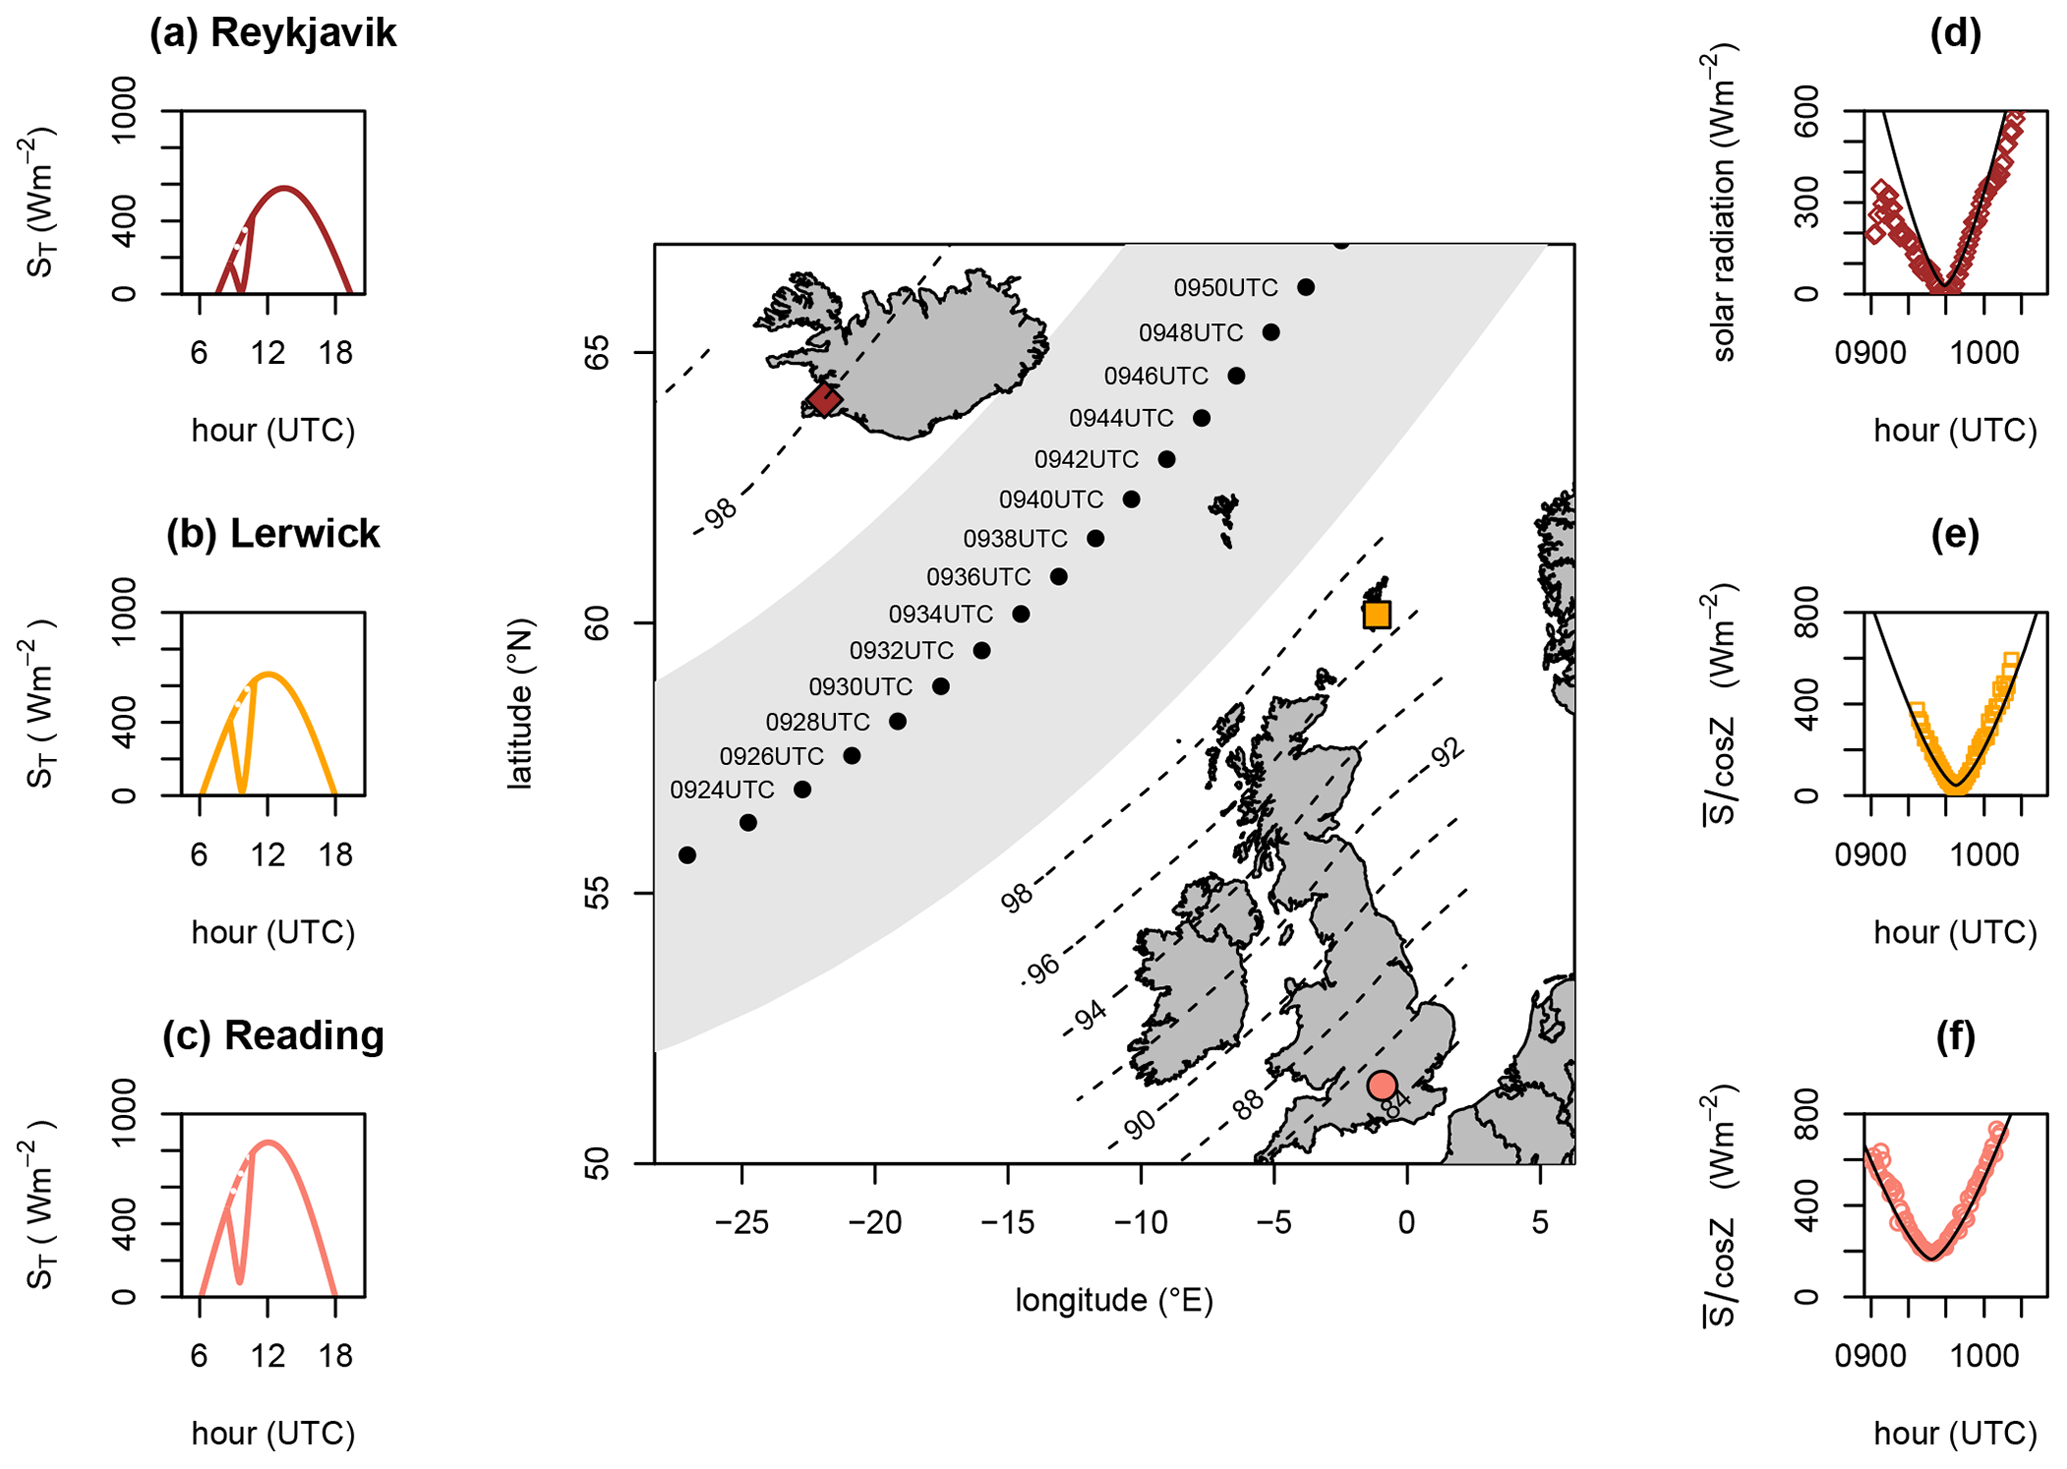
Figure 16Solar radiation variations during the 20 March 2015 eclipse, predicted for (a) Reykjavik, (b) Lerwick and (c) Reading, and (d–f) measured by radiosonde above the same three sites, respectively. The central panel shows the region of totality (grey band) with timings and the partial eclipse fractions. Reykjavik (diamond), Lerwick (square) and Reading (circle) are marked. (Adapted from Harrison et al., 2016b.)
4.8 Coordinated use of research radiosondes
One of the anticipated benefits in using standard radiosondes to carry enhanced instrumentation was to allow existing sites to provide additional soundings, launched by those already familiar with radiosondes. An opportunity for this occurred with the solar eclipse of 20 March 2015. Eclipses are of course well predicted astronomically, but the meteorological circumstances, and how much cloud may occur, are often less predictable. Radiosondes provide the possibility of carrying small science packages above the cloud and into a potentially more consistent measurement environment.
The experiment envisaged was comparison of predicted and measured solar radiation during the eclipse, using the radiosonde solar radiation sensor of Nicoll and Harrison (2012). For this, however, as eclipse opportunities are rare, using multiple launch sites seemed prudent, in case one launch failed due to a balloon burst or instrument malfunction. Hence, as well as from Reading, further coordinated launches on the eclipse path were arranged from the Met Office in Lerwick and the Icelandic Met Office in Reykjavik. Ultimately, three solar radiation radiosondes successfully provided measurements aloft during the eclipse (Harrison et al., 2016b). Figure 16a–c show the predicted solar radiation changes during the eclipse in Reykjavik, Lerwick and Reading, and the consistency with the solar radiation measured by the solar radiation radiosondes launched above these sites (Fig. 16d–f), respectively. The partial aspect of the eclipse in Reading is especially evident (Fig. 16f).
These above-cloud eclipse measurements demonstrate the ease of deployment of the radiosonde systems at other sites. Since then, many successful soundings carrying enhanced sensors have been carried out in Antarctica and in the United Arab Emirates, with, as for the eclipse measurements, the generous support of colleagues working with radiosondes.
The original goal in the late 1990s of obtaining more information on the charge associated with extensive layer clouds, which can now be revisited. With the range of sensors developed, and hundreds of instrument packages deployed, positions of cloud boundaries can now be accurately determined, along with the background ionisation environment, in-cloud turbulence and charge. The expectation from electrostatic theory, outlined in Sect. 4, was that the upper and lower boundaries of extensive layer clouds would carry positively and negatively charged, respectively (Fig. 17a).
From soundings in Europe and Antarctica, charging on the upper and lower boundaries of extensive layer clouds has been confirmed to be widespread (Nicoll and Harrison, 2016) and should be expected to be a global phenomenon. On average, an upper positive charge and lower negative charge do emerge (Fig. 17b). Several factors influence this however, specifically the current flowing through the cloud, the meteorological conditions defining the cloud edge properties and turbulent mixing within the cloud and the background ionisation environment. Whilst important conceptually, the idealised one-dimensional electrostatic case has been found to be incomplete, as it neglects vertical charge exchange by mixing and variability in the vertical gradient from cloudy air to clear air.
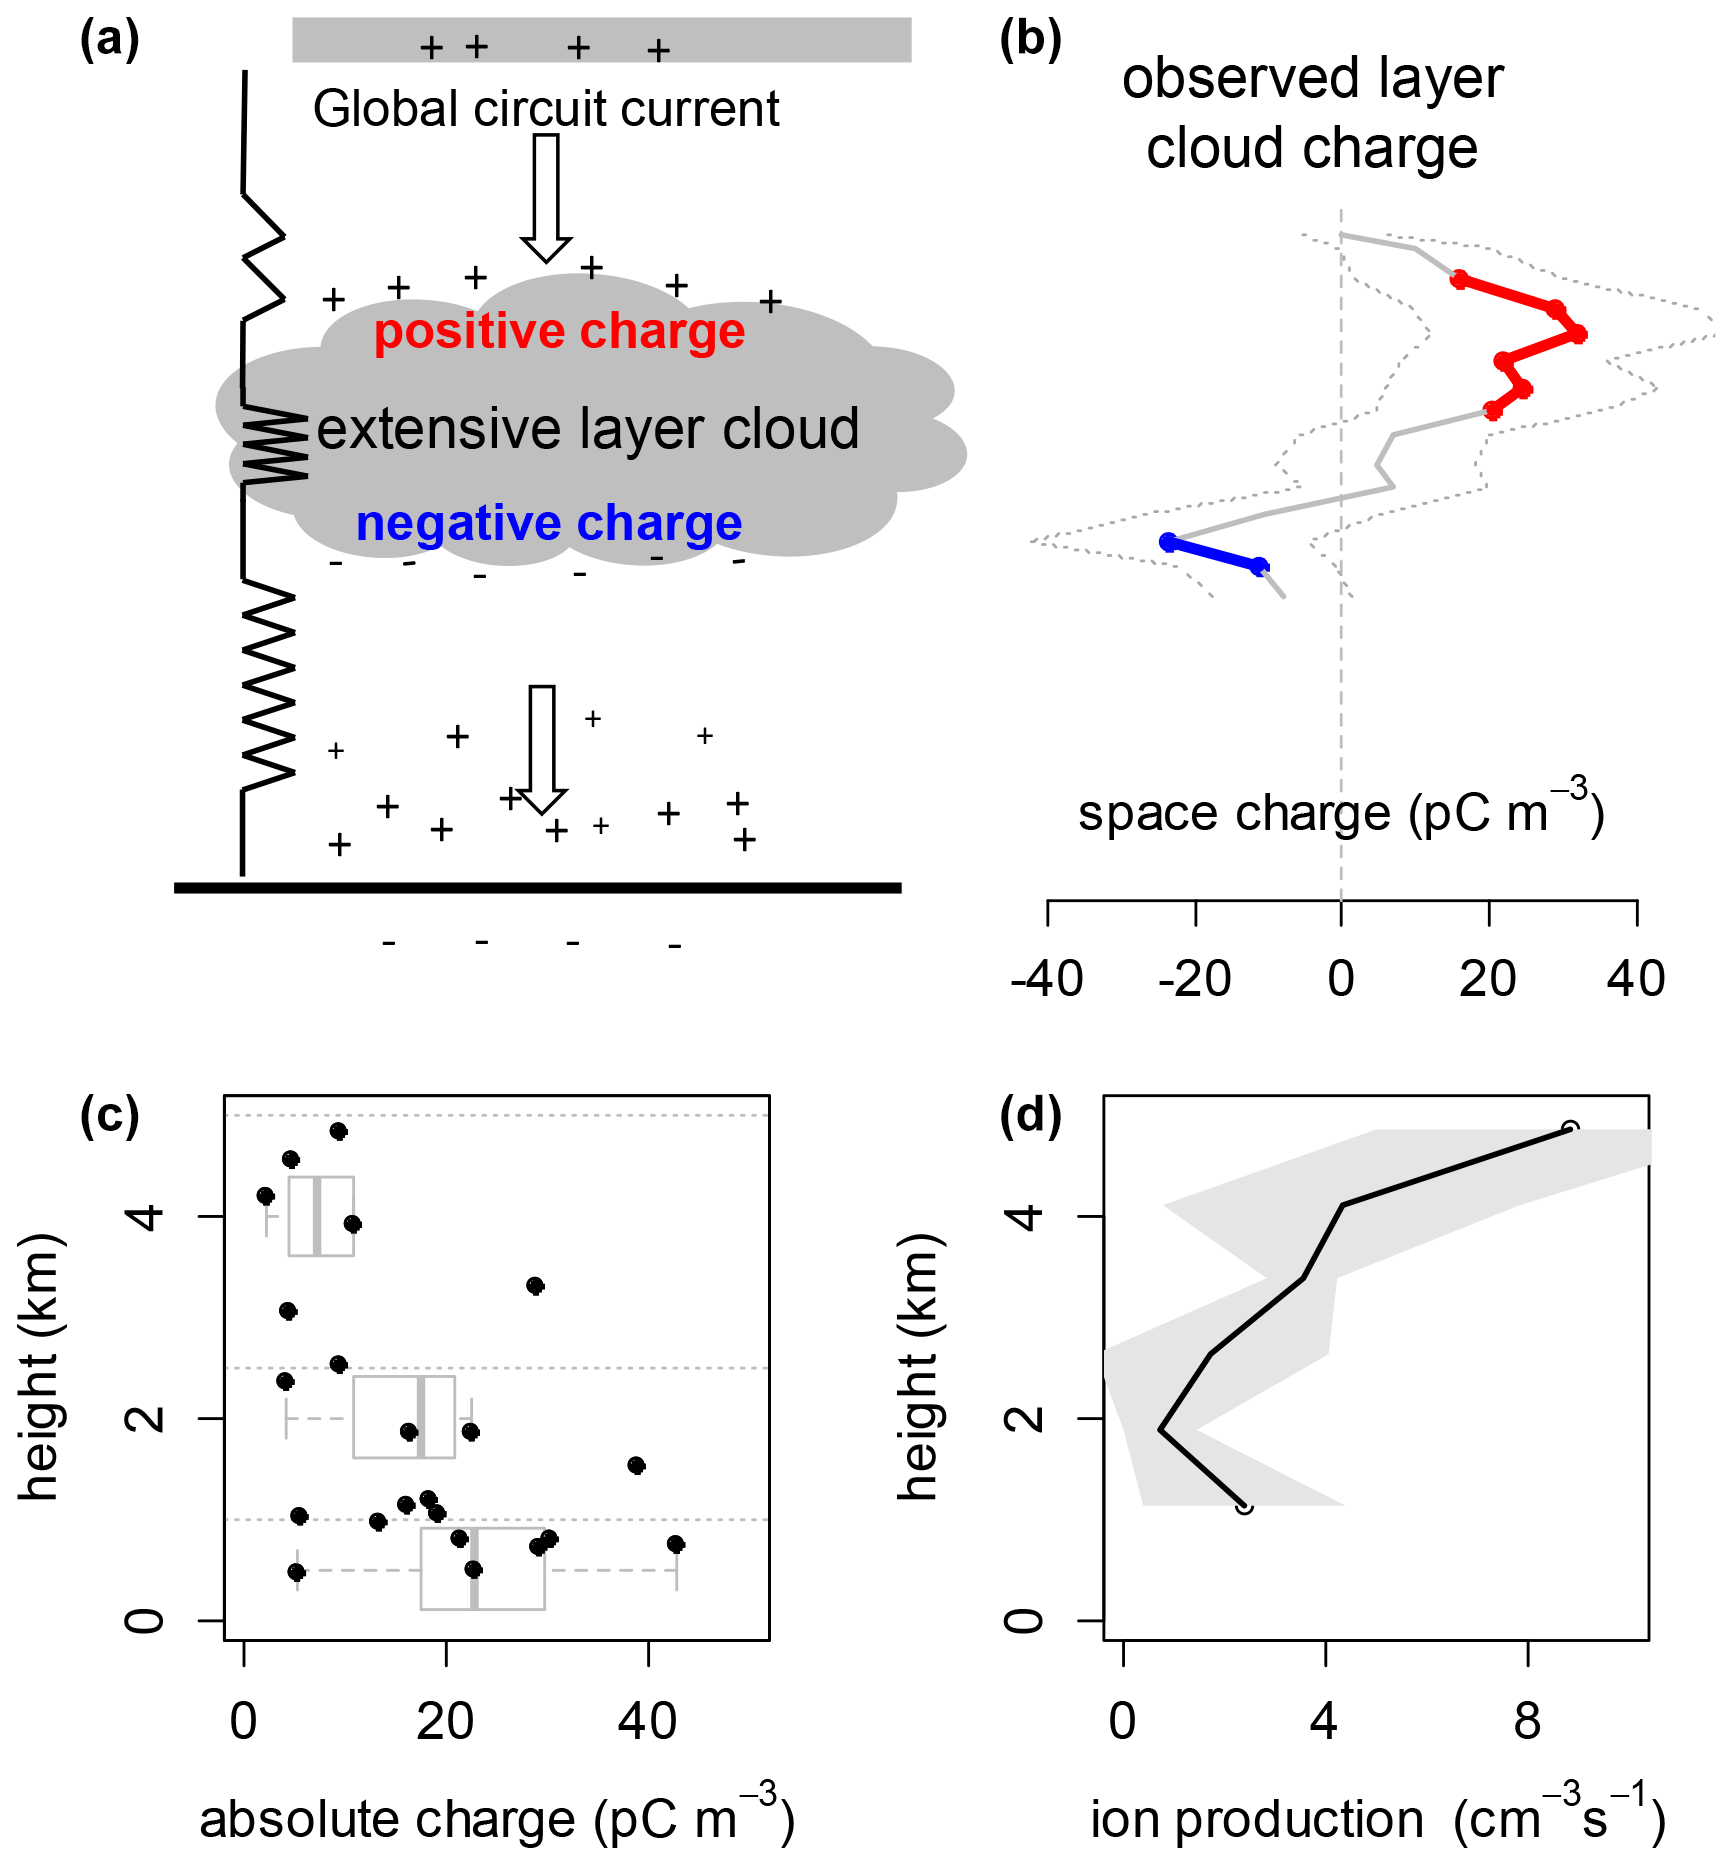
Figure 17Summary of radiosonde findings concerning extensive layer clouds. (a) Expected vertical charge structure around a layer cloud, arising from vertical current flow through a step change in air conductivity at the horizontal cloud boundaries and (b) observed charge structure from soundings in both hemispheres. (c) Absolute charge observed on layer clouds and (d) variation in ion production rate with height, averaged from the same sites as the cloud charge measurements. (Adapted from Nicoll and Harrison, 2016.)
A further finding is that less absolute charge is present at the horizontal cloud boundaries of higher (> 2 km) clouds than for lower (< 2 km) clouds (Fig. 17c), due to the greater air conductivity with height from increased cosmic ray ionisation (Fig. 17d). Low clouds often form where the vertical profile of air conductivity is at its minimum, and hence where the rate of charge leakage away from the droplets is at its least. Cosmic ray ionisation, which is the principal source of air conductivity above the surface, therefore does have a modifying influence on the charge at layer cloud boundaries. The cloud boundary charge will, however, also respond to changes in the global circuit current flowing through the cloud. Neutron monitor data may not be a good predictor for this, as, quite apart from the meteorological variability also influencing the cloud, Geigersondes have shown neutron monitor data to be poorly correlated with the ionising environment at the typical altitudes of low clouds. However, there is no reason to doubt that solar variability does modulate atmospheric electrical parameters in the troposphere, which are coupled directly into the electrical properties of low cloud.
The full effects of droplet charge on cloud processes are still being evaluated. Charge is known to affect droplet collisions, and droplet population modelling shows that droplet growth rates can be enhanced as a result (Harrison et al., 2015; Ambaum et al., 2022).
Radiosondes are widely used by meteorological services worldwide but are currently under-exploited as a platform for research measurements beyond obtaining standard meteorological quantities. Additional measurements can readily be obtained at low cost if standard radiosondes are suitably modified, ensuring that the core meteorological data are unaffected. An effective way to do this has been through providing a standard interfacing subsystem (PANDORA in the cases described), which can be adapted as commercial radiosondes evolve or are superseded, whilst retaining the same connections to the existing individual sensor systems. Meteorological radiosondes can also provide a rapid monitoring capability with many potential launch sites available. This could be in response to monitoring sudden dust clouds or space weather events, or in an emergency during volcanic ash or radioactivity dispersal, which also minimises exposure to operators in a hazardous environment. Many sensors suitable for such work already exist, and if they do not, application-specific devices can constructed, as demonstrated here. Alternatively, some quantities may be obtained serendipitously, by repurposing sensors mass produced for other applications, such as the accelerometers used for turbulence detection.
Each atmospheric sounding represents a single measurement, but, unlike a laboratory measurement, it cannot be repeated due to atmospheric variability. Continuing data reception after the ascent to capture descent data offers one way in which a second sample can be obtained, usually in similar circumstances. Including multiple corroborating sensors on each instrument package has also been found to be highly valuable, as the additional information provided can help distinguish genuinely exceptional data from the merely anomalous. However, the constraints of limited mass and size, finite power and restricted telemetry can force compromises in what can be combined with what. In some respects, these design considerations mimic the tight engineering specification and need for success of a small space mission. Similarly, rare or transient atmospheric circumstances, such as solar eclipses or a dust cloud, will be unforgiving of system failures.
In summary, enhancing meteorological radiosondes as a research strategy has proved successful. It has extended beyond the original expectations to include locating a volcanic ash plume in a national emergency, detecting solar energetic particles entering the lower troposphere and, of special relevance here, offered new insights into data from the Huygens descent probe in Titan's atmosphere.
Having begun with Christiaan Huygens' words, it seems fitting to close with a further quotation, in which, perhaps, there is a prescient hint of the value of research radiosondes:
We may mount from this dull Earth; and viewing it from on high, consider whether Nature has laid out all her cost and finery upon this small speck of Dirt (Huygens, 1722).
No new data are presented here as this is a review paper, with previous publications cited as appropriate.
The University of Reading is making the Geigersondes available commercially. There are no other competing interests.
Publisher's note: Copernicus Publications remains neutral with regard to jurisdictional claims in published maps and institutional affiliations.
I am grateful to many valued co-workers who have helped me considerably with developing instruments, performing experiments and discussing the results. I cannot list them all, but, for their determination with the ups and downs of experimental work, and especially radiosondes, I would like particularly to thank Keri Nicoll, Karen Aplin, Alec Bennett, Graeme Marlton and Martin Airey. Charles Clement (then at Harwell Laboratory) and Helen ApSimon (Imperial College) greatly encouraged my interest in atmospheric electricity.
Some of the work described has been funded by STFC (grant no. ST/K001965/1), NERC (grant nos. NE/H002081/1, NE/P003362/1, and NE/L011514/1) and the Royal Society Paul Instrument Fund.
This paper was edited by Ralf Srama and reviewed by Walter Schmidt and one anonymous referee.
Airey, M. W., Harrison, R. G., Nicoll, K. A., Williams, P. D., and Marlton, G. J.: A miniature oscillating microbalance for sampling ice and volcanic ash from a small airborne platform, Rev. Sci. Instrum., 88, 086108 https://doi.org/10.1063/1.4998971, 2017.
Allee, P. A. and Phillips, B. B.: Measurements of cloud-droplet charge, electric field, and polar conductivities in supercooled clouds, J. Meteorol., 16, 405–410, https://doi.org/10.1175/1520-0469(1959)016<0405:MOCDCE>2.0.CO;2, 1959.
Anderson, A. D.: Free-air turbulence, J. Atmos. Sci., 14, 477–494, https://doi.org/10.1175/1520-0469(1957)014<0477:FAT>2.0.CO;2, 1957.
Ambaum, M. H. P., Auerswald, T., and Eaves, R.: Enhanced attraction between drops carrying fluctuating charge distributions, P. Roy. Soc Lond. A Mat., 478, 2257, https://doi.org/10.1098/rspa.2021.0714, 2022.
Aplin, K. L.: Atmospheric electricity at Durham: the scientific contributions and legacy of J. A. (“Skip”) Chalmers (1904–1967), Hist. Geo Space. Sci., 9, 25–35, https://doi.org/10.5194/hgss-9-25-2018, 2018.
Aplin, K. L. and Harrison, R. G.: A computer-controlled Gerdien atmospheric ion counter, Rev. Sci. Instrum., 71, 3037–3041, https://doi.org/10.1063/1.1305511, 2000.
Aplin, K. L. and Harrison, R. G.: A self-calibrating programmable mobility spectrometer for atmospheric ion measurements, Rev. Sci. Instrum., 72, 3467–3469, https://doi.org/10.1063/1.1382634, 2001.
Aplin, K. L. and Harrison, R. G.: Compact cosmic ray detector for unattended atmospheric ionization monitoring, Rev. Sci. Instrum., 81, 124501, https://doi.org/10.1063/1.3514986, 2010.
Aplin, K. L. and Harrison, R. G.: Lord Kelvin's atmospheric electricity measurements, Hist. Geo Space. Sci., 4, 83–95, https://doi.org/10.5194/hgss-4-83-2013, 2013.
Bennett, A. J. and Harrison, R. G.: Surface measurement system for the atmospheric electrical vertical conduction current density, with displacement current density correction, J. Atmos. Sol.-Terr. Phy., 70, 1373–1381, https://doi.org/10.1016/j.jastp.2008.04.014, 2008.
Berger, G. and Ait Amar, S.: The noteworthy involvement of Jacques de Romas in the experiments on the electric nature of lightning, J. Electrostat., 67, 531–535 https://doi.org/10.1016/j.elstat.2009.01.033, 2009.
Brewer, A. W. and Milford, J. R.: The Oxford-Kew Ozone Sonde, P. Roy. Soc Lond. A Mat., 256, 470, https://doi.org/10.1098/rspa.1960.0120, 1960.
Canton, J.: A Letter to the Right Honourable the Earl of Macclesfield, President of the Royal Society, concerning Some New Electrical Experiments, Philos. T. R. Soc. Lond., 48, 780–785, https://doi.org/10.1098/rstl.1753.0093, 1753.
Carslaw, K. S., Harrison, R. G., and Kirkby, J.: Cosmic rays, clouds and climate, Science, 298, 1732–1737, https://doi.org/10.1126/science.1076964, 2002.
Chubb, J. N.: Two designs of “Field Mill” type fieldmeters not requiring earthing of rotating chopper, IEEE T. Ind. Appl., 26, 1178–1181, https://doi.org/10.1109/28.62405, 1990.
Chubb, J. N.: Experience with electrostatic fieldmeter instruments with no earthing of the rotating chopper, Inst. Phys. Conf. Ser., 163, 443–446, 1999.
Clement, C. F. and Harrison, R. G.: The charging of radioactive aerosols, J. Aerosol Sci., 23, 481–504, https://doi.org/10.1016/0021-8502(92)90019-R, 1992.
Dexheimer, D., Airey, M., Roesler, E., Longbottom, C., Nicoll, K., Kneifel, S., Mei, F., Harrison, R. G., Marlton, G., and Williams, P. D.: Evaluation of ARM tethered-balloon system instrumentation for supercooled liquid water and distributed temperature sensing in mixed-phase Arctic clouds, Atmos. Meas. Tech., 12, 6845–6864, https://doi.org/10.5194/amt-12-6845-2019, 2019.
Dickinson, R. E.: Solar variability and the lower atmosphere, B. Am. Meteorol. Soc., 65, 1240–1248, https://doi.org/10.1175/1520-0477(1975)056<1240:SVATLA>2.0.CO;2, 1975.
Fastrup, B., Pedersen, E., Lillestol, E., et al.: Addendum to the CLOUD proposal, arXiv [preprint], arXiv:physics/0104068, 23 April 2001.
Gensdarmes, F., Boulard, D., and Renoux A.: Electrical charging of radioactive aerosols-comparison of the Clement-Harrison models with new experiments, J. Aerosol Sci., 32, 1437–1458, https://doi.org/10.1016/0021-8502(92)90019-R, 2001.
Gerdien, H.: Ein neuer Apparat zur Messung der elektrischen Leitfähigkeit der Luft, Nachrichten von der Gesellschaft der Wissenschaften zu Göttingen, 1905, 240–251, 1905.
Gilbert, W.: De Magnete, Magneticisque Corporibus, et de Magno Magnete Tellure, Book 2, Chap. 2 [translated by: Fleury Mottelay, P., John Wiley, 1895], 1600.
Glaisher, J.: Account of Meteorological and Physical Observations in Balloon Ascents, Report of the British Association for the Advancement of Science (1862), 376–503, 1862.
Gringel, W. and Muehleisen, R.: Saharan dust concentration on the troposphere for the North Atlantic derived from measurements of air conductivity, Beiträge zur Physik der Atmosphäre, 51, 121–128, 1978.
Harnwell, G. P. and Van Voorhis, S. N.: An electrostatic generating voltmeter, Rev. Sci. Instrum., 4, 540–542, https://doi.org/10.1063/1.1748995, 1933.
Harrison, R. G.: A portable picoammeter for atmospheric electrical use, Inst. Phys. Conf. Ser., 143, 223–226, 1995a.
Harrison, R. G.: A null method for electric field measurement, Inst. Phys. Conf. Ser., 143, 319–322, 1995b.
Harrison, R. G.: An atmospheric electrical voltmeter follower, Rev. Sci. Instrum., 67, 2636–2638, https://doi.org/10.1063/1.1147180, 1996.
Harrison, R. G.: A noise-rejecting current amplifier for surface atmospheric ion flux measurements, Rev. Sci. Instrum., 68, 3563–3565, https://doi.org/10.1063/1.1148323, 1997.
Harrison, R. G.: A balloon-carried electrometer for high-resolution atmospheric electric field measurements in clouds, Rev. Sci. Instrum., 72, 2738–2741, https://doi.org/10.1063/1.1369639, 2001.
Harrison, R. G.: A wide-range electrometer voltmeter for atmospheric measurements in thunderstorms and disturbed meteorological conditions, Rev. Sci. Instrum., 73, 482–483, https://doi.org/10.1063/1.1435840, 2002.
Harrison, R. G.: Detection of charged aerosol layers in the troposphere, Proc. 15th Annual Conference, The Aerosol Society, 14–15 April 2004, Manchester, 92–95, 2004.
Harrison, R. G.: Inexpensive multichannel digital data acquisition system for a meteorological radiosonde, Rev. Sci. Instrum., 76, 026103, https://doi.org/10.1063/1.1841971, 2005a.
Harrison, R. G.: Meteorological radiosonde interface for atmospheric ion production rate measurements, Rev. Sci. Instrum., 76, 126111, https://doi.org/10.1063/1.2149005, 2005b.
Harrison, R. G.: Meteorological measurements and instrumentation, Wiley, https://doi.org/10.1002/9781118745793, 2014.
Harrison, R. G.: Eyjafjallajökull, Minor Matters, Morris Minor Owners Club, 42, p. 15, 2021.
Harrison, R. G. and Aplin, K. L.: Femtoampere current reference stable over atmospheric temperatures, Rev. Sci. Instrum., 71, 3231–3232, https://doi.org/10.1063/1.1304859, 2000a.
Harrison, R. G. and Aplin, K. L.: A multimode electrometer for atmospheric ion measurements, Rev. Sci. Instrum., 71, 4683–4685, https://doi.org/10.1063/1.1327303, 2000b.
Harrison, R. G. and Aplin, K. L.: Nineteenth century Parisian smoke variations inferred from Eiffel Tower atmospheric electrical observations, Atmos. Environ., 37, 5319–5324, https://doi.org/10.1016/j.atmosenv.2003.09.042, 2003.
Harrison, R. G. and ApSimon, H. M.: Krypton-85 pollution and atmospheric electricity, Atmos. Environ., 28, 637–648, https://doi.org/10.1016/1352-2310(94)90041-8, 1994.
Harrison, R. G. and Carslaw, K. S.: Ion–aerosol–cloud processes in the lower atmosphere, Rev. Geophys., 41, 1012, https://doi.org/10.1029/2002RG000114, 2003.
Harrison, R. G. and Hogan, R. J.: In-situ atmospheric turbulence measurement using the terrestrial magnetic field – a compass for a radiosonde, J. Atmos. Ocean. Tech., 23, 517–523, https://doi.org/10.1175/JTECH1860.1, 2006.
Harrison, R. G. and Marlton, G. J.: Fair weather electric field meter for atmospheric science platforms, J. Electrostat., 107, 103489, https://doi.org/10.1016/j.elstat.2020.103489, 2020.
Harrison, R. G. and Nicoll, K. A.: Active optical detection of cloud from a balloon platform, Rev. Sci. Instrum., 85, 066104 https://doi.org/10.1063/1.4882318, 2014.
Harrison, R. G. and Nicoll, K. A.: Fair weather criteria for atmospheric electricity measurements, J. Atmos. Sol.-Terr. Phy., 179, 239–250, https://doi.org/10.1016/j.jastp.2018.07.008, 2018.
Harrison, R. G., Rogers, G. W., and Hogan, R. J.: A three-dimensional magnetometer for motion sensing of a balloon-carried atmospheric measurement package, Rev. Sci. Instrum., 78, 124501, https://doi.org/10.1063/1.2815349, 2007a.
Harrison, R. G., Bingham, R., Aplin, K., Kellett, B., Carslaw, K., and Haigh, J.: Clouds in atmospheric physics, Astron. Geophys., 48, 2.07–2.07, https://doi.org/10.1111/j.1468-4004.2007.48207.x, 2007b.
Harrison, R. G., Heath, A. M., Hogan, R. J., and Rogers, G. W.: Comparison of balloon-carried atmospheric motion sensors with Doppler lidar turbulence measurements, Rev. Sci. Instrum., 80, 026108, https://doi.org/10.1063/1.3086432, 2009.
Harrison, R. G., Nicoll, K. A., Ulanowski, Z., and Mather, T. A.: Self-charging of the Eyjafjallajökull volcanic ash plume, Environ. Res. Lett., 5, 024004, https://doi.org/10.1088/1748-9326/5/2/024004, 2010.
Harrison, R. G., Nicoll, K. A., and Lomas, A. G.: Programmable data acquisition system for research measurements from meteorological radiosondes, Rev. Sci. Instrum., 83, 036106, https://doi.org/10.1063/1.3697717, 2012.
Harrison, R. G., Nicoll, K. A., and Lomas, A. G.: Geiger tube coincidence counter for lower atmosphere radiosonde measurements, Rev. Sci. Instrum., 84, 076103, https://doi.org/10.1063/1.4815832, 2013.
Harrison, R. G., Nicoll, K. A., and Ambaum, M. H. P.: On the microphysical effects of observed cloud edge charging, Q. J. Roy. Meteor. Soc., 141, 2690–2699, https://doi.org/10.1002/qj.2554, 2015.
Harrison, R. G., Barth, E., Esposito, F., Merrison, J., Montmessin, F., Aplin, K. L., Borlina, C., Berthelier, J. J., Déprez, G., Farrell, W. M., Houghton, I. M. P., Renno, N. O., Nicoll, K. A., Tripathi, S. N., and Zimmerman, M.: Applications of electrified dust and dust devil electrodynamics to Martian atmospheric electricity, Space Sci. Rev., 203, 299–345, https://doi.org/10.1007/s11214-016-0241-8, 2016a.
Harrison, R. G., Marlton, G. J., Williams, P. D., and Nicoll, K. A.: Coordinated weather balloon solar radiation measurements during a solar eclipse, Philos. T. R. Soc. A, 374, 20150221, https://doi.org/10.1098/rsta.2015.0221, 2016b.
Harrison, R. G., Nicoll, K. A., Aplin, K. L.: Evaluating stratiform cloud base charge remotely, Geophys. Res. Lett., 44, 6407–6412, https://doi.org/10.1002/2017GL073128, 2017a.
Harrison, R. G., Marlton, G. J., Nicoll, K. A., Airey, M. W., and Williams, P. D.: A self-calibrating wide range electrometer for in-cloud measurements, Rev. Sci. Instrum., 88, 126109 https://doi.org/10.1063/1.5011177, 2017b.
Harrison, R. G., Nicoll, K. A., Marlton, G. J., Ryder, C. L., and Bennett, A. J.: Saharan dust plume charging observed over the UK, Environ. Res. Lett., 13, 054018, https://doi.org/10.1088/1748-9326/aabcd9, 2018.
Harrison, R. G., Marlton, G. J., Aplin, K. L., and Nicoll, K. A.: Shear-induced electrical changes in the base of thin layer-cloud, Q. J. Roy. Meteor. Soc., 145, 3667–3679, https://doi.org/10.1002/qj.3648, 2019.
Harrison, R. G., Nicoll, K. A., Mareev, E., Slyunyaev, N., and Rycroft, M. J.: Extensive layer clouds in the global electric circuit: their effects on vertical charge distribution and storage, P. Roy. Soc Lond. A Mat., 476, 20190758, https://doi.org/10.1098/rspa.2019.0758, 2020.
Hess, V. F.: Uber Beobachtungen der durchdringenden Strahlung bei sieben Freiballonfahrten, Phys. Z., 13, 1084, 1912.
Hill, G. E. and Woffinden, D. S.: A balloon borne instrument for the measurement of vertical profiles of supercooled liquid water concentration, J. Appl Meteorol., 19, 1285–1292, https://doi.org/10.1175/1520-0450(1980)019<1285:ABIFTM>2.0.CO;2, 1980.
Howard, L.: Seven Lectures on Meteorology, 2nd Edn., Harvey and Dalton, 1843.
Huygens, C.: Letter to E. W. von Tschirnhaus, 10th March no. 2452, in: Christiaan Huygens, Oeuvres complètes. Tome IX. Correspondance 1685–1690 Martinus Nijhoff, Den Haag 1901, edited by: Bosscha Jr., J., available at: https://www.dbnl.org/titels/titel.php?id=huyg003oeuv09 (last access: 19 January 2022), 1687.
Huygens, C.: The Celestial Worlds Discover'd, Or, Conjectures Concerning the Inhabitants, Plants and Productions of the Worlds in the Planets, 2nd Edn., James Knapton, London, p. 10, 1722.
Idrac, P. and Bureau, R.: Expériences sur la propagation des ondes radiotélégraphiques en altitude, Comptes Rendues, 184, 691–692, 1927.
Jones, O. C., Maddever, R. S., and Sanders, J. H.: Radiosonde measurement of vertical electrical field and polar conductivity, J. Sci. Instrum., 36, 24–28, 1959.
Koenigsfeld, L.: Observations on the relations between atmospheric potential gradient on the ground and in altitude, and artificial radioactivity, in: Recent advances in atmospheric electricity, edited by: Smith, L. G., Pergamon Press, 101–109, 1958.
Lorenz, R. D.: Comment on “In-situ atmospheric turbulence measurement using the terrestrial magnetic field – a compass for a radiosonde”, J. Atmos. Ocean. Tech., 24, 1519–1520, https://doi.org/10.1175/JTECH2059.1, 2007.
Lorenz, R. D., Zarnecki, J. C., Towner, M. C., Leese, M. R., Ball, A. J., Hathi, B., Hagermann, A., and Ghafoor, N. A. L.: Descent motions of the Huygens probe as measured by the Surface Science Package (SSP): Turbulent evidence for a cloud layer, Planet. Space Sci., 55, 1936–1948, https://doi.org/10.1016/j.pss.2007.04.007, 2007.
Lueder, H.: Elektrische Registrierung von heranziehenden Gewittern und die Feinstruktur des luftelekrischen Gewitterfeldes, Meteorol. Z., 60, 340–351, 1943.
Mapleson, W. W. and Whitlock, W. S.: Apparatus for the accurate and continuous measurement of the earth's electric field, J. Atmos. Terr. Phys., 7, 61–72, https://doi.org/10.1016/0021-9169(55)90107-0, 1955.
Marlton, G. J., Harrison, R. G., and Nicoll, K. A.: Atmospheric point discharge current measurements using a temperature-compensated logarithmic current amplifier, Rev. Sci. Instrum., 84, 066103, https://doi.org/10.1063/1.4810849, 2013.
Marlton, G. J., Harrison, R. G., Nicoll, K. A., and Williams, P. D.: A balloon-borne accelerometer technique for measuring atmospheric turbulence, Rev. Sci. Instrum., 86, 016109, https://doi.org/10.1063/1.4905529, 2015.
Marsh, N. D. and Svensmark, H.: Low cloud properties influenced by cosmic rays, Phys. Rev. Lett., 85, 5004–5007, https://doi.org/10.1103/PhysRevLett.85.5004, 2000.
Ney, E. P.: Cosmic radiation and the weather, Nature, 183, 451–452, 1959.
Nicoll, K. A.: Measurements of atmospheric electricity aloft, Surv. Geophys., 33, 991–1057, https://doi.org/10.1007/s10712-012-9188-9, 2012.
Nicoll, K.: A self-calibrating electrometer for atmospheric charge measurements from a balloon platform, Rev. Sci. Instrum., 84, 096107, https://doi.org/10.1063/1.4821500, 2013.
Nicoll, K. A. and Harrison, R. G.: A double-Gerdien instrument for simultaneous bipolar air conductivity measurements on balloon platforms, Rev. Sci. Instrum., 79, 084502, https://doi.org/10.1063/1.2964927, 2008.
Nicoll, K. A. and Harrison, R. G.: A lightweight balloon-carried cloud charge sensor, Rev. Sci. Instrum., 80, 014501 https://doi.org/10.1063/1.3065090, 2009.
Nicoll, K. A. and Harrison, R. G.: Balloon-borne disposable radiometer, Rev. Sci. Instrum., 83, 025111, https://doi.org/10.1063/1.3685252, 2012.
Nicoll, K. A. and Harrison, R. G.: Detection of lower tropospheric responses to solar energetic particles at mid-latitudes, Phys. Rev. Lett., 112, 225001, https://doi.org/10.1103/PhysRevLett.112.225001, 2014.
Nicoll, K. A. and Harrison, R. G.: Stratiform cloud electrification: comparison of theory with multiple in-cloud measurements, Q. J. Roy. Meteor. Soc., 142, 2679–2691, https://doi.org/10.1002/qj.2858, 2016.
Nicoll, K. A., Harrison, R. G., and Ulanowski, Z.: Observations of Saharan dust layer electrification, Environ. Res. Lett., 6, 014001, https://doi.org/10.1088/1748-9326/6/1/014001, 2011.
Nicoll, K. A., Harrison, R. G., Silva, H. G., Salgado, R., Melgao, M., and Bortoli. D.: Electrical sensing of the dynamical structure of the planetary boundary layer, Atmos. Res., 202, 81–95, https://doi.org/10.1016/j.atmosres.2017.11.009, 2018.
Olson, D. E.: Evidence for auroral effects on atmospheric electricity, Pure Appl. Geophys., 84, 118–138 https://doi.org/10.1007/BF00875461, 1971.
Pearce, F.: Sunny side up, New Sci., 11 July 1998, available at: https://www.newscientist.com/article/mg15921425-400-sunny-side-up/, last access: 29 November 2021.
Pickering, W. H.: An improved cosmic-ray radio sonde, Rev. Sci. Instrum., 14, 171–173, https://doi.org/10.1063/1.1770152, 1943.
Pierce, J. R.: Cosmic rays, aerosols, clouds, and climate: Recent findings from the CLOUD experiment, J. Geophys. Res.-Atmos., 122, 8051–8055, https://doi.org/10.1002/2017JD027475, 2017.
Regener, E. and Pfotzer, G.: Intensity of the cosmic ultra-radiation in the stratosphere with the tube-counter, Nature, 134, 325, https://doi.org/10.1038/134325b0, 1935.
Rosen, J. M. and Kjome, N. T.: Backscattersonde: a new instrument for atmospheric aerosol research, Appl. Optics, 30, 1552–1561, https://doi.org/10.1364/AO.30.001552, 1991.
Simpson, G. C.: Atmospheric electricity during the last 50 years – Part 2 Wilson's theory of the normal electric field, Weather, May 1949, 135–140, 1949.
Simpson, G. C. and Scrase, F. J.: The distribution of electricity in thunderclouds, P. Roy. Soc Lond. A Mat., 161, 309–352, https://doi.org/10.1098/rspa.1937.0148, 1937.
Stozhkov, Y. I., Svirzhevsky, N. S., Bazilevskay, G. A., Kvashnin, A. N., Makhmutov, V. S., and Svirzhevskaya, A. K.: Long-term (50 years) measurements of cosmic ray fluxes in the atmosphere, Adv. Space Res., 44, 1124–1137, 2009.
Strutt, J. W.: The influence of electricity on colliding water drops, P. R. Soc. London, 28, 406–409, https://doi.org/10.1098/rspl.1878.0146, 1879.
Svensmark, H. and Friis-Christensen, E.: Variations of cosmic ray flux and global cloud coverage – a missing link in solar-climate relationships, J. Atmos. Sol.-Terr. Phy., 59, 1225–1232, https://doi.org/10.1016/S1364-6826(97)00001-1, 1997.
Takahashi, T.: Measurement of electric charge in thundercloud by radiosonde, J. Meteorol. Soc. Jpn., 43, 206–217, https://doi.org/10.2151/JMSJ1965.43.4_206, 1965.
Thomson, W.: On the mutual attraction or repulsion between two electrified spherical conductors, (in: Reprint of papers on electrostatics and magnetism, Macmillan, London, UK, 1884), 86–97, 1853.
Tinsley, B. A. and Deen, G. W.: Apparent tropospheric response to MeV-GeV particle variations: a connection via electrofreezing of supercooled water in high-level clouds?, J. Geophys. Res., 96, 22283–22296, https://doi.org/10.1029/91JD02473, 1991.
Tripathi, S. N. and Harrison, R. G.: Scavenging of electrified radioactive aerosol, Atmos. Environ., 35, 5817–5821, https://doi.org/10.1016/S1352-2310(01)00299-0, 2001.
Twomey, S.: The electrification of individual cloud droplets, Tellus, 8, 445–452, https://doi.org/10.3402/tellusa.v8i4.9038, 1956.
Väisälä, V.: Bestrebungen und Vorschläge zur Entwicklung der Radiometeorgraphischen Methoden, Societas Scientarium Fennica (Helsingfors), Commentationes Physico-Mathematicae, 6, 2, 1932.
Vaisala: RS41 datasheet, available at: https://www.vaisala.com/sites/default/files/documents/WEA-MET-RS41-Datasheet-B211321EN.pdf, last access: 29 November 2021.
Venkiteshwaran, S., Gupta, B., and Huddar, B.: Measurement of the electrical potential gradient in the atmosphere by radiosonde, Mausam, 5, 253–256, https://doi.org/10.54302/mausam.v5i3.4874, 1954.
Wenstrom, W. H.: Radiometeorography as applied to unmanned balloons, Mon. Weather Rev., 62, 221–226, https://doi.org/10.1175/1520-0493(1934)62<221:RAATUB>2.0.CO;2, 1934.
Wilson, C. T. R.: On the measurement of the atmospheric electric potential gradient and the earth-air current, P. Roy. Soc Lond. A Mat., 80, 537–547, https://doi.org/10.1098/rspa.1908.0048, 1908.
Wilson, C. T. R.: Investigations on lightning discharges and on the electric field of thunderstorms, Philos. T. R. Soc. A, 221, 73–155, https://doi.org/10.1098/rsta.1921.0003, 1921.
Wilson, C. T. R.: Some thundercloud problems, J. Frankl. Inst., 208, 1–12, https://doi.org/10.1016/S0016-0032(29)90935-2, 1929.
John Canton (1718–1772) was a natural philosopher who experimented with electricity, magnetism and the properties of water. He received Copley medals of the Royal Society in 1751 and 1764. Canton was born in Stroud, Gloucestershire, and worked and died in London. (Having been born and schooled in the same town, I am, perhaps, more aware of Canton's work than most.)
“Fair weather” has a specific meaning in atmospheric electricity, in identifying a situation when no substantial convectively driven charge separation occurs locally (e.g. Harrison and Nicoll, 2018). In meteorology more generally, fair weather clouds are small and often numerous cumulus clouds, in an otherwise clear sky.
These heroic measurements were brought to a wide audience through the 2019 film The Aeronauts.
This provided a fine introduction to atmospheric electricity, alongside the wonderful textbook of J. Alan Chalmers (Aplin, 2018). It also indicated that the whole topic was overdue for new experiments.
The Clement–Harrison theory was confirmed by independent experiments (Gensdarmes et al., 2001). Wet removal of radioactive aerosols was found to be enhanced by their charge (Tripathi and Harrison, 2001).
Extensive layer clouds would not be considered fair weather meteorologically, but, electrically, they would usually fulfil the conventional criteria. To try to avoid confusion between “fair weather” in the meteorological and atmospheric electrical usages, whilst retaining the important electrical distinction with disturbed weather, overcast extensive layer cloud circumstances are described here as semi-fair weather conditions.
The international use and longevity of this technology is remarkable, providing measurements on the Eiffel Tower during the 1890s (Harrison and Aplin, 2003) and at the UK's Kew and Eskdalemuir observatories from 1861–1931 and 1908–1936, respectively. The water dropper atmospheric potential sensor at Kakioka Observatory in Japan only ceased operation in 2021.
An alternative is to synthesise the large resistance needed by combining a smaller feedback resistor with a resistive divider, in a so-called “T network” (e.g. Fig. 3.14 in Harrison, 2014).
The PG is positive in fair weather. Although the electric field has the same magnitude as the PG, it has the opposite sign; positive charge moves downwards in fair weather.
Some agencies and individuals monitor radiosonde transmissions in their nearby airspace. Changes from the routine radiosonde data transmission formats may attract additional attention.
The acronym PANDORA also discourages opening of the box, and other tampering, and so has been retained.
Many such capsules were used in atmospheric experiments, including 100 in a single project for the US Navy. Leaving the Kinder eggs in the Meteorology Department coffee room was found extremely effective in distributing the initial dismantling task. This inspired Footnote 7 to the 2001 paper, “The outer chocolate and foil coating must first be removed”, which was the first mention of chocolate as a substance since the Review of Scientific Instruments' foundation in 1930.
Extending the range of sensors, although apparently moving away from the initial science objective, has also brought the benefit of diversifying funding sources.
To achieve this, the photocurrent in sunlight must not saturate the first amplifier stage.
“30 km” was produced by Simon Faithfull (https://www.fvu.co.uk/projects/30km, last access: 1 December 2021).
Some brief recollections are given in Harrison (2021). The value of these radiosondes in locating the plume was reported to the UK Parliament's Science and Technology Committee (3 November 2010).
- Abstract
- Introduction and scientific motivation
- Electrostatic measurements and instrumentation
- Electrical structure of extensive layer clouds
- Radiosondes for atmospheric measurements
- Summary of layer cloud charge observations
- Conclusions
- Code and data availability
- Competing interests
- Disclaimer
- Acknowledgements
- Financial support
- Review statement
- References