the Creative Commons Attribution 4.0 License.
the Creative Commons Attribution 4.0 License.
 | 15 Dec 2023
3D-printed Ag–AgCl electrodes for laboratory measurements of self-potential
Thomas S. L. Rowan
Vilelmini A. Karantoni
Adrian P. Butler
Matthew D. Jackson
This paper details the design, development, and evaluation of a 3D-printed rechargeable Ag–AgCl electrode to measure self-potential (SP) in laboratory experiments. The challenge was to make a small, cheap, robust, and stable electrode that could be used in a wide range of applications. The new electrodes are shown to offer comparable performance to custom-machined laboratory standards, and the inclusion of 3D printing (fused filament fabrication or FFF and stereolithography or SLA) makes them more versatile and significantly less expensive – of the order of ×40 to ×75 cost reduction – to construct than laboratory standards. The devices are demonstrated in both low-pressure experiments using bead packs and high-pressure experiments using natural rock samples. Designs are included for both male and female connections to laboratory equipment. We report design drawings, practical advice for electrode printing and assembly, and printable 3D design files to facilitate wide uptake.
- Article
(8562 KB) - Full-text XML
-
Supplement
(641 KB) - BibTeX
- EndNote


Measurements of self-potential (SP) are used by environmental and engineering site surveyors (Nyquist and Corry, 2002; Weigand et al., 2020; Eppelbaum, 2021) and hydrologists (Graham et al., 2018; MacAllister et al., 2019; Maineult et al., 2008; Revil et al., 2003; Rizzo et al., 2004; Sailhac and Gibert, 2003), as well as for monitoring volcanic and seismic activity (Aubert and Atangana, 1996; Finizola et al., 2004; Ishido, 1989). Additionally, SP is utilized for leakage detection from dams and embankments (Bogoslovsky and Ogilvy, 1973; Bolèkve et al., 2009; Ogilvy et al., 1969), locating and monitoring contaminant plumes (Linde and Revil, 2007; Minsley et al., 2007; Naudet et al., 2003, 2004), detecting subsurface voids, disturbances, and sinkholes (Jardani et al., 2006, 2007; Eppelbaum, 2020), and monitoring pumping and sparging tests (Jackson et al., 2012; Maineult et al., 2008; Rizzo et al., 2004).
Non-polarizing electrodes, consisting of a metal (typically Cu, Ag, or Pb) immersed in a metal salt solution or coated with a metal salt and immersed in a conductive solution (Ag–AgCl or Pb–PbCl2 in NaCl or KCl electrolyte; Jackson, 2015), are commonly used in SP data acquisition (Fig. 1). A low-permeability membrane (such as ceramic) is typically used to allow electrical contact with the experiment, and a gelling agent or solid porous medium (such as kaolinite or plaster) may be used to further reduce electrolyte leakage (Jackson, 2015). In some cases, the reference electrolyte may be natural water (e.g. seawater; Jackson, 2015).
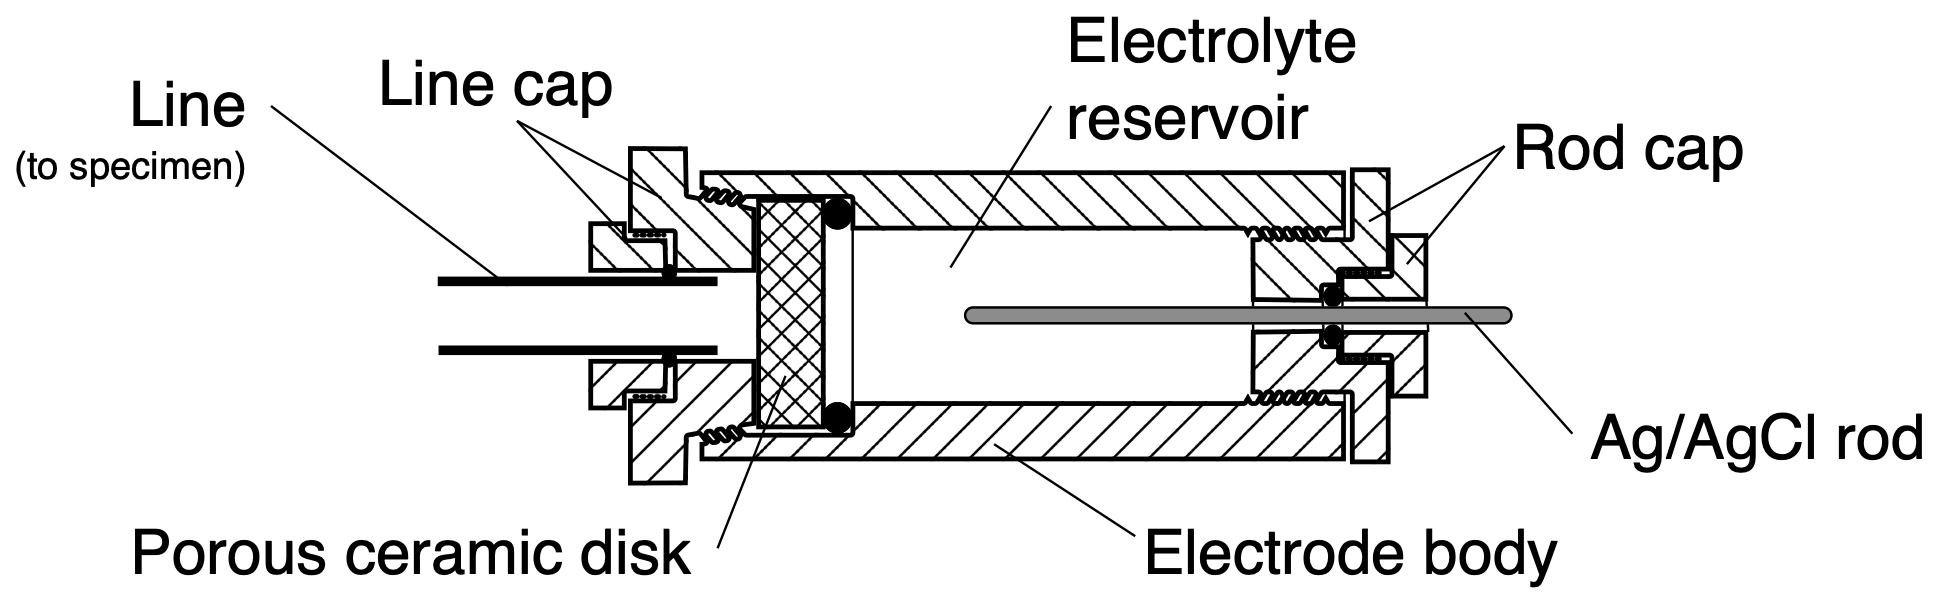
Figure 1Parts of a typical rechargeable, non-polarizing Ag–AgCl electrode for laboratory SP measurements. The “rod cap” holds a silver rod in place in the electrolyte reservoir and allows electrical connection to the rod. The “line cap” connects the electrode to the experiment via a fluid-saturated flow line. A porous ceramic disc allows electrical charge exchange between the electrolyte and the experimental fluid without mixing of the fluids. The rod cap can be removed to allow the silver rod to be replaced, and the line cap can be removed to allow the ceramic disc and/or the electrolyte to be replaced. Hence the electrode can be periodically “recharged” as described in the text. Modified from Vinogradov et al. (2010).
Non-polarizing electrodes are characterized by small electrode polarization (the electrical potential measured at a given time between an electrode pair in the absence of an external electric field) and drift (the time variation of the electrode polarization) due to the nearly equal magnitude of polarization at the metal–electrolyte interface in each electrode, which approximately cancels across a pair of electrodes of the same type and varies only slowly in response to shifts in the reference electrolyte composition and concentration (Jackson, 2015). This type of electrode, also known as a “liquid-junction” or “reference” electrode, is not truly non-polarizing, but the term is often used to describe its behaviour (Jackson, 2015). The “effective” polarization of these electrodes is the diffusion (liquid-junction) potential across the contact between the reference electrolyte solution and the adjacent medium.
Comparative studies of non-polarizing electrodes for geophysical applications demonstrate that the performance of each electrode type depends on the measurement conditions and that no one type outperforms all others (Jackson, 2015; Perrier et al., 1997; Petiau and Dupis, 1980). Ag–AgCl, Cu–CuSO4, and Pb–PbCl2 electrodes are the most widely used and feature a metal electrode and electrolyte contained within a ceramic or plastic casing, with a ceramic or wood membrane providing the electrical connection (Corry et al., 1983; Corwin, 1980; Jackson, 2015; Jackson et al., 2012; Maineult et al., 2008; Perrier and Pant, 2005; Petiau, 2000; Vinogradov et al., 2010). Commercial suppliers have begun to manufacture electrodes suitable for SP measurements in the field, such as Cu–CuSO4 and Ag–AgCl electrodes (e.g. for corrosion monitoring). In many laboratory studies, however, the electrodes are designed and manufactured in-house and the construction details are rarely reported (Leinov and Jackson, 2014; Vinogradov et al., 2010). These electrodes are typically designed only for use in a specific experimental apparatus.
The emergence of 3D printing technology has enabled the adaptation of sensors, featuring repeatability, precision, and mechanically useful parts, with applications across a range of research fields (Adamski et al., 2018; Ni et al., 2017). Kings College's FreeStation (KCL, 2021) is a repository for a variety of sensors and parts, and the technology has been used to develop small-scale reference electrodes for medical and other small-scale applications (Rohaizad et al., 2019; Schuett et al., 2022). Furthermore, printed junctions (ceramic discs) have been demonstrated (Sibug-Torres et al., 2020). In this paper, the design and construction of a simple, versatile, rechargeable, printed Ag–AgCl reference electrode are detailed. This electrode is suitable for laboratory-based SP measurements and is based on the design used by Vinogradov et al. (2010). The electrode consists of an Ag rod with a chloride coating, a chloride salt reference electrolyte, a porous ceramic membrane to allow charge exchange with the experimental electrolytes and an enclosure. The Cl− ions in the reference electrolyte are in equilibrium with the Ag rod such that (Jackson, 2015)
The use of “rechargeable” here means that the Ag rod and associated reference electrolyte can be replaced periodically. Ion exchange between the reference and experimental electrolytes causes the composition of the reference electrolyte to change over time. Electrolyte composition change causes the ion exchange with the silver surface to deviate from the simple equilibrium expressed in Eq. (1). This, in turn, causes the liquid-junction potentials across the membrane and the polarization at the silver surface to change. When this occurs, the measured electrical potentials typically become unstable, with large and rapid fluctuations and drift. The silver rod must be then removed from the electrode to have its chloride coat stripped and replaced and the reference electrolyte refreshed (e.g. Vinogradov et al., 2010). These requirements impose constraints on the electrode design. Therefore, as shown in Fig. 1, a mechanism to release the electrode is also included and is one of the advantages of this configuration. The concentration and composition of the reference electrolyte may also be modified, depending on the experiment to be conducted.
This paper consists of five sections. An overview of techniques and motivation is presented in Sect. 1. The design and construction choices are laid out in Sect. 2. The testing methods are described in Sect. 3. Results confirming the accuracy of the Ag–AgCl reference electrode for different types of SP measurements are given in Sect. 4, followed by a summary and future design developments and suggestions in Sect. 5.
This section details the Ag–AgCl standard electrode on which the new 3D-printed electrodes are based and lays out the specific requirements and manufacturing of two different designs of printed, non-polarizing Ag–AgCl electrodes. The designs presented here are based on the Ag–AgCl electrode reported by Vinogradov et al. (2010); this example design is referred to as the Vinogradov electrode (VE), and the aim of this work is to develop electrodes based on the Vinogradov design that are easily manufactured using 3D printing and can be used for a variety of SP monitoring purposes. Our Electrode A is a copy of the VE, adapted for 3D printing; our Electrode B is a low-pressure 3D-printed version of the VE adapted for flush mounting. This section is supported by design drawings in the Supplement and .stl (printable 3D design) files in the Supplement which are available to download alongside this paper.
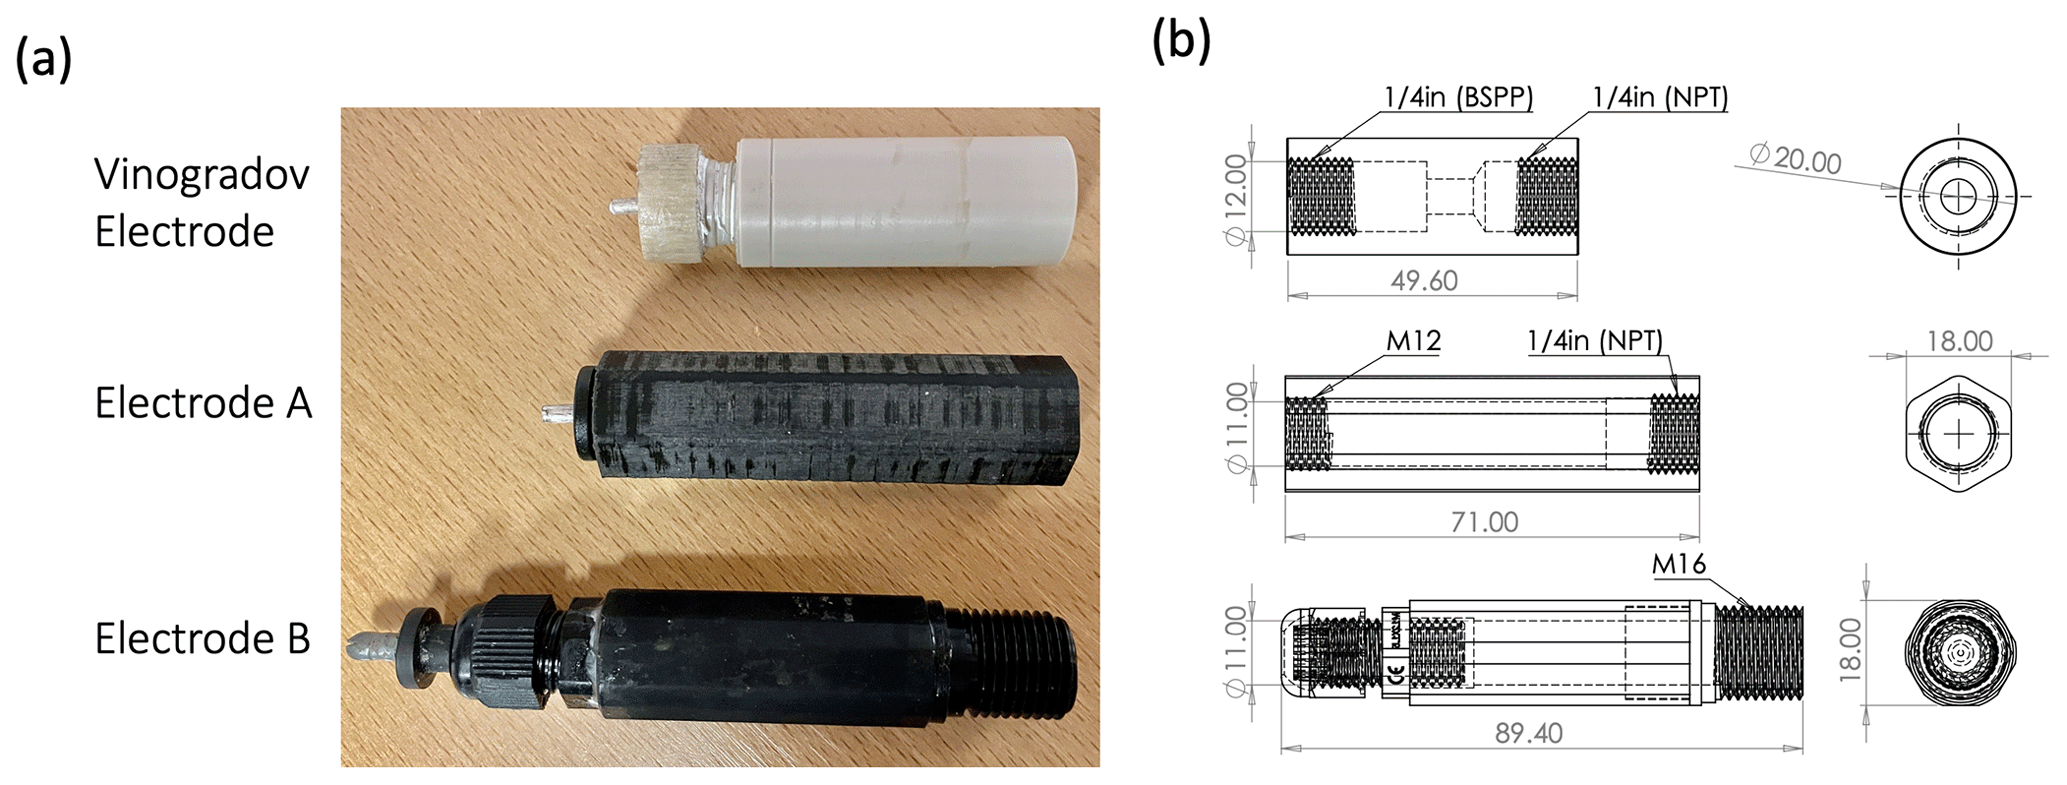
Figure 2A photo (a) and major dimensions (in descending order) of the Vinogradov electrode, Electrode A, and Electrode B (b).
2.1 The Vinogradov electrode
The Vinogradov electrode has a six-component, double-female body design (Fig. 2), which has two different threads ( in. NPT and in. British Standard Parallel Pipe – BSPP – connectors) on the rear and front ports of the electrode, respectively; one is tapered and one is straight to ensure the probe body is correctly connected to the experimental apparatus. The “rod cap”, which seals into the rear port, uses a two-part gland seal with an O-ring to seal the Ag rod in place. The front port allows for a wide variety of connections to experimental apparatus through variation of the rod and/or line cap (shown in Fig. 1).
The parts used in the Vinogradov design were either machined specifically for purpose (e.g. the electrode body and gland seals) or are produced commercially for a variety of applications (e.g. silver rod, O-rings, and ceramic membrane). The electrode body is manufactured from polyether ether ketone (PEEK), specified to handle high pressure (up to 0.5 MPa) and temperature (up to 125 ∘C) consistent with the experiments conducted using the electrodes by Vinogradov and co-workers (Al Mahrouqi et al., 2017; Collini et al., 2020; Vinogradov and Jackson, 2015). The bespoke machining of the electrode body means they are expensive and require expert manufacturing. Moreover, thread degradation and warping can require the application of considerable torque to disassemble the electrode due to the round nature of the body, which can damage the body of the electrode. A flat-sided design that could be gripped by a spanner would reduce wear and tear on the electrode body. The Vinogradov design also incorporates several small O-rings which prove complex to install and may not be necessary for lower-pressure applications. It should also be noted that the Ag rod is never fully submerged during the AgCl coating step (explained in Sect. 2.4), an insight which enables the development of a bonded Ag-rod adapter.
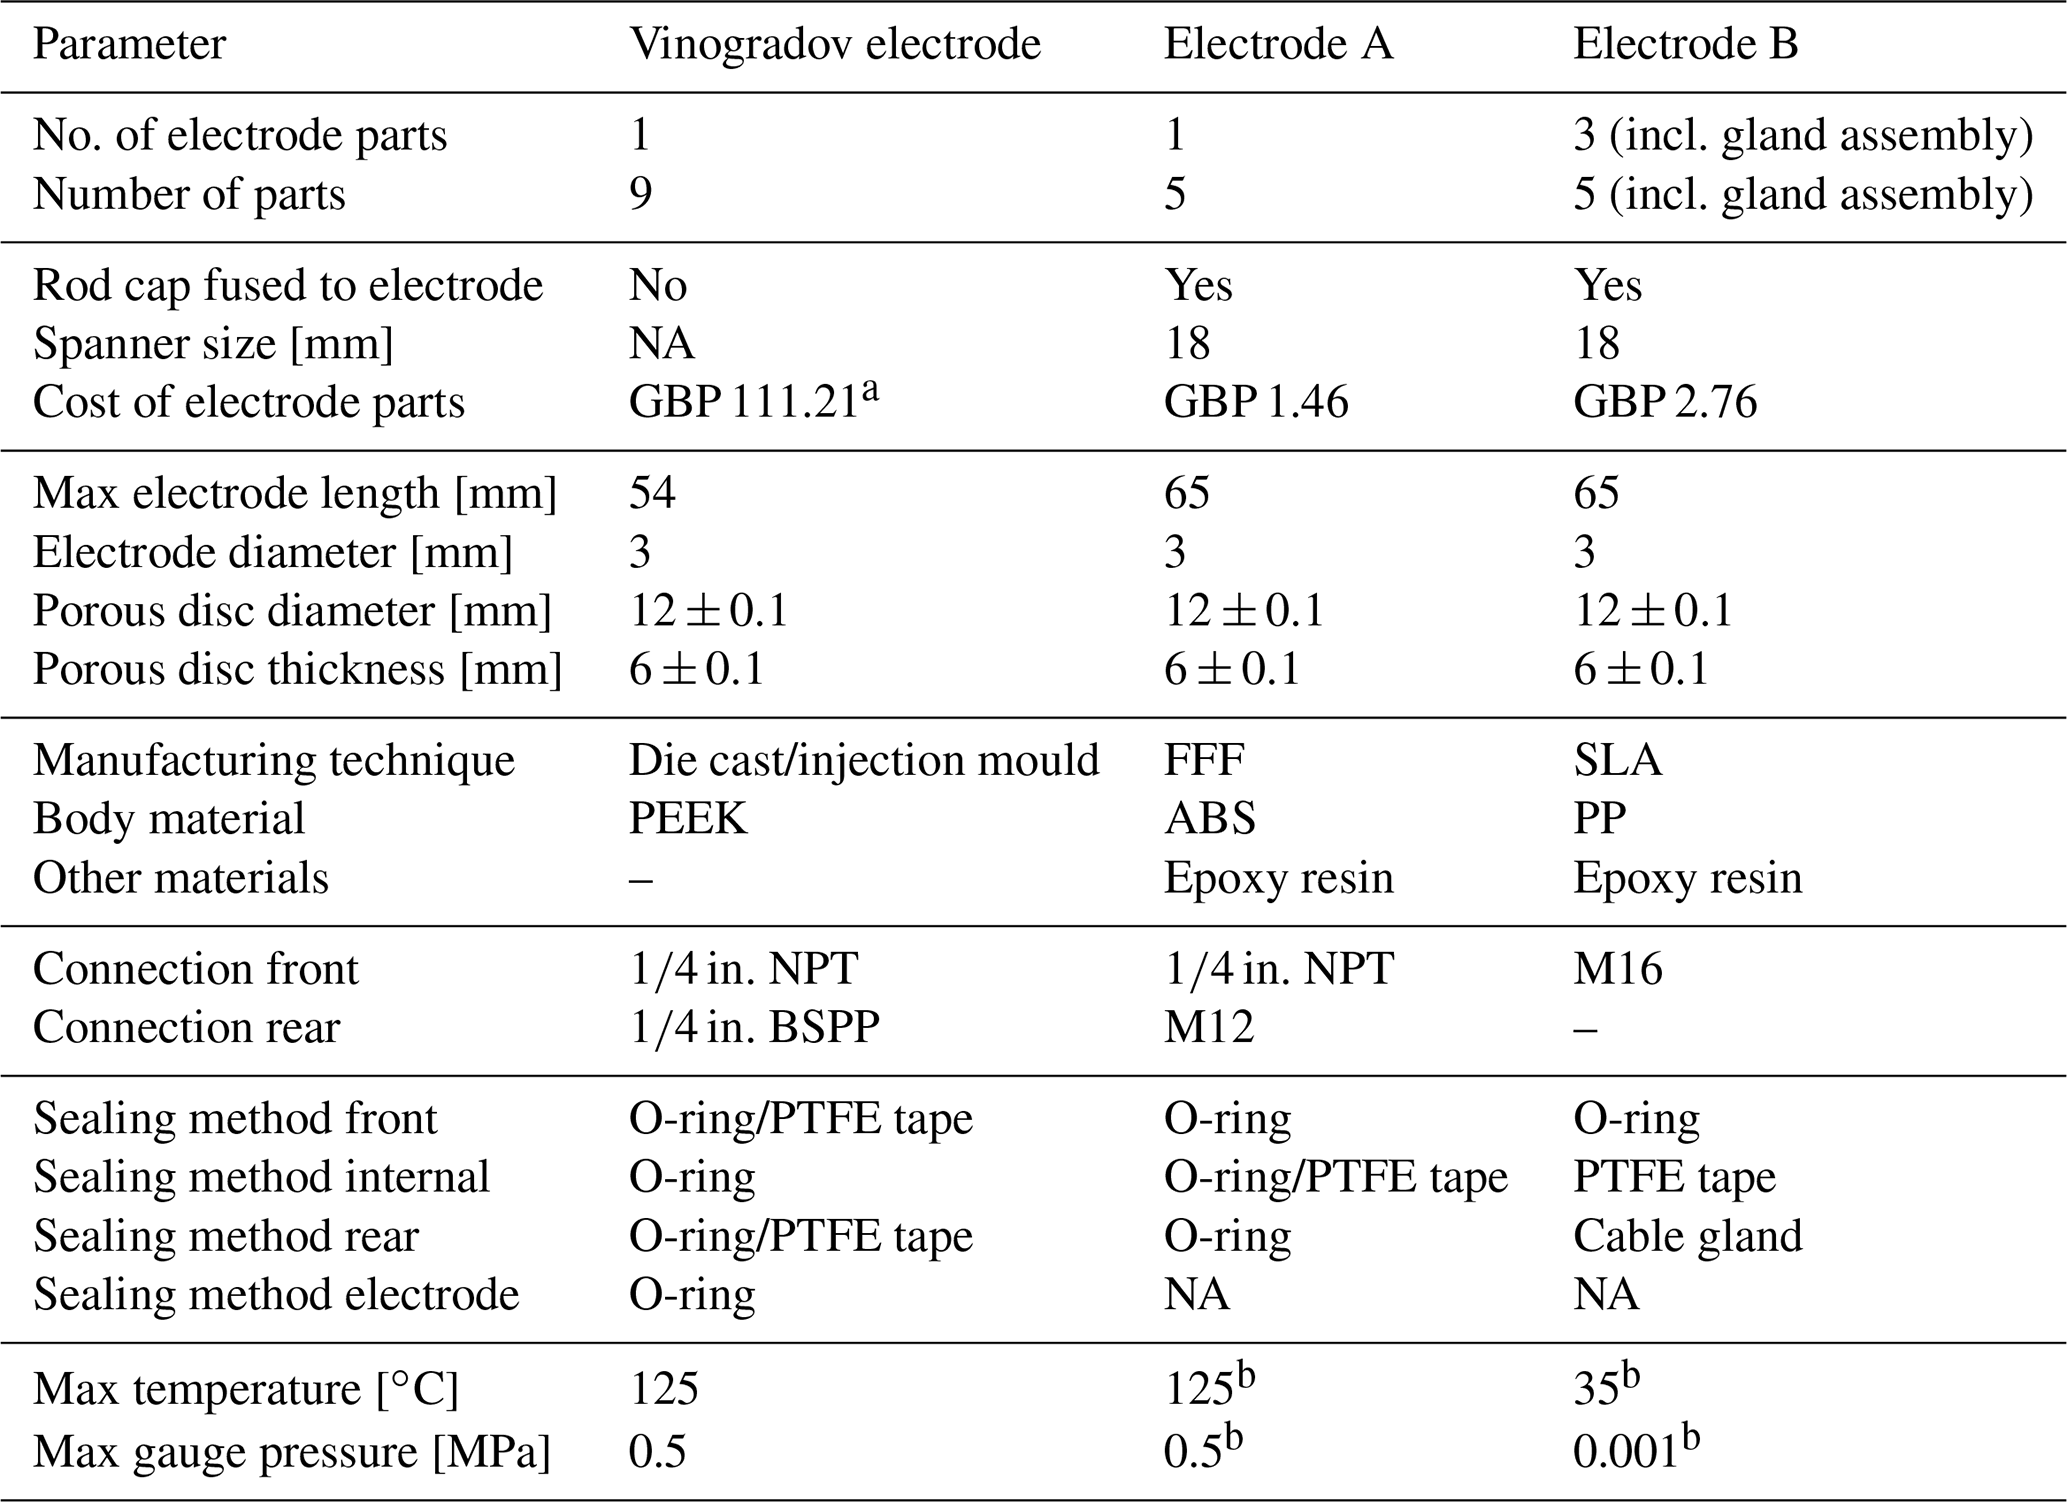
Table 1Comparison of parameters and desired performance for Electrode A, Electrode B, and the Vinogradov electrode. Note that ratings depend on the manufacturer and the authors accept no liability for electrodes not reaching these ratings. Prices shown are for the body and electrode cap; a VE price quoted in 2019, b calculated in ABS equiv. (incl. parts in the Supplement). NA stands for not applicable.
2.2 Design considerations
3D printing offers great flexibility when designing non-polarizing electrodes for specific applications. During this work, a direct replacement for the VE (Electrode A) and a modified version of the VE for flush mounting (Electrode B) were developed. The new electrodes can be summarized as follows.
-
Electrode A is a 3D-printed version of the VE (female–female body), which incorporates several design improvements and is able to withstand seal pressure differentials up to 0.5 MPa and fluid temperatures of 140 ∘C.
-
Electrode B is a flush-mounted version of the VE, optimized for usability but with a lower pressure rating of 1 kPa.
The combined design brief, in line with the VE, specifies that the electrodes must accommodate
-
a removable 3 mm diameter Ag rod;
-
a 12 mm diameter, 6 mm thick, porous membrane that can be replaced for maintenance;
-
easy cleaning and reuse; and
-
improved useability compared to the VE.
These design constraints were adopted for both Electrodes A and B, as shown in Fig. 2. The key differences between the newly developed electrodes and the VE are the following.
-
Tool compatibility. An 18 mm hexagonal prismatic design was used, and, to reduce fracture and damage, a 3 mm fillet was applied to each of the hexagonal points. Note that an octagonal design could have been used.
-
Reduction of parts. The rod cap (Fig. 1) was simplified into one part and fused to the Ag rod using epoxy resin. This removes a step from the assembly stage.
-
Alternative porous membrane. A sintered silica porous material (porosity rating 00) is used in the VE; here, a polytetrafluoroethylene (PTFE) membrane was trialled and found to be interchangeable with the sintered glass. The PTFE membrane is cheaper and easier to machine to the correct dimensions, further reducing the cost of an electrode.
Electrode A follows the design of the VE, and it is recommended to print in an ABS plastic (with a dissolvable support material – for printing purposes only) for high-pressure and high-temperature applications, as well as to pressure-test the electrodes prior to use to ensure there are no leaks. Electrode B is designed for low-pressure experiments and can be mounted flush against the wall of a tank experiment. The thread-based Ag-rod gland was replaced by an IP68 cable gland to form a quick-release seal against the fused rod-cap electrode assembly (Fig. 2). A concern at the time of manufacturing was that flush tank tapping points may be prone to cracking, so it was decided to use a moulded polypropylene (PP) tip for the electrodes to reduce the chance of electrode implanting or removal damaging the tank. The printer used in the current study was not able to print in PP (or nylon); readers with access to more advanced 3D printers could consider removing this step and printing the entire body. A comparison of the three electrodes is given in Table 1. Note that the cost of the printed electrodes presented here is of the order of ×40 to ×75 lower than the equivalent VE.
2.3 Design and manufacture
There are a variety of 3D printing methods available to most consumers and researchers; during this work, different printers were available at different times. Two widely available commercial methods of printing were used: fused filament fabrication (FFF) and stereolithography (SLA). There are advantages to both, but FFF, with its far wider usage, adaptability, and support, is recommended for future work.
Electrode A was manufactured by FFF on Ultimaker S3 and S5 models. This model of printer allows for dual printing, used here to print dissolvable support material. For the best possible performance characteristics, it is recommended to print in ABS at the highest quality (engineering – 0.1 mm layer height, with a 2 mm wall thickness and 80 % infill). If possible, dissolvable polyvinyl adhesive (PVA) support material for the threads is advised, though the Breakaway Support material from Ultimaker offers reasonable results. Printing with the alignment of the long axis of the electrode body to the vertical axis of the printer offers the greatest electrode detail; these options are available at the slicing (coding) step of print preparation. To finish the electrode, it is recommended to run a tap (threading tool) up and down the threads (in the case of Electrode A we used a G and an M12). It is also recommended to apply a thin coat of print varnish or epoxy resin (with a low-viscosity mix) to the interior, which aids in cleaning at later stages and reduces wear.
Electrode B has a hybrid construction due to manufacturing constraints during this work. The tip and gland of the Electrode B are cable glands; the tip requires some work on a lathe to incorporate the membrane at the end of the tip. The body was printed using SLA, in this case an Anycubic photon S. When slicing a minimal layer height was preferable, as was printing along the vertical axis of the electrode. If threads are included in the design, it is recommended to run any thread cutting tools before the final curing process, as the material is less brittle at this stage. For Electrode B manufacturing, once cured the body was epoxied together with the tip and read gland. To complete the body of Electrode B, an M12 cable gland was bonded by epoxy resin to the rear end of the electrode body, and an M16 gland (as shown in the Supplement) was bonded to the front end.
2.4 Preparation of the electrodes
This section outlines the steps for the preparation of the electrodes prior to use for the VE and our new Electrodes A and B. The steps are included as a reference and to give further background to the design considerations expressed above.
The electrodes are prepared in a four-stage process (Fig. 3); the same preparation stages are followed when first assembling the electrodes after manufacturing and when they are cleaned and refreshed. First, the silver rod must be prepared: a low-grit (120–240 grit) emery cloth is used to clean the silver surface; the surface must also be clear of grease and other contaminants (Fig. 3). It should be noted that fresh silver rods must also be cleaned and rubbed lightly with emery cloth. The rod is then placed in an NaCl bath, following the approach of Vinogradov et al. (2010) (a 1 M NaCl solution is used and recommended), along with a donor silver electrode; both the rod and electrode are held in place using a crocodile clip and are not fully submerged. A current (of order 1 A at 12 V DC) is passed through the rod and donor electrode (normally for a few seconds) until a brown coating is evenly applied (step 2 of Fig. 3). The (cleaned and washed) electrode body is then assembled, and the porous membrane disc is inserted; prior to insertion, the porous membrane disc should be soaked in electrode electrolyte solution until saturated.
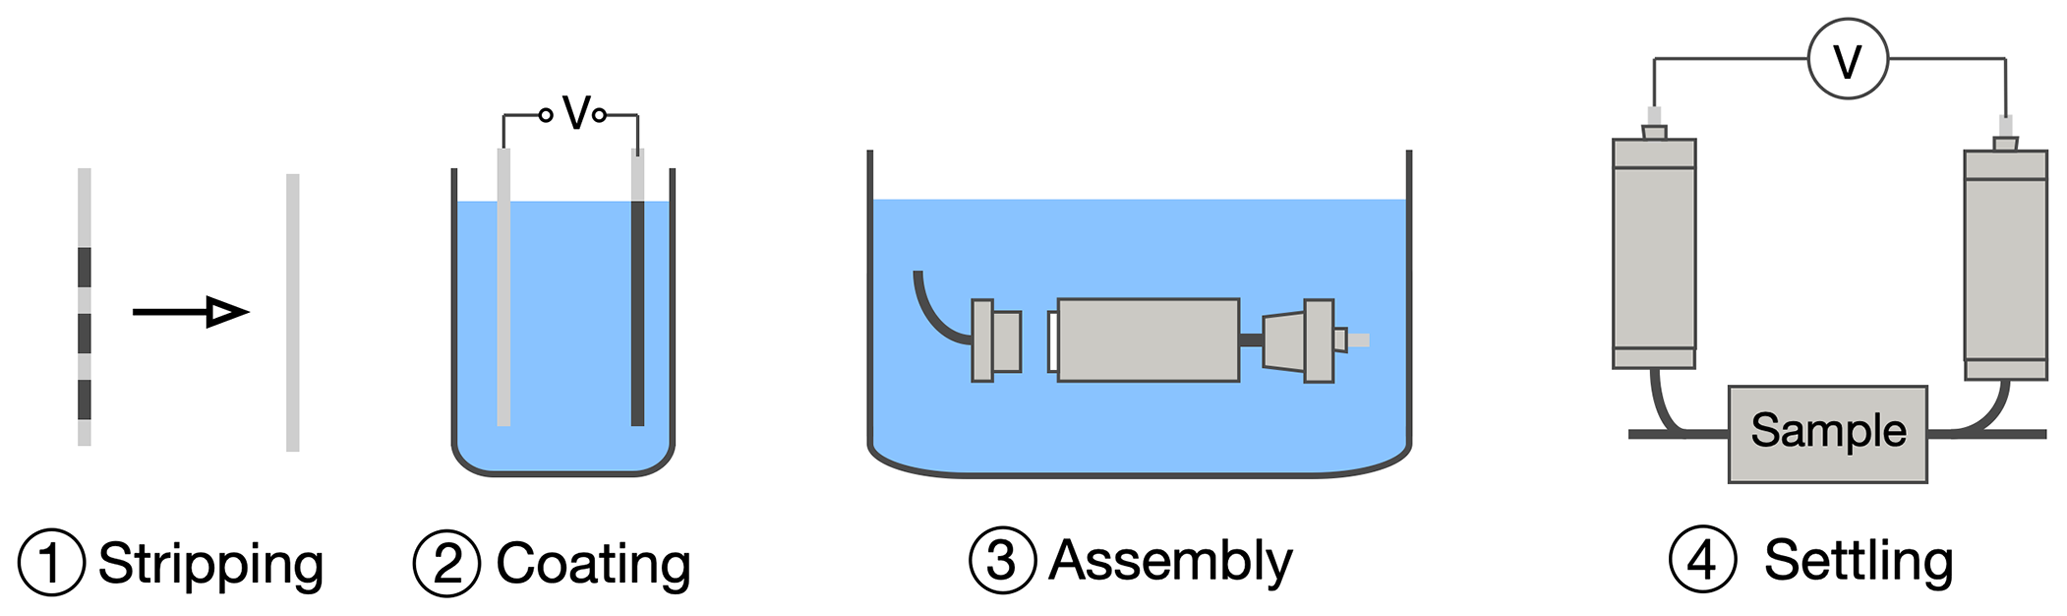
The electrode is assembled in step 3 in a bath of the electrode electrolyte solution to ensure no air bubbles are trapped inside the electrode. Finally, the electrode is “settled” by monitoring the voltage(s) between two or more electrodes over a period of time until the desired stability and drift are obtained; this can be across an experimental sample or in a low-ionic-strength electrolyte bath (e.g. tap water). The settling time depends on a number of factors (electrolyte strength, condition of the silver, etc.) and may take up to 24 h. If the desired stability and drift are not achieved, steps 1–4 may need to be repeated. Once made up, it is important to ensure that there are no leaks and that the electrode membrane (the porous disc) remains wet. As shown in Fig. 4, care must be taken when preparing the Ag rods; the rods shown under (E) show various evidence of degradation, including discolouration (from unwanted ion exchange in a reference electrolyte contaminated by the experimental electrolyte) and flaking (due to the Ag rod not being clean enough prior to coating). Only rod (D) shows a correctly stripped (A) and prepared Ag rod. Example (B) shows the dangers of not thoroughly stripping the Ag rod, while example (C) demonstrates inadequate time and current when coating the Ag rod.
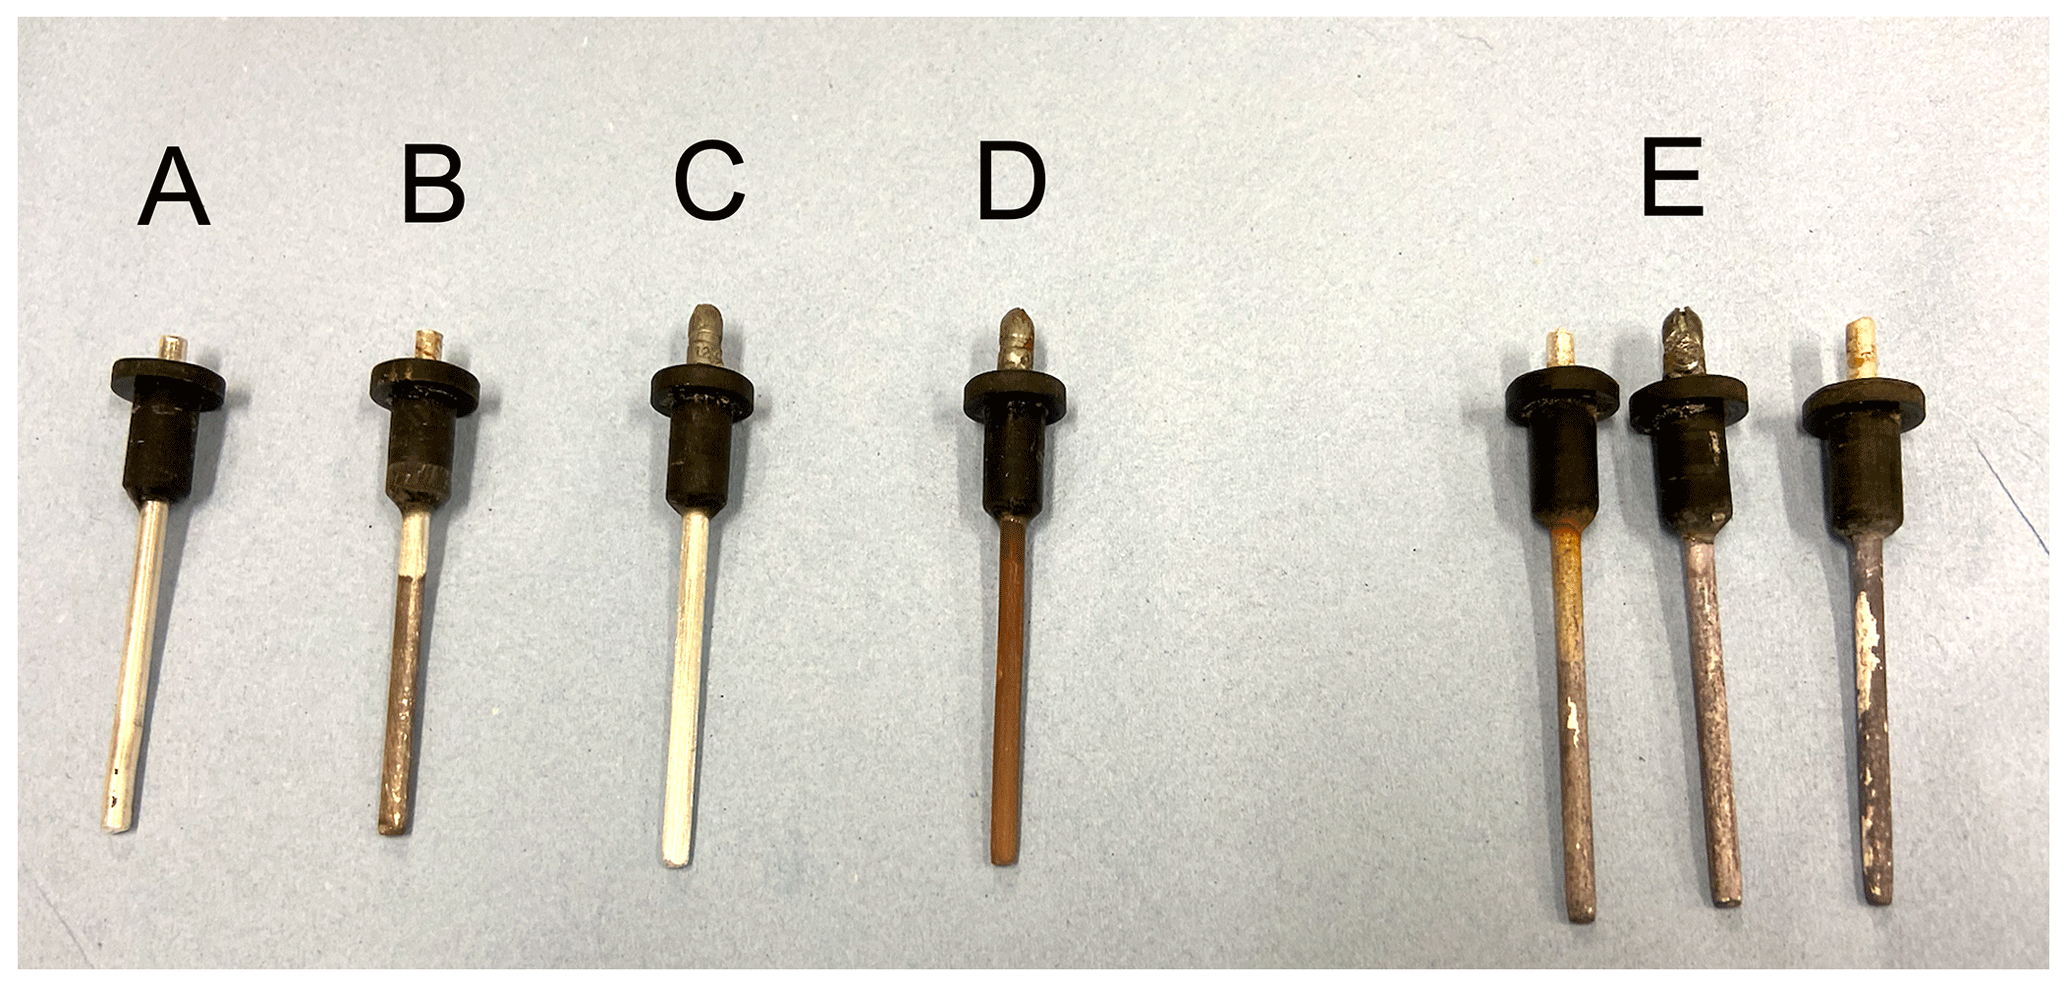
Figure 4A photo showing the stages of Ag-rod refresh – (A) a rod ready for coating, (B) an undercoated electrode, (C) an unclean and/or stripped Ag rod where recoating has failed, (D) a correctly coated rod, and (E) a collection of degraded Ag rods after use.
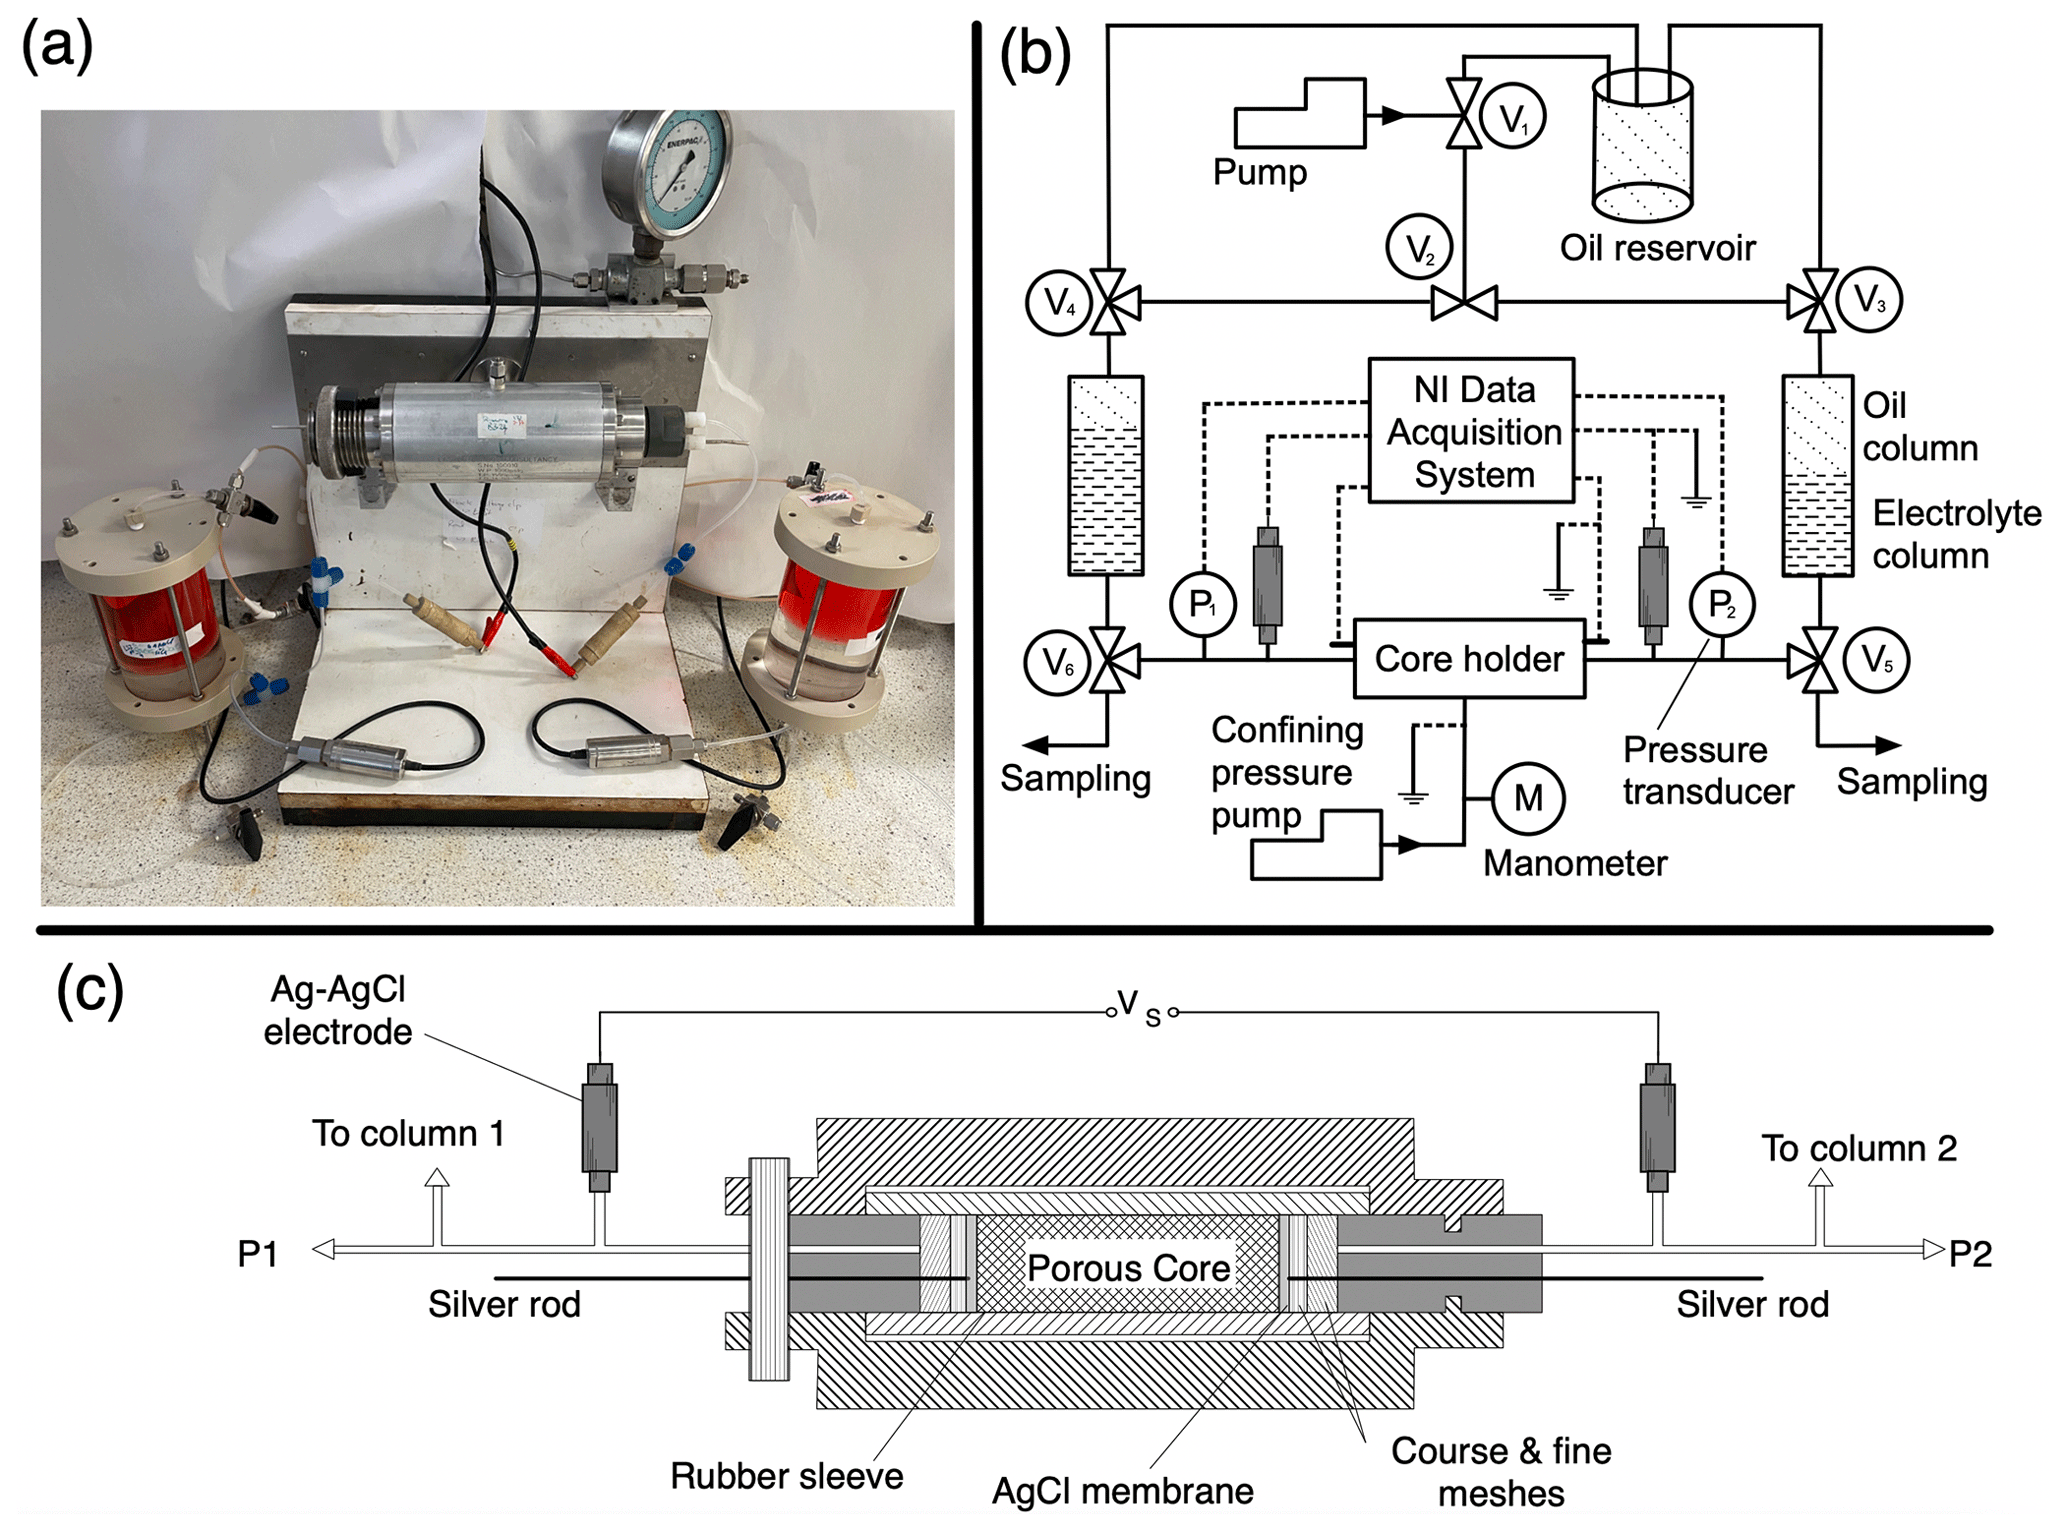
Figure 5Experimental apparatus used to measure the streaming potential across a porous core sample. (a) Photograph of the set-up; (b) diagram of the set-up with flowlines shown as solid lines and electrical connections shown as dashed lines; (c) close-up of the core holder and electrodes. The electrolyte is pumped through the saturated porous core sample while the pressure difference and self-potential voltage (Vs) across the sample are recorded, here using a National Instruments (NI) high-impedance differential voltage logger. The electrolyte can be pumped in both directions through the core via the manipulation of the six valves (V1–V6). For further details see Jaafar et al. (2009).
To demonstrate the accuracy and stability of the new 3D-printed electrodes, they were used in two different laboratory experiments to measure SP and their performance was compared against previous data obtained using the Vinogradov electrode. In the first set of experiments, the electrodes were used to measure the streaming potential, which is the component of the SP that arises in response to a pressure gradient across an electrolyte-saturated porous medium (e.g. Jackson, 2015). In the second set of experiments, the electrodes were used to measure the exclusion–diffusion potential, which is the component of the SP that arises in response to component concentration gradients across an electrolyte-saturated porous medium (e.g. Jackson, 2015). All testing was conducted using electrodes prepared with an Ag rod of length 6 and 3 mm diameter, coated in AgCl, as detailed above, and filled with 0.63 M NaCl reference electrolyte. The experiments were conducted to confirm that the new electrode design and materials used do not interfere with the electrical signals and show comparable performance to laboratory standard electrodes.
3.1 Streaming potential measurements
The experimental apparatus is comprised of a metallic core holder with non-metallic end caps, within which the cylindrical rock sample (“core”) is held inside a rubber sleeve; this ensures there is no electrical contact between the sample and the metallic parts of the core holder (Fig. 5). The core holder is engineered to apply a confining pressure which ensures that fluid is forced to flow through the sample rather than between the sample and core holder. Flowlines pass through the end caps and can be used to cause fluid to flow through the sample. Non-polarizing electrodes are connected to the flowlines on either side of the core holder and out of the direct path of the flow to measure the voltage difference across the sample. Each flowline is connected to a reservoir containing the electrolyte of interest and a mineral oil containing a red dye (Fig. 5a). A pump is used to induce electrolyte flow through the core using the mineral oil as a hydraulic fluid to force the electrolyte out of the inlet reservoir and through the sample to the outlet reservoir, creating a pressure drop across the sample.
Stabilized pressure and voltage measurements are recorded for several different but constant flow rates and with flow reversed to ensure the pressure and voltage responses are symmetric with respect to flow direction. Plotting the stabilized voltage difference against the stabilized pressure difference for each flow rate allows determination of the streaming potential coupling coefficient (C), given by the gradient of a linear regression through the pressure and voltage data. The zeta potential, which is a measure of the electrical potential on the surfaces of the porous sample, can then be calculated using the Helmholtz–Smoluchowski equation (e.g. Collini et al., 2020; Li et al., 2016). More information on the experimental process can be found in Vinogradov et al. (2010).
3.2 Exclusion–diffusion potentials
Two apparatuses are used in experiments to measure the exclusion–diffusion potential across porous samples (Leinov and Jackson, 2014). The approach accounts for electrode effects, which dominate the exclusion–diffusion potential. The electrode potential arises because the electrodes are in contact with electrolytes with different composition.
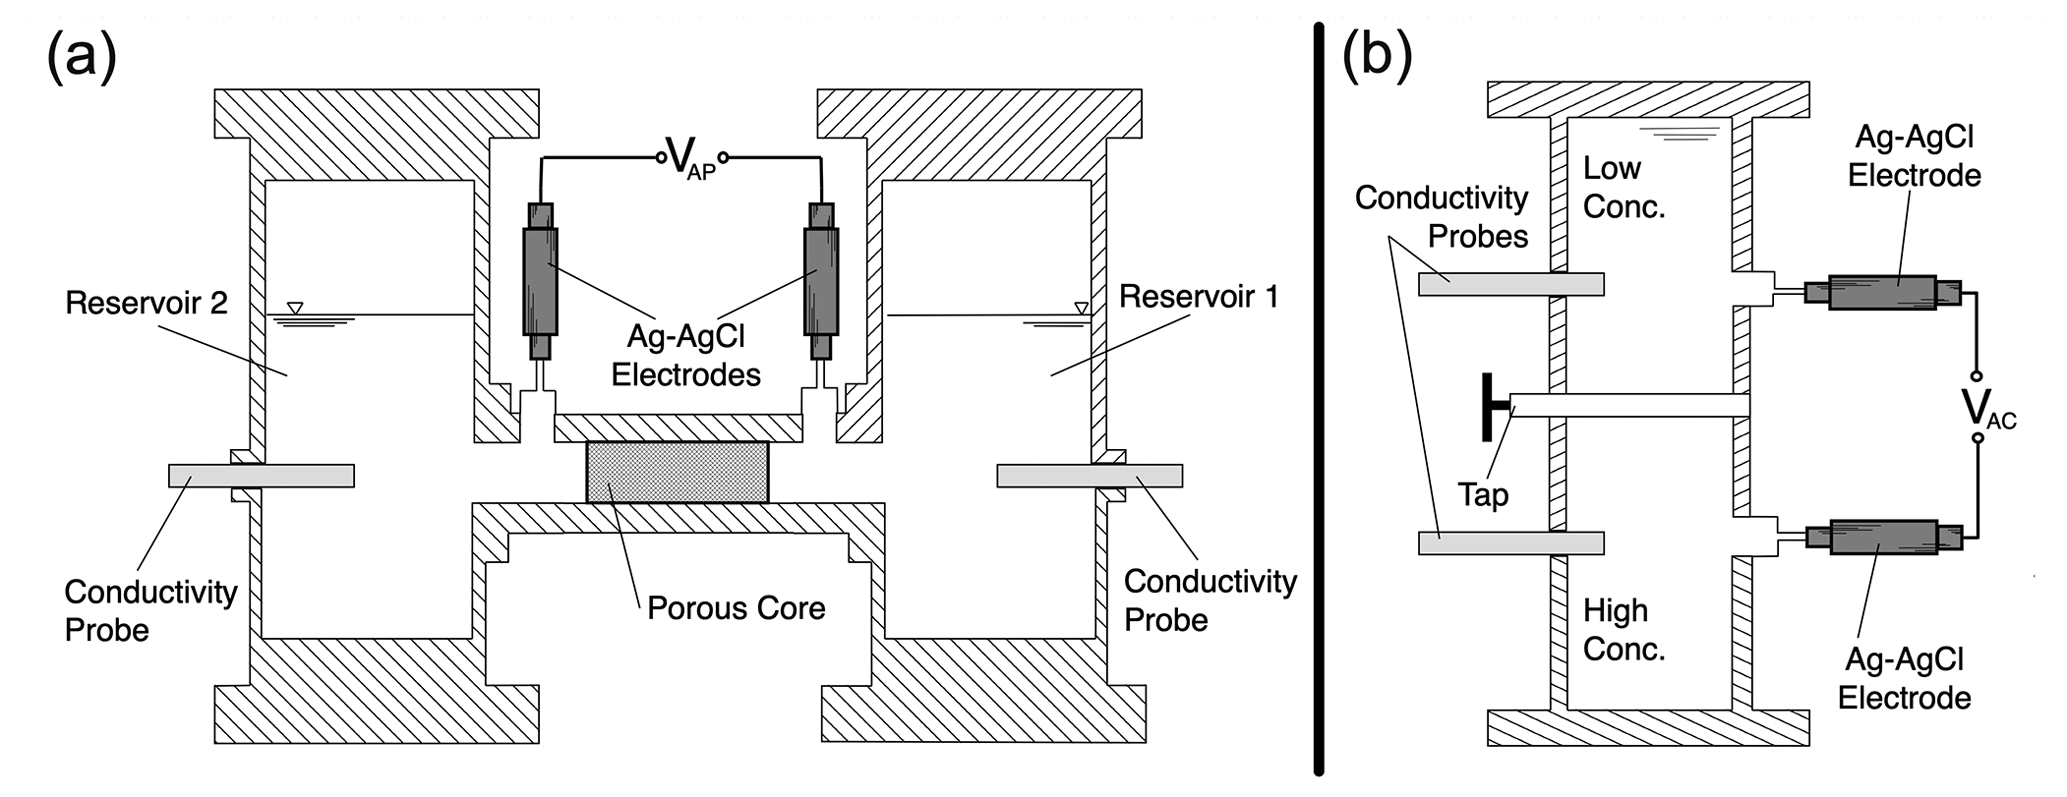
Figure 6Cross-sectional sketches of the apparatus used to measure the exclusion–diffusion potential across a saturated sample (a “plug”). Panel (a) shows the “plug apparatus” for measuring the exclusion–diffusion potential across the sample; panel (b) shows the “column apparatus” for measuring the diffusion potential across the two electrolytes of interest.
The “column” apparatus (Fig. 6a) is used to measure the diffusion potential across the two electrolytes of interest, including the electrode potential. The diffusion potential is then calculated for the two electrolytes and subtracted from the measured potential to determine the electrode potential. In this apparatus, two reservoirs are connected in a vertical arrangement, with the upper reservoir filled with the electrolyte of lower total concentration (and therefore lower density) and the lower reservoir filled with the electrolyte of higher total concentration (and therefore higher denser). The interface between the two electrolytes is therefore gravitationally stable. Two electrodes, one in each reservoir, are connected to the apparatus. When the tap is opened, an interface is established between the two electrolytes, allowing ions to pass from one electrolyte to the other by diffusion. An electrical potential difference is established across the interface, which is measured by the electrodes. This potential is termed the “apparent column” electrical potential ΔVAC and is given by the sum of the (unknown) electrode potential ΔVC and the (known) diffusion potential ΔVD for the two electrolytes of interest.
The plug apparatus (Fig. 6b) is used to measure the exclusion–diffusion potential across the saturated porous material of interest. In this apparatus, the two reservoirs are each filled with one of the two electrolytes of interest (the same electrolytes used in the column experiment) and connected by a sample of the porous material of interest. The sample is pre-saturated with the lower-concentration electrolyte and tightly confined to ensure there is no transport of electrical charge around the outside of the sample. As before, an electrode is located in each reservoir. As soon as the reservoirs are connected, an interface is established, allowing ions to pass from one electrolyte to the other by diffusion through the porous medium. An electrical potential difference is again established across the interface between the two electrolytes, which is measured by the electrodes. This is the apparent plug electric potential ΔVAP and is the sum of the (unknown) exclusion–diffusion potential ΔVED and the electrode potential determined in the previous experiment.
The unknown exclusion–diffusion potential across the saturated porous sample can then be determined (Leinov and Jackson, 2014). A more detailed description of the experimental method and apparatus can be found in MacAllister et al. (2019). Here we consider only the column experiments that are used to establish the electrode behaviour.
3.3 Results of the electrode tests
This section presents results from the streaming potential and exclusion–diffusion potential experiments. During the exclusion–diffusion potential experiments, it was possible to use Electrode A and B interchangeably with the VE. However, for the streaming potential experiments, Electrode A was used due to the high differential pressures involved.
3.3.1 Streaming potential experiments
Figure 7 shows results from the streaming potential experiments obtained using a porous sample comprising packed silica glass beads of 1 mm size and two different electrolytes used in laboratory experiments of saline intrusion (Etsias et al., 2021 and see Sect. 4). The electrolytes are tap water and synthetic seawater (Table 2).
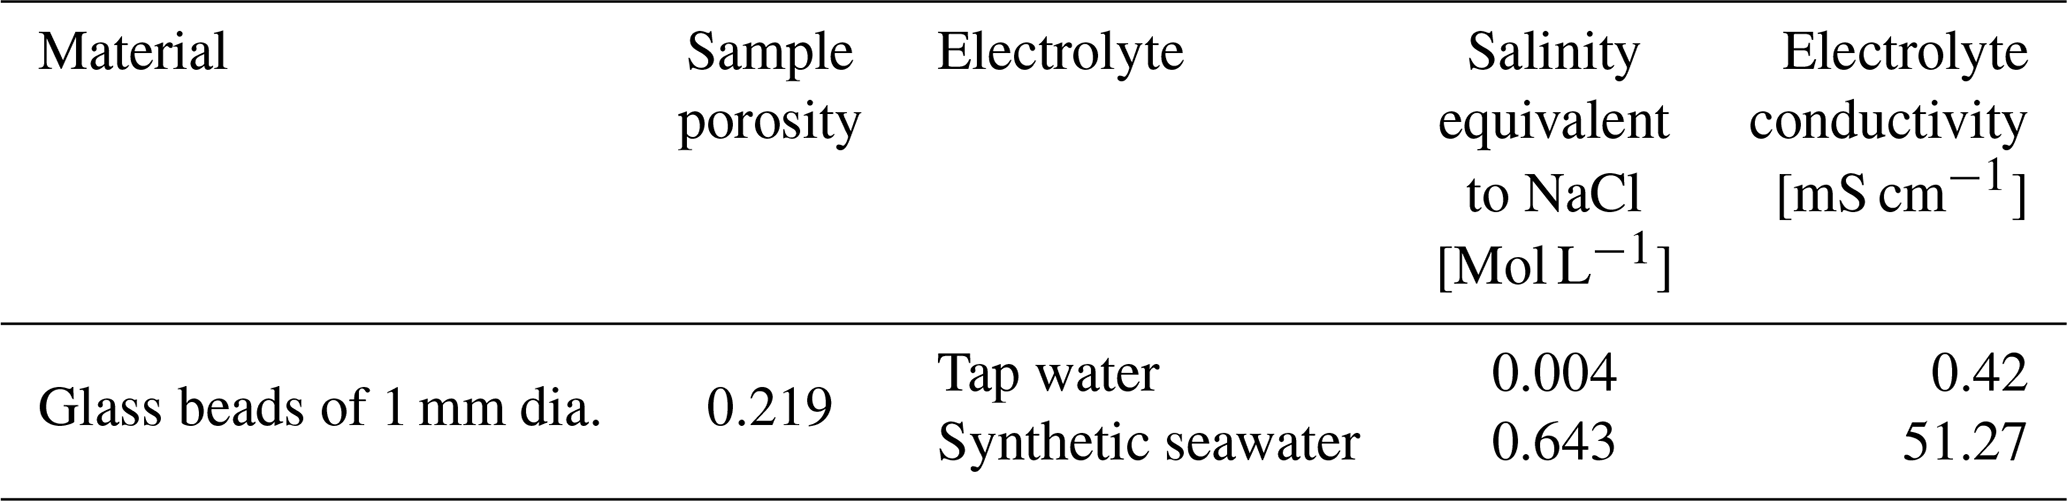
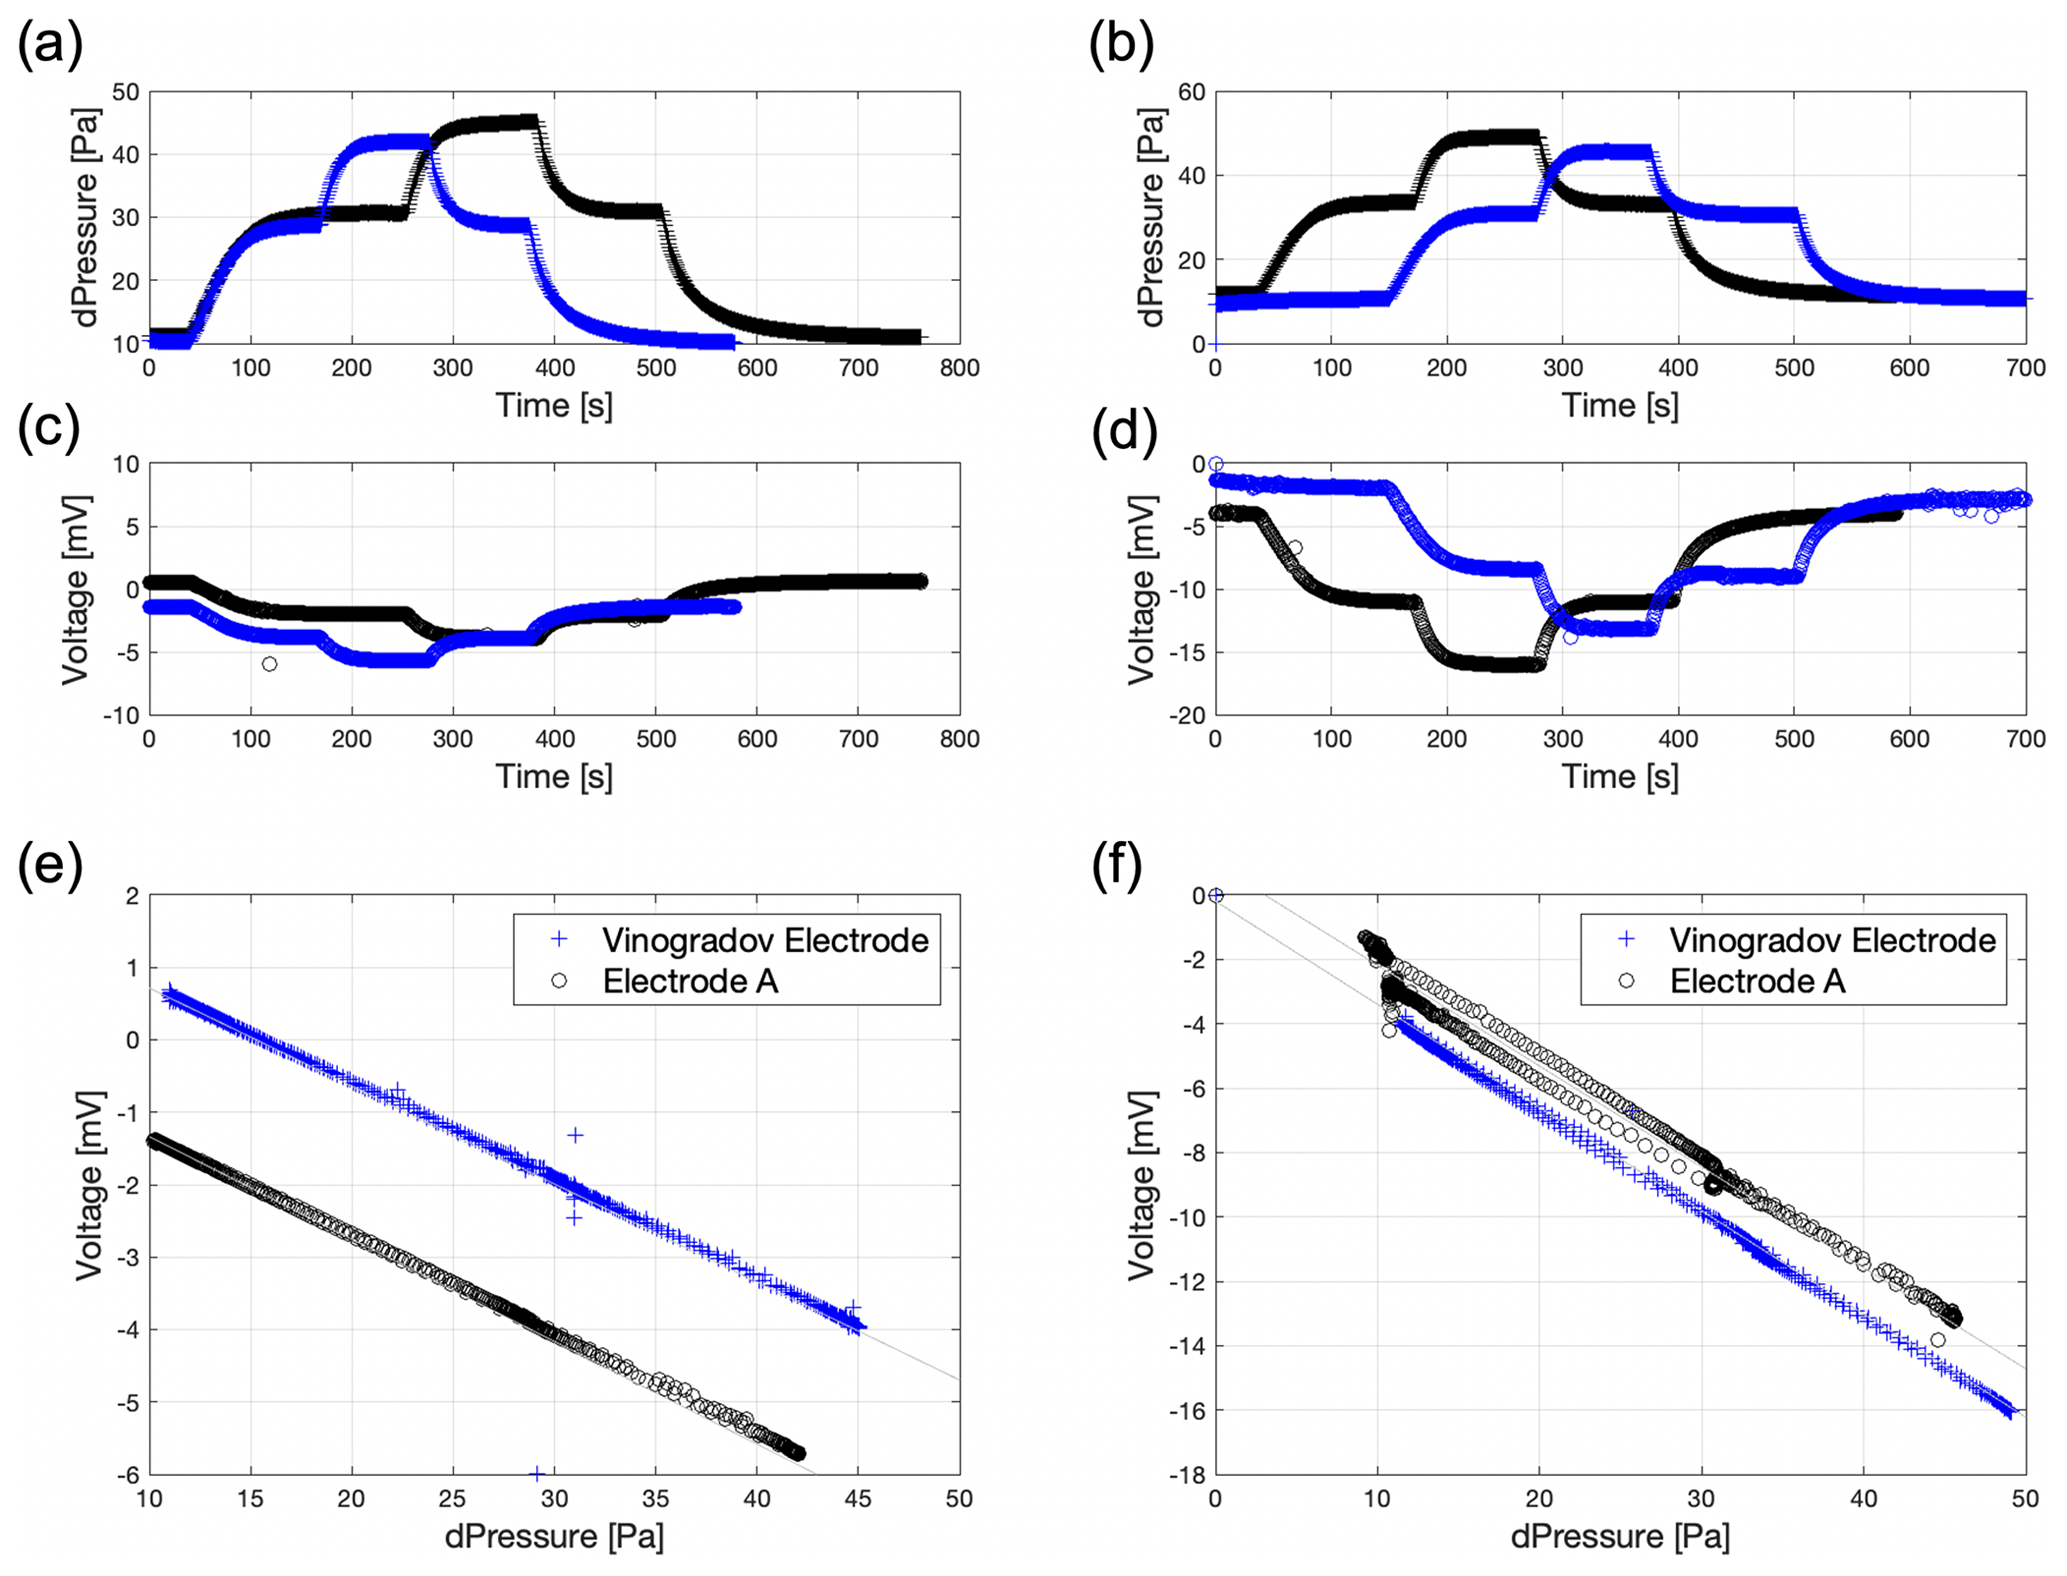
Figure 7Streaming potential results for the glass beads obtained using synthetic seawater (a, c, e) and tap water (b, d, f) comparing results from the VE and the developed Electrode A. Plots (a) and (b) show pressure change over time, plots (c) and (d) show voltage change over time, and plots (e) and (f) show stabilized voltage against stabilized pressure drop.
Figure 7a to d report examples of the “raw” data from each experiment, showing the pressure drop (Fig. 7a and b) and voltage (Fig. 7c and d) across the sample as a function of time. Separate experiments were conducted for each electrode type, giving rise to the data reported in blue (VE) and black (Electrode A).
The pressure data show good reproducibility across the two experiments, with each increase in pressure drop corresponding to an increase in the flow rate across the sample induced by the pumps. After each flow rate change, the pressure reaches a new stable value. The voltage data recorded by the different electrodes also show similar behaviour, with the voltage decreasing (becoming more negative) each time the pressure drop increases. After each flow rate change, the voltage reaches a new stable value. Figure 7e and f record the stabilized voltage plotted against stabilized pressure for each flow rate for the experiments with the different electrodes and the two different electrolytes. As discussed previously, a linear regression through these data yields a key property, the streaming potential coupling coefficient (C).
The coupling coefficient for the synthetic seawater electrolyte is measured to be 154 mV kPa−1 using the VEs and 142 mV kPa−1 using our new Electrode A, a difference of 7.8 %. The coupling coefficient for the tap water is measured to be 323 mV kPa−1 using the VE and 320 mV kPa−1 using our new Electrode A, a difference of just 1 %. The difference in the magnitude of the coupling coefficient obtained using tap water and seawater reflects their different compositions and total ionic strength and is consistent with data measured in numerous previous studies (e.g. Jaafar et al., 2009; Vinogradov et al., 2010, 2018).
3.3.2 Exclusion–diffusion potential experiment
Figures 8 and 9 show results from the exclusion–diffusion potential measurements using the same two electrolytes: synthetic seawater and tap water. We report only the column experiment used to determine the electrode potential here; the recorded electrical potential as a function of time is shown in Fig. 8.
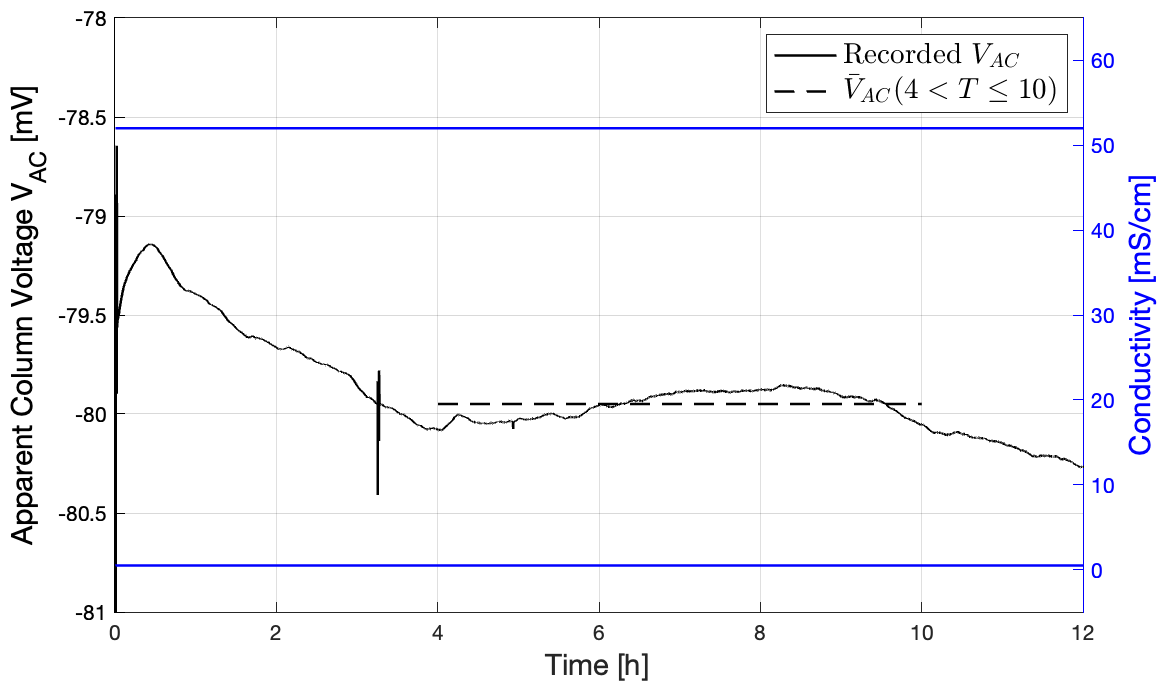
Figure 8Results from a column experiment using the tap water and synthetic seawater electrolytes described in Table 2; two examples of Electrode B were assembled using synthetic seawater. The figure shows the recorded apparent column voltage recorded against time; also plotted is mean voltage from t=4 to 10 h as a dashed line. The right-hand axis shows the conductivities at the top and bottom of the column (in blue).
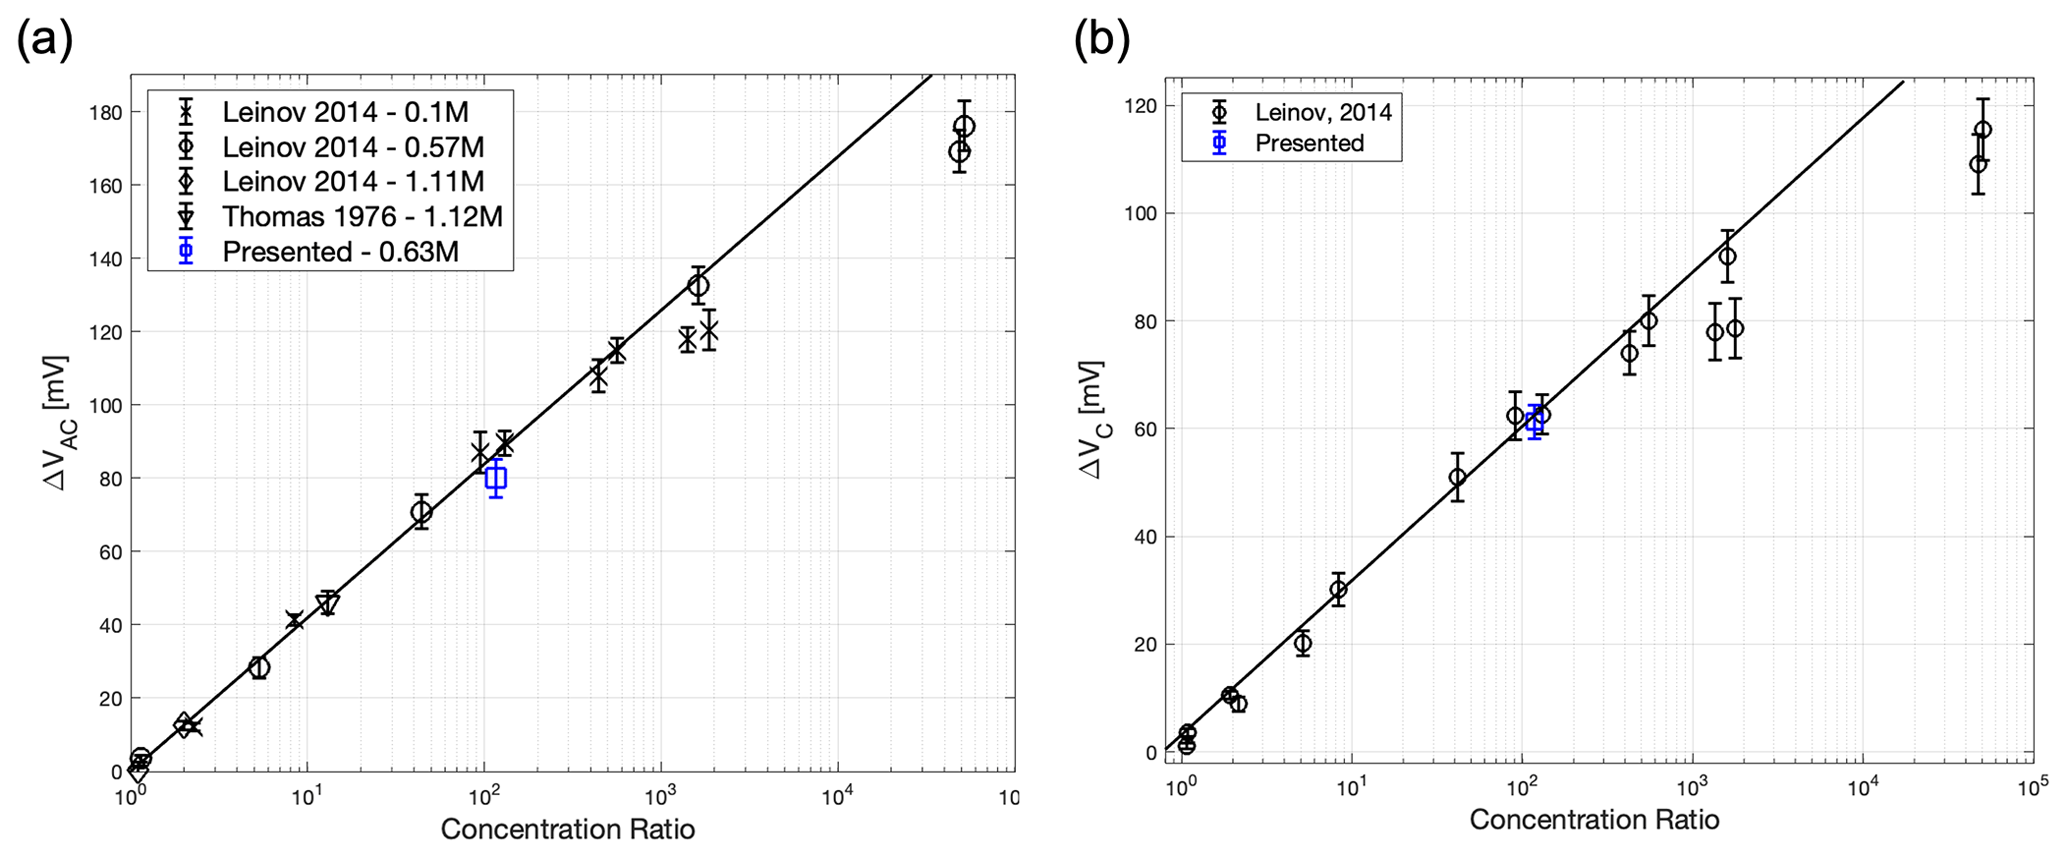
Figure 9Summary of the results from the column experiment. (a) Stabilized voltage as a function of concentration difference along the column for a fixed temperature of 298 K (20 ∘C). Also shown is a single data point from a similar experiment by Thomas (1976), as well as the data from Leinov and Jackson (2014), which were used to create the linear regression. (b) Electrode response calculated from (a) and compared to the data from Leinov and Jackson (2014), which were used to create the linear regression. The gradient of the linear regression yields the electrode concentration sensitivity.
There is an initial period up to 4 h during which the measured voltage varies as the electrodes equilibrate with the electrolytes, followed by a period of stable voltage up to 10 h, after which the local electrolyte concentration around the electrodes begins to change. The chosen stabilized voltage is shown as the dashed line to give the apparent column voltage of 79.95 mV. The diffusion potential of the two electrolytes used was calculated using the approach outlined in MacAllister et al. (2019) and found to be 18.7 mV; the electrolyte concentration ratio was 117. Figure 9a shows the stabilized voltage plotted against the electrolyte concentration ratio and previously published experiments reported in Leinov and Jackson (2014). Figure 9b shows the corresponding electrode potential obtained after subtracting the diffusion potential. Error bars denote the uncertainty in identifying the stable electrical potential. We observe an excellent match between the new measured data and the published data, showing that the new electrodes provide the same response as previous electrodes within experimental error.
The previous section demonstrated that the printed electrodes presented here provide comparable performance to the reference Vinogradov electrode. To demonstrate the flexibility of the rapid printing method when constructing electrodes, this section briefly details the use of Electrode B to monitor SP in a large tank experiment designed to replicate the “Henry problem” (Henry, 1964). Saline water (“synthetic seawater”) invades a porous medium (silica beads) saturated with freshwater (tap water) (see Table 2 and Etsias et al., 2021; Robinson et al., 2016), creating a wedge of saline water along the base of the porous medium. The experimental tank measures 1 m × 0.6 m × 0.014 m and was designed to be instrumented with 12 Electrode B examples mounted flush on the 25 mm thick acrylic rear wall of the tank (Fig. 10).
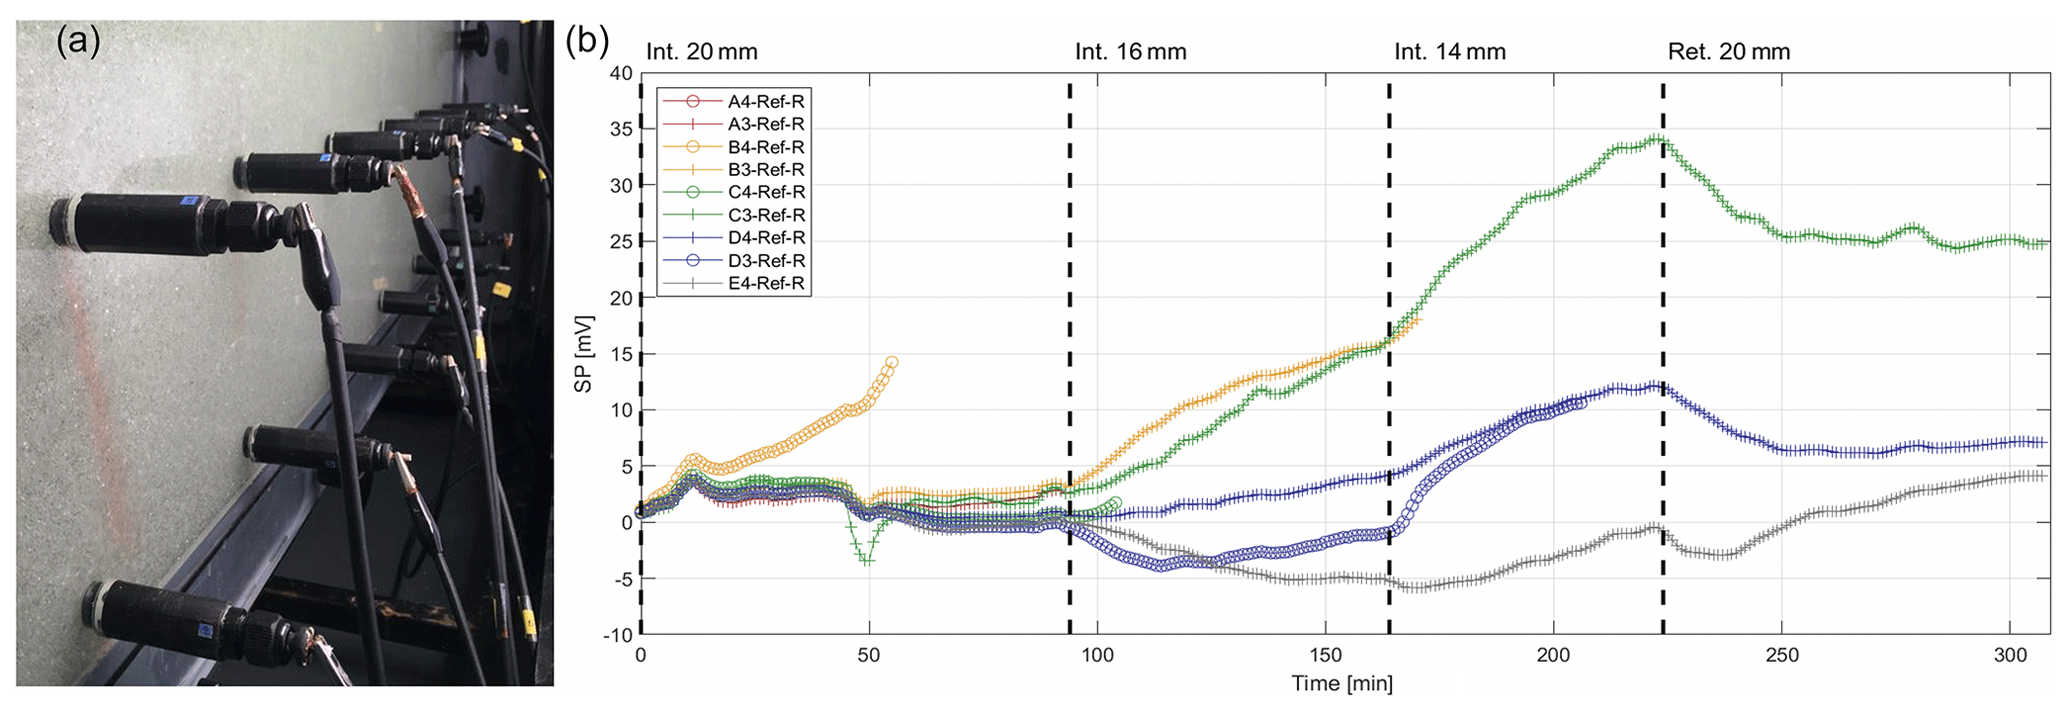
Figure 10A photo (a) and recorded SP signals (b) from flush-mounted Electrode B examples made with 0.63 M “synthetic seawater” in a homogenous synthetic aquifer made of 1.09 mm silica beads, undergoing saline intrusion when synthetic seawater displaces “freshwater” and then retreats.
The electrodes were recharged with the synthetic seawater electrolyte and mounted into the rear of the tank as shown in Fig. 10. The SP electrodes were referenced to the upper-leftmost electrode; all electrodes were assigned alphanumeric codes with a letter detailing their row and the number of their column in the array. From the right-hand side of the tank (nearest to A column of electrodes), the synthetic seawater was intruded into the tank in three stages corresponding to 20, 16, and 14 mm head differences and then retreated away in the fourth phase, returning to a 20 mm head difference (Etsias et al., 2021). The saline–freshwater interface was allowed to reach equilibrium in each phase. These phases are marked in Fig. 10. Note that when an electrode was overcome by the saline electrolyte, the recordings are omitted from Fig. 10.
The experimental results and their interpretation using numerical simulations are beyond the scope of this paper; what is of interest here is the stability and smoothness of the recorded SP signals. As shown in Fig. 10 (especially in the first 50 min of the experiment), the SP signals track each other, demonstrating a high degree of stability and replicability of the measurements. The low level of noise and the reversal of signals during the retreat phase (after 224 min) further demonstrate that the electrodes are stable and sensitive to the self-potential signals generated in the experiment.
We have reported the development of two simple, robust, and stable printed non-polarizing electrodes for self-potential monitoring that can be modified in design for high- and low-pressure experiments. The electrode refreshment process described above is critical to the stability of the electrodes; an aggressive abrasive stripping of the silver electrode is strongly recommended. The electrodes are compatible with many experimental fittings, including flush mounting, and are considerably cheaper to manufacture than the reference electrode against which their performance was compared. When designing probes, fully understanding the use cases is key, including pressure requirements and the length of the experiment. This allows users to reduce over-design. A quick electrode removal system, using a cable gland, was trialled and found to be reliable. None of the materials used in the various manufacturing techniques used here were found to interact or affect the stability of the results. When manufacturing electrodes, printing all in a vertical orientation is strongly recommended; and if including threads in a design, it is highly advisable to have the appropriate (threading) tap on hand in the case of printing defects. Full details, designs, and further materials can be found in the Supplement (including 3D print .stl files).
This study confirms that commercially available 3D printing methods, such as fused filament fabrication (FFF) and stereolithography (SLA), can produce electrode parts that have no defects or residues that might affect the efficacy of this type of non-polarizing electrode. The new method is inexpensive and robust, and it enables the user to modify the electrode casing for any use, as shown in Fig. 10. Further parametric studies, removal of the membrane (through integrated printing), and other refinements will be the focus of future work, as will the experiments that these electrodes were designed to monitor.
Print data and designs are given in the Supplement with this paper.
The supplement related to this article is available online at: https://doi.org/10.5194/gi-12-259-2023-supplement.
TSLR designed and built the electrodes. TSLR and VAK tested the electrodes, reporting to MDJ and APB. MDJ and APB interpreted the results, and all co-authors contributed to the preparation of the paper.
The contact author has declared that none of the authors has any competing interests.
Publisher's note: Copernicus Publications remains neutral with regard to jurisdictional claims made in the text, published maps, institutional affiliations, or any other geographical representation in this paper. While Copernicus Publications makes every effort to include appropriate place names, the final responsibility lies with the authors.
This research has been supported by the Engineering and Physical Sciences Research Council (grant no. EP/R019258/1 SALINA).
This paper was edited by Lev Eppelbaum and reviewed by two anonymous referees.
Adamski, K., Kawa, B., and Walczak, R.: 3D Printed Flowmeter Based on Venturi Effect with Integrated Pressure Sensors, Sensors MDPI, 2, 1509, https://doi.org/10.3390/proceedings2131509, 2018.
Al Mahrouqi, D., Vinogradov, J., and Jackson, M. D.: Zeta potential of artificial and natural calcite in aqueous solution, Adv. Colloid Interface Sci., 240, 60–76, https://doi.org/10.1016/j.cis.2016.12.006, 2017.
Aubert, M. and Atangana, Q. Y.: Self-Potential Method in Hydrogeological Exploration of Volcanic Areas, Groundwater, 34, 1010–1016, https://doi.org/10.1111/j.1745-6584.1996.tb02166.x, 1996.
Bogoslovsky, V. V. and Ogilvy, A. A.: Deformations of natural electric fields near drainage structures, Geophys. Prospect., 21, 716–723, https://doi.org/10.1111/j.1365-2478.1973.tb00053.x, 1973.
Bolèkve, J., Revil, A., Janod, F., Mattiuzzo, J. L., and Fry, J.: Preferential fluid flow pathways in embankment dams imaged by self-potential tomography, Near Surf. Geophys., 7, 1569–4445, https://doi.org/10.3997/1873-0604.2009012, 2009.
Collini, H., Li, S., Jackson, M. D., Agenet, N., Rashid, B., and Couves, J.: Zeta potential in intact carbonates at reservoir conditions and its impact on oil recovery during controlled salinity waterflooding, Fuel, 226, 116927, https://doi.org/10.1016/j.fuel.2019.116927, 2020.
Corry, C. E., De Moully, G. T., and Gerety, M. T.: Field Procedure Manual for Self-Potential Surveys. Arizona USA, Z.E.R.O. Publishing, 1983.
Corwin, R. F.: The Self-Potential Method for Environmental and Engineering Applications, in: Anonymous Geotechnical and Environmental Geophysics: Volume I, Review and Tutorial, Society of Exploration Geophysicists, 127–146, https://doi.org/10.1017/CBO9781139094252, 1980.
Eppelbaum, L. V.: Quantitative analysis of self-potential anomalies in archaeological sites of Israel: an overview, Environ. Earth Sci., 79, 377, https://doi.org/10.1007/s12665-020-09117-w, 2020.
Eppelbaum, L. V.: Advanced analysis of self-potential anomalies: Review of case studies from mining, archaeology and environment, Geosciences, 11, 203–248, https://doi.org/10.3390/geosciences11050194, 2021.
Etsias, G., Hamill, G. A., Campbell, D., Straney, R., Benner, E. M., Águila, J. F., McDonnell, M. C., Ahmed, A. A., and Flynn, R.: Laboratory and numerical investigation of saline intrusion in fractured coastal aquifers, Adv. Water Resour., 149, 103866, https://doi.org/10.1016/j.advwatres.2021.103866, 2021.
Finizola, A., Lénat, J., Macedo, O., Ramos, D., Thouret, J., and Sortino, F.: Fluid circulation and structural discontinuities inside Misti volcano (Peru) inferred from self-potential measurements, J. Volcanol. Geoth. Res., 135, 343–360, https://doi.org/10.1016/j.jvolgeores.2004.03.009, 2004.
Graham, M. T., MacAllister, D. J., Vinogradov, J., Jackson, M. D., and Butler, A. P.: Self-Potential as a Predictor of Seawater Intrusion in Coastal Groundwater Boreholes, Water Resour. Res., 54, 6055–6071, https://doi.org/10.1029/2018WR022972, 2018.
Henry, H. R.: Effects of dispersion on salt encroachment in coastal aquifers, Sea water in coastal aquifers, Geological Survey Water-Supply Paper 1613-C, Geological Survey, 70–84, 1964.
Ishido, T.: Self-potential generation by subsurface water flow through electrokinetic coupling, in: Detection of Subsurface Flow Phenomena, Lecture Notes in Earth Sciences, edited by: Merkler, G., Militzer, H., Hötzl, H., Armbruster, H., and Brauns, J., Springer, Berlin, Heidelberg, https://doi.org/10.1007/BFb0011635, 1989.
Jaafar, M. Z., Vinogradov, J., and Jackson, M. D.: Measurement of streaming potential coupling coefficient in sandstones saturated with high salinity NaCl brine, Geophys. Res. Lett., 36, L21306, https://doi.org/10.1029/2009GL040549, 2009.
Jackson, M.: Tools and Techniques: Self-Potential Methods, in: Treatise on Geophysics, Elsevier, 261–293, https://doi.org/10.1016/B978-0-444-53802-4.00208-6, 2015.
Jackson, M. D., Butler, A. P., and Vinogradov, J.: Measurement of spontaneous potentials in chalk with application to aquifer characterization in the southern UK, Quart. J. Eng. Geol. Hydrol., 45, 457–471, https://doi.org/10.1144/qjegh2011-021, 2012.
Jardani, A., Revil, A., and Dupont, J. P.: Self-potential tomography applied to the determination of cavities, Geophys. Res. Lett., 33, L13401, https://doi.org/10.1029/2006GL026028, 2006.
Jardani, A., Revil, A., Bolève, A., Crespy, A., Dupont, J. Barrash, W., and Malama, B.: Tomography of the Darcy velocity from self-potential measurements, Geophys. Res. Lett., 34, L24403, https://doi.org/10.1029/2007GL031907, 2007.
KCL: Free Station (KCL), http://www.freestation.org/home (last access: October 2021), 2021.
Leinov, E. and Jackson, M. D. Experimental measurements of the SP response to concentration and temperature gradients in sandstones with application to subsurface geophysical monitoring, J. Geophys. Res.-Solid, 119, 6855–6876, https://doi.org/10.1002/2014JB011249, 2014.
Li, S., Leroy, P., Heberling, F., Devau, N., Jougnot, D., and Chiaberge, C.: Influence of surface conductivity on the apparent zeta potential of calcite, J. Colloid Interface Sci., 468, 262–275, https://doi.org/10.1016/j.jcis.2016.01.075, 2016.
Linde, N. and Revil, A.: Inverting self-potential data for redox potentials of contaminant plumes, Geophys. Res. Lett., 34, L14302, https://doi.org/10.1029/2007GL030084, 2007.
MacAllister, D. J., Graham, M. T., Vinogradov, J., Butler, A. P., and Jackson, M. D.: Characterizing the Self-Potential Response to Concentration Gradients in Heterogeneous Subsurface Environments, J. Geophys. Res.-Solid, 124, 7918–7933, https://doi.org/10.1029/2019jb017829, 2019.
Maineult, A., Strobach, E., and Renner, J. Ö.: Self-potential signals induced by periodic pumping tests, J. Geophys. Res.-Solid, 113, B01203, https://doi.org/10.1029/2007JB005193, 2008.
Minsley, B. J., Sogade, J., and Morgan, F. D.: Three-dimensional source inversion of self-potential data, J. Geophys. Res.-Solid, 112, B02202, https://doi.org/10.1029/2006JB004262, 2007.
Naudet, V., Revil, A., Bottero, J., and Bégassat, P.: Relationship between self-potential (SP) signals and redox conditions in contaminated groundwater, Geophys. Res. Lett., 30, 2091, https://doi.org/10.1029/2003GL018096, 2003.
Naudet, V., Revil, A., Rizzo, E., Bottero, J.-Y., and Bégassat, P.: Groundwater redox conditions and conductivity in a contaminant plume from geoelectrical investigations, Hydrol. Earth Syst. Sci., 8, 8–22, https://doi.org/10.5194/hess-8-8-2004, 2004.
Ni, Y., Ji, R., Long, K., Bu, T., Chen, K., and Zhuang, S. A review of 3D-printed sensors, Appl. Spectrosc. Rev., 52, 167–260, https://doi.org/10.1080/05704928.2017.1287082, 2017.
Nyquist, J. E. and Corry, C. E., Self-potential: The ugly duckling of environmental geophysics, Leading Edge, 21, 446–451, https://doi.org/10.1190/1.1481251, 2002.
Ogilvy, A. A., Ayed, M. A., and Bogoslovsky, V. A.: Geophysical Studies of Water Leakages From Reservoirs, Geophys. Prospect., 17, 36–62, https://doi.org/10.1111/j.1365-2478.1969.tb02071.x, 1969.
Perrier, F. and Pant, S. R.: Noise Reduction in Long-term Self-potential Monitoring with Travelling Electrode Referencing, Pure Appl. Geophys., 162, 165–179, https://doi.org/10.1007/s00024-004-2585-3, 2005.
Perrier, F., Petiau, G., Clerc, G., Bogorodsky, V. V., Erkul, E., Jouniaux, L., Lesmes, D. P., Macnae, J., Meunier, J., Morgan, D., Nascimento, D., Oettinger, G., Schwarz, G., Toh, H., Valiant, M. J., Vozoff, K., and Yazicivcakin, O.: A One-Year Systematic Study of Electrodes for Long Period Measurements of the Electric Field in Geophysical Environments, J. Geomagnet. Geoelect., 49, 1677–1696, https://doi.org/10.5636/jgg.49.1677, 1997.
Petiau, G.: Second Generation of Lead-lead Chloride Electrodes for Geophysical Applications, Pure Appl. Geophys., 157, 357–382, https://doi.org/10.1007/s000240050004, 2000.
Petiau, G. and Dupis, A.: Noise, Temperature Coefficient, and Long Time Stability of Electrodes for Telluric Observations, Geophys. Prospect., 28, 792–804, https://doi.org/10.1111/j.1365-2478.1980.tb01261.x, 1980.
Revil, A., Naudet, V., Nouzaret, J., and Pessel, M.: Principles of electrography applied to self-potential electrokinetic sources and hydrogeological applications, Water Resour. Res., 39, 1114, https://doi.org/10.1029/2001WR000916, 2003.
Rizzo, E., Suski, B., Revil, A., Straface, S., and Troisi, S.: Self-potential signals associated with pumping tests experiments, J. Geophys. Res.-Solid, 109, B10203, https://doi.org/10.1029/2004JB003049, 2004.
Robinson, G., Ahmed, A. A., and Hamill, G. A: Experimental saltwater intrusion in coastal aquifers using automated image analysis: Applications to homogeneous aquifers, J. Hydrol., 538, 304–313, https://doi.org/10.1016/j.jhydrol.2016.04.017, 2016.
Rohaizad, N., Mayorga-Martinez, C. C., Novotný, R., Webster, R. D., and Pumera, M.: 3D-printed Ag/AgCl pseudo-reference electrodes, Electrochem. Commun., 103, 104–108, https://doi.org/10.1016/j.elecom.2019.05.010, 2019.
Sailhac, P. and Gibert, D: Identification of sources of potential fields with the continuous wavelet transform: Two-dimensional wavelets and multipolar approximations, J. Geophys. Res.-Solid, 108, 2262, https://doi.org/10.1029/2002JB002021, 2003.
Schuett, F. M., Zeller, S. J., Eckl, M. J., Matzik, F. M., Heubach, M.-K., Geng, T., Hermann, J. M., Uhl, M., Kibler, L. A., Engstfeld, A. K., and Jacob, T.: Versatile 3D-Printed Micro-Reference Electrodes for Aqueous and Non-Aqueous Solutions, Angew. Chem. Int. Ed., 60, 22783, https://doi.org/10.1002/anie.202105871, 2022.
Sibug-Torres, S. M., Go, L., and Enriquez., E.: Fabrication of a 3D-Printed Porous Junction for Ag|AgCl| gel-KCl Reference Electrode, Chemo Sensors, 8, 130, https://doi.org/10.3390/chemosensors8040130, 2020.
Thomas, E. C.: The determination of Qv from membrane potential measurements in shaly sands, J. Petrol. Technol., 28, 1087–1096, https://doi.org/10.2118/5505-PA, 1976.
Vinogradov, J. and Jackson, M. D.: Zeta potential in intact natural sandstones at elevated temperatures, Geophys. Res. Lett., 42, 6287–6294, https://doi.org/10.1002/2015GL064795, 2015.
Vinogradov, J., Jaafar, M. Z., and Jackson, M. D.: Measurement of streaming potential coupling coefficient in sandstones saturated with natural and artificial brines at high salinity, J. Geophys. Res.-Solid, 115, B12204, https://doi.org/10.1029/2010JB007593, 2010.
Vinogradov, J., Jackson, M. D., and Chamerois, M.: Zeta potential in sandpacks: Effect of temperature, electrolyte pH, ionic strength and divalent cations, Coll. Surf. A, 553, 259–271, https://doi.org/10.1016/j.colsurfa.2018.05.048, 2018.
Weigand, M., Wagner, F. M., Limbrock, J. K., Hilbich, C., Hauck, C., and Kemna, A.: A monitoring system for spatiotemporal electrical self-potential measurements in cryospheric environments, Geosci. Instrum. Method. Data Syst., 9, 317–336, https://doi.org/10.5194/gi-9-317-2020, 2020.