the Creative Commons Attribution 4.0 License.
the Creative Commons Attribution 4.0 License.
 | 20 Aug 2024
Enabling in situ validation of mitigation algorithms for magnetic interference via a laboratory-generated dataset
Matthew G. Finley
Allison M. Flores
Katherine J. Morris
Robert M. Broadfoot
Sam Hisel
Jason Homann
Chris Piker
Ananya Sen Gupta
David M. Miles
Magnetometer measurements are one of the critical components necessary for improving our understanding of the intricate physical processes coupling mass, momentum, and energy within near-Earth space and throughout our solar system. However, these measurements are often contaminated by stray magnetic fields from the spacecraft hosting the magnetic-field sensors, and the data often require the application of interference mitigation algorithms prior to scientific use. Rigorous numerical validation of these techniques can be challenging when the techniques are applied to in situ spaceflight data as a ground truth for the local magnetic field is often unavailable. This paper introduces and details the generation of an open-source dataset designed to facilitate the assessment of interference mitigation techniques for magnetic-field data collected during spaceflight missions. The dataset contains over 100 h of magnetic-field data, comprising mixtures of near-direct-current (near-DC) trends, physically synthesized interference, and pseudo-geophysical phenomena. These constituent source signals have been independently captured by four synchronized magnetometers sampling at a high cadence and combined into 30 min intervals of data representing events and interference seen in historic missions. The physical locations of the four magnetometers relative to the interference sources enable researchers to test their interference mitigation algorithms with various magnetometer suite configurations, and the dataset also provides a ground truth for the underlying interference signals, enabling the rigorous quantification of the results of past, present, and future interference mitigation efforts.
- Article
(4650 KB) - Full-text XML
- BibTeX
- EndNote


In situ magnetometer measurements are a vital component of our search to understand the various physical processes that couple mass, momentum, and energy throughout near-Earth space and our solar system. Magnetometers have been used to collect scientific data since the first days of humanity's exploration of space. Early missions such as Sputnik 3, Pioneer 1, and Explorer 6 all carried scientific magnetometers (Gordon and Brown, 1972). Since then, many advancements have been made in the science of the design and implementation of triaxial spaceflight magnetometers, helping magnetometer suites become capable of making measurements from Earth (Russell et al., 2016; Slavin et al., 2008), Mars (Connerney et al., 2015), the harsh radiation environment around Jupiter (Connerney et al., 2017), and even the Sun (Bale et al., 2016). Novel manufacturing processes now provide bespoke ferromagnetic fluxgate cores (Miles et al., 2019) and allow for unique magnetometer topologies suitable for applications such as large constellations of nanosatellites (Greene et al., 2022).
Despite improvements made to the magnetic-field sensors themselves, magnetometer measurements are often contaminated by stray magnetic fields emanating from the spacecraft on which they are deployed. These interference sources can include the battery and solar-panel systems used to provide the spacecraft's power, the reaction wheels and magnetorquers used to control the spacecraft's attitude, and even the ferromagnetic materials used in the construction of the spacecraft itself (e.g., Broadfoot et al., 2022; Stolle et al., 2021; Styp-Rekowski et al., 2022). Historically, this interference has been mitigated by placing the magnetic-field sensor at the end of a long boom, increasing the physical distance from the spacecraft and its associated magnetic-noise sources. An additional technique for reducing the impact of stray fields involves deploying multiple magnetometers at different distances along the boom; the resulting magnetic gradient between the two sensors can be fit to an ideal dipole (or multipole, if necessary) and removed from the original measurements, resulting in improved data fidelity (Ness et al., 1971).
Although this standard gradiometric approach has seen success on a wide variety of missions, it relies on long booms to achieve optimal performance. Historic missions, such as MAGSAT and Voyager, used boom lengths ranging from 6 to 13 m (Langel et al., 1982; Miller, 1979). To reduce the cost and complexity associated with magnetic-field measurements, many modern missions now utilize shorter booms. For example, the Parker Solar Probe has fluxgate magnetometers deployed up to 2.7 m from the host spacecraft (Bale et al., 2016), and CASSIOPE/Swarm-Echo operates with a 0.9 m boom (Wallis et al., 2015). The increasingly popular CubeSat form factor may require even shorter booms due to its significant constraints on mass, volume, and cost (Clagett et al., 2017; Miles et al., 2016). Even though these short booms reduce mission cost and technical complexity, they diminish the effectiveness of the standard gradiometric interference mitigation approach, especially when the dominating interference is caused by time-varying sources, such as reaction wheels. This is because the reduced separation from the spacecraft places the sensors in the interference source's near field, meaning complex multipole terms can no longer be ignored. Multipole models can be generated to remove the time-varying interference, but developing these models often proves challenging due to their requirement for the exhaustive pre-flight characterization of all possible interference sources.
The desire for high-fidelity magnetic-field data with limited boom length has recently led to the development of a variety of new approaches for the mitigation of local magnetic interference. These new techniques range from unique magnetometer configurations – such as the digital-array gas radiometer (DAGR) on the Dellingr cube satellite (Clagett et al., 2017) and the NEMISIS (Near Earth Magnetometer Instrument in a Small Integrated System) instrument on Lunar Gateway's HERMES (Heliophysics Environmental and Radiation Measurement Experiment Suite) (Burt et al., 2022; Paterson et al., 2023) – to the development of new algorithms for interference identification and removal (Bowen et al., 2020; Constantinescu et al., 2020; Finley et al., 2023a, b; Hoffmann and Moldwin, 2022; Imajo et al., 2021; Sen Gupta and Miles, 2023). The performance of the interference mitigation offered by these techniques, however, is often difficult to rigorously quantify due to the unavailability of ground truth data from in situ measurements.
This paper provides details of an open source, laboratory-generated dataset intended to enable the numerical analysis of existing and future interference mitigation techniques for in situ magnetic-field data – specifically, ∼10 h of magnetic-field data from four sensors in a practical configuration have been captured. The resulting dataset contains data exhibiting large near-DC (near-direct-current) trends, physically synthesized reaction wheel interference, and pseudo-geomagnetic phenomena. Further, the measurement intervals of these three broad data categories were captured individually prior to their combination, effectively providing a ground truth for the magnetic interference and the residual geophysical fields, enabling vigorous quantification of the performance of the interference mitigation techniques. Additionally, the method of data combination used in this paper can yield >120 h of unique field measurements suitable for testing a variety of data-intensive algorithms, such as those provided by machine learning techniques.
Section 2 describes the physical apparatus used to provide magnetic stimulus and capture magnetic-field data. Section 3 explains the stimulus applied to generate the three data subsets (i.e., interference, geomagnetic phenomena, and low-frequency trend), the filtering, and additional steps taken to provide the combined result and shows several examples of the combined data product. Section 4 discusses the potential limitations of the dataset and avenues for future work. Finally, Sect. 5 summarizes and concludes this paper.
This section describes the physical apparatus used to produce the dataset described in this paper.
2.1 Magnetometers
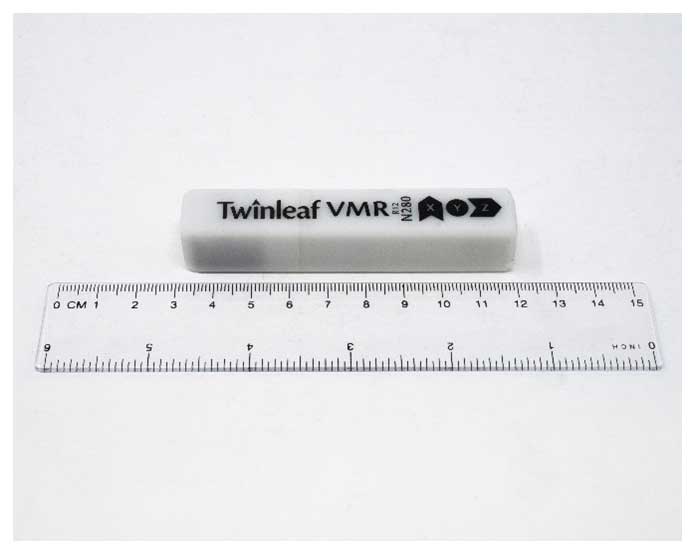
The magnetic-field sensors used for data acquisition as part of this effort are commercially available magnetoresistive vector magnetometers (VMRs) produced by Twinleaf LLC. These triaxial sensors have a sensitivity of 300 pT Hz, with a linear field range of ±100 000 nT, and are assumed to be calibrated out of the box. Four of these Twinleaf VMR sensors were synchronized and sampled at 200 Hz using the Twinleaf SYNC4 networking hub and associated Twinleaf I/O software. Figure 1 shows one of these magnetometers.
2.2 Merritt coil
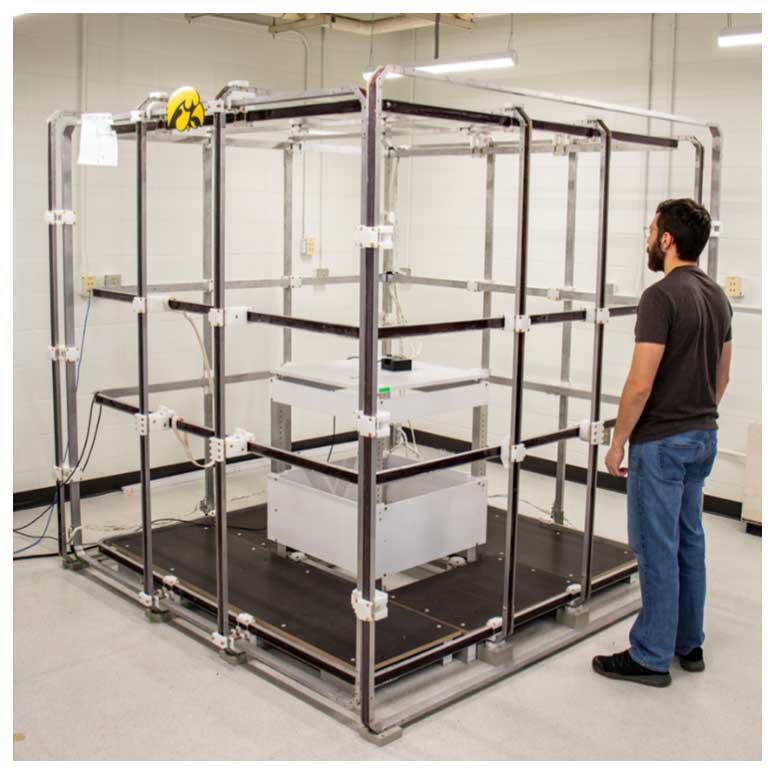
The apparatus used to simulate large near-DC magnetic fields is a 2 m3 three-axis Merritt coil system (Merritt et al., 1983), shown in Fig. 2. This coil system was manufactured by Serviciencia (model BM4-2000-3-A). For the collection of this dataset, the coil system was connected to a Bartington PA1 power amplifier and a CU1 control unit. The coil system has a field homogeneity of ±1 % in a cube with sides measuring ∼1 m and can sustain a maximum steady field of ±0.9 mT. The signal generated by the coil control software is limited by the resolution of the signal generator and, according to the instruction manual, has difficulty generating signals lower than 1 Hz. Signals generated at frequencies lower than ∼1 Hz will exhibit significant amplitude discontinuities. However, simple filtering can be applied after data collection to mitigate the amplitude stepping in such cases. Data processing is discussed in greater detail in Sect. 3.2.
The coils are constructed to avoid creating conducting loops in the coil formers that could induce eddy currents, enabling the formers to operate as single-loop alternating-current (AC) stimulus coils separately from the system. This utility allows for interesting time-varying pseudo-geomagnetic fields, such as wave packets and chirps, to be applied inside the coil via a function generator (in this case, a Stanford Research Systems (SRS) DS360 Ultra Low Distortion Function Generator). Note that the coil system was operated in an open-loop configuration, meaning that no active compensation was applied to cancel the local magnetic fields. This helps enhance the complexity of these synthetic geophysical fields by introducing fields from local magnetic phenomena.
2.3 Interference sources
The primary objective of this effort was to simulate magnetic interference from sources that are often difficult to characterize and remove while maintaining an observable ground truth for numerical validation. Spacecraft are often contaminated by time-varying magnetic interference from the spinning reaction wheels used to control the vehicle's attitude. These ferromagnetic platters often rotate at rates between 2 Hz (e.g., the Parker Solar Probe; Bowen et al., 2020) and 15 Hz (e.g., Swarm-Echo; Wallis et al., 2015). To simulate these reaction wheels, two Greartisan ZGB37RG DC 12 V 1000 RPM (∼17 Hz) electric motors were used to rotate 3D-printed plates with 0.375 in. (0.9525 cm) inset cast-iron strips. Figure 3 shows the motor with the rotating plate attached.
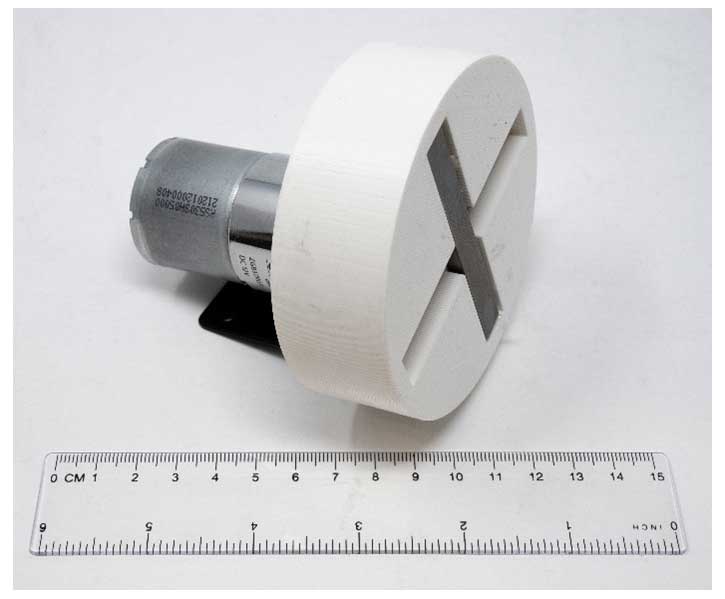
Figure 3Low-frequency motor and attached plate with inset cast-iron strips, designed to simulate spacecraft reaction wheels.
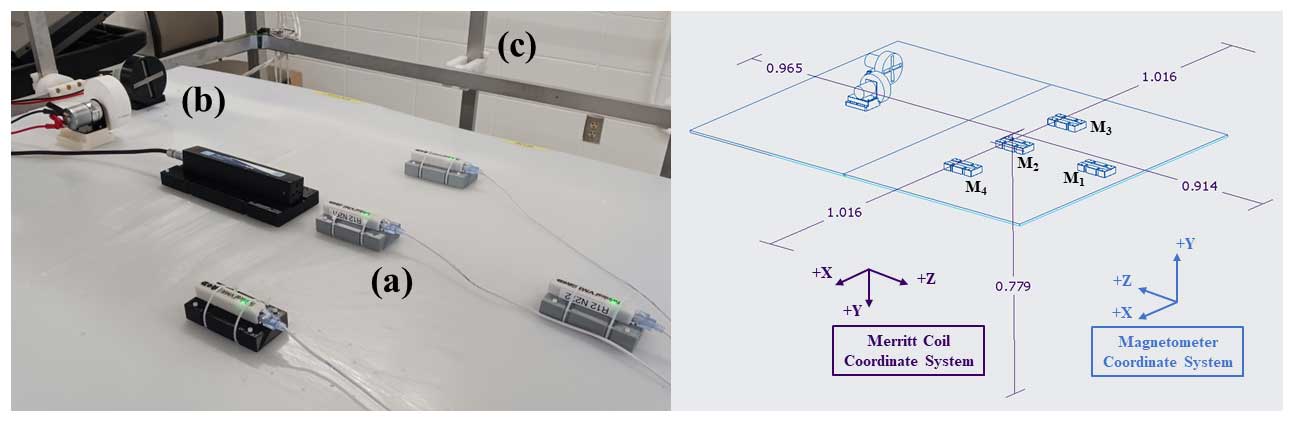
Figure 4Experimental setup used for data collection. Left panel shows a photograph of the experimental setup. (a) Four Twinleaf VMR magnetometers (i.e., M1–M4) used to capture magnetic-field data. (b) DC motors with attached ferromagnetic plates that were used to simulate the reaction wheels of the spacecraft. (c) Merritt coil system used to simulate geophysical fields. Note that the black rectangular object between panels (a) and (b) is a reference magnetometer that was used in this effort to ensure the proper operation of the coil system and was not used for data collection. Right panel shows a schematic of the experimental setup illustrating measurements (in meters) referenced against the Merritt coil. Merritt coil and magnetometer coordinate systems are also illustrated.
2.4 Integrated apparatus
To ensure consistency across multiple test intervals, the motors and magnetometers were rigidly mounted to a nonmagnetic plate, which was in turn mounted inside the Merritt coil. Special 3D-printed mounts were designed for both the simulated reaction wheels and magnetometers to ensure proper alignment with the coil system and each other. Figure 4 provides a photograph of the integrated setup (left) and a technical drawing of the total apparatus (right). Figure 4a shows the four Twinleaf VMR magnetometers mounted in a configuration that enables the analysis of multiple magnetometer configurations. For example, using only the colinear combination of M1 and M2 is representative of a traditional gradiometer configuration, whereas the combination of M2–M4 may be more similar to bus-mounted configurations. This enables users to test interference mitigation algorithms against various magnetometer suite topologies, which can be useful for missions that do not utilize a traditional colinear gradiometer configuration (e.g., the upcoming HERMES NEMISIS magnetometers). Figure 4b shows the two simulated reaction wheels, seen in greater detail in Fig. 3. The Merritt coil used to generate large magnetic trends is partially shown in Fig. 4c. The large rectangular object between the Twinleaf VMRs and simulated reaction wheels is a reference magnetometer used during the initial testing and setup of the coil system and is not relevant to the output dataset. The technical drawing provides measurements (in meters) referenced against the coil system. The sensors are located near the center of the coil system and should therefore be within the region of assumed homogeneity. Note that the labels M1–M4 in the technical drawing correspond to the labels associated with each magnetometer in the output dataset.
This section provides details of the data collection and data-processing steps taken in the generation of this dataset. Note that all applied voltages discussed in this section are given in terms of VRMS (root-mean-square voltage).
3.1 Data acquisition
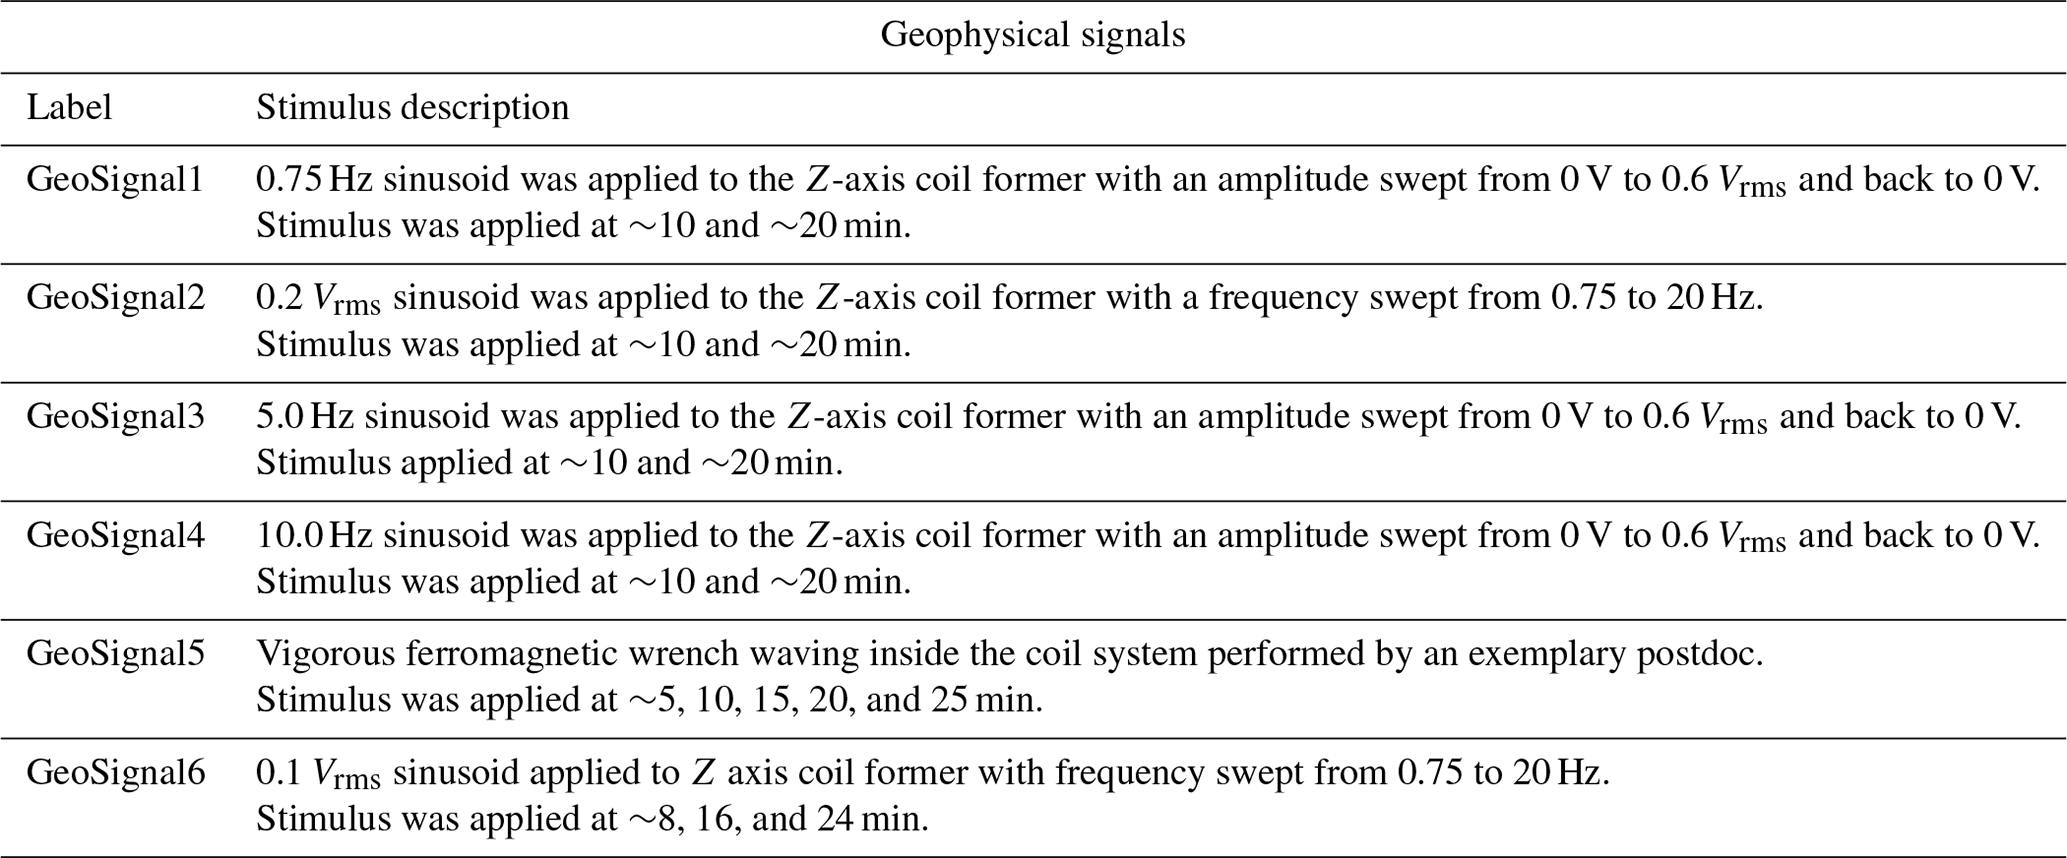
Following the deployment of the experimental setup in the coil system, various stimuli were applied to serve as proxies for the Earth's magnetic field, magnetic interference, and geophysical signals; these were observed by an orbiting spacecraft. Table 1 describes the different stimuli applied to the Merritt coil system (discussed in Sect. 2.2) used to generate the large near-DC field serving as a proxy for the Earth's magnetic field. Table 2 describes the stimuli applied to the motors (discussed in Sect. 2.3) used to generate physically synthesized reaction wheel interference. Table 3 describes the stimuli applied to the coil formers and within the coil system, which were used to create pseudo-geophysical wave packets and signals. The component signals corresponding to each stimulus, measured by the centermost magnetometer and shown in Tables 1–3, are described in detail in this paper's Appendix.
Table 1Description of the stimulus applied to generate near-DC trends as a proxy for the Earth's magnetic field.
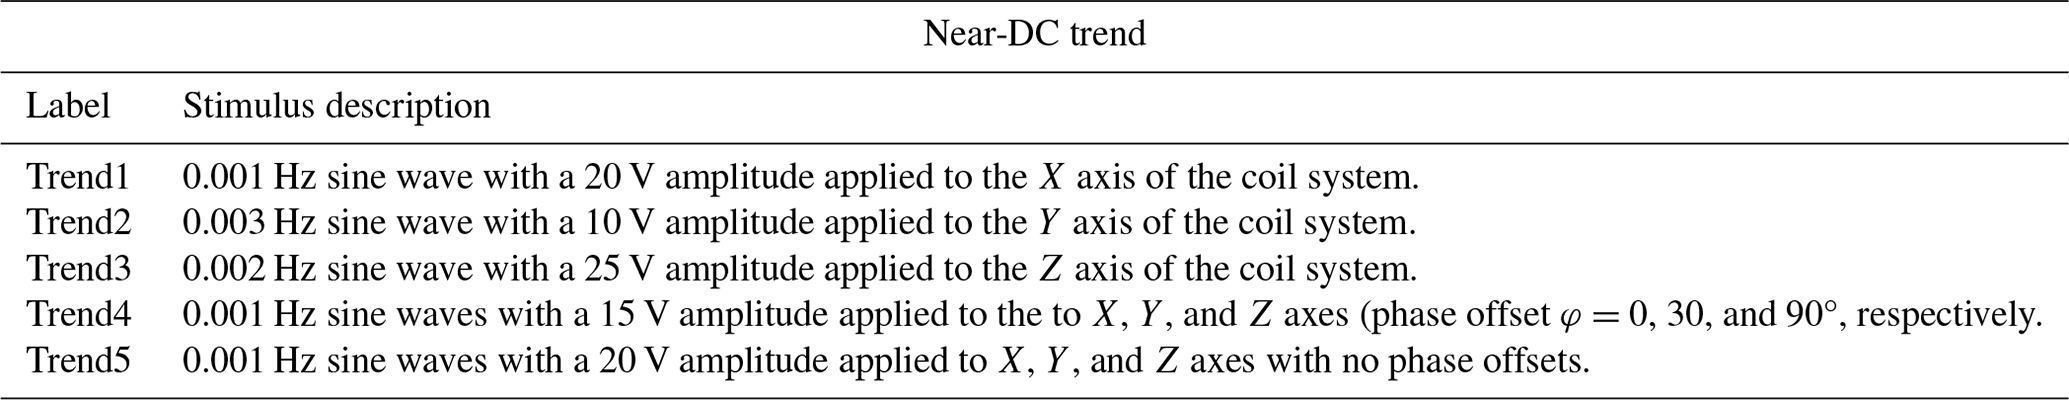
Table 2Description of the stimulus applied to generate magnetic interference as a proxy for spacecraft reaction wheels. Variable voltages induce variable speeds, simulating spacecraft maneuvers.
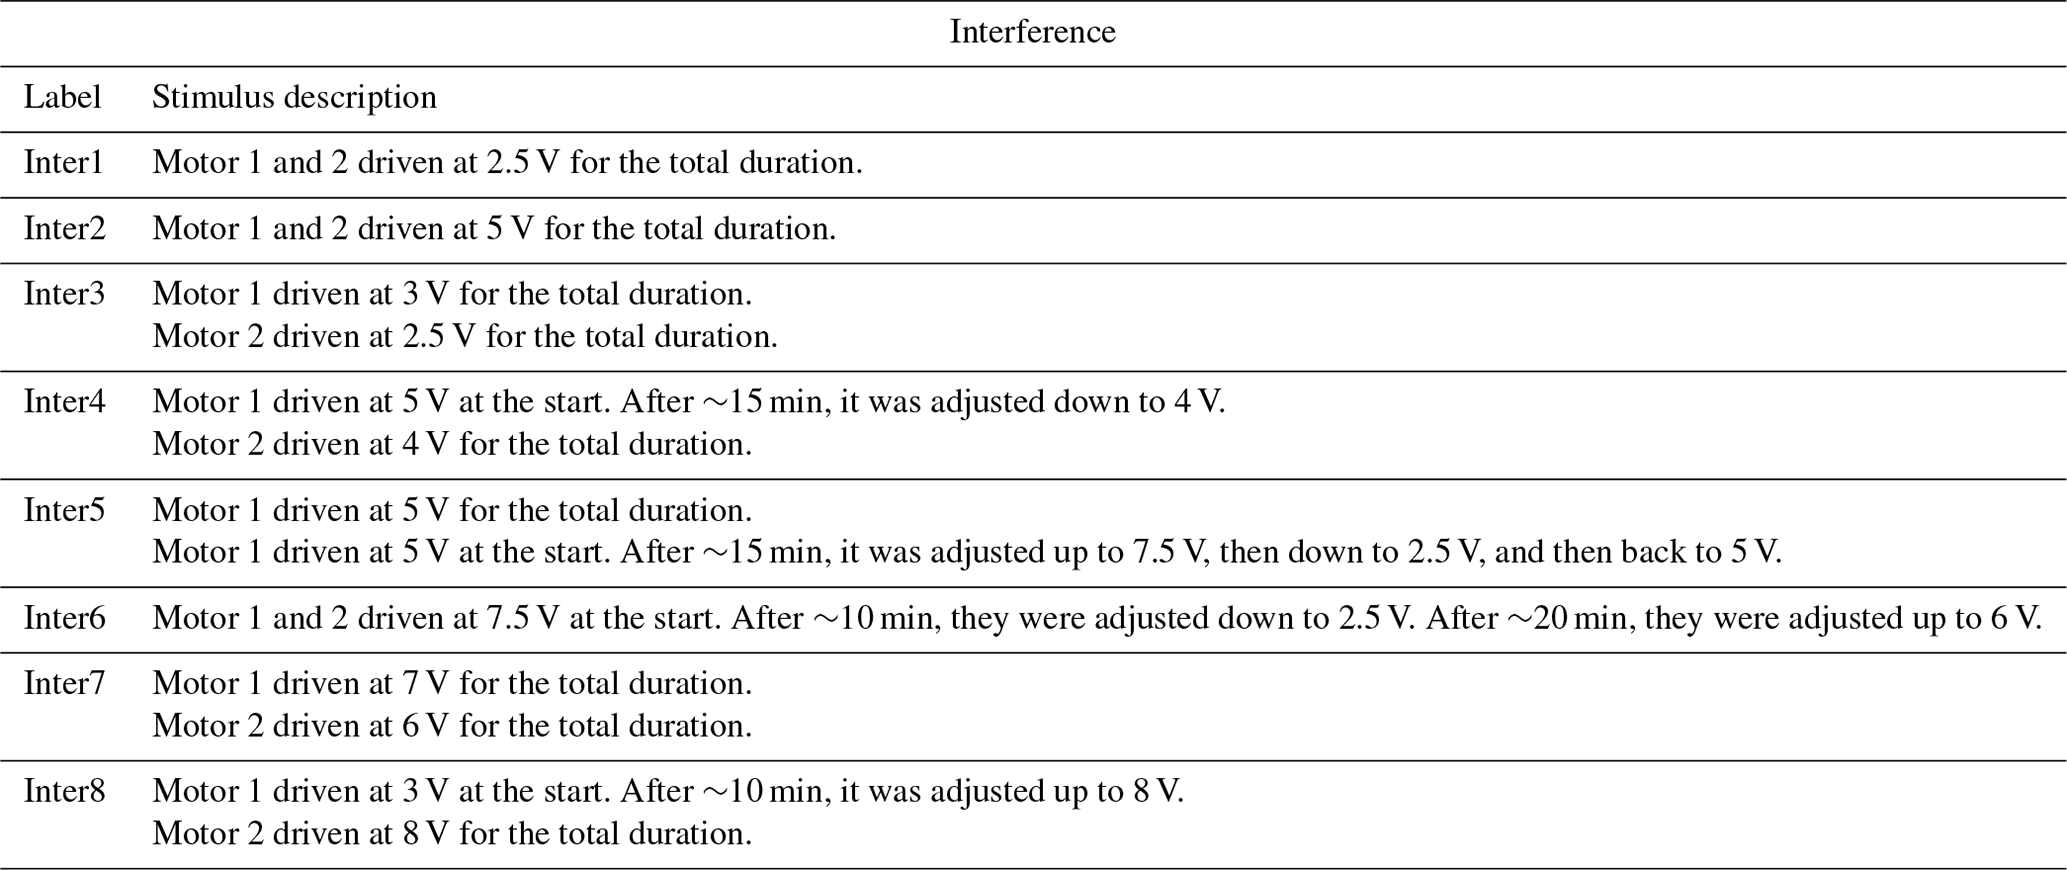
Table 3Description of the stimulus applied to generate interesting magnetic phenomena as a proxy for geophysical signals.
3.2 Data processing
The data exported by the Twinleaf I/O software are considered the Level-0 data product. This consists of a tab-separated value (.tsv) file containing vector data from each of the four magnetometers for each capture interval. The remainder of this section will discuss the pipeline for the data product processing necessary to convert this into a useful dataset for the validation of magnetic-field interference mitigation algorithms. Note that during intermediary processing, output data (i.e., Level-2a data) adhere to a standard MATLAB v7 data format (.mat) for ease of readability by a variety of programs, but the final output (i.e., Level 2b) is stored in a Common Data Format (.cdf) file compliant with International Solar-Terrestrial Physics (ISTP) standards.
3.2.1 Level 1 – filtering and truncation
Level-1 data processing considers the measurements associated with each data category (i.e., near-DC trend, simulated interference, and pseudo-geomagnetic phenomena) independently. The Level-0 data files are first read in and parsed, and filtering steps appropriate for each type of data are applied. Note that the Level-0 data files have been converted to an easily readable .csv format and saved as part of this dataset to enable further data calibration, combination, and processing by potential users.
As discussed in Sect. 2.2, the Merritt coil system produces amplitude discontinuities when driven at frequencies less than ∼1 Hz. Therefore, a 0.1 Hz low-pass filter is applied to each instance of the near-DC data described in Table 1. This filtering reduces the impact of the amplitude steps, although some ringing is still apparent in the output. The simulated reaction wheel interference captured, as described in Table 2, contains near-DC offsets from various local static and time-varying sources (including the building's elevators, nearby cars, and individuals carrying ferromagnetic objects). The sinusoidal simulated interference data were brought down to a near-zero mean by first applying a high-pass filter with a 3 Hz cutoff, followed by the subtraction of the median value of the filtered data. The simulated small-scale geophysical signals, described in Table 3, have no filtering applied during this stage as spontaneous magnetic perturbations from uncontrolled sources enhance the purpose of this data product. Finally, each interval captured is truncated to a length of 30 min, starting after 30 s, to avoid edge artifacts caused by the filtering process.
3.2.2 Level 2a – data combination
Level-2a data processing considers the possible combinations of Level-1 data that result in useful representations of in situ spacecraft magnetometer measurements, enabling the validation of practical interference mitigation techniques. The Level-2a data-processing step results in several distinct 30 min intervals of magnetometer measurements for each broad category of data collected. Specifically, five intervals of near-DC trend, eight intervals of synthetic reaction wheel interference, and six intervals of pseudo-geomagnetic phenomena. This results in 120 h of possible combinations when combining a single interval from each category. Additional intervals of Level-2a data can be generated by utilizing multiple intervals from each category, which also serves to increase the potential data complexity.
It should be noted that a common assumption for in situ measurements is that geophysical magnetic fields will be identical for all scientific magnetometers onboard the spacecraft, whereas the interference measured by the sensors will decrease with the distance from the body of the spacecraft. As such, when combining the data, only measurements from one of four magnetometers are used for the near-DC trend and geomagnetic phenomena. However, for the synthetic reaction wheel interference, all four magnetometer measurements are utilized.
3.2.3 Level 2b – .cdf conversion
Level-2b data processing involves transforming the combined data generated in Level 2a into a Common Data Format (.cdf) file for enhanced accessibility and usability within the space research community. The use of .cdf files is a common practice in space research, with NASA's support ensuring widespread compatibility and longevity.
Each converted .cdf file contains all the essential variable information and metadata required to understand and use the data. Each file contains 16 variables corresponding to the measurements of the combined signal, interference signal, near-DC-trend signal, and pseudo-geomagnetic signal for each magnetometer, separated into the x, y, and z magnetic components of the sensors. Figure 5 illustrates several example data contained in the dataset. The rows in Fig. 5 correspond to different combinations of trends, pseudo-geomagnetic signals, and interferences. The time series for these combinations are shown in the first column of Fig. 5, with the associated spectra shown in the second column. Note that the combined data have been detrended with a 20 s moving average for ease of visualization. The interference to be identified and removed is displayed in the third column of Fig. 5, with its associated spectra shown in the fourth column. The first and third rows illustrate combinations that have variable motor rates, simulating the conditions seen during spacecraft maneuvers. The pseudo-geomagnetic signals associated with the combinations shown in the first and third rows are frequency-swept wave packets simulating geophysical phenomena like whistler-mode waves (Teng et al., 2019). The second row of Fig. 5 provides a similar example but with fixed motor rates and an amplitude-modulated wave packet applied at a fixed frequency.
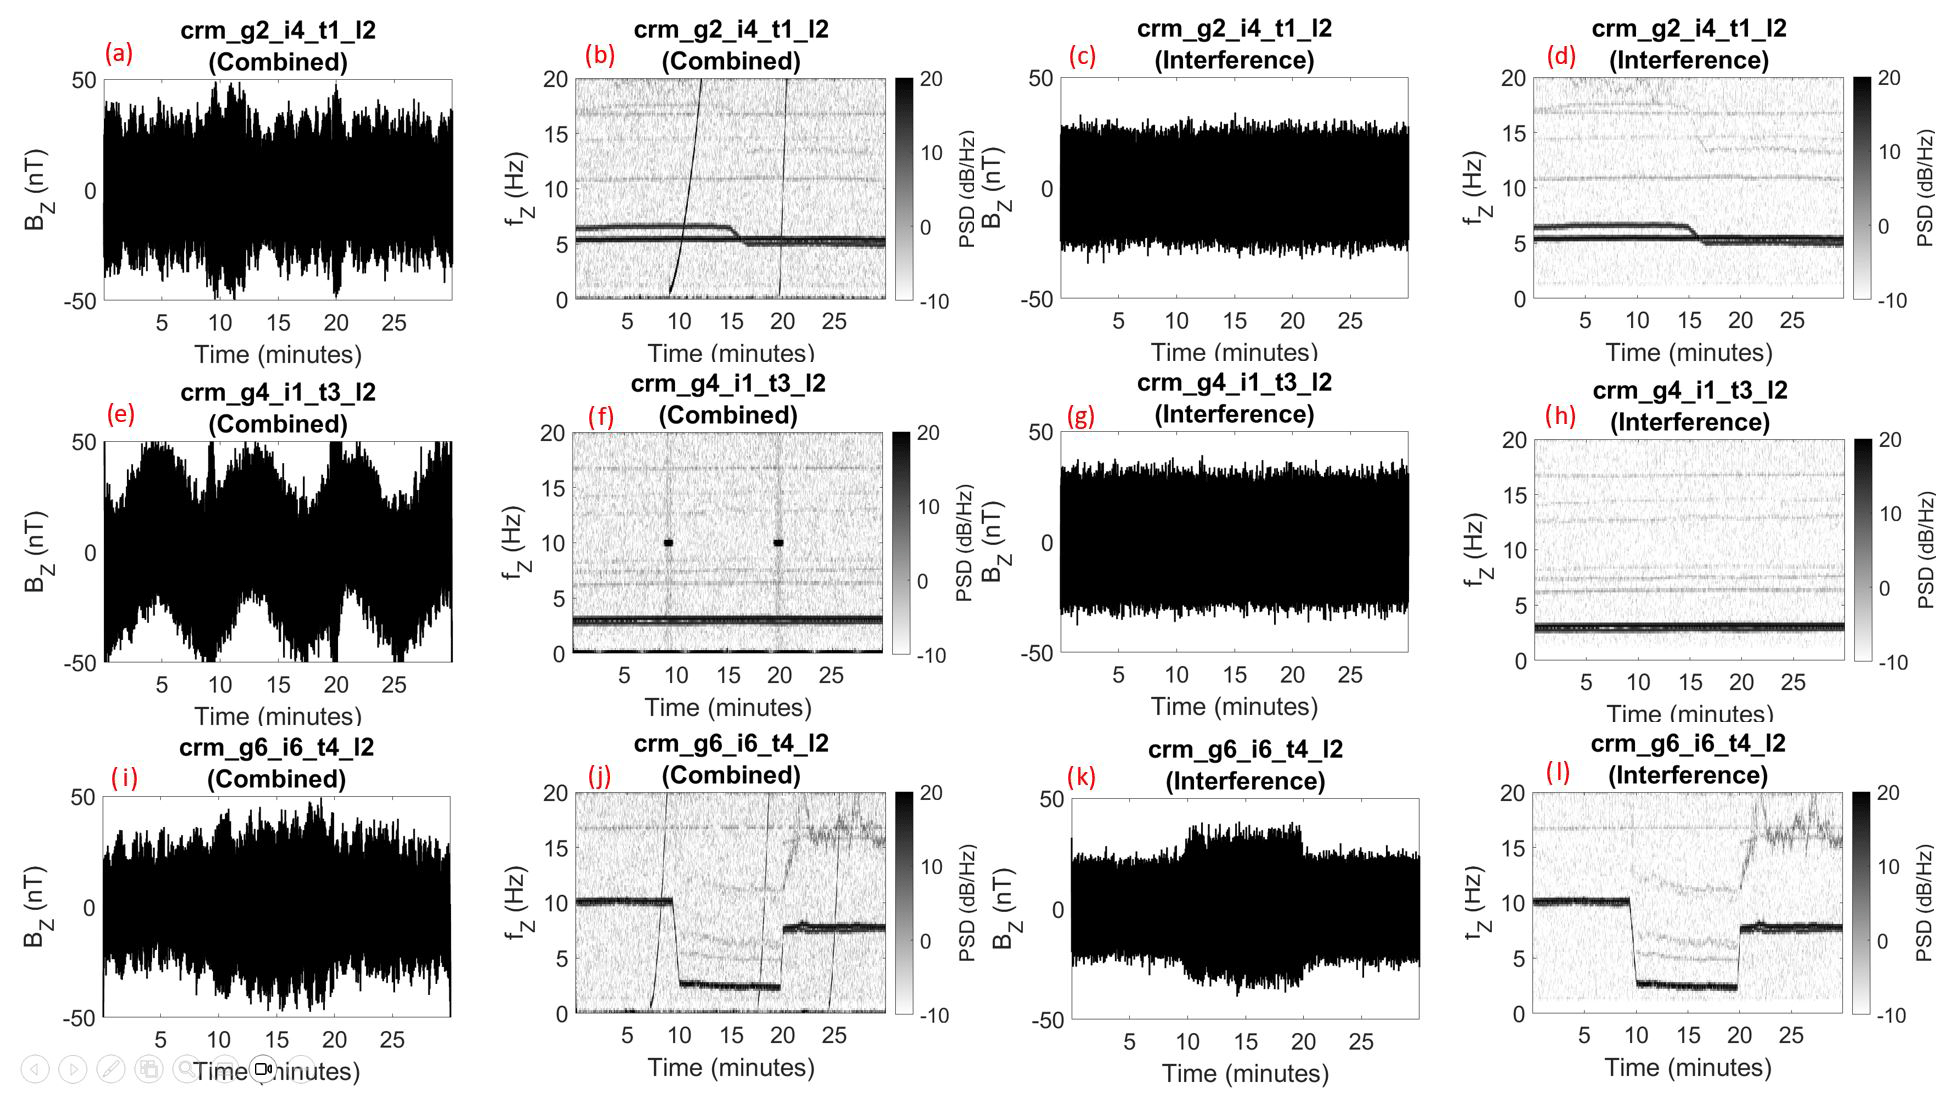
Figure 5Sample intervals captured by M2 in the laboratory-generated dataset. The first and second columns show the detrended time series and spectra associated with the combined data product. The third and fourth columns show the time series and spectra corresponding to the ground truth interference. The first row shows the data associated with the combination of Trend2, Inter4, and GeoSignal2. The second row shows the data associated with the combination of Trend4, Inter1, and GeoSignal4. The third row shows the data associated with the combination of Trend3, Inter6, and GeoSignal6. PSD: power spectral density.
Figure 6 provides an illustration of the variables contained in a single .cdf file as well as some of the informative metadata describing the variable. In this case, the highlighted variable is “InterMag1”, the interference signal measured by M1 in the file “CRM_g2_i4_t1_l2”. It can be seen in the descriptor text near the bottom of Fig. 6 that the interference for this piece of data was generated from two motors. First, Motor 1 is driven at 5 V. After ∼15 min, it was adjusted down to 4 V. Motor 2 was driven at 4 V for the total duration. The graphical output shown in Fig. 6 is from the Autoplot software, a useful tool for rapidly parsing, visualizing, and analyzing .cdf files. Autoplot is fully compatible with the dataset presented in this paper, and more information about the software is available at http://www.autoplot.org (last access: 8 July 2024).
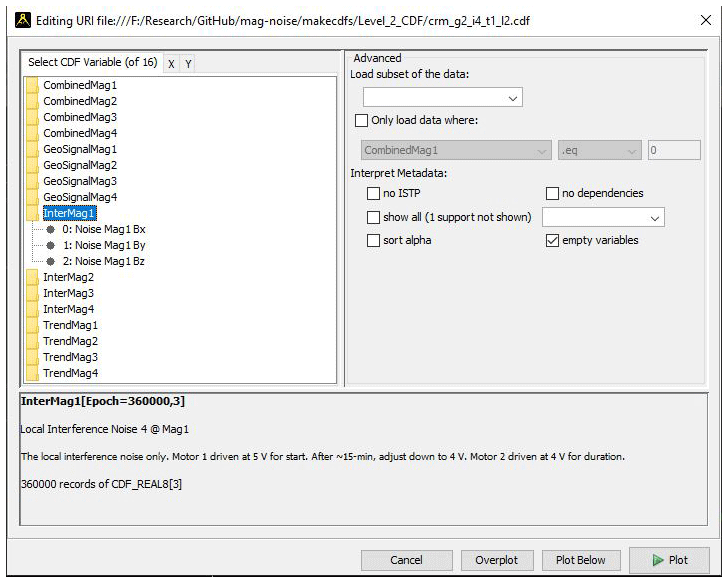
Figure 6CDF variable information associated with a single data combination, displayed via Autoplot (http://autoplot.org/, last access: 8 July 2024). In total, each .cdf file contains 16 variables (4 for each magnetometer). Each magnetometer has measurements associated with the near-DC trend, physically synthesized interference signal, pseudo-geophysical signal, and combination of these constituent components. Each magnetometer measurement contains an x, y, and z component.
The primary objective of this dataset is to serve as a validation tool for existing and future interference mitigation algorithms. It provides a clear distinction between interference and pseudo-geophysical signals, establishing a reliable ground truth for the validation of these algorithms. However, this section outlines several potential avenues for future work in the further development of this dataset.
Firstly, the dataset can be extended to cover more complex and challenging scenarios. Although the data presented in this paper have only combined a single interference signal with a single pseudo-geophysical signal and near-DC trend, combinations of multiple interference signals or multiple pseudo-geophysical signals can be generated, which may pose greater challenges for some interference mitigation schemes. Additionally, the data can be time-shifted to provide more substantial spectral overlap between the pseudo-geophysical signal and interference, which is a common and challenging problem when attempting to mitigate local magnetic interference. Finally, this dataset has only provided physically synthesized proxies for a single type of local magnetic interference (i.e., reaction wheels). Although reaction wheels are often a dominant source of interference on many spaceflight missions, they are not the only source of interference seen in situ magnetic-field measurements. Spacecraft heaters, magnetic torque rods, and electrical currents from subsystems like solar panels are commonly present in magnetometer data (Angelini et al., 2022; Stolle et al., 2021). Physical proxies for these interference sources can also be generated and added to the dataset to provide a more thorough set of example data for validating interference mitigation techniques.
It should also be noted that, although this work is intended to support interference mitigation efforts for spaceflight missions, many other fields that utilize magnetometry suffer from local magnetic interference when taking measurements. For example, many geological and archeological surveys have begun to deploy unoccupied aerial vehicles (UAVs) equipped with gradiometric magnetometer arrays to perform subsurface mapping (Zheng et al., 2021). These UAVs generate substantial local magnetic fields (e.g., from their rotors, motors, and other subsystems), contaminating the measurements that are taken. One common approach for mitigating these interfering local fields is to deploy the magnetometer arrays far from the UAV via a system of tethers. However, these tethers can cause additional complications when the UAV needs to traverse complex terrain or fly at low altitudes, and, as a result, more complex interference mitigation techniques must be utilized (Kaub et al., 2021). These complications are not only limited to low-altitude uncrewed aerial surveys but also applicable to higher-altitude staffed aeromagnetic surveying (Tuck et al., 2021). One dominant source of interference seen in these various aerial magnetic surveys is the time-varying fields generated by the spinning motors onboard the aircraft (Lee et al., 2020), which are similar to the spinning reaction wheels used to control a spacecraft's attitude that are physically synthesized in the dataset presented in this paper. It can be seen that, due to the similarities between the magnetic signatures of these dominant interference sources, this work can be well suited for validating interference mitigation efforts across a wide range of fields.
In our endeavor to comprehend physical processes throughout near-Earth space and our solar system, in situ magnetometer measurements are indispensable tools. Despite recent advancements in magnetometer technology, interference from spacecraft-generated magnetic fields often contaminates our scientific measurements. Historically, this interference was mitigated using traditional gradiometry applied to two or more sensors deployed along a long boom. Many recent missions have opted for shorter booms to reduce cost and technical complexity, which also reduces the effectiveness of classical gradiometry. As a result, novel approaches for the mitigation of local magnetic interference from spacecraft have emerged, but the quantification of their performance remains challenging due to the lack of available ground truth data. This paper has presented a dataset to enable the rigorous analysis of these techniques by generating and measuring various magnetic phenomena representative of those observed by in situ spacecraft. Specifically, 10 h of data containing near-DC trends, physically synthesized interference, and pseudo-geophysical signals have been simultaneously captured by four magnetometers and combined to provide over 100 h of measurements that can be used as a testbed for interference mitigation schemes. This dataset also serves as a ground truth for the magnetic interference, enabling the rigorous quantification of an algorithm's performance.
This Appendix provides a more detailed view of the component signals (i.e., the near-DC trends, physically synthesized interference intervals, and pseudo-geomagnetic phenomena) described in Tables 1–3, as measured by the central magnetometer (M2). Specifically, Fig. A1 shows the time series associated with the near-DC trends described in Table 1. Note that the measurements shown pertain to the axes on which the dominant signal was applied for the first three trend signals; for the last two trend signals, the Z axis was chosen for consistency with the other plots. The spectral content associated with the near-DC-trend signals is not shown since the very low frequency of the stimuli and the substantial filtering applied to the trend signals result in uninformative spectra. Figures A2 and A3 , respectively, show the time series and spectral content associated with the physically synthesized interference described in Table 2. The Z axis is shown since it measured the highest magnitude of interference. Finally, Figs. A4 and A5, respectively, show the time series and spectral content associated with the pseudo-geophysical signals described in Table 3. The Z axis is shown for these signals since it was the magnetometer axis on which the pseudo-geophysical signals were predominantly applied (i.e., for all stimuli except “GeoSignal5” in Table 3).
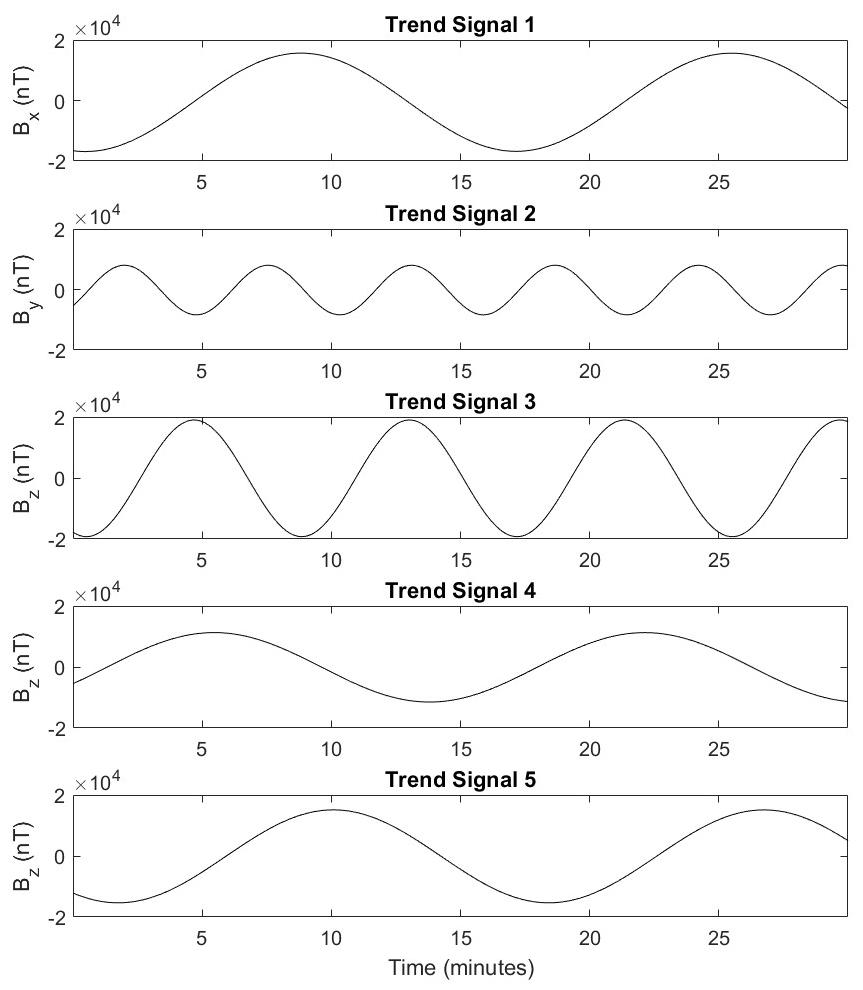
Figure A1The component's near-DC-trend signals discussed in Table 1, measured by the magnetometer M2.
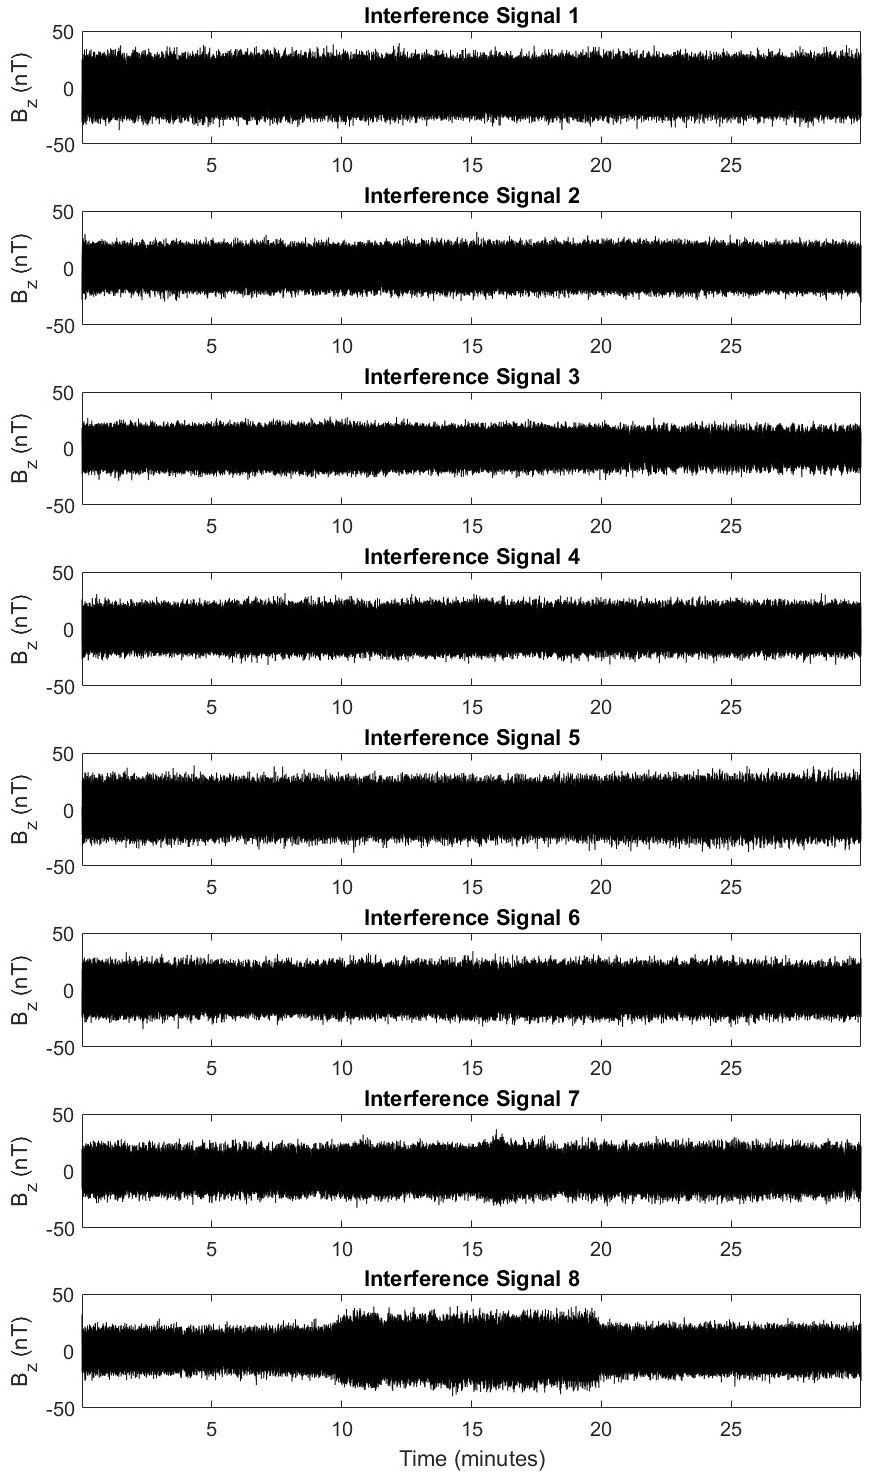
Figure A2The component's physically synthesized interference signals discussed in Table 2, measured by the magnetometer M2.
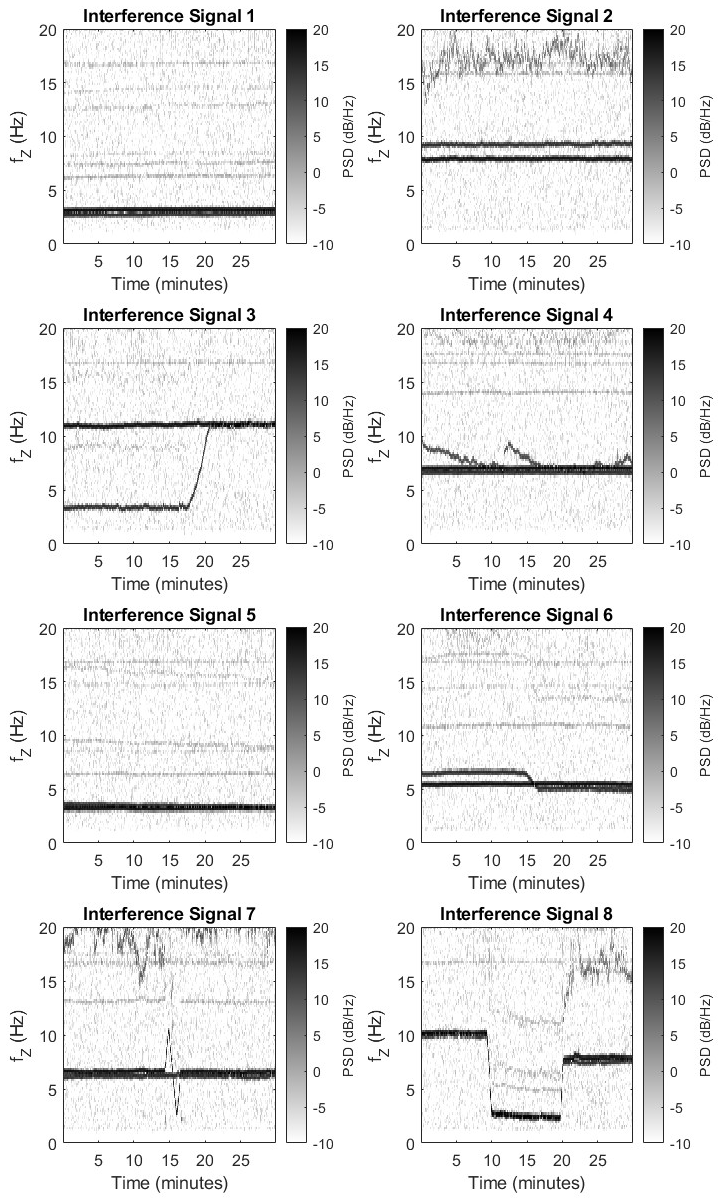
Figure A3The spectra associated with the component's physically synthesized interference signals discussed in Table 2 and shown in Fig. A2, measured by the magnetometer M2.
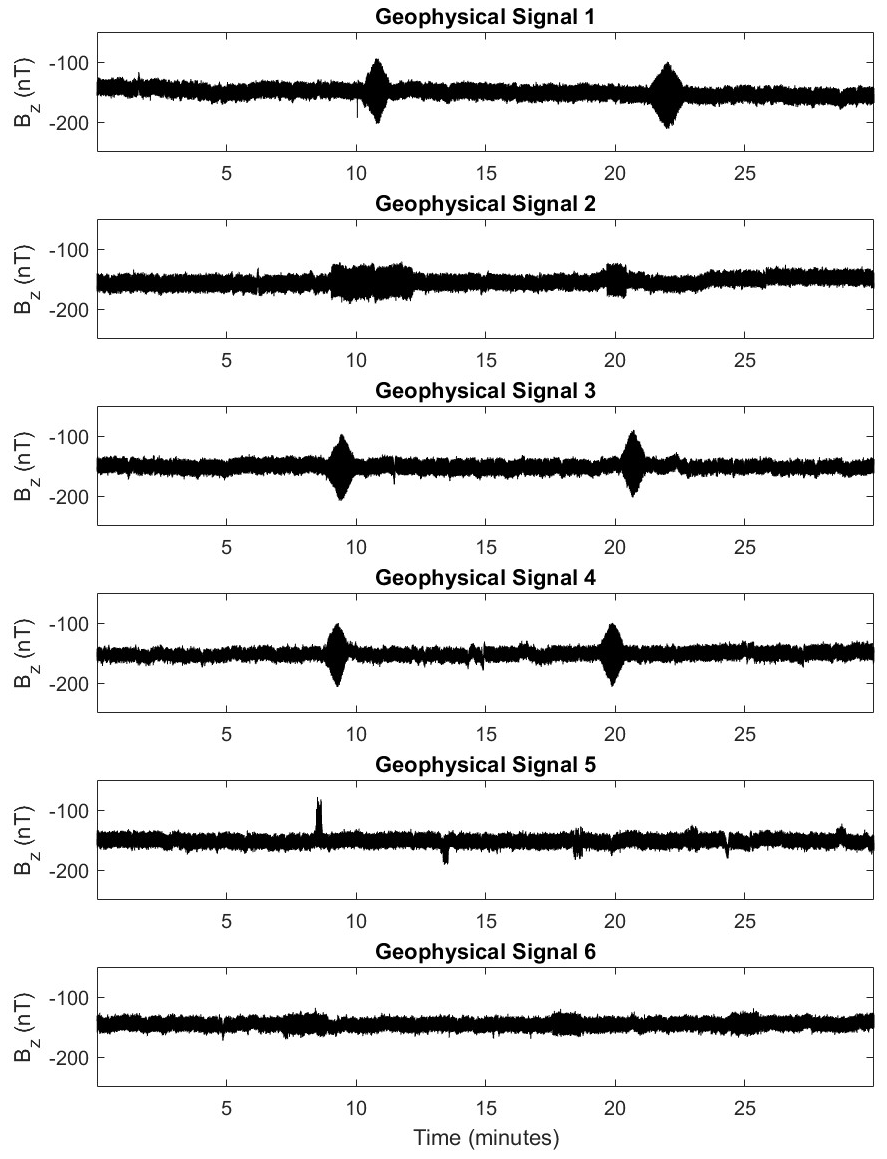
Figure A4The component's pseudo-geophysical signals discussed in Table 3, measured by the magnetometer M2.
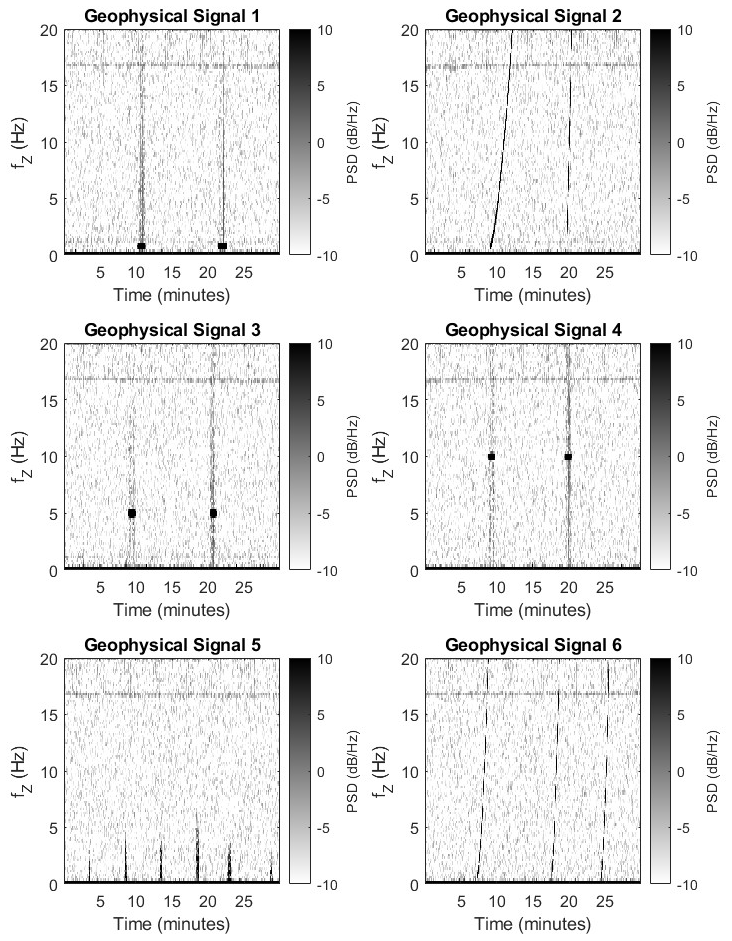
Figure A5The spectra associated with the component's pseudo-geophysical signals discussed in Table 3 and shown in Fig. A4, measured by the magnetometer M2.
The dataset presented in this paper is available at https://doi.org/10.25820/data.007168 (Finley et al., 2024). The code used to generate the dataset, as well as some scripts demonstrating example usage, is available at https://doi.org/10.5281/zenodo.12773896 (Flores et al., 2024).
MGF and DMM conceptualized the project. KJM, RMB, and SH developed the test setup. MGF, AMF, JH, and CP captured the data. MGF, CP, and AMF wrote the software to produce the output data product and associated metadata. MGF, AMF, and RMB wrote the paper. All authors contributed to the proofreading of the paper. DMM and ASG were responsible for funding acquisition and project management.
The contact author has declared that none of the authors has any competing interests.
Publisher's note: Copernicus Publications remains neutral with regard to jurisdictional claims made in the text, published maps, institutional affiliations, or any other geographical representation in this paper. While Copernicus Publications makes every effort to include appropriate place names, the final responsibility lies with the authors.
This work was supported in part by the Air Force Office of Scientific Research, US (grant no. FA9550-21-1-0206). Matthew G. Finley was additionally supported for this work in part by the National Aeronautics and Space Administration's HERMES mission and grant nos. 80NSSC21M0180 and 80NSSC23K1295.
This paper was edited by Lev Eppelbaum and reviewed by Mark Moldwin and two anonymous referees.
Angelini, V., O'Brien, H., Horbury, T., and Fauchon-Jones, E.: Novel magnetic cleaning techniques for Solar Orbiter magnetometer, in: 2022 ESA Workshop on Aerospace EMC (Aerospace EMC), Virtual, 1–6, https://doi.org/10.23919/AerospaceEMC54301.2022.9828828, 2022.
Bale, S. D., Goetz, K., Harvey, P. R., Turin, P., Bonnell, J. W., Dudok de Wit, T., Ergun, R. E., MacDowall, R. J., Pulupa, M., Andre, M., Bolton, M., Bougeret, J.-L., Bowen, T. A., Burgess, D., Cattell, C. A., Chandran, B. D. G., Chaston, C. C., Chen, C. H. K., Choi, M. K., Connerney, J. E., Cranmer, S., Diaz-Aguado, M., Donakowski, W., Drake, J. F., Farrell, W. M., Fergeau, P., Fermin, J., Fischer, J., Fox, N., Glaser, D., Goldstein, M., Gordon, D., Hanson, E., Harris, S. E., Hayes, L. M., Hinze, J. J., Hollweg, J. V., Horbury, T. S., Howard, R. A., Hoxie, V., Jannet, G., Karlsson, M., Kasper, J. C., Kellogg, P. J., Kien, M., Klimchuk, J. A., Krasnoselskikh, V. V., Krucker, S., Lynch, J. J., Maksimovic, M., Malaspina, D. M., Marker, S., Martin, P., Martinez-Oliveros, J., McCauley, J., McComas, D. J., McDonald, T., Meyer-Vernet, N., Moncuquet, M., Monson, S. J., Mozer, F. S., Murphy, S. D., Odom, J., Oliverson, R., Olson, J., Parker, E. N., Pankow, D., Phan, T., Quataert, E., Quinn, T., Ruplin, S. W., Salem, C., Seitz, D., Sheppard, D. A., Siy, A., Stevens, K., Summers, D., Szabo, A., Timofeeva, M., Vaivads, A., Velli, M., Yehle, A., Werthimer, D., and Wygant, J. R.: The FIELDS Instrument Suite for Solar Probe Plus, Space Sci. Rev., 204, 49–82, https://doi.org/10.1007/s11214-016-0244-5, 2016.
Bowen, T. A., Mallet, A., Huang, J., Klein, K. G., Malaspina, D. M., Stevens, M., Bale, S. D., Bonnell, J. W., Case, A. W., Chandran, B. D. G., Chaston, C. C., Chen, C. H. K., Dudok de Wit, T., Goetz, K., Harvey, P. R., Howes, G. G., Kasper, J. C., Korreck, K. E., Larson, D., Livi, R., MacDowall, R. J., McManus, M. D., Pulupa, M., Verniero, J. L., Whittlesey, P., and The PSP/FIELDS and PSP/SWEAP Teams: Ion-scale Electromagnetic Waves in the Inner Heliosphere, Astrophys. J. Suppl. Ser., 246, 66, https://doi.org/10.3847/1538-4365/ab6c65, 2020.
Broadfoot, R. M., Miles, D. M., Holley, W., and Howarth, A. D.: In situ calibration of the Swarm-Echo magnetometers, Geosci. Instrum. Methods Data Syst., 11, 323–333, https://doi.org/10.5194/gi-11-323-2022, 2022.
Burt, J., Goans, M., Blackwood, J., and Brown, K.: Heliophysics Environmental & Radiation Measurement Experiment Suite (HERMES): A Small External Payload for Gateway with Big Challenges, in: 2022 IEEE Aerospace Conference (AERO), Big Sky, MT, USA, 1–11, https://doi.org/10.1109/AERO53065.2022.9843491, 2022.
Clagett, C., Santos, L., Azimi, B., Cudmore, A., Marshall, J., Starin, S., Sheikh, S., Zesta, E., Paschalidis, N., Johnson, M., Kepko, L., Berry, D., Bonalsky, T., Chai, D., Colvin, M., Evans, A., Hesh, S., Jones, S., Peterson, Z., Rodriquez, J., and Rodriquez, M.: Dellingr: NASA Goddard Space Flight Center's First 6U Spacecraft, in: The Small Satellite Conference, Logan, UT, USA, Proceedings of the AIAA/USU Conference on Small Satellites, Next on the Pad, SSC17-III-06, http://digitalcommons.usu.edu/smallsat/2017/all2017/83/ (last access: 15 August 2024), 5–10 August 2017.
Connerney, J. E. P., Espley, J., Lawton, P., Murphy, S., Odom, J., Oliversen, R., and Sheppard, D.: The MAVEN Magnetic Field Investigation, Space Sci. Rev., 195, 257–291, https://doi.org/10.1007/s11214-015-0169-4, 2015.
Connerney, J. E. P., Benn, M., Bjarno, J. B., Denver, T., Espley, J., Jorgensen, J. L., Jorgensen, P. S., Lawton, P., Malinnikova, A., Merayo, J. M., Murphy, S., Odom, J., Oliversen, R., Schnurr, R., Sheppard, D., and Smith, E. J.: The Juno Magnetic Field Investigation, Space Sci. Rev., 213, 39–138, https://doi.org/10.1007/s11214-017-0334-z, 2017.
Constantinescu, O. D., Auster, H.-U., Delva, M., Hillenmaier, O., Magnes, W., and Plaschke, F.: Maximum-variance gradiometer technique for removal of spacecraft-generated disturbances from magnetic field data, Geosci. Instrum. Methods Data Syst., 9, 451–469, https://doi.org/10.5194/gi-9-451-2020, 2020.
Finley, M. G., Broadfoot, R. M., Shekhar, S., and Miles, D. M.: Identification and Removal of Reaction Wheel Interference From In-Situ Magnetic Field Data Using Multichannel Singular Spectrum Analysis, J. Geophys. Res.-Space, 128, e2022JA031020, https://doi.org/10.1029/2022JA031020, 2023a.
Finley, M. G., Bowen, T. A., Pulupa, M., Koval, A., and Miles, D. M.: Statistical Decomposition and Machine Learning to Clean In Situ Spaceflight Magnetic Field Measurements, Geophys. Res. Lett., 50, e2023GL103626, https://doi.org/10.1029/2023GL103626, 2023b.
Finley, M. G., Flores, A. M., Morris, K. J., Broadfoot, R. M., Hisel, S., Homann, J., Piker, C., Gupta, A. S., and Miles, D. M.: Code and Data for Enabling In-Situ Magnetic Interference Mitigation Algorithm Validation via a Laboratory-Generated Dataset, Iowa Research Online [data set], https://doi.org/10.25820/data.007168, 2024.
Flores, A., Piker, C., and Finley, M. G.: mag-noise/crm: Python processing code with MATLAB CDF generation (v1.0.2), Zenodo [code], https://doi.org/10.5281/zenodo.12773896, 2024.
Gordon, D. and Brown, R.: Recent advances in fluxgate magnetometry, IEEE Trans. Magn., 8, 76–82, https://doi.org/10.1109/TMAG.1972.1067268, 1972.
Greene, K., Hansen, C., Narod, B. B., Dvorsky, R., and Miles, D. M.: Tesseract – a high-stability, low-noise fluxgate sensor designed for constellation applications, Geosci. Instrum. Methods Data Syst., 11, 307–321, https://doi.org/10.5194/gi-11-307-2022, 2022.
Hoffmann, A. P. and Moldwin, M. B.: Separation of Spacecraft Noise From Geomagnetic Field Observations Through Density-Based Cluster Analysis and Compressive Sensing, J. Geophys. Res.-Space, 127, e2022JA030757, https://doi.org/10.1029/2022JA030757, 2022.
Imajo, S., Nosé, M., Aida, M., Matsumoto, H., Higashio, N., Tokunaga, T., and Matsuoka, A.: Signal and Noise Separation From Satellite Magnetic Field Data Through Independent Component Analysis: Prospect of Magnetic Measurements Without Boom and Noise Source Information, J. Geophys. Res.-Space, 126, e2020JA028790, https://doi.org/10.1029/2020JA028790, 2021.
Kaub, L., Keller, G., Bouligand, C., and Glen, J. M. G.: Magnetic Surveys With Unmanned Aerial Systems: Software for Assessing and Comparing the Accuracy of Different Sensor Systems, Suspension Designs and Compensation Methods, Geochem. Geophy. Geosy., 22, e2021GC009745, https://doi.org/10.1029/2021GC009745, 2021.
Langel, R., Ousley, G., Berbert, J., Murphy, J., and Settle, M.: The MAGSAT mission, Geophys. Res. Lett., 9, 243–245, https://doi.org/10.1029/GL009i004p00243, 1982.
Lee, H., Lee, C., Jeon, H., Son, J. J., Son, Y., and Han, S.: Interference-Compensating Magnetometer Calibration With Estimated Measurement Noise Covariance for Application to Small-Sized UAVs, IEEE Trans. Ind. Electron., 67, 8829–8840, https://doi.org/10.1109/TIE.2019.2950841, 2020.
Merritt, R., Purcell, C., and Stroink, G.: Uniform magnetic field produced by three, four, and five square coils, Rev. Sci. Instrum., 54, 879–882, https://doi.org/10.1063/1.1137480, 1983.
Miles, D. M., Mann, I. R., Ciurzynski, M., Barona, D., Narod, B. B., Bennest, J. R., Pakhotin, I. P., Kale, A., Bruner, B., Nokes, C. D. A., Cupido, C., Haluza-DeLay, T., Elliott, D. G., and Milling, D. K.: A miniature, low-power scientific fluxgate magnetometer: A stepping-stone to cube-satellite constellation missions, J. Geophys. Res.-Space, 121, 11839–11860, https://doi.org/10.1002/2016JA023147, 2016.
Miles, D. M., Ciurzynski, M., Barona, D., Narod, B. B., Bennest, J. R., Kale, A., Lessard, M., Milling, D. K., Larson, J., and Mann, I. R.: Low-noise permalloy ring cores for fluxgate magnetometers, Geosci. Instrum. Methods Data Syst., 8, 227–240, https://doi.org/10.5194/gi-8-227-2019, 2019.
Miller, D. C.: The Voyager magnetometer boom, Jet Propulsion Lab, California Inst. of Tech. NTRS Document ID: 19790013187, NTRS Research Center: Legacy CDMS, 12th Aerospace Mechanisms Symposium NASA, Cal-Tech, Lockheed. SP-2080, 245 pp., NASA, Washington, D.C., 1979, p.51, 1979.
Ness, N. F., Behannon, K. W., Lepping, R. P., and Schatten, K. H.: Use of two magnetometers for magnetic field measurements on a spacecraft, J. Geophys. Res., 76, 3564–3573, https://doi.org/10.1029/JA076i016p03564, 1971.
Paterson, W. R., Gershman, D. J., Kanekal, S. G., Livi, R., Moldwin, M. B., Zesta, E., Randol, B., and Samara, M.: Heliospheric Science From Gateway With HERMES, in: EGU General Assembly 2023, Vienna, Austria, 24–28 April 2023, EGU23-8425, https://doi.org/10.5194/egusphere-egu23-8425, 2023.
Russell, C. T., Anderson, B. J., Baumjohann, W., Bromund, K. R., Dearborn, D., Fischer, D., Le, G., Leinweber, H. K., Leneman, D., Magnes, W., Means, J. D., Moldwin, M. B., Nakamura, R., Pierce, D., Plaschke, F., Rowe, K. M., Slavin, J. A., Strangeway, R. J., Torbert, R., Hagen, C., Jernej, I., Valavanoglou, A., and Richter, I.: The Magnetospheric Multiscale Magnetometers, Space Sci. Rev., 199, 189–256, https://doi.org/10.1007/s11214-014-0057-3, 2016.
Sen Gupta, A. and Miles, D.: Autonomous Reaction Wheel Magnetic Signature Detection Against Background Noise in Spacecraft, IEEE Sens. Lett., 7, 1–4, https://doi.org/10.1109/LSENS.2023.3308124, 2023.
Slavin, J. A., Le, G., Strangeway, R. J., Wang, Y., Boardsen, S. A., Moldwin, M. B., and Spence, H. E.: Space Technology 5 multi-point measurements of near-Earth magnetic fields: Initial results, Geophys. Res. Lett., 35, L02107, https://doi.org/10.1029/2007GL031728, 2008.
Stolle, C., Michaelis, I., Xiong, C., Rother, M., Usbeck, T., Yamazaki, Y., Rauberg, J., and Styp-Rekowski, K.: Observing Earth's magnetic environment with the GRACE-FO mission, Earth Planets Space, 73, 51, https://doi.org/10.1186/s40623-021-01364-w, 2021.
Styp-Rekowski, K., Michaelis, I., Stolle, C., Baerenzung, J., Korte, M., and Kao, O.: Machine learning-based calibration of the GOCE satellite platform magnetometers, Earth Planets Space, 74, 138, https://doi.org/10.1186/s40623-022-01695-2, 2022.
Teng, S., Tao, X., and Li, W.: Typical Characteristics of Whistler Mode Waves Categorized by Their Spectral Properties Using Van Allen Probes Observations, Geophys. Res. Lett., 46, 3607–3614, https://doi.org/10.1029/2019GL082161, 2019.
Tuck, L. E., Samson, C., Laliberté, J., and Cunningham, M.: Magnetic interference mapping of four types of unmanned aircraft systems intended for aeromagnetic surveying, Geosci. Instrum. Methods Data Syst., 10, 101–112, https://doi.org/10.5194/gi-10-101-2021, 2021.
Wallis, D. D., Miles, D. M., Narod, B. B., Bennest, J. R., Murphy, K. R., Mann, I. R., and Yau, A. W.: The CASSIOPE/e-POP Magnetic Field Instrument (MGF), Space Sci. Rev., 189, 27–39, https://doi.org/10.1007/s11214-014-0105-z, 2015.
Zheng, Y., Li, S., Xing, K., and Zhang, X.: Unmanned Aerial Vehicles for Magnetic Surveys: A Review on Platform Selection and Interference Suppression, Drones, 5, 93, https://doi.org/10.3390/drones5030093, 2021.