the Creative Commons Attribution 4.0 License.
the Creative Commons Attribution 4.0 License.
 | 25 Sep 2025
Analysis of SAMA interference on Pc3 pulsations using data from conjugate stations: a case study
Luiz Benyosef
Based on a case study, we analyzed Pc3 pulsation data from pairs of conjugate stations located at low latitudes (L-shell < 2). One pair of stations is situated in the Americas under the influence area of the South Atlantic Magnetic Anomaly (SAMA). As a reference, we selected a pair of stations located at a distant longitude in the Asia-Pacific region. This choice of regions facilitates meaningful comparisons. We conducted a signal spectral analysis using the fast Fourier transform (FFT), the continuous wavelet transform (CWT), and wavelet coherence to characterize the dynamics of Pc3 pulsations at conjugate stations in the time–frequency domain. In this case study, the Pc3 pulsations exhibited similar waveforms and occurred simultaneously at the conjugate stations in both regions. Spectral power plots and wavelet scalograms revealed notable similarities between the stations. However, we observed an increase in pulsation amplitude and wavelet coefficients at the station located near the SAMA center. Additionally, high coherence and in-phase signals were observed in the Asia-Pacific region, while moderate to high coherence signals were observed at the station in the SAMA region. We suggest that the observed differences at the SAMA station may result from the unique characteristics of the region. The presence of the SAMA facilitates the precipitation of energetic particles from the inner radiation belt, thereby enhancing ionospheric conductivity.
- Article
(1719 KB) - Full-text XML
- BibTeX
- EndNote


The South Atlantic Magnetic Anomaly (SAMA) is the most significant and largest magnetic anomaly on Earth, a region that spans the Pacific Ocean over southwestern Africa, covering latitudes between 15° N and 55° S (Nasuddin et al., 2019; Pavón-Carrasco and De Santis, 2016; Hagen and Azevedo, 2024). In this region, the main magnetic field experiences a substantial reduction, decreasing by about 22 000 nT, which is roughly one-third of its maximum value, compared to other longitudes (Caraballo, 2016; Domingos et al., 2017; Nasuddin et al., 2019). Sanchez et al. (2020) identified the current minimum value of the South Atlantic Magnetic Anomaly (SAMA) in northern Argentina, noting that its center has historically shifted from southern Africa to South America over the past 300 years (Domingos et al., 2017; Hartmann and Pacca, 2009; Pavón-Carrasco and De Santis, 2016). Due to the reduced magnetic field intensity over the South Atlantic Magnetic Anomaly (SAMA) region, energetic particles trapped in the inner radiation belt and drifting azimuthally undergo deep precipitation into the ionosphere and atmosphere, thereby creating a region of high radiation (Abdu et al., 2022; Nasuddin et al., 2019). The particle precipitation results in the enhanced ionospheric conductivity at the altitude of D and E layers due to an increase in ionization during both the quiet and disturbed periods in this region compared to other places and suggested by observations of the ionosondes, radiometer, and very low frequency (VLF) radio propagation (Trivedi et al., 2005a). Abdu et al. (2022) pointed out that ionospheric conductivity is generally higher during disturbed periods compared to quiet ones. The increase in energetic particles in this region can impact objects orbiting Earth, such as satellites and the International Space Station (ISS). On the Earth's surface, this can lead to disruptions in communications and GPS, the creation of no-fly zones, and the induction of currents in pipelines and transmission lines (Hartmann and Pacca, 2009; Caraballo, 2016; Mendes da Costa et al., 2011). Recently, a secondary minimum within the SAMA has been observed near southwestern Africa (Terra-Nova et al., 2019), raising speculation that the expansion of the SAMA might signal an impending geomagnetic reversal (Finlay et al., 2020; Sanchez et al., 2020; Yue et al., 2024). Finally, it must be remembered that, although this magnetic anomaly is the most significant and largest, relatively few studies have been conducted in this region compared to other parts of the world.
Magnetic pulsations are the ground manifestation of ultra low frequency (ULF) hydromagnetic waves propagating in the magnetosphere. Frequencies typically range between about 1 mHz and 10 Hz; ground amplitudes range from less than 0.1 nT to tens or hundreds of nT and generally increase with latitude up to auroral regions. In this work, we focus on Pc3 magnetic pulsations (20–100 mHz) because some studies have shown that Pc3 magnetic pulsations play a crucial role in transferring solar wind energy into the inner magnetosphere and the dynamic coupling of the magnetosphere and the ionosphere. This process is essential for comprehending key aspects of the solar wind–magnetosphere interaction (Kamide and Chian, 2007; Francia et al., 2009; Yumoto, 1986). Besides, Pc3 geomagnetic pulsations can be generated either externally or internally with respect to the magnetosphere (Kamide and Chian, 2007; Waters and Menk, 2013). Pc3 pulsations are primarily associated with the transfer of upstream interplanetary waves into the magnetosphere, generated by ion cyclotron instability. This instability occurs when solar wind protons are reflected from the bow shock along the interplanetary magnetic field (IMF) lines (Greenstadt et al., 1981; Ndiitwani and Sutcliffe, 2009; Kleimenova et al., 2012; Sutcliffe et al., 2013; Yumoto, 1986; Ponomarenko et al., 2010; Francia et al., 2009, 2012). Previous studies have suggested that Kelvin–Helmholtz instability (KHI) at the magnetopause's flanks plays a significant role in generating and amplifying Pc3 pulsations (Yagova et al., 2017; Yumoto et al., 1986; Santarelli et al., 2003). Furthermore, Pc3 pulsations observed at low latitudes have been attributed to cavity or waveguide mode oscillations within the plasmasphere (Yagova et al., 2017; Yumoto, 1986; Santarelli et al., 2003). Kivelson and Southwood (1985) proposed that the magnetospheric cavity or waveguide mode acts as a resonator for these pulsations. However, some studies suggest that the wave structure can also be influenced by cavity or waveguide modes (Menk and Waters, 2000). Field line resonance (FLR) is another proposed mechanism and energy source for Pc3 pulsations observed on Earth, particularly at higher latitudes. FLRs, which resemble vibrating strings fixed at both ends, are widely accepted as the cause of Pc3 pulsations at high and middle latitudes (Kamide and Chian, 2007; Waters and Menk, 2013; Obana et al., 2005; Waters et al., 1991; Ndiitwani and Sutcliffe, 2009; Menk et al., 2006). However, some Pc3 pulsations, especially those observed at very low latitudes (L-shell ≤ 1.2), are better explained by cavity mode oscillations in the plasmasphere (Yumoto et al., 1985; Yumoto, 1986; Kivelson and Southwood, 1985). Lastly, it is worth noting that, while most research on Pc3 pulsations has focused on high and middle latitudes, the SAMA region remains less explored.
This case study includes data from conjugate stations, where two points on Earth's surface are geomagnetically conjugate if they lie at opposite ends of the same geomagnetic field line, located in opposite hemispheres (Wescott, 1966; Nagata, 1967; Timoçin et al., 2018). Conjugate phenomena refer to events that occur symmetrically and simultaneously in conjugate regions, facilitated by the direct connection of magnetic field lines between the hemispheres (Nagata et al., 1962; Wescott, 1961). While much of the research on conjugate points has focused on high and middle latitudes (Obana et al., 2005; Liu et al., 2003; Takasaki et al., 2008; Shi et al., 2020; Nagata, 1967; Wescott, 1961; Nagata et al., 1962; Wescott and Mather, 1965a, b; Hajkowicz, 2006), studies at low latitudes remain less common (Yumoto et al., 1985; Ndiitwani and Sutcliffe, 2009; Pilipenko et al., 2008; Feng et al., 1995). Few studies have examined conjugate station data at low latitudes, with notable examples including Feng et al. (1995), Wolfe et al. (1990), Yumoto et al. (1985), and Takahashi et al. (1994), which investigated the characteristics of Pc3 magnetic pulsations. Finally, examining Pc3 pulsation characteristics using data from geomagnetically conjugate stations offers valuable insights into the role of the ionosphere and plasmasphere in the energy transfer and propagation of these pulsations (Waters et al., 1991; Obana et al., 2005; Yagova et al., 2017).
The aim of this work is to compare Pc3 pulsation patterns between conjugate stations, investigate their electrodynamic behavior, and evaluate the influence of the SAMA on these pulsations. The motivation for this study is to address the following fundamental question: are there differences in the characteristics of Pc3 pulsations recorded at conjugate stations influenced by the SAMA? Magnetic data were simultaneously recorded at two conjugate station pairs, one in the America–SAMA region and the other in the Asia-Pacific region, allowing a comparative analysis of Pc3 pulsation characteristics. Data were collected near the equinox period to ensure better conditions of interhemispheric symmetry. To characterize the behavior of Pc3 pulsations at conjugate stations, we employ a three-step signal analysis approach. Firstly, we apply the fast Fourier transform (FFT) with Welch's power spectral method to provide a global overview of the dataset, highlighting the frequency characteristics of the pulsations between conjugate stations. This helps us to understand how the pulsations are generated and propagated. Secondly, the continuous wavelet transform (CWT) is used to observe timescale variability and non-stationary features. Finally, wavelet coherence analysis is used to identify consistent scales and assess local similarities in Pc3 pulsations between stations. To our knowledge, this integrated methodology has not previously been applied to study Pc3 pulsations and their relationship with the SAMA.
The structure of this work is as follows: Sect. 2 presents the data, Sect. 3 describes the signal analysis methodology, Sect. 4 presents and discusses the results, and Sect. 5 provides the conclusions.
In this section, we provide an overview of the dataset used for this investigation, detail the ground-based stations considered, and describe the space environment conditions relevant to the case study.
2.1 Geomagnetic dataset
In this work, we use the geomagnetic horizontal “H” component, which exhibits a maximum amplitude and is more susceptible to magnetosphere–ionosphere modulation effects. Consequently, it is more suitable for studying pulsations in conjugate points (Obana et al., 2005; Tanaka et al., 2004; Wescott, 1961). The data were sampled at a rate of 1 s for all stations, allowing us to effectively analyze Pc3 pulsations.
We focus on a case study covering the period from 01:00 to 04:00 UT on 25 October 2016, which corresponds to a quiet to moderately disturbed geomagnetic environment (3.5 < Kp < 5; Dst ∼ −30 nT). More information about the space environment conditions for the selected data period is presented and discussed in Camacho et al. (2023). Previous studies have shown that some Pc3 pulsations occur in the range of during quiet to disturbed periods (Feng et al., 1995; Silva et al., 2020; Motoba et al., 2017; Yagova et al., 2015). A storm sudden commencement (SSC) was recorded at 09:22 UT on the same day, after the selected period. This time period was chosen for the analysis of Pc3 pulsations because it is the only period with data from all four stations, where the amplitudes exceed 0.5 nT and the wave packet contains at least three wave cycles.
Fortunately, the chosen period occurred near the September equinox, ensuring nearly equal solar illumination of both hemispheres. This condition results in interhemispheric symmetry, with similarities in conductivity and atmospheric electric current systems at conjugate points (Hartinger et al., 2017; Timoçin et al., 2018). Such atmospheric characteristics simplify the physical system, as conjugate ionospheres during winter or summer would exhibit significantly different conductivities (Menk et al., 2006). Additionally, the moderately disturbed period, characterized by variations in solar wind pressure, offers a unique opportunity to investigate the electrodynamical coupling between the solar wind and the magnetosphere–ionosphere system at low latitudes.
2.2 Ground-based stations
The selected stations are located at low latitudes (L-shell < 2) and are positioned near conjugate points, theoretically placing them close to the feet of the same magnetic field line. Specifically, the Kakioka (KAK) station in Japan is roughly conjugate to Alice Springs (ASP) station in Australia, while San Juan (SJG) station in the United States is roughly conjugate to São Martinho da Serra (SMS) station in Brazil. Figure 1 illustrates the locations of the conjugate stations. Additionally, the surface area of the SAMA is highlighted on the map by the closed blue line, which corresponds to the 32 000 nT magnitude isoline at the Earth's surface, as calculated using the IGRF-13 model.
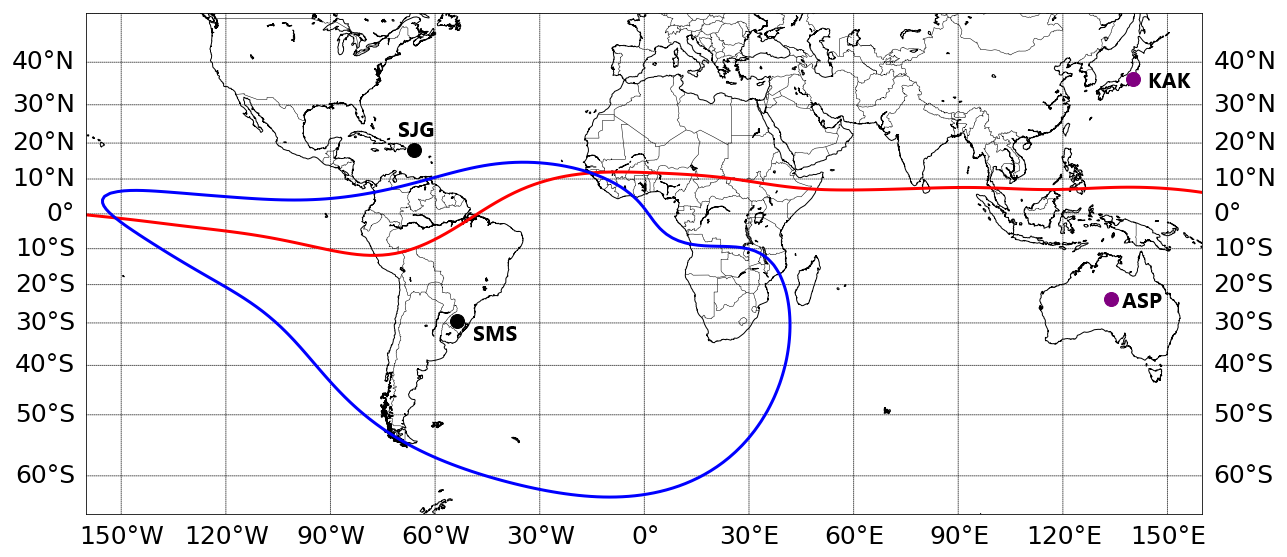
Figure 1The map shows the locations of the conjugate stations, indicated by circles. The red line represents the dip magnetic Equator, while the closed blue line surrounds the SAMA region.
The conjugate coordinates were determined using the altitude-adjusted corrected geomagnetic (AACGM) model, which utilizes the full-resolution IGRF-13 magnetic field model, including its non-dipolar components, to trace magnetic field lines between the hemispheres. The tracing process begins by numerically following the magnetic field line from the geographic starting position to the dipole magnetic equatorial plane, defined by the best-fit Earth-centered dipole. From that point, a dipole field line is traced back to the Earth's surface (Shepherd, 2014; Laundal and Richmond, 2017). These steps provide a more physically meaningful mapping between conjugate locations.
We utilized a Python-based wrapper tool1 implementing the AACGM coordinate system for this purpose. It is well known that the AACGM model includes so-called “forbidden regions”, where coordinate values cannot be defined, particularly near the dip magnetic Equator and in some areas of the South Atlantic Ocean. This issue has been addressed in previous studies by Shepherd (2014), and Laundal and Richmond (2017), who present figures illustrating the forbidden regions. However, recent updates to Shepherd's original code now enable coordinate estimation within these regions using interpolation and fitting techniques. Importantly, the software alerts users when a location falls within a forbidden region where coordinate calculations are invalid by returning an NaN value, indicating that the conjugate point could not be determined. Using this Python wrapper, we verified that none of the stations in this study fall within the forbidden regions. As a result, valid conjugate points could be computed for all stations used in this study, including the one located within the SAMA.
Table 1Coordinates of the magnetic stations.
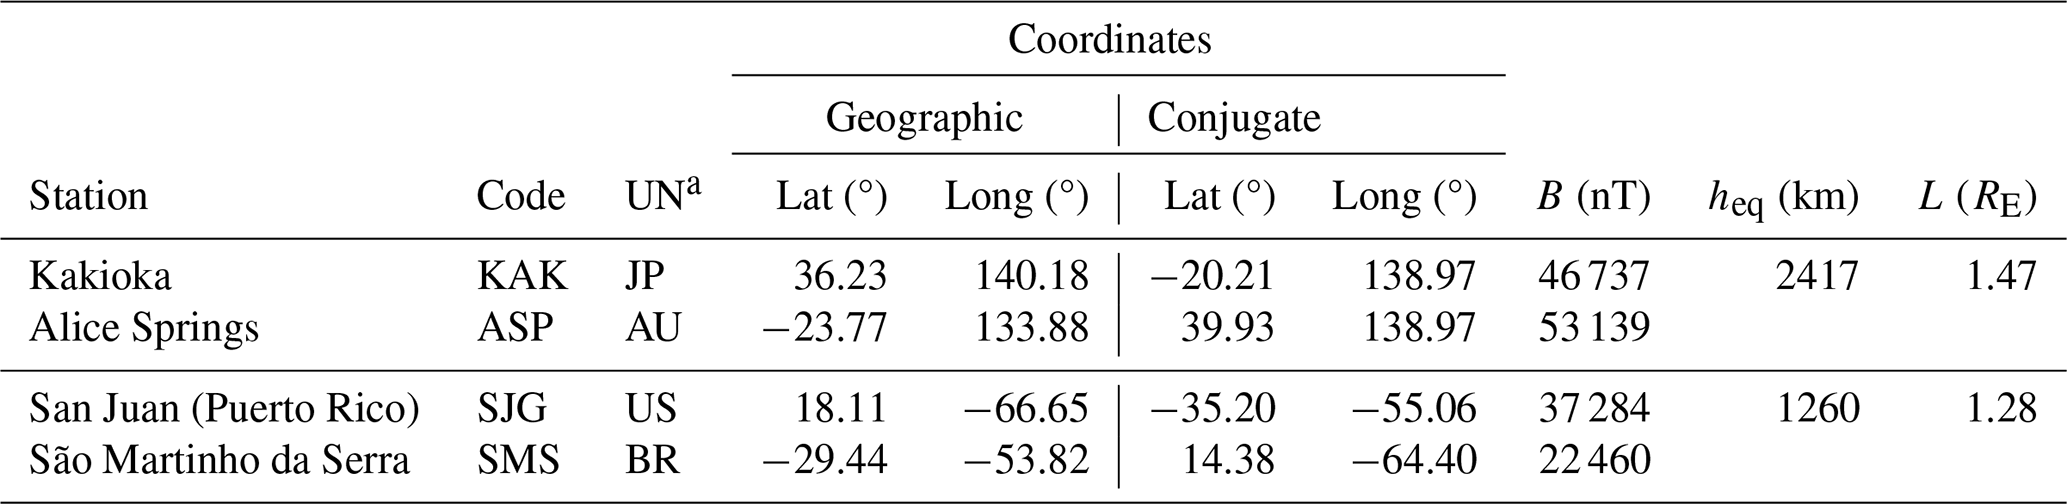
UNa = Country, JP = Japan, AU = Australia, US = The United States, BR = Brazil.
The AACGM model also provides the maximum altitude (heq) of the magnetic flux line linking the stations. All stations are part of the INTERMAGNET and EMBRACE MagNet networks (Denardini et al., 2018). Table 1 lists the geographic and conjugate coordinates, magnetic field intensity (B), and L-shell values for each station.
It is important to acknowledge the limitations of the model employed in this study, including potential model errors (Shepherd, 2014). Although the stations are not located exactly at geomagnetically conjugate points, they are positioned sufficiently close to the conjugate areas (or conjugate regions) to support the intended analysis. This spatial proximity enables the application of our methodology, consistent with previous studies that have utilized the concept of conjugate points between stations, even when not specifically focused on magnetic pulsations (Liu et al., 2003; Wescott, 1966; Momani, 2012; Yumoto et al., 1985; Fukushima et al., 2017; Camacho et al., 2023; de Paula et al., 2010). It is also important to note that, currently, there are few stations situated exactly at conjugate points with the temporal resolution required for detailed analysis of Pc3 pulsations.
The spectral analysis of Pc3 pulsation variations involved several steps. Initially, the raw geomagnetic H-component data were bandpass-filtered using an infinite impulse response (IIR) filter (Shaofeng, 2000; Haykin and Van Veen, 1998; Stearns and Hush, 2016), with a unit response in the period range of 20–100 mHz, in order to extract Pc3 signals.
3.1 Spectral analysis
In this work, we applied two techniques for spectral analysis: time–frequency analysis, which utilizes the Fourier transform, and timescale analysis, based on the continuous wavelet transform.
3.1.1 Time–frequency analysis
The Fourier transform decomposes a waveform into a sum of sinusoids with varying frequencies. It essentially represents the same information as the original waveform but in the frequency domain instead of the time domain. The Fourier transform is commonly used for stationary signal analysis, where all frequencies exhibit infinite coherence (Domingues et al., 2005). This spectral analysis provides a comprehensive description of the frequency components within a given time series. The equation below represents the continuous-time Fourier transform (Brigham, 1988; Kumar and Foufoula-Georgiou, 1997):
where T is the record length, ξ is the frequency, and f(t) is the time series from which we extract a record of length T, in this case, a Pc3 pulsation time series.
In this analysis, we used Welch's power spectral density (PSD) method with fast Fourier transform (FFT) to eliminate low-frequency variations, allowing the spectral features within the frequency range of interest to be more clearly identified. A Hanning window with a length of 512 s was applied to the data in the time domain.
3.1.2 Timescale analysis
Our timescale analysis involves calculating wavelet coefficients using the continuous wavelet transform (CWT) of the filtered signal (f(t), Pc3 pulsations). The CWT is a powerful tool for analyzing both stationary and non-stationary time series, including geophysical signals (Addison, 2002; Torrence and Compo, 1998). It provides insights into the central frequencies (the inverse of central periods) of the events and their timing. The wavelet coefficients generated by the CWT are defined as follows:
where a is scale, τ denotes translation, and ψ0 is the analyzing wavelet function, which is defined on the open-time and real-scale (a, τ) half-plane. The analyzing wavelet function used in this work is the Morlet function (Daubechies, 1992; Antoine et al., 2004).
Our goal is to distinguish the distribution of signal energy across different scales over time. This distribution is visualized in a scalogram, which highlights the maximum energy values and their temporal occurrences. In essence, the scalogram represents the distribution of signal energy with respect to both time τ and scale a.
3.1.3 Global wavelet spectrum
The global wavelet spectrum (GWS) is a mathematical tool that provides an unbiased and consistent estimation of the true power spectrum of a time series signal. By using wavelet transforms, the GWS evaluates how the energy (or power) of the signal is distributed across different timescales, offering both temporal and frequency information. This method is particularly useful for analyzing non-stationary signals, such as geomagnetic pulsations (e.g., Pc3), where the signal characteristics change over time. Unlike traditional Fourier methods, the GWS does not assume stationarity, allowing it to detect transient high-frequency events more accurately (Daubechies, 1992; Torrence and Compo, 1998; Frick et al., 1998).
3.2 Coherence analysis
Coherence analysis can quantify the correlation between signals or similarity between them in the frequency domain (Bortel and Sovka, 2007), helping to determine whether pulsations come from the same source region in the frequency domain (Jun et al., 2014, 2016). Differences in observations may indicate disturbances from local processes or asymmetrical effects from external sources. The cross-wavelet transform is a tool used to examine timescale dependencies between two time series, defined as follows:
Based on this cross-transform, we can compute the wavelet coherence and a phase measure. They provide linear-quantitative estimators of the degree to which the relationship scales between the two signals (Labat, 2005; Torrence and Compo, 1998). Here, the wavelet coherence is computed using the following expression:
Wavelet coherence () values, ranging from 0 to 1, indicate the degree of linear relationship between two signals. Values close to 1 suggest a strong correlation, implying the signals likely come from the same source. Values near 0 indicate weak or no correlation, suggesting the signals originate from different sources. The operator “S” is a smoothing function applied in the timescale domain, implemented via convolution of transform coefficients with a Gaussian moving average in both time and scale directions. This smoothing reduces noise introduced by amplification effects (Grinsted et al., 2004). The wavelet coherence phase, denoted as θx,y, is derived from the real and imaginary components of the coefficients. This measurement yields information on the delay of one signal considering the other as a function of time and scale. Implementation of the CWT and wavelet coherence were based on a library of MATLAB functions provided by Grinsted et al. (2004). A detailed explanation of the methodology can be found in Camacho et al. (2023).
Our case study focuses on the spectral analysis of Pc3 pulsations from terrestrial magnetic stations located at conjugate points in two global regions. The objectives include identifying Pc3 events, analyzing power spectral density, performing wavelet analysis to examine process dynamics, conducting coherence analysis between conjugate stations, and comparing behaviors influenced by the SAMA.
4.1 Pc3 event identification
Figure 2 shows the Pc3 pulsations for each conjugate pair (with each pair indicated by red and blue). We initially selected two time intervals representing simultaneous wave packets of Pc3 pulsations. Both intervals have the same duration of 10 min. The time intervals were chosen based on the presence of significant Pc3 pulsation amplitudes in both regions and the significant wavelet coefficients (as seen in Figs. 4 and 5, which are described later).
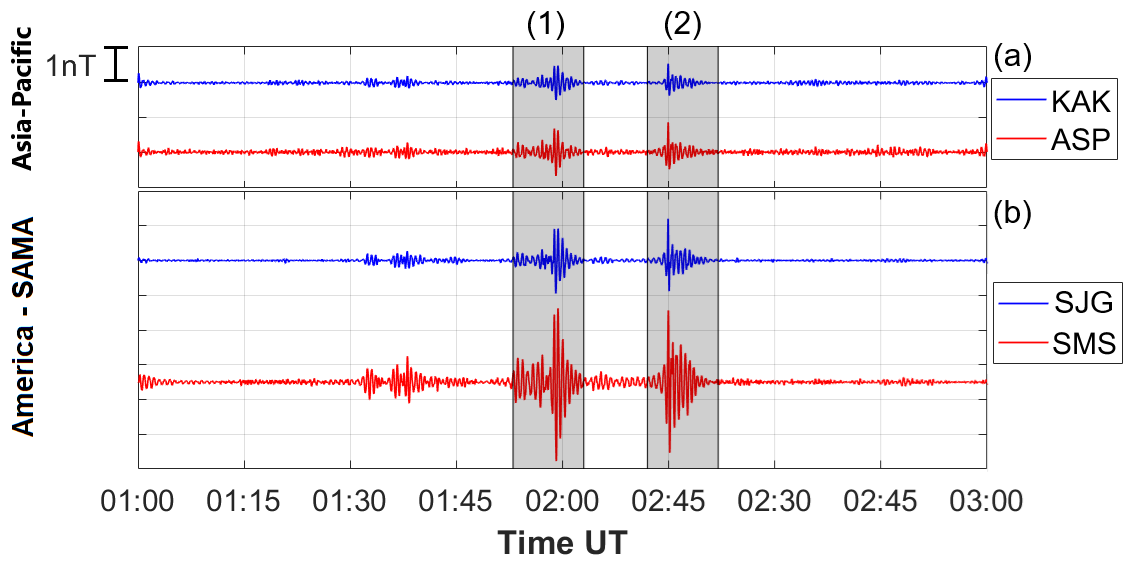
Figure 2Filtered Pc3 pulsations at conjugate stations on 25 October 2026. (a) KAK–ASP and (b) SJG–SMS.
Through visual inspection, the plots in Fig. 2 show consistent propagation patterns of Pc3 wave packets that are simultaneous and similar between the conjugate stations, particularly between KAK and ASP in the Asia-Pacific region. That is, the occurrence of the Pc3 pulsation was essentially identical, and relative amplitudes were similar. This observation is consistent with some previous investigations at conjugate stations (Obana et al., 2005; Feng et al., 1995; Takahashi et al., 1994; Engebretson et al., 2000; Yumoto et al., 1985). Additionally, Fig. 2b shows that Pc3 wave packets in the Southern Hemisphere generally exhibit higher-amplitude intensities compared to those in the Northern Hemisphere for conjugate station pairs. At the SMS station, an enhancement in Pc3 pulsation amplitudes is observed near the center of the South Atlantic Magnetic Anomaly (SAMA). During quiet to moderately disturbed geomagnetic conditions, the SAMA region experiences an increase in Pc3 pulsation amplitudes, which may be associated with electron precipitation in the ionospheric D and E layers. The SMS station, located near the center of the SAMA, recorded the highest amplitudes of these pulsations.
4.2 Pc3 power spectral density analysis
We employ a power spectral method (explained in Sect. 3.1.1) to analyze the significant peaks and evaluate the similarity between the conjugate station pairs. Figure 3 displays Welch's power spectral density (PSD) of the filtered time series, calculated using the FFT, for the selected intervals. It also shows the frequency contributions to the Pc3 pulsations across all intervals for the conjugate pairs. In interval 1, two significant discrete spectral peaks are observed for each conjugate pair at 23.4 and 29.2 mHz in both regions. In interval 2, a significant peak is observed at 27.3 mHz in all stations. Furthermore, the amplitudes of the peaks in both intervals are similar in the Asia-Pacific region. In contrast, the amplitudes of the peaks at the SMS station are considerably higher than those at its conjugate station. This result may indicate that the SMS station is influenced by an altered upper atmosphere in the SAMA region, primarily due to the ionosphere. It is important to note that some authors have observed spectra similar to Pc3 pulsations at low latitudes and/or over a wide range of latitudes on the Earth's surface (Yumoto and Saito, 1983; Odera et al., 1994; Matsuoka et al., 1997). However, this would be the first time that similar spectra have been observed at conjugate points and at low latitudes, particularly when considering the SAMA region.
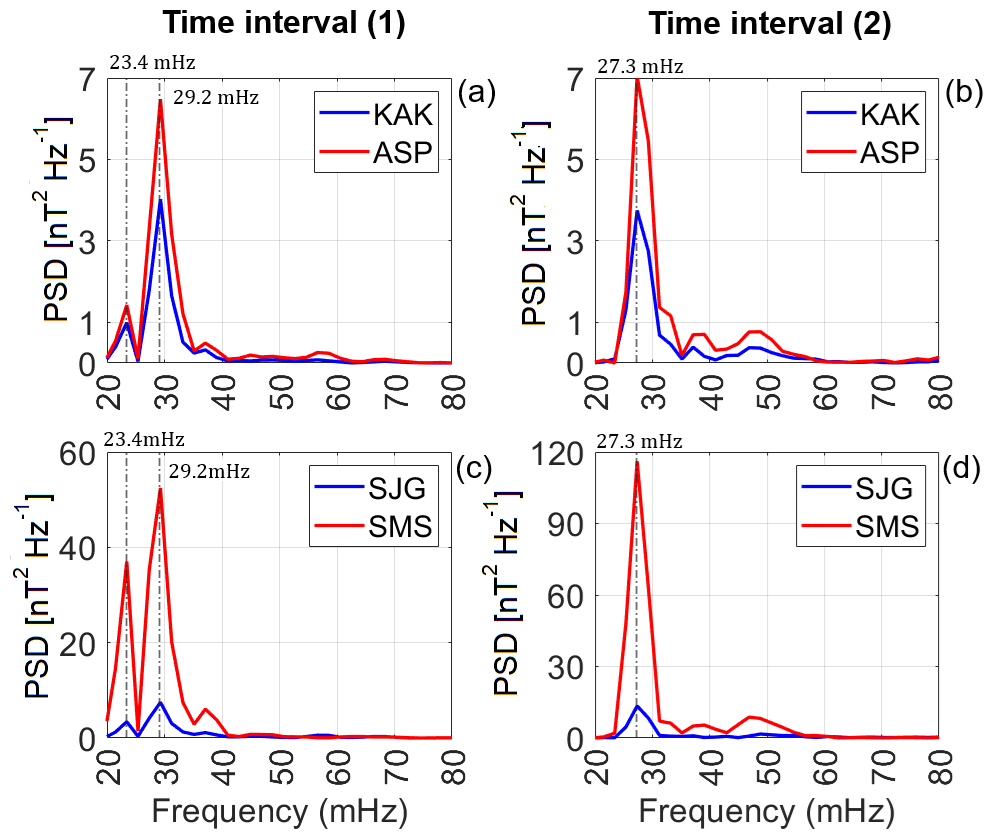
Figure 3Welch's power spectral density of the Pc3 pulsations from conjugate stations in the Asia-Pacific region: time interval 1 (a, c) and time interval 2 (b, d).
The dominant frequencies (23.4, 29.2, and 27.3 mHz) are consistent with some of the discrete frequencies observed in the 20–30 mHz range, as reported by Menk et al. (1994), Menk and Waters (2000), Ndiitwani and Sutcliffe (2009), Eriksson et al. (2006), and Feng et al. (1995). Several studies have reported the manifestation of pulsations and fluctuations at discrete frequencies, often interpreted in terms of field line resonances (FLRs) associated with large-scale waveguide/cavity modes in the Earth's magnetosphere (Kamide and Chian, 2007; Waters and Menk, 2013; Menk and Waters, 2000; Ndiitwani and Sutcliffe, 2009; Villante et al., 2022; Waters et al., 2000; McPherron, 2005). However, this topic is not the primary focus of the current work, though it could be explored in future studies.
4.3 Wavelet analysis of Pc3 dynamics
In this section, we analyze the signal energy across different scales over time. Scalograms are used to visualize the location of maximum values and their temporal occurrence, offering an effective way to examine pulsation details and highlight similarities.
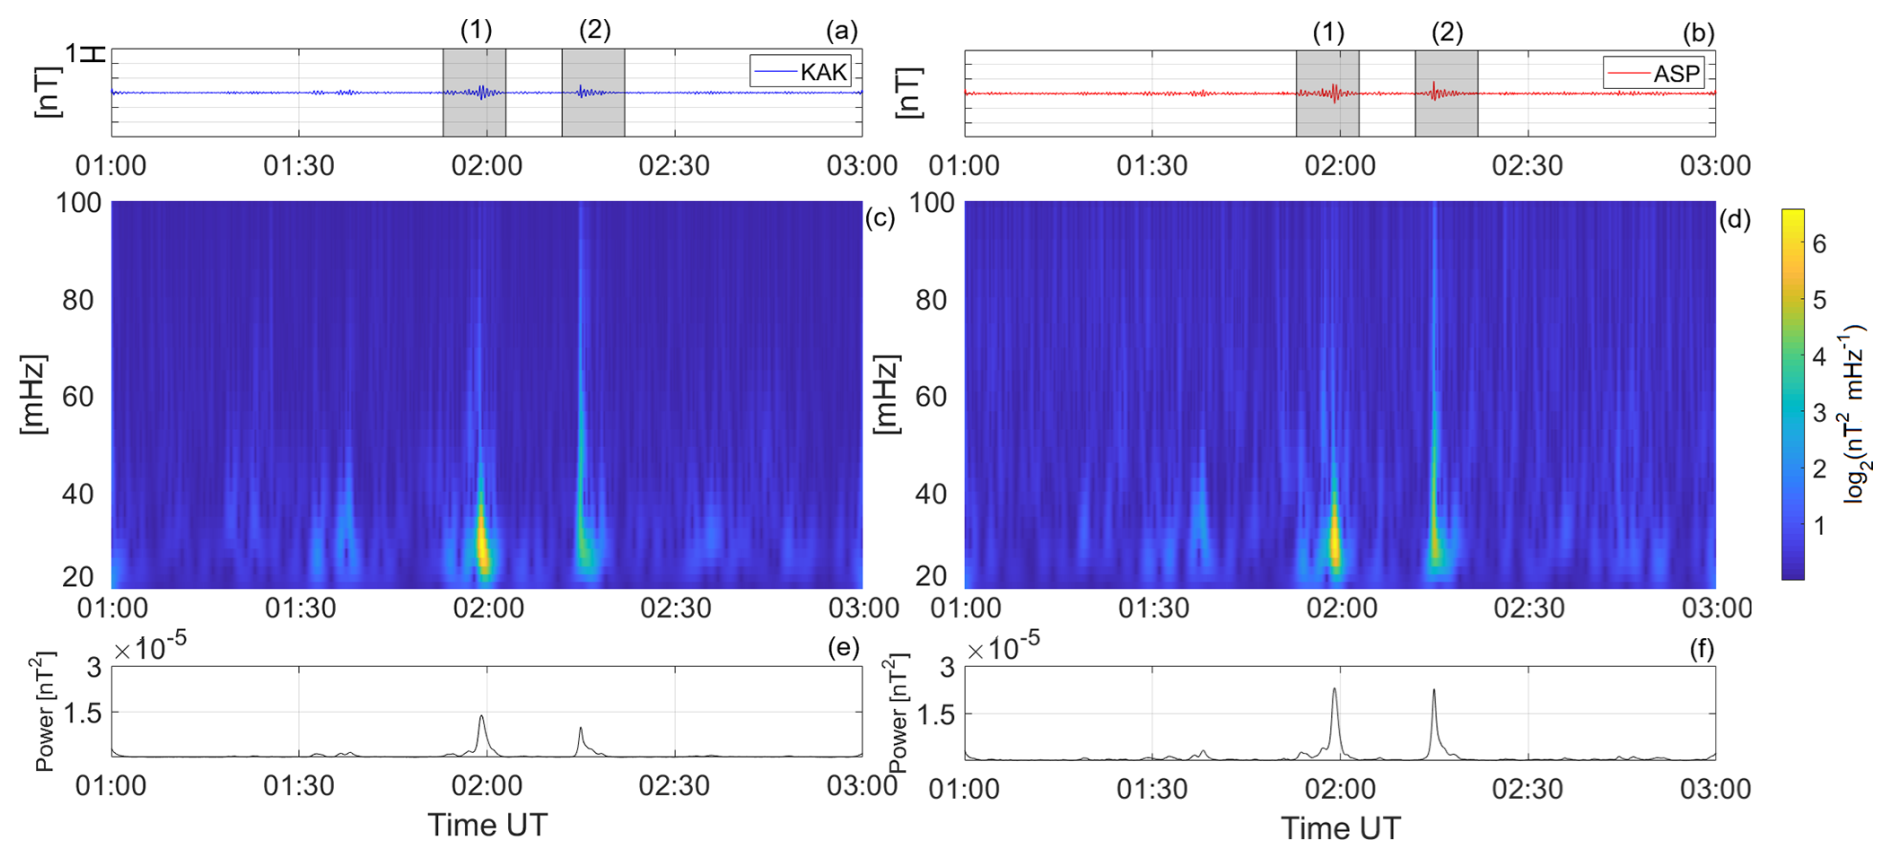
Figure 4Pc3 pulsations (a–b), squared wavelet coefficient scalograms (c–d), and global wavelet spectrum (e–f). Asia-Pacific region.
For the Asia-Pacific region, Fig. 4 shows the Pc3 pulsation signal (Fig. 4a and b), the corresponding scalograms (Fig. 4c and d), and plots of the global wavelet spectrum (Fig. 4e and f), each corresponding to the conjugate stations. Panels in the same vertical column correspond to the KAK station in the Northern Hemisphere (on the left) and the ASP station in the Southern Hemisphere (on the right), while panels at the same horizontal position refer to the conjugate station pair. In wavelet scalograms, the horizontal axis represents the time in hours, while the vertical axis represents the signal intensity (in nT) and wavelet scale (in mHz), respectively. The magnitudes of the wavelet coefficients are indicated by the color bar, which has the same range (nT2 mHz−1) for the signal analysis of each station.
Figure 4c and d highlight the characteristics of the Pc3 pulsations. The maximum values of the wavelet coefficients (indicated in yellow) coincide with the most intense Pc3 wave packets observed at each station (Fig. 4a and b). In the two selected time intervals (1 and 2), the scalograms show higher-intensity spectrum values in the frequency range of 20 to 40 mHz. An inspection of the scalograms reveals similar features in energy amplitude, duration, and scale (converted to central frequency) for the conjugate pairs. The global wavelet spectrum plots highlight two peaks that are similar between the conjugate stations, coinciding with the Pc3 pulsation wave packets observed at each station. However, it can be noted that the peak powers at the ASP station are slightly more intense. Based on the observed similarity in energy patterns, we conclude that the conjugate pairs in the Asia-Pacific region are subject to nearly identical conditions in the magnetosphere–ionosphere system.
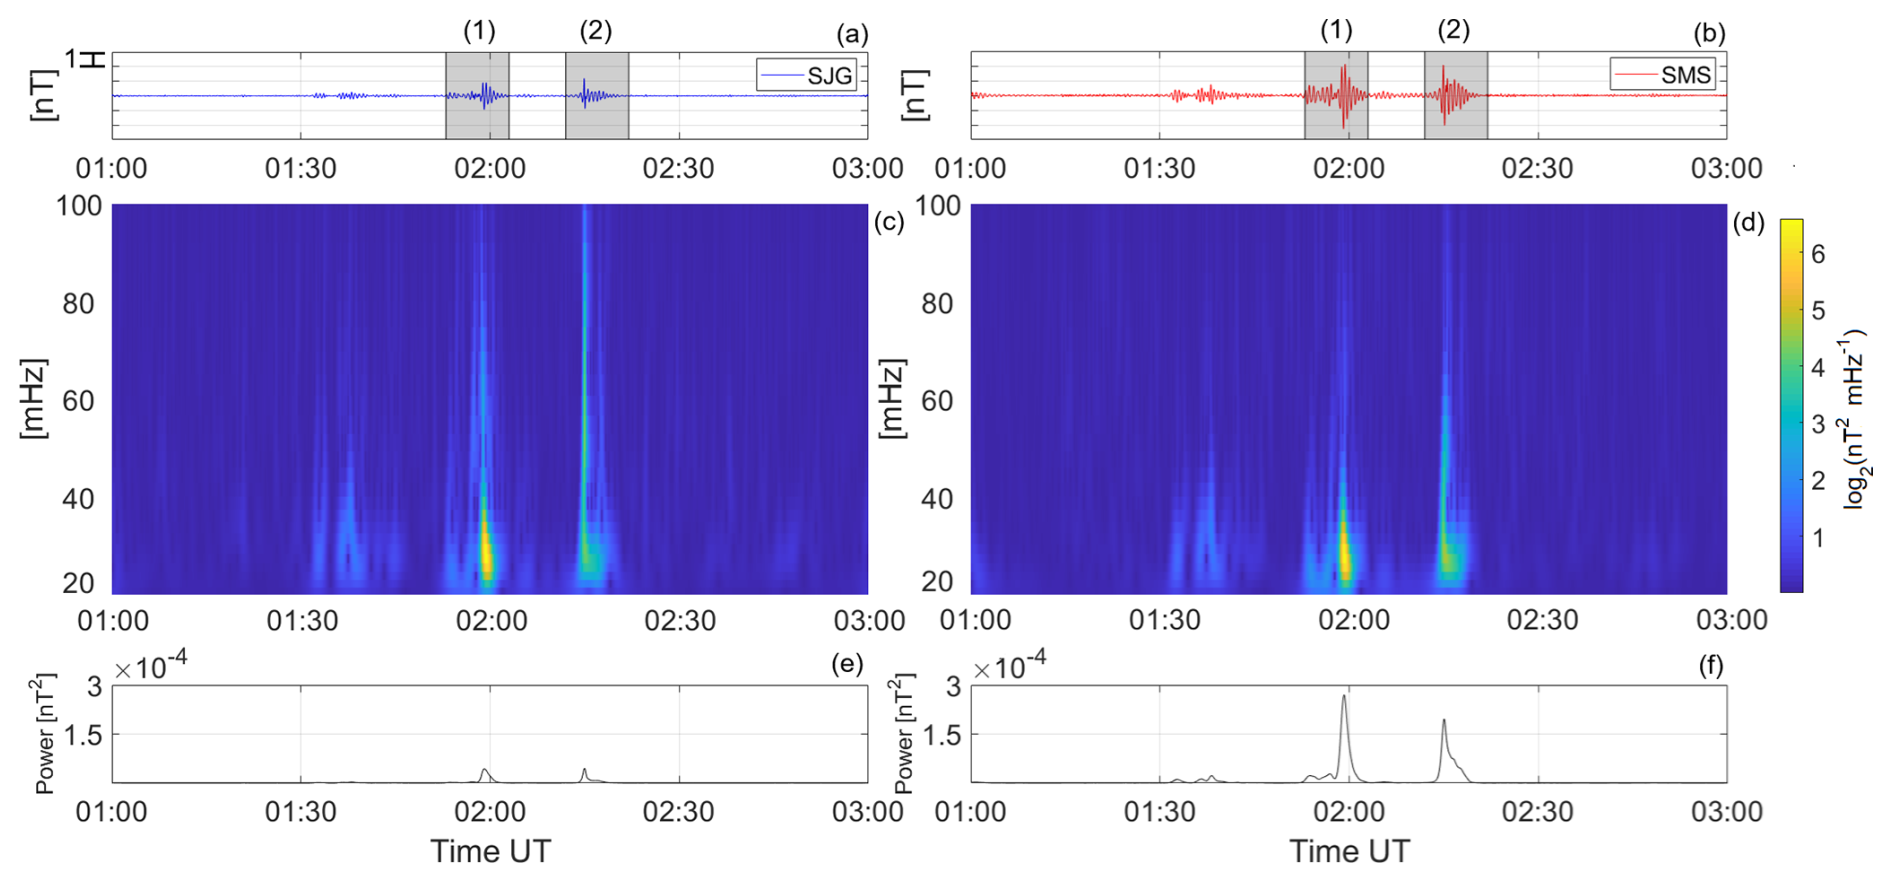
Figure 5Pc3 pulsations (a–b), squared wavelet coefficient scalograms (c–d), and global wavelet spectrum (e–f). America–SAMA region.
Figure 5 presents the Pc3 pulsation data (top panels), scalogram (middle panels), and plots of the global wavelet spectrum (bottom panels) for the conjugate station, following a format similar to the previous figure but focusing on the America–SAMA region.
Initially, the scalograms show similar and simultaneous energy patterns, with the more intense wavelet coefficients corresponding to the Pc3 pulsation wave packets. However, the coefficients at the SMS station show a slight increase in intensity, particularly during time interval 2. Additionally, the more intense wavelet coefficient values in the scalograms are observed between 20 and 40 mHz. The global wavelet spectrum plots (Fig. 5e and f) reveal two peaks at the conjugate stations, which align with the Pc3 pulsation wave packets detected at each location. However, it is noted that the peak powers at the SMS station are more intense than at its conjugate. Finally, the results suggest that the SAMA influences the energy of Pc3 pulsations due to ionization in the SAMA region. The use of the CWT technique to investigate timescale characteristics has significantly contributed to this study.
4.4 Coherence analysis
To complete the investigation, we employ coherence analysis to address the following question: for a pair of signals from conjugate stations, how similar are their power spectra?
The wavelet coherence for each conjugate pair in both global regions, calculated using Eq. (4), is used to create color map plots (Fig. 6). These plots represent the coherence values of Pc3 pulsations between the conjugate pairs, with yellow indicating maximum coherence (close to 1). Arrows indicate the phase relationship between signals: right arrows for in-phase, left arrows for anti-phase, and inclined arrows for intermediate values. Arrows are shown only where the coherence is 0.8 or higher for better visualization.
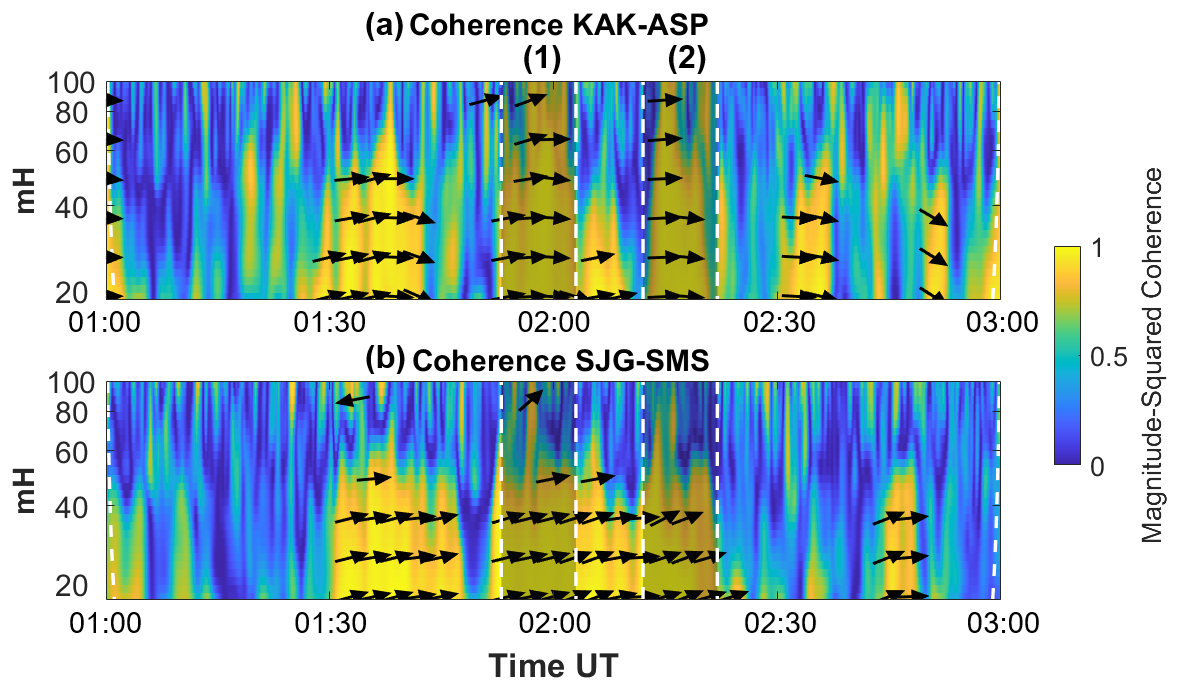
Figure 6Wavelet coherence representations for Pc3 pulsations between the conjugate pair stations. The color map indicates the amplitude, and arrows indicate the phase where the amplitude is larger than 0.8. (a) KAK–ASP and (b) SJG–SMS.
Figure 6 shows the wavelet coherence results for the conjugate stations in both the Asia-Pacific and America–SAMA regions. As seen in Fig. 6a, the time intervals for the KAK–ASP stations exhibit very high coherence (𝒞𝒲>0.7) and in-phase signals for pulsations at the conjugate stations. Coherence in the 20 to 100 mHz band is consistently high between this conjugate pair. Matsuoka et al. (1997) and Obana et al. (2005) also observed high-coherence Pc3–5 pulsations (using FFT) between conjugate stations, recorded in the Asia-Pacific region. Finally, the high coherence in this region suggests that the Pc3 pulsations observed at the conjugate stations likely originated from the same source in the magnetosphere. These results may indicate that the stations are subject to similar effects and undergo similar processes of energy transfer between the magnetosphere and ionosphere.
In contrast, when examining the time intervals in Fig. 6b, there are generally moderate to high signal coherence () and in-phase signals between the conjugate stations. The SJG–SMS pair shows lower coherence than the KAK–ASP pair, with moderate to high coherence observed in the 20–60 mHz band. This reduced coherence for SJG–SMS may be linked to the station's proximity to the SAMA center, where enhanced electrical conductivity, due to particle precipitation, alters pulsations and impacts the plasmasphere–ionosphere system, thereby modifying the structure of Pc3 pulsations along the magnetic field lines connecting conjugate stations.
4.5 Summary of the comparative analysis of Pc3 pulsations inside and outside the SAMA
In summary, the observations from our case study demonstrate a striking similarity and simultaneity of Pc3 pulsations recorded at conjugate stations in low-latitude regions and across two distinct geographic areas. These pulsations occurred near the time of interhemispheric illumination symmetry, coinciding with the September equinox.
In the Asia-Pacific region, nearly symmetric conditions at the magnetopause, plasmasphere, and ionosphere result in similar and simultaneous Pc3 pulsation amplitudes. Spectral analyses (PSD) and scalograms show significant similarities between conjugate stations, with high coherence and in-phase signals in this region. In contrast, in the America–SAMA region, an enhancement in the amplitude of Pc3 pulsations was observed at the SMS station.
Previous studies have reported similar observations. For instance, Obana et al. (2005), Yumoto et al. (1985), and Engebretson et al. (2000) observed that magnetic pulsations at conjugate stations outside the South Atlantic Magnetic Anomaly (SAMA) typically exhibit comparable amplitude and phase characteristics. In contrast, studies focused on the SAMA region (though not necessarily at conjugate stations) have shown that Pc3 pulsation amplitudes are often enhanced in this area (Silva et al., 2020; Trivedi et al., 2005b; Zanandrea et al., 2004b; Oliva et al., 2014). Furthermore, research on Pc5 pulsations has also reported amplitude enhancement within the SAMA region (Camacho et al., 2023; Zanandrea et al., 2004a). Thus, our case study aligns with previous findings and supports the interpretation that the enhancement of pulsation amplitudes in the SAMA region is a persistent feature.
While spectral analyses and scalograms showed similarities, the SMS station displayed more intense power spectral density and wavelet coefficients. Notably, the discrete spectral frequencies (PSD) were identical in both regions. Moderate to high coherence and in-phase signals were also observed in this region. These differences arise from the asymmetric conditions between the America–SAMA stations. Although both stations experience similar magnetopause conditions, they differ in particle precipitation and plasmasphere–ionosphere dynamics, with the SMS station exhibiting an ionization anomaly. This suggests that the SAMA region influences the characteristics and structure of Pc3 pulsations.
The high coherence observed in both regions suggests that the Pc3 pulsations likely originate from the same external source in the magnetosphere, propagating along magnetic flux lines linking the conjugate stations. However, at the SMS station, the Pc3 pulsations may also be influenced by factors such as the ionization in the SAMA, particle precipitation, and variations in electrical conductivity during slightly perturbed periods. These asymmetries in plasmasphere–ionosphere conditions alter the Pc3 pulsations along the magnetic flux lines in the America–SAMA region, contrasting with the Asia-Pacific region, which is under more symmetric conditions.
The observations from this case study support the conclusion that the SAMA region influences the characteristics of Pc3 pulsations. This study does not address the sources of the pulsations or the internal mechanisms driving the modifications in the magnetic pulsations. Exploring these aspects would necessitate the use of additional methodologies and comprehensive data from ground-based instruments to examine the ionosphere and from satellites to probe the plasmasphere.
This study analyzed Pc3 pulsation data from two conjugate station pairs at low latitudes (L-shell < 2), located in the Asia-Pacific and America–SAMA regions. The aim was to compare the Pc3 pulsation patterns between these stations, investigate their electrodynamic behavior at conjugate locations, and assess the influence of the SAMA region. Fourier and wavelet transform techniques were applied to analyze the pulsations, allowing the visualization of spectral and coherence characteristics. To simplify the geophysical and electromagnetic processes in the magnetosphere–ionosphere system, data were analyzed during a period of conditions near interhemispherical illumination symmetry. The main results observed from the Pc3 pulsation data, based on our case study, are summarized as follows:
-
The Pc3 pulsations exhibited similar waveforms and occurred simultaneously at conjugate stations in both regions. Under the influence of the SAMA, these pulsations showed an enhancement in amplitude.
-
The dominant frequencies identified (1.9, 2.1, 2.6, and 2.8 mHz) were identical in both regions. However, the SMS station, located near the SAMA center, exhibited a general amplification of spectral power (PSD) compared to its conjugate station.
-
A high degree of similarity in the scalograms was observed at all conjugate stations in both regions. However, at the station influenced by the SAMA, the wavelet coefficients were more intense.
-
In the Asia-Pacific region, the signals between conjugate pairs exhibited high coherence and in-phase behavior. In contrast, in the America–SAMA region, the Pc3 pulsations showed moderate to high coherence, also remaining in phase.
In summary, while the Pc3 wave structures likely originate from the same external source, possibly within the magnetosphere, and propagate to lower latitudes via magnetic flux lines to the conjugate stations, certain characteristics of the pulsations might be modified in the SAMA-influenced region. The observed differences in this region, such as the enhanced amplitudes of Pc3 pulsations and more pronounced wavelet and PSD coefficients, may be attributed to the unique features of this sector. These include significant longitudinal variation in the magnetic field and the precipitation of energetic particles from the inner Van Allen belts, which alter the ionospheric conductivity.
These represent the first direct observations of Pc3 pulsations at conjugate points in the SAMA-influenced region and the first comparative analysis between conjugate stations, highlighting how the electrodynamics of the pulsations may be influenced by the largest anomaly of the Earth. This study provides new insights into the effects of the South Atlantic Magnetic Anomaly on geomagnetic pulsations recorded at ground stations located at conjugate points. A valuable direction for future research is to investigate the role of internal factors, such as field line resonance and cavity/waveguide modes, in influencing magnetic pulsations, an objective that lies beyond the scope of the present study.
Finally, we emphasize that our study utilizes 1 s resolution data from conjugate stations, an uncommon and valuable dataset in this field. The limited availability of such high-resolution conjugate data currently constrains our ability to perform a more statistically comprehensive analysis. For this reason, we opted to focus on a case study, supported by a robust methodological framework that integrates three complementary techniques to address the proposed objective and yields unpublished results. Nevertheless, we intend to conduct a statistical analysis in future work.
The software code used in this study was developed in-house and is based on predefined functions in MATLAB (https://www.mathworks.com/help/wavelet/ref/cwt.html, last access: February 2025).
Data are available from the international repositories INTERMAGNET (International Real-time Magnetic Observatory Network, 2025) and from INPE (Instituto Nacional de Pesquisas Espaciais, 2025).
EC: writing (manuscript draft), visualization, data, methodology, analysis of the results. LB: writing (review and editing), analysis of the results, supervision.
The contact author has declared that neither of the authors has any competing interests.
Publisher's note: Copernicus Publications remains neutral with regard to jurisdictional claims made in the text, published maps, institutional affiliations, or any other geographical representation in this paper. While Copernicus Publications makes every effort to include appropriate place names, the final responsibility lies with the authors.
This article is part of the special issue “Geomagnetic observatories, their data, and the application of their data”. It is a result of the XXth IAGA Workshop on Geomagnetic Observatory Instruments, Data Acquisition, and Processing, Vassouras, Brazil, 30 October–6 November 2024.
This study was financed by the Conselho Nacional de Desenvolvimento Científico e Tecnológico (CNPq), PCI/ON/MCTI grant no. 301114/2024-2. The authors would like to thank INTERMAGNET (https://www.intermagnet.org, last access: February 2025) and EMBRACE MagNet (http://www2.inpe.br/climaespacial/portal/en/, last access: February 2025) for the datasets used in this work. The authors also thank Odim Mendes and Margarete Domingues (INPE) for their collaboration on this work.
This research has been supported by the Conselho Nacional de Desenvolvimento Científico e Tecnológico (CNPq), PCI/ON/MCTI (grant no. 301114/2024-2).
This paper was edited by Emmanuel Nahayo and reviewed by two anonymous referees.
Abdu, M., Batista, I., Carrasco, A., and Brum, C.: South Atlantic magnetic anomaly ionization: A review and a new focus on electrodynamic effects in the equatorial ionosphere, J. Atmos. Sol.-Terr. Phy., 67, 1643–1657, https://doi.org/10.1016/j.jastp.2005.01.014, 2022. a, b
Addison, P.: The illustrated wavelet transform handbook. Introductory theory and applications in science, engineering, medicine and finance, CRC press, ISBN 9780750306928, https://doi.org/10.1201/9781420033397, 2002. a
Antoine, J., Murenzi, R., Vandergheynst, P., and Ali, S. (Eds.): Two-Dimensional Wavelets and their Relatives, Cambridge University, Cambridge, https://doi.org/10.1017/CBO9780511543395, 2004. a
Bortel, R. and Sovka, P.: Approximation of statistical distribution of magnitude squared coherence estimated with segment overlapping, Signal Process., 87, 1100–1117, https://doi.org/10.1016/j.sigpro.2006.10.003, 2007. a
Brigham, O.: The fast Fourier transform and its applications, Prentice Hall, New Jersey, ISBN 0-13-307505-2, 1988. a
Camacho, E., Benyosef, L., Mendes, O., and Domingues, M.: Pc5 Pulsations in the South Atlantic Magnetic Anomaly, Braz. J. Phys., 53, 16, https://doi.org/10.1007/s13538-022-01229-x, 2023. a, b, c, d
Caraballo, R.: The South Atlantic Magnetic Anomaly Phenomena: Its impact on the technological infrastructure, Master's thesis, University of the Republic Uruguay, https://doi.org/10.13140/RG.2.1.4345.5600, 2016. a, b
Daubechies, I.: Ten lectures on wavelets, Society for Industrial and Applied Mathematics, Philadelphia, ISBN 978-0-89871-274-2, https://doi.org/10.1137/1.9781611970104, 1992. a, b
Denardini, C. M., Chen, S. S., Resende, L. C. A., Moro, J., Bilibio, A. V., Fagundes, P. R., Gende, M. A., Cabrera, M. A., Bolzan, M. J. A., Padilha, A. L., Schuch, N. J., Hormaechea, J. L., Alves, L. R., Barbosa Neto, P. F., Nogueira, P. A. B., Picanço, G. A. S., and Bertollotto, T. O.: The Embrace magnetometer network for South America: Network description and its qualification, Radio Sci., 53, 288–302, https://doi.org/10.1002/2017RS006477, 2018. a
de Paula, E. R., Muella, M. T. A. H., Sobral, J. H. A., Abdu, M. A., Batista, I. S., Beach, T. L., and Groves, K. M.: Magnetic conjugate point observations of kilometer and hundred-meter scale irregularities and zonal drifts, J. Geophys. Res.-Space, 115, 288–302, https://doi.org/10.1029/2010JA015383, 2010. a
Domingos, J., Jault, D., Pais, M. A., and Mandea, M.: The South Atlantic Anomaly throughout the solar cycle, Earth Planet. Sc. Lett., 473, 154–163, https://doi.org/10.1016/j.epsl.2017.06.004, 2017. a, b
Domingues, M. O., Mendes, O., and da Costa, A. M.: On wavelet techniques in atmospheric sciences, Adv. Space Res., 35, 831–842, https://doi.org/10.1016/j.asr.2005.02.097, 2005. a
Engebretson, M. J., Cobian, R. K., Posch, J. L., and Arnoldy, R. L.: A conjugate study of Pc3–4 pulsations at cusp latitudes: Is there a clock angle effect?, J. Geophys. Res.-Space, 105, 15965–15980, https://doi.org/10.1029/1999JA000328, 2000. a, b
Eriksson, P. T. I., Blomberg, L. G., Schaefer, S., and Glassmeier, K.-H.: On the excitation of ULF waves by solar wind pressure enhancements, Ann. Geophys., 24, 3161–3172, https://doi.org/10.5194/angeo-24-3161-2006, 2006. a
Feng, Q., Fraser, B. J., Menk, F. W., Ziesolleck, C. W. S., Saka, O., and Kitamura, T.: Pc 3-4 geomagnetic pulsations observed at very low latitude conjugate stations, J. Geophys. Res.-Space, 100, 19287–19298, 1995. a, b, c, d, e
Finlay, C., Kloss, C., Olsen, N., Hammer, M., Tøffner-Clausen, L., Grayver, A., and Kuvshinov, A.: The CHAOS-7 geomagnetic field model and observed changes in the South Atlantic Anomaly, Earth Planets Space, 72, 1–31, https://doi.org/10.1186/s40623-020-01252-9, 2020. a
Francia, P., De Lauretis, M., Vellante, M., Villante, U., and Piancatelli, A.: ULF geomagnetic pulsations at different latitudes in Antarctica, Ann. Geophys., 27, 3621–3629, https://doi.org/10.5194/angeo-27-3621-2009, 2009. a, b
Francia, P., Regi, M., De Lauretis, M., Villante, U., and Pilipenko, V. A.: A case study of upstream wave transmission to the ground at polar and low latitudes, J. Geophys. Res.-Space, 117, 1–14, https://doi.org/10.1029/2011JA016751, 2012. a
Frick, P., Grossmann, A., and Tchamitchian, P.: Wavelet analysis of signals with gaps, J. Math. Phys., 39, 4091–4107, https://doi.org/10.1063/1.532485, 1998. a
Fukushima, D., Shiokawa, K., Otsuka, Y., Kubota, M., Yokoyama, T., Nishioka, M., Komonjinda, S., and Yatini, C.: Geomagnetically conjugate observations of ionospheric and thermospheric variations accompanied by a midnight brightness wave at low latitudes, Earth Planets Space, 69, 112, https://doi.org/10.1186/s40623-017-0698-z, 2017. a
Greenstadt, E. W., McPherron, R. L., and Takahashi, K.: Solar Wind Control of Daytime, Midperiod Geomagnetic Pulsations, Springer Netherlands, Dordrecht, 89–110, ISBN 978-94-009-8426-4, https://doi.org/10.1007/978-94-009-8426-4_6, 1981. a
Grinsted, A., Moore, J. C., and Jevrejeva, S.: Application of the cross wavelet transform and wavelet coherence to geophysical time series, Nonlin. Processes Geophys., 11, 561–566, https://doi.org/10.5194/npg-11-561-2004, 2004. a, b
Hagen, M. and Azevedo, A.: Investigation of Potential Factors on South Atlantic Magnetic Anomaly, Open Journal of Earthquake Research, 15, 207–221, https://doi.org/10.4236/ojer.2024.131001, 2024. a
Hajkowicz, L. A.: Magnetoconjugate phenomena in Alaska and Macquarie Is., Australia in 2003: position of the global maximum iso-aurorae, Ann. Geophys., 24, 2611–2617, https://doi.org/10.5194/angeo-24-2611-2006, 2006. a
Hartinger, M. D., Xu, Z., Clauer, C. R., Yu, Y., Weimer, D. R., Kim, H., Pilipenko, V., Welling, D. T., Behlke, R., and Willer, A. N.: Associating ground magnetometer observations with current or voltage generators, J. Geophys. Res.-Space, 122, 7130–7141, https://doi.org/10.1002/2017JA024140, 2017. a
Hartmann, G. A. and Pacca, I. G.: Time evolution of the South Atlantic agnetic Anomaly, An. Acad. Bras. Ciênc., 81, 243–255, https://doi.org/10.1590/S0001-37652009000200010, 2009. a, b
Haykin, S. and Van Veen, B.: Signals and Systems, Wiley, ISBN 9780471138204, https://books.google.com.br/books?id=uOE-ngEACAAJ (last access: February 2025), 1998. a
Instituto Nacional de Pesquisas Espaciais, INPE [data set], https://www2.inpe.br/climaespacial/portal/embracedatasobre/, last access: 1 February 2025, 2025. a
International Real-time Magnetic Observatory Network: INTERMAGNET [data set], https://intermagnet.org/data_download.html, last access: 1 February 2025, 2025. a
Jun, C. W., Shiokawa, K., Connors, M., Schofield, I., Poddelsky, I., and Shevtsov, B.: Study of Pc1 pearl structures observed at multi-point ground stations in Russia, Japan, and Canada, Earth Planets Space, 66, 1–14, https://doi.org/10.1186/s40623-014-0140-8, 2014. a
Jun, C. W., Shiokawa, K., Connors, M., Schofield, I., Poddelsky, I., and Shevtsov, B.: Possible generation mechanisms for Pc1 pearl structures in the ionosphere based on 6 years of ground observations in Canada, Russia, and Japan, J. Geophys. Res.-Space, 121, 4409–4424, https://doi.org/10.1002/2015JA022123, 2016. a
Kamide, Y. and Chian, A. (Eds.): Handbook of the solar-terrestrial environment, Springer-Verlag, Berlin, ISBN 978-3-540-46314-6, 2007. a, b, c, d
Kivelson, M. G. and Southwood, D. J.: Resonant ULF waves: A new interpretation, Geophys. Res. Lett., 12, 49–52, https://doi.org/10.1029/GL012i001p00049, 1985. a, b
Kleimenova, N., Kozyreva, O., Malysheva, L., Soloviev, A., Bogoutdinov, S., and Zelinsky, N.: Storm-associated equatorial Pc3 geomagnetic pulsations based on the one-second INTERMAGNET multi-station measurements, in: Proceedings of the 9th International Conference “Problems of Geocosmos”, 8–12 October 2012, St. Petersburg, Russia, p. 261, https://geo.phys.spbu.ru/materials_of_a_conference_2012/STP2012/Kleimenova_%20et_all_Geocosmos2012proceedings.pdf, 2012. a
Kumar, P. and Foufoula-Georgiou, E.: Wavelet Analysis for Geophysical Application, Rev. Geophys., 35, 385–412, https://doi.org/10.1029/97RG00427, 1997. a
Labat, D.: Recent advances in wavelet analyses: Part 1. a review of concepts, J. Hydrol., 314, 275–288, https://doi.org/10.1016/j.jhydrol.2005.04.003, 2005. a
Laundal, K. and Richmond, A. D.: Magnetic coordinate systems, Space Sci. Rev., 206, 27–59, https://doi.org/10.1007/s11214-016-0275-y, 2017. a, b
Liu, Y., Fraser, B., Liu, R., and Ponomarenko, P.: Conjugate phase studies of ULF waves in the Pc5 band near the cusp, J. Geophys. Res.-Space, 108, 1274–1290, https://doi.org/10.1029/2002JA009336, 2003. a, b
Matsuoka, H., Takahashi, K., Kokubun, S., Yumoto, K., Yamamoto, T., Solovyev, S., and Vershinin, E.: Phase and amplitude structure of Pc 3 magnetic pulsations as determined from multipoint observations, J. Geophys. Res.-Space, 102, 2391–2403, https://doi.org/10.1029/96JA02918, 1997. a, b
McPherron, R.: Magnetic pulsations: their sources and relation to solar wind and geomagnetic activity, Surv. Geophys., 26, 545–592, https://doi.org/10.1007/s10712-005-1758-7, 2005. a
Mendes da Costa, A., Oliveira Domingues, M., Mendes, O., and Marques Brum, C. G.: Interplanetary medium condition effects in the South Atlantic Magnetic Anomaly: A case study, J. Atmos. Sol.-Terr. Phy., 73, 1478–1491, https://doi.org/10.1016/j.jastp.2011.01.010, 2011. a
Menk, F. and Waters, C.: Field line resonances and waveguide modes at low latitudes: 2. A model, J. Geophys. Res.-Space, 105, 7763–7774, https://doi.org/10.1029/1999JA900267, 2000. a, b, c
Menk, F. W., Fraser, B. J., Waters, C. L., Ziesolleck, C. W. S., Feng, Q., Lee, S. H., and Mcnabb, P. W.: Ground Measurements of Low Latitude Magnetospheric Field Line Resonances, in: Solar Wind Sources of Magnetospheric Ultra-Low-Frequency Waves, American Geophysical Union, Washington DC, vol. 81, 299–310, https://doi.org/10.1029/GM081p0299, 1994. a
Menk, F. W., Clilverd, M. A., Yearby, K. H., Milinevski, G., Thomson, N. R., and Rose, M. C.: ULF Doppler oscillations of L=2.5 flux tubes, J. Geophys. Res.-Space, 111, A07205, https://doi.org/10.1029/2005JA011192, 2006. a, b
Momani, M. A.: GPS observations at quasi-conjugate points during solar minimum, Radio Sci., 47, 1–12, https://doi.org/10.1029/2011RS004826, 2012. a
Motoba, T., Ebihara, Y., Kadokura, A., Engebretson, M. J., Lessard, M. R., Weatherwax, A. T., and Gerrard, A. J.: Fast-moving diffuse auroral patches: A new aspect of daytime Pc3 auroral pulsations, J. Geophys. Res.-Space, 122, 1542–1554, https://doi.org/10.1002/2016JA023285, 2017. a
Nagata, T.: Geomagnetic conjugacy between the antarctic and the arctic, in: Proceedings of the International Symposium on Pacific Antarctic Sciences Pacific, 11th Pacific Science Congress, National Institute of Polar Research Repository, Tokyo, Japan, 23–27 August 1966, 65–80, https://core.ac.uk/download/51479527.pdf (last access: February 2025), 1967. a, b
Nagata, T., Kokubun, S., and Fukushima, N.: Similarity and simultaneity of magnetic disturbance in the northern and southern hemispheres, J. Phys. Soc. Jpn., 17, 17–35, http://adsabs.harvard.edu/abs/1962JPSJS..17A..35N (last access: February 2025), 1962. a, b
Nasuddin, K. A., Abdullah, M., and Abdul Hamid, N. S.: Characterization of the South Atlantic Anomaly, Nonlin. Processes Geophys., 26, 25–35, https://doi.org/10.5194/npg-26-25-2019, 2019. a, b, c
Ndiitwani, D. C. and Sutcliffe, P. R.: The structure of low-latitude Pc3 pulsations observed by CHAMP and on the ground, Ann. Geophys., 27, 1267–1277, https://doi.org/10.5194/angeo-27-1267-2009, 2009. a, b, c, d, e
Obana, Y., Yoshikawa, A., Olson, J.and Morris, R., Fraser, B., and Yumoto, K.: North-south asymmetry of the amplitude of high-latitude Pc3-5 pulsations: Observations at conjugate stations, J. Geophys. Res.-Space, 110, A10214, https://doi.org/10.1029/2003JA010242, 2005. a, b, c, d, e, f, g
Odera, T., Van Swol, D., and Russell, C.: Simultaneous observation of Pc 3, 4 pulsations in the magnetosphere and at multiple ground stations, Geoph. Monog. Series, 81, 311–323, 1994. a
Oliva, D., Meirelles, M., and Papa, A.: A study of Pc4-5 geomagnetic pulsations in the Brazilian sector, Physics Space, arXiv [preprint], https://doi.org/10.48550/arXiv.1404.4321, 16 April 2014. a
Pavón-Carrasco, F. J. and De Santis, A.: The South Atlantic Anomaly: The Key for a Possible Geomagnetic Reversal, Front. Earth Sci., 4, 1–9, https://doi.org/10.3389/feart.2016.00040, 2016. a, b
Pilipenko, V., Fedorov, E., Heilig, B., and Engebretson, M. J.: Structure of ULF Pc3 waves at low altitudes, J. Geophys. Res.-Space, 113, 1–16, https://doi.org/10.1029/2008JA013243, 2008. a
Ponomarenko, P. V., Waters, C. L., and St-Maurice, J.-P.: Upstream Pc3-4 waves: Experimental evidence of propagation to the nightside plasmapause/plasmatrough, Geophys. Res. Lett., 37, 1–4, https://doi.org/10.1029/2010GL045416, 2010. a
Sanchez, S., Wicht, J., and Baerenzung, J.: Predictions of the geomagnetic secular variation based on the ensemble sequential assimilation of geomagnetic field models by dynamo simulations, Earth Planets Space, 72, 1–20, https://doi.org/10.1186/s40623-020-01279-y, 2020. a, b
Santarelli, L., Lepidi, S., Palangio, P., and Cafarella, L.: Pc3–Pc4 pulsations at Terra Nova Bay (Antarctica): seasonal dependence of the power and its relationship with solar wind parameters, Memorie della Società Astronomica Italiana, ISBN 1274183774, 2003. a
Shaofeng, Y.: Digital filter technology and its application to geomagnetic pulsations in Antarctica, Advances in Polar Science, 11, 67–73, http://library.arcticportal.org/id/eprint/2199 (last access: February 2025), 2000. a
Shepherd, S.: Altitude-adjusted corrected geomagnetic coordinates: Definition and functional approximations, J. Geophys. Res.-Space, 119, 7501–752, https://doi.org/10.1002/2014JA020264, 2014. a, b, c
Shi, X., Hartinger, M. D., Baker, J. B. H., Ruohoniemi, J. M., Lin, D., Xu, Z., Coyle, S., Kunduri, B. S. R., Kilcommons, L. M., and Willer, A.: Multipoint Conjugate Observations of Dayside ULF Waves During an Extended Period of Radial IMF, J. Geophys. Res.-Space, 125, 1–16, https://doi.org/10.1029/2020JA028364, 2020. a
Silva, G. B. D., Padilha, A. L., and Alves, L. R.: Latitudinal variation of Pc3–Pc5 geomagnetic pulsation amplitude across the dip equator in central South America, Ann. Geophys., 38, 35–49, https://doi.org/10.5194/angeo-38-35-2020, 2020. a, b
Stearns, S. D. and Hush, D. R.: Digital signal processing with examples in MATLAB, CRC press, ISBN-13 978-1439837825, 2016. a
Sutcliffe, P. R., Heilig, B., and Lotz, S.: Spectral structure of Pc3–4 pulsations: possible signatures of cavity modes, Ann. Geophys., 31, 725–743, https://doi.org/10.5194/angeo-31-725-2013, 2013. a
Takahashi, K., Anderson, B., Newell, P., Yamamoto, T., and Sato, N.: Propagation of compressional Pc3 pulsations from space to the ground: A case study using multipoint measurements, in: Solar Wind Sources of Magnetospheric Ultra-Low-Frequency Waves, vol. 81 of Geophysical Monograph, American Geophysical Union, Washington DC, 355–363, https://doi.org/10.1029/GM081p0355, 1994. a, b
Takasaki, S., Sato, N., Kadokura, A., Yamagishi, H., Kawano, H., Ebihara, Y., and Tanaka, Y.: Interhemispheric observations of field line resonance frequencies as a continuous function of ground latitude in the auroral zones, Polar Sci., 2, 73–86, https://doi.org/10.1016/j.polar.2008.05.003, 2008. a
Tanaka, Y.-M., Yumoto, K., Yoshikawa, A., Shinohara, M., Kawano, H., and Kitamura, T.-I.: Longitudinal structure of Pc3 pulsations on the ground near the magnetic equator, J. Geophys. Res.-Space, 109, 1–10, https://doi.org/10.1029/2003JA009903, 2004. a
Terra-Nova, F., Amit, H., and Choblet, G.: Preferred locations of weak surface field in numerical dynamos with heterogeneous core-mantle boundary heat flux: Consequences for the South Atlantic Anomaly, Geophys. J. Int., 217, 1179–1199, https://doi.org/10.1093/gji/ggy519, 2019. a
Timoçin, E., Ünal, I., Tulunay, Y., and Göker, U. D.: The effect of geomagnetic activity changes on the ionospheric critical frequencies (foF2) at magnetic conjugate points, Adv. Space Res., 62, 821–828, https://doi.org/10.1016/j.asr.2018.05.035, 2018. a, b
Torrence, C. and Compo, G. P.: A practical guide to wavelet analysis, B. Am. Meteorol. Soc., 79, 61–78, https://doi.org/10.1175/1520-0477(1998)079<0061:APGTWA>2.0.CO;2, 1998. a, b, c
Trivedi, N., Abdu, M., Pathan, B., Dutra, S., Schuch, N., Santos, J., and Barreto, L.: Amplitude enhancement of SC(H) events in the South Atlantic anomaly region, J. Atmos. Sol.-Terr. Phy., 67, 1751–1760, https://doi.org/10.1016/j.jastp.2005.03.010, 2005a. a
Trivedi, N., Pathan, B., Schuch, N. J., Barreto, M., and Dutra, L.: Geomagnetic phenomena in the South Atlantic anomaly region in Brazil, Adv. Space Res., 36, 2021–2024, https://doi.org/10.1016/j.asr.2004.09.020, 2005b. a
Villante, U., Recchiuti, D., and Di Matteo, S.: The Transmission of ULF Waves From the Solar Wind to the Magnetosphere: An Analysis of Some Critical Aspects, Frontiers in Astronomy and Space Sciences, 9, 1–22, https://doi.org/10.3389/fspas.2022.835539, 2022. a
Waters, C., Harrold, B., Menk, F., Samson, J., and Fraser, B.: Field line resonances and waveguide modes at low latitudes: 2. A model, J. Geophys. Res.-Space, 105, 7763–7774, https://doi.org/10.1029/1999JA900267, 2000. a
Waters, C. L. and Menk, F. W.: Magnetoseismology: ground-based remote sensing of earth's magnetosphere, Wiley-VCH, ISBN 9783527652075, 2013. a, b, c
Waters, C. L., Menk, F. W., and Fraser, B. J.: The resonance structure of low latitude Pc3 geomagnetic pulsations, Geophys. Res. Lett., 18, 2293–2296, https://doi.org/10.1029/91GL02550, 1991. a, b
Wescott, E.: Magnetic variations at conjugate points, J. Geophys. Res., 66, 1789–1792, https://doi.org/10.1029/JZ066i006p01789, 1961. a, b, c
Wescott, E.: Magnetoconjugate phenomena, Space Sci. Rev., 5, 507–561, https://doi.org/10.1007/BF00240576, 1966. a, b
Wescott, E. and Mather, K.: Magnetic conjugacy at very high latitude; shepherd bay-scott base relationship, Planet. Space Sci., 13, 303–324, https://doi.org/10.1016/0032-0633(65)90005-X, 1965a. a
Wescott, E. and Mather, K.: Magnetic conjugacy from L=6 to L=1.4: 1. auroral zone: Conjugate area, seasonal variations, and magnetic coherence, J. Geophys. Res., 70, 29–42, https://doi.org/10.1029/JZ070i001p00029, 1965b. a
Wolfe, A., Venkatesan, D., Slawinski, R., and Maclennan, C.: A conjugate area study of Pc 3 pulsations near cusp latitudes, J. Geophys. Res.-Space, 95, 10695–10698, 1990. a
Yagova, N., Heilig, B., and Fedorov, E.: Pc2-3 geomagnetic pulsations on the ground, in the ionosphere, and in the magnetosphere: MM100, CHAMP, and THEMIS observations, Ann. Geophys., 33, 117–128, https://doi.org/10.5194/angeo-33-117-2015, 2015. a
Yagova, N., Heilig, B., Pilipenko, V., Yoshikawa, A., Nosikova, N., Yumoto, K., and Reda, J.: Nighttime Pc3 pulsations: MM100 and MAGDAS observations, Earth Planets Space, 69, 1–17, https://doi.org/10.1186/s40623-017-0647-x, 2017. a, b
Yue, Y., Gao, J., He, F., Wei, Y., Cai, S., Wang, H., Wang, Y., Rong, Z., Yao, Z., Lin, W., and Pan, Y.: Evolution and disappearance of the paleo-West Pacific Anomaly: Implications to the future of South Atlantic Anomaly, Phys. Earth Planet. In., 353, 107214, https://doi.org/10.1016/j.pepi.2024.107214, 2024. a
Yumoto, K. and Saito, T.: Relation of compressional HM waves at GOES 2 to low-latitude Pc 3 magnetic pulsations, J. Geophys. Res.-Space, 88, 10041–10052, 1983. a
Yumoto, K., Saito, T., and Tanaka, Y.: Low-latitude Pc3 magnetic pulsations observed at conjugate stations (L∼1.5), J. Geophys. Res.-Space, 90, 12201–12207, https://doi.org/10.1029/JA090iA12p12201, 1985. a, b, c, d, e, f
Yumoto, K.: Generation and propagation mechanisms of low-latitude magnetic pulsations – A review, J. Geophys., 60, 79–105, 1986. a, b, c, d
Zanandrea, A., Da Costa, J., Dutra, S., Rosa, R., and Saotome, O.: Spectral and polarization analysis of geomagnetic pulsations data using a multitaper method, Comput. Geosci., 30, 797–808, https://doi.org/10.1016/j.cageo.2004.03.016, 2004a. a
Zanandrea, A., Da Costa, J., Dutra, S., Trivedi, N., Kitamura, T., Yumoto, K., and Saotome, O.: Pc3-4 geomagnetic pulsations at very low latitude in Brazil, Planet. Space Sci., 52, 1209–1215, https://doi.org/10.1016/j.pss.2004.08.001, 2004b. a
https://pypi.org/project/aacgmv2/ (last access: February 2025)