Articles | Volume 15, issue 1
https://doi.org/10.5194/gi-15-53-2026
© Author(s) 2026. This work is distributed under
the Creative Commons Attribution 4.0 License.
https://doi.org/10.5194/gi-15-53-2026
© Author(s) 2026. This work is distributed under
the Creative Commons Attribution 4.0 License.
Classification of sea-ice concentration from ship-board S-band radar images using open-source machine learning tools

Elizabeth Westbrook
University of North Carolina, Wilmington, North Carolina, United States of America
Applied Physics Laboratory, University of Washington, Seattle, Washington, United States of America
School of Oceanography, University of Washington, Seattle, Washington, United States of America
Emmett Culhane
Woods Hole Oceanographic Institution, Woods Hole, Massachusetts, United States of America
Frederick Bingham
University of North Carolina, Wilmington, North Carolina, United States of America
Astrid Pacini
Applied Physics Laboratory, University of Washington, Seattle, Washington, United States of America
Carlyn Schmidgall
Applied Physics Laboratory, University of Washington, Seattle, Washington, United States of America
School of Oceanography, University of Washington, Seattle, Washington, United States of America
Julian Schanze
Earth and Space Research, Seattle, Washington, United States of America
Kyla Drushka
Applied Physics Laboratory, University of Washington, Seattle, Washington, United States of America
Related authors
No articles found.
Astrid Pacini, Michael Steele, and Mary-Beth Schreck
The Cryosphere, 19, 1391–1411, https://doi.org/10.5194/tc-19-1391-2025, https://doi.org/10.5194/tc-19-1391-2025, 2025
Short summary
Short summary
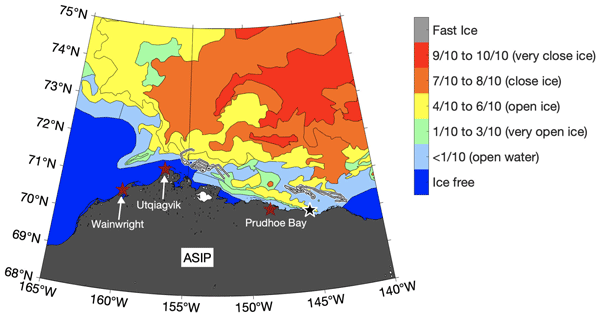
While sea ice concentration data are critically important for climate research, obtaining high-resolution data remains a challenge. Here we present and validate the US National Weather Service Alaska Sea Ice Program (ASIP) ice maps. These maps are shown to be highly accurate when compared to in situ observations and to outperform a passive-microwave-based product, especially at low concentrations. Therefore, ASIP data provide an exciting new tool to study ice conditions in the Pacific Arctic.
Kyla Drushka, Elizabeth Westbrook, Frederick M. Bingham, Peter Gaube, Suzanne Dickinson, Severine Fournier, Viviane Menezes, Sidharth Misra, Jaynice Pérez Valentín, Edwin J. Rainville, Julian J. Schanze, Carlyn Schmidgall, Andrey Shcherbina, Michael Steele, Jim Thomson, and Seth Zippel
Earth Syst. Sci. Data, 16, 4209–4242, https://doi.org/10.5194/essd-16-4209-2024, https://doi.org/10.5194/essd-16-4209-2024, 2024
Short summary
Short summary
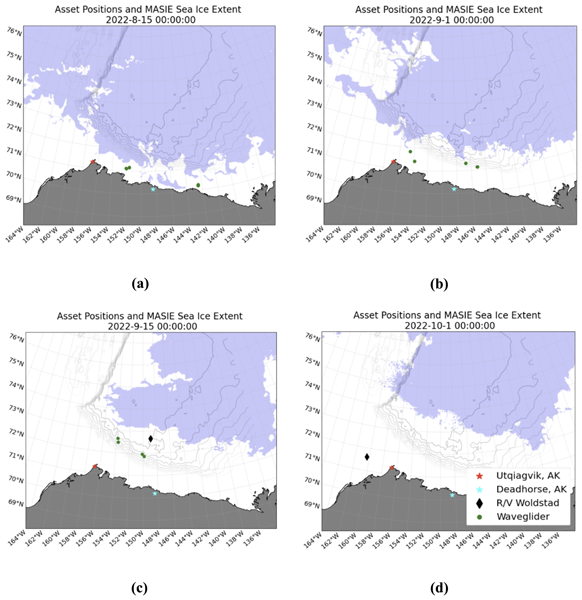
The NASA SASSIE mission aims to understand the role of salinity in modifying sea ice formation in early autumn. The 2022 SASSIE campaign collected measurements of upper-ocean properties, including stratification (layering of the ocean) and air–sea fluxes in the Beaufort Sea. These data are presented here and made publicly available on the NASA Physical Oceanography Distributed Active Archive Center (PO.DAAC), along with code to manipulate the data and generate the figures presented herein.
Sabine Mecking and Kyla Drushka
Biogeosciences, 21, 1117–1133, https://doi.org/10.5194/bg-21-1117-2024, https://doi.org/10.5194/bg-21-1117-2024, 2024
Short summary
Short summary
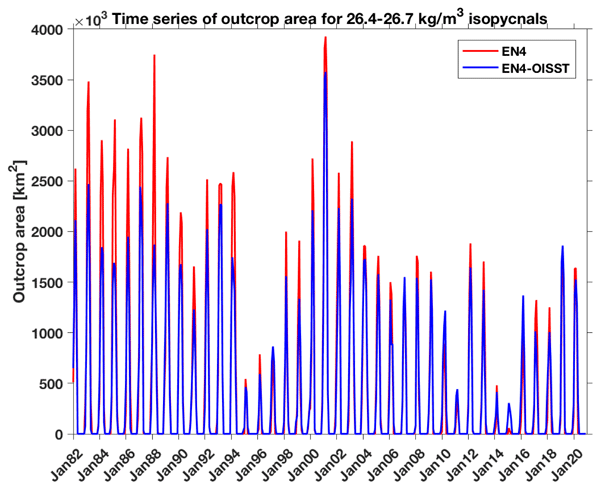
This study investigates whether northeastern North Pacific oxygen changes may be caused by surface density changes in the northwest as water moves along density horizons from the surface into the subsurface ocean. A correlation is found with a lag that about matches the travel time of water from the northwest to the northeast. Salinity is the main driver causing decadal changes in surface density, whereas salinity and temperature contribute about equally to long-term declining density trends.
Darren C. McKee, Scott C. Doney, Alice Della Penna, Emmanuel S. Boss, Peter Gaube, Michael J. Behrenfeld, and David M. Glover
Biogeosciences, 19, 5927–5952, https://doi.org/10.5194/bg-19-5927-2022, https://doi.org/10.5194/bg-19-5927-2022, 2022
Short summary
Short summary
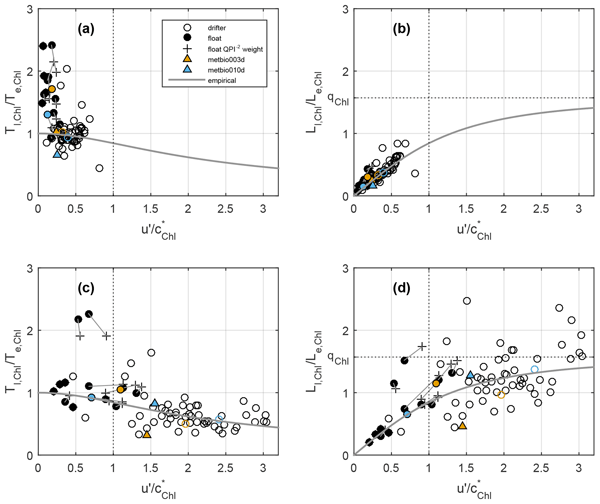
As phytoplankton (small, drifting photosynthetic organisms) drift with ocean currents, biomass accumulation rates should be evaluated in a Lagrangian (observer moves with a fluid parcel) as opposed to an Eulerian (observer is stationary) framework. Here, we use profiling floats and surface drifters combined with satellite data to analyse time and length scales of chlorophyll concentrations (a proxy for biomass) and of velocity to quantify how phytoplankton variability is related to water motion.
Kevin J. Sanchez, Bo Zhang, Hongyu Liu, Matthew D. Brown, Ewan C. Crosbie, Francesca Gallo, Johnathan W. Hair, Chris A. Hostetler, Carolyn E. Jordan, Claire E. Robinson, Amy Jo Scarino, Taylor J. Shingler, Michael A. Shook, Kenneth L. Thornhill, Elizabeth B. Wiggins, Edward L. Winstead, Luke D. Ziemba, Georges Saliba, Savannah L. Lewis, Lynn M. Russell, Patricia K. Quinn, Timothy S. Bates, Jack Porter, Thomas G. Bell, Peter Gaube, Eric S. Saltzman, Michael J. Behrenfeld, and Richard H. Moore
Atmos. Chem. Phys., 22, 2795–2815, https://doi.org/10.5194/acp-22-2795-2022, https://doi.org/10.5194/acp-22-2795-2022, 2022
Short summary
Short summary
Atmospheric particle concentrations impact clouds, which strongly impact the amount of sunlight reflected back into space and the overall climate. Measurements of particles over the ocean are rare and expensive to collect, so models are necessary to fill in the gaps by simulating both particle and clouds. However, some measurements are needed to test the accuracy of the models. Here, we measure changes in particles in different weather conditions, which are ideal for comparison with models.
Frederick M. Bingham and Susannah Brodnitz
Ocean Sci., 17, 1437–1447, https://doi.org/10.5194/os-17-1437-2021, https://doi.org/10.5194/os-17-1437-2021, 2021
Short summary
Short summary
Satellite measurements of sea surface salinity (SSS) are compared with measurements in the ocean to verify the quality of the satellite data. SSS satellites measure average values over a footprint with size of ~100 km, whereas ocean values are usually taken at a single point in space and time. Using SSS data from a network of buoys across the global tropics, we estimate the size of the mismatch between satellite and in situ measurements to better understand the error structure of the satellite.
Cited articles
Bridle, J. S.: Probabilistic interpretation of feedforward classification network outputs, with relationships to statistical pattern recognition, in: Neurocomputing: Algorithms, architectures and applications, Springer, 227–236, https://doi.org/10.1007/978-3-642-76153-9_28, 1990. a, b
de Gélis, I., Colin, A., and Longépé, N.: Prediction of Categorized Sea Ice Concentration From Sentinel-1 SAR Images Based on a Fully Convolutional Network, IEEE Journal of Selected Topics in Applied Earth Observations and Remote Sensing, 14, 5831–5841, https://doi.org/10.1109/JSTARS.2021.3074068, 2021. a
Drushka, K.: SASSIE Arctic Field Campaign Shipboard Thermos-salinograph Data Fall 2022, PO.DAAC [data set], https://doi.org/10.5067/SASSIE-TSG2, 2024. a
Drushka, K.: SASSIE Arctic Field Campaign Shipboard S-band Radar Data Fall 2022, PO.DAAC [data set], https://doi.org/10.5067/SASSIE-SBAND4, 2024b.
Drushka, K., Westbrook, E., Bingham, F. M., Gaube, P., Dickinson, S., Fournier, S., Menezes, V., Misra, S., Pérez Valentín, J., Rainville, E. J., Schanze, J. J., Schmidgall, C., Shcherbina, A., Steele, M., Thomson, J., and Zippel, S.: Salinity and Stratification at the Sea Ice Edge (SASSIE): an oceanographic field campaign in the Beaufort Sea, Earth Syst. Sci. Data, 16, 4209–4242, https://doi.org/10.5194/essd-16-4209-2024, 2024. a, b, c, d
Haykin, S., Currie, B. W., Lewis, E. O., and Nickerson, K. A.: Surface-based radar imaging of sea ice, Proceedings of the IEEE, 73, 233–251, 1985. a
Huang, G., Liu, Z., Van Der Maaten, L., and Weinberger, K. Q.: Densely connected convolutional networks, in: Proceedings of the IEEE conference on computer vision and pattern recognition, 4700–4708, https://openaccess.thecvf.com/content_cvpr_2017/html/Huang_Densely_Connected_Convolutional_CVPR_2017_paper.html (last access: 25 April 2024), 2017. a
Kern, S., Lavergne, T., Notz, D., Pedersen, L. T., and Tonboe, R.: Satellite passive microwave sea-ice concentration data set inter-comparison for Arctic summer conditions, The Cryosphere, 14, 2469–2493, https://doi.org/10.5194/tc-14-2469-2020, 2020. a
Lannuzel, D., Tedesco, L., van Leeuwe, M., Campbell, K., Flores, H., Delille, B., Miller, L., Stefels, J., Assmy, P., Bowman, J., Brown, K., Castellani, G., Chierici, M., Crabeck, O., Damm, E., Else, B., Fransson, A., Fripiat, F., Geilfus, N.-X., Jacques, C., Jones, E., Kaartokallio, H., Kotovitch, M., Meiners, K., Moreau, S., Nomura, D., Peeken, I., Rintala, J.-M., Steiner, N., Tison, J.-L., Vancoppenolle, M., Van der Linden, F., Vichi, M., and Wongpan, P.: The future of Arctic sea-ice biogeochemistry and ice-associated ecosystems, Nature Climate Change, 10, 983–992, 2020. a
Lund, B., Graber, H. C., Persson, P., Smith, M., Doble, M., Thomson, J., and Wadhams, P.: Arctic sea ice drift measured by shipboard marine radar, Journal of Geophysical Research-Oceans, 123, 4298–4321, 2018. a
Orlando, J. R., Mann, R., and Haykin, S.: Classification of sea-ice images using a dual-polarized radar, IEEE Journal of Oceanic Engineering, 15, 228–237, 1990. a
Pacini, A., Steele, M., and Schreck, M.-B.: National Weather Service Alaska Sea Ice Program: gridded ice concentration maps for the Alaskan Arctic, The Cryosphere, 19, 1391–1411, https://doi.org/10.5194/tc-19-1391-2025, 2025. a, b
Qu, Q., Zhang, Y., Wang, X., Wang, X., and Wang, X.: A False Alarm Controllable Detection Method Based on CNN for Sea Surface Small Targets, IEEE Sensors Journal, 22, 15077–15087, https://doi.org/10.1109/LGRS.2022.3190865, 2022. a
Rogers, M. S., Fox, M., Fleming, A., van Zeeland, L., Wilkinson, J., and Hosking, J. S.: Sea ice detection using concurrent multispectral and synthetic aperture radar imagery, Remote Sensing of Environment, 305, 114073, https://doi.org/10.1016/j.rse.2024.114073, 2024. a
Schanze, J.: SASSIE Arctic Field Campaign Shipboard Salinity Snake Data Fall 2022, PO.DAAC [data set], https://doi.org/10.5067/SASSIE-SNK2, 2024. a
Simonyan, K. and Zisserman, A.: Very deep convolutional networks for large-scale image recognition, arXiv [preprint], arXiv:1409.1556, 2014. a
Srivastava, N., Hinton, G., Krizhevsky, A., Sutskever, I., and Salakhutdinov, R.: Dropout: a simple way to prevent neural networks from overfitting, The Journal of Machine Learning Research, 15, 1929–1958, 2014. a
Stokholm, A., Wulf, T., Kucik, A., Saldo, R., Buus-Hinkler, J., and Hvidegaard, S. M.: AI4SeaIce: Toward Solving Ambiguous SAR Textures in Convolutional Neural Networks for Automatic Sea Ice Concentration Charting, IEEE Transactions on Geoscience and Remote Sensing, 60, 1–13, https://doi.org/10.1109/TGRS.2022.3149323, 2022. a
Stroeve, J. and Notz, D.: Changing state of Arctic sea ice across all seasons, Environmental Research Letters, 13, 103001, https://doi.org/10.1088/1748-9326/aade56, 2018. a
Westbrook, E.: SASSIE Sea-Ice Machine Learning Code Libaray, GitHub [code], https://doi.org/10.5067/SASSIE-SBAN-ML, 2024a.
Westbrook, E.: SASSIE Arctic Field Campaign Ice Class Radar Prediction, PO.DAAC [data set], https://doi.org/10.5067/SASSIE-SBAN-ML, 2024b.
Yosinski, J., Clune, J., Bengio, Y., and Lipson, H.: How transferable are features in deep neural networks?, Advances in Neural Information Processing Systems, 27, https://doi.org/10.48550/arXiv.1411.1792, 2014. a
Short summary
We develop a machine learning methods to detect and classify how much sea ice was present around our research vessel. We used a navigation radar common on many merchant vessels attached to a screen capture device. The captured images were classified using a convolutional neural network and the resulting classification were found to be in good agreement with direct observations and satellite-based products.
We develop a machine learning methods to detect and classify how much sea ice was present around...