the Creative Commons Attribution 4.0 License.
the Creative Commons Attribution 4.0 License.
 | 04 Sep 2020
Muography as a new tool to study the historic earthquakes recorded in ancient burial mounds
Hiroyuki K. M. Tanaka
Kenji Sumiya
László Oláh
Bidirectional muographic measurements were conducted at the Imashirozuka burial mound, Japan. The mound was built in the beginning of the 6th century as a megalithic tomb and later collapsed after a landslide caused by the 1596 Fushimi earthquake, one of the largest earthquakes that has occurred in Japan over the last few centuries. The measurements were conducted in order to find evidence of this past disaster recorded in this historical heritage site. As a result, the vertical low-density regions were found at the top of the mound. These regions were interpreted as large-scale vertical cracks that caused the translational collapse process behind the rotational landslide that was already found in prior trench-survey-based works. These results indicate that there was an intrinsic problem with the stability of the basic foundation of the Imashirozuka mound before the 1596 Fushimi earthquake.
- Article
(3972 KB) - Full-text XML
- BibTeX
- EndNote


By expanding our understanding of past large-scale natural disasters, such as tsunami, earthquakes, and volcanic eruptions, future hazards can be extrapolated and estimated. However, modern scientific records of these natural disasters only, for the most part, cover events from the last couple of centuries which have been recorded by scientific instruments only in limited regions throughout the world. On the other hand, geographical or topographical modifications are often physically recorded in the land surface as a result of such large-scale natural disasters, and correct methodologies can be deciphered to infer unknown details about these events. For example, a large-scale volcanic eruption usually creates a large volume pyroclastic flow which later remains in the geological stratum as a sedimentation of volcanic products. By applying a geological dating technique to these past remnants of the eruptions, we can infer the timing and the magnitude of the past disasters. However, the geological timescale is largely different from that of human history, and the dating precision of these geochronological techniques is limited to an order of 100 years. On the other hand, historical studies often provide records that can be verified with yearly or sometimes daily precision depending on how far back the disaster occurred. Historical information is more straightforward regarding affected sites and the year or date of the disaster. For example, this information can come from literature, which describes destruction by earthquakes or repairs after them, providing valuable evidence for the location and the effects of these earthquakes. Therefore, if we can combine the historian's knowledge with the analysis results of these past disaster remnants, historical records become valuable information which can help to improve the accuracy of these geological dating techniques by developing them into an iteration process. The derivation by scientists and engineers has been utilized as evidence of earthquakes which is later employed by historians to evaluate the dates of the events, and vise versa.
Thus far, a combination of geological techniques and historical data has been applied to historically well-studied objects to fill the gaps in our understanding of the historical natural disaster record including tsunami (Daly et al., 2019; Dey et al. 2014), earthquakes (Korjenkov and Mazor, 2003; Guidoboni et al., 1994; Ambraseys et al., 1983), and volcanic eruptions (Elson and Ort, 2018). The data are exploited mostly by direct excavation of the historic site, and such anatomical techniques (similar in principle to dissecting bodies to directly view organs within) allow us to exploit regional, direct, and detailed information; however, not all historical heritage sites can be accessed and modified in this way. For example, due to cultural restrictions, it is not always possible to conduct a trench survey to excavate the extant historical structures, such as ancient monuments or public buildings, to obtain the geological knowledge about the past disaster remnants. Even when such a style of investigation is approved, the exploitable information is usually localized. Thus, there is a need for a noninvasive technique, such as surface wave exploration, which could be conducted to provide a more overall picture of targeted structures to increase the possibilities of finding more physical evidence of past disasters.
Muography is a technique enabling us to “X-ray” gigantic (hectometer- to kilometer-scale) objects. The surface of the Earth is constantly bombarded with muons, particles that have decayed from cosmic rays arriving at the atmosphere from outside our solar system, and these particles can be utilized as probes for muography. After traversing the targeted object, remnant muons are tracked with a particle detector located at lower elevations than the region of interest inside the target. The result is a pattern of the contrast in the density distribution inside the objects, which is projected onto a 2-dimensional plane. Muography has been applied to the imaging of the internal structure of volcanoes (Tanaka et al., 2007, 2009, 2014; Lesparre et al., 2012; Oláh et al., 2019), cultural heritage sites, including the Giza pyramids (Cheops and Chephren), Egypt, the Prambanan temples, Indonesia, Mount Echia, Italy, and Santa Maria del Fiore, Italy (Alvarez et al., 1970; Hanazato and Tanaka, 2016; Tanaka and Ohshiro, 2016; Morishima et al., 2017; Guardincerri et al., 2018; Cimmino et al. 2019), industrial plants (Tanaka, 2013), and other natural (Tanaka et al., 2011; Oláh et al., 2012; Schouten, 2018) and man-made structures (Mahon et al., 2018). Prior works have focused on searching for undiscovered chambers or the total weight of the heritage site. Instead, in this work, we applied muography to study ancient earthquakes for the first time. We focused on the 1596 Fushimi earthquake, one of the largest earthquakes that has occurred in Japan over the last few centuries, and examined whether the technique of muography can increase the possibilities of finding more physical evidence of past disasters recorded in historical heritage sites.
Imashirozuka, an imperial burial mound in Japan, was chosen as the target of the current study. In Japan, imperial burial mounds have been well studied, and a lot of knowledge has accumulated. For the current study, this type of burial mound has the following advantages for studying past earthquakes (Kamai et al., 2008). (A) The construction method of the imperial mound is well studied by historians, and thus even if the mound has been damaged by past earthquakes, the original structure of the mound can be estimated. (B) The imperial mound was built as a stable object, and thus collapsed areas inside the mound would likely be records of past major earthquakes. (C) The imperial mounds are in general situated in urban areas. Therefore, the collapsed mounds can be used as an index to measure the past seismic disasters in urban areas. (D) In recent human history, various kinds of embankments have been built, but their stability is discussed within the timescale of decades. The collapsed mounds offer us a unique opportunity for geotechnical discussions within a timescale of centuries. (E) The construction method of the mound was already well established when they were built. The mounds built in the same era used the same construction method, and thus it is expected that the mechanical strength is the same. Therefore, the different collapsing conditions among different mounds located near each other could infer different ground conditions or different underwater conditions.
Imashirozuka is a keyhole-shaped imperial burial mound that was built in the beginning of the 6th century in Japan. This burial mound is situated on one of the most active faults in Japan, which is part of the Rokko active fault system. This fault system caused the Great Hanshin earthquake in 1995. In 1596, it is thought that this Rokko active fault system and the next neighboring fault system called the Arima–Takatsuki Tectonic Line were activated at the same time, and one of the largest earthquakes in the last few centuries, the Fushimi earthquake (magnitude 7.25–7.75), occurred (Kamai et al., 2008). The total length of the Imashirozuka mound is 190 m, and the height is 11–12 m. Although this burial mound was originally built as a triple-layered structure, the top layer collapsed after a landslide. The collapse occurred more extensively in the northern part of the mound. The level of damage depends, in general, on the ground motion during an earthquake, which itself depends on its magnitude and distance from the site. This extensive collapse is probably due to the existence of the Ai fault line, a part of the Rokko active fault system, which is located closer to the northern part of the mound. Currently, the Imashirozuka mound consists of a base layer made of high-bulk-density sandy clay (a soil particle density of 2.6 g cm−3 with a porosity of 52 %) and a middle layer made of lower-bulk-density granules (a soil particle density of 2.6–2.8 g cm−3 with a porosity of 76 %) (Kamai et al., 2008). The s-velocity structure observed in the base layer was faster (harder) in comparison to the middle layer (Kamai et al., 2008). For the purpose of the archeological studies, six trenches were excavated and landslide remnants were observed in many of these trenches. The burial mound was originally surrounded by a double moat, but most of this moat was buried in the past, and only a part of it currently remains. The landslide deposits originating from the sediments in the moat were dated, and the results were 1420–1510 CE using a method of C14 dating (Sangawa and Miyazaki, 2001). Since it is known that the Fushimi earthquake occurred in 1596, this burial mound collapse was thought to have been triggered by this earthquake (Sangawa and Miyazaki, 2001).
The top view of the landslides generated by the 1596 Fushimi earthquake is shown in Fig. 1 (Kamai et al., 2008). The results of the trench survey indicated that most of the landslide types were represented by a combination of translational and rotational landslides (Kamai et al., 2008). Movement was inferred with the following sequence: (1) the landslide mass moved near horizontally for a few meters, (2) the transported landslide mass reached the inner moat, (3) the landslide mass slid down and shifted from a translational to a rotational landslide mode. Conversely, it was found that an exceptionally large-scale rotational landslide occurred on the northern side of the round-shaped section of the burial mound. Whether the burial mound deformation related to this rotational slide is connected to the translational landslide continues to be a mystery. The purpose of this work was to examine whether muographically found evidence can be used to address this question.

Figure 1Top view of the Imashirozuka burial mound. Positions A and B indicate the locations of the detectors for the current bidirectional muographic observations. The shaded areas in red and blue indicate the viewing angle of each measurement. The inset shows the geometrical information of the mound. The red and blue solid curves respectively indicate the cross sections of the mound at given elevation angles from positions A and B. The red and blue numbers indicate the elevation angles in milliradian units.
In Fig. 2, the cross-sectional view of the mound sliced along Line F in Fig. 1 is shown. This structure has been modeled based on the trench surveys conducted in 2008 (Kamai et al., 2008). The original surface of the mound (dashed lines in Fig. 2) that was estimated from past archeological studies was lost to the landslide triggered by the 1596 Fushimi earthquake. The red lines indicate the slip surface of the landslide, and, at the top of this surface, the existence of near-vertical cracks was expected. From these trench surveys, the region indicated between the red lines and the solid black lines in this figure was interpreted as the landslide mass, and it displayed a lower density than the other part of the mound and thus, it was expected that muons could penetrate more in this region (in particular at the top of this region).

Figure 2Cross-sectional view of the mound along Line F in Fig. 1. The dashed lines indicate the original surface of the mound, and the red lines indicate the slip surface of the landslide triggered by the 1596 Fushimi earthquake. The authors drew this image based on the work done by Kamai et al. (2008).
Mechanical fractures within rock and soil produce a significant amount of interparticle space, and these fractured zones are detected as lower-density regions in muographic images (Tanaka and Muraoka, 2013; Carbone et al., 2014). Likewise, when a landslide occurs, various processes influence changes in the density distribution inside a burial mound. When a crack is generated in the burial mound, the density is reduced along the crack. If a large-scale collapse occurs, the collapsed landslide mass will contain a lot of inter-particle voids, and the density will be reduced. If the geometrical arrangement is altered between the high-density base layer and lower-density middle layer due to the ground motion such as a fault slip, the overall density distribution will be altered accordingly. All of these variations can be imaged with muography.
Bidirectional muographic measurements were conducted at the Imashirozuka burial mound site so that the resulting images could be used for a 3-dimensional interpretation of the internal structure of the circular section of the mound. In particular, one of the detector positions of the current bidirectional measurements was chosen on the northern side of the round-shaped section (Position B) so that the area where the extensive collapse occurred could be more closely observed. The positions chosen for the current measurement are shown in Fig. 1. The first measurement of the Imashirozuka mound started at Position A on 21 September 2019. The data were taken for 40 d, and subsequently the detector was moved to Position B to collect the data for another period of approximately 1 month.
The detector employed for the current measurement was the MWPC-based (multi-wire proportional chamber) muographic observation system (MMOS) that consists of 6 layers of MWPCs and lead plates with a total thickness of 10 cm. A detailed description of the MMOS can be found elsewhere (Oláh et al., 2018), and thus only the main features are briefly introduced here. In between each of the MWPCs, a 2 cm thick lead plate inside a 4 mm thick stainless steel case is inserted; thus, the total thickness of these radiation shields is equivalent to ∼130 g cm−2. These radiation shields function as an absorber or a scatterer of low-energy background particles that include muons and other electromagnetic particles. The wire distances were designed to be 12 mm in MWPC detectors to provide a fair positional resolution of approx. 4 mm even if lead plates were applied between the MWPCs (Varga et al., 2015, 2016; Oláh et al., 2018). The angular resolution of the 1.5 m long tracking system was approx. 2.7 mrad (Oláh et al., 2018). Only the straight trajectories throughout 6 detectors are employed and recorded as muons. The penetration of muons and electrons were simulated in the Geant4 simulation framework (Oláh et al., 2019). The analysis based on a good track fit was set to 1.5 to suppress the penetration of muons which had energy of <1 GeV down to 10 %. This simulation study showed that the electromagnetic component did not create signals in the MMOS. In the current measurements, the total weight of the MMOS was 600 kg including the case, batteries, and gas bottle. The total power consumption of the detector was ∼30 W, and the six 400 Wh lithium-ion batteries loaded into the case allowed us to continue operations for 80 h. The recurrent charging and replacement of the batteries further extended the time of the continuous operation. The flow rate of the Ar-CO2 gas mixture (Ar: 80, CO2: 20) through the chambers was 1–2 L h−1 to enable the continuous operation for a few months with a standard 40 L type (6000 liters in total) gas bottle. The casters attached to the bottom of the case facilitated the movement of the detector around the mound. Moisture absorbent boxes were equipped inside the box in order to retain the humidity at a constant level around the MWPCs. The size of the active area of the detector was 80 cm×80 cm, and the distance between the uppermost and lowermost stream detectors was 150 cm. The recorded muon tracks were stored, and the number of muon counts was directionally sorted out into a matrix with an angular binning width of 8 mrad × 8 mrad. As is indicated in Fig. 1, the azimuthal viewing angle was ±500 mrad; however, due to the smaller geometrical acceptance for larger angles, only the data within ±400 mrad were used. The detector cost was ∼ USD 60 000, but the operational cost was limited to a few thousand US dollars for the entire operation, including transportation, human resources for battery replacements, and data download.
Since the current target size is on the order of 100 m, the following simplified analytical expression can be applied for the derivation of the relative density variations inside the target volume because the muon's cutoff energy (the minimum energy of the muons that can escape from the target volume) is much lower than the critical energy, 708 GeV in SiO2; the continuous ionization process is the main energy loss process (Tanaka and Ohshiro, 2016):
where I0 and I1 are the remnant muon flux after passing through different densimetric thicknesses of rock X0 and X1. The Greek symbol γ is the zenith-angular-dependent index of the power low of the integrated muon spectrum within 50–200 GeV. In this work, only the “relative muon flux” was used for discussions of the density contrast inside the mound. The obtained matrix has been normalized by the azimuthal distribution of the open-sky flux so that the azimuthal-angle-dependent acceptance has been canceled in the image.
Figure 3 shows the muographic image (Image A) taken at Position A that is indicated in Fig. 1. Corresponding azimuthal angles (−0.344 to 0.456 rad) are shown in Fig. 1. The distance between the detector and the peak of the mound was 70 m, and thus the elevation angle of the mound peak was ∼110 mrad (∼6∘). Since the aspect ratio of the mound, i.e., the ratio of its width to its height (10 : 1) was large, the matrix was not re-binned in the elevation direction but was re-binned in 40 mrad in the azimuthal direction in order to increase the statistics. The total number of muons collected at Position A in the elevation angle region below 180 mrad was 76 682. The number of muons recorded in the bins at an azimuthal angle of 0 ranged from 30 to 500 depending on the elevation angle. The data were normalized to the azimuthal distribution of the open-sky muon tracks that were unaffected by the existence of the mound, which corresponds to the elevation region between 300 and 360 mrad in order to derive the relative muon flux. The bottom right green-colored region in Fig. 3, where less muons were counted than in other regions, corresponds to the direction because in the positive azimuthal angular region at Position A, the rectangular section of the mound provided the additional path length for muons that arrived at lower elevation angles. It was expected that the region around landslide headscarps (arc-shaped lines in Fig. 1) had cracks, and thus the average density along these cracks was significantly lower than the density around them. This density reduction effect is maximized in muographs when the muon's ray path is parallel to these cracks. From Position A, this direction corresponds to the azimuthal angular range between 200 and 300 mrad (see the position indicated by Crack A in Fig. 1).
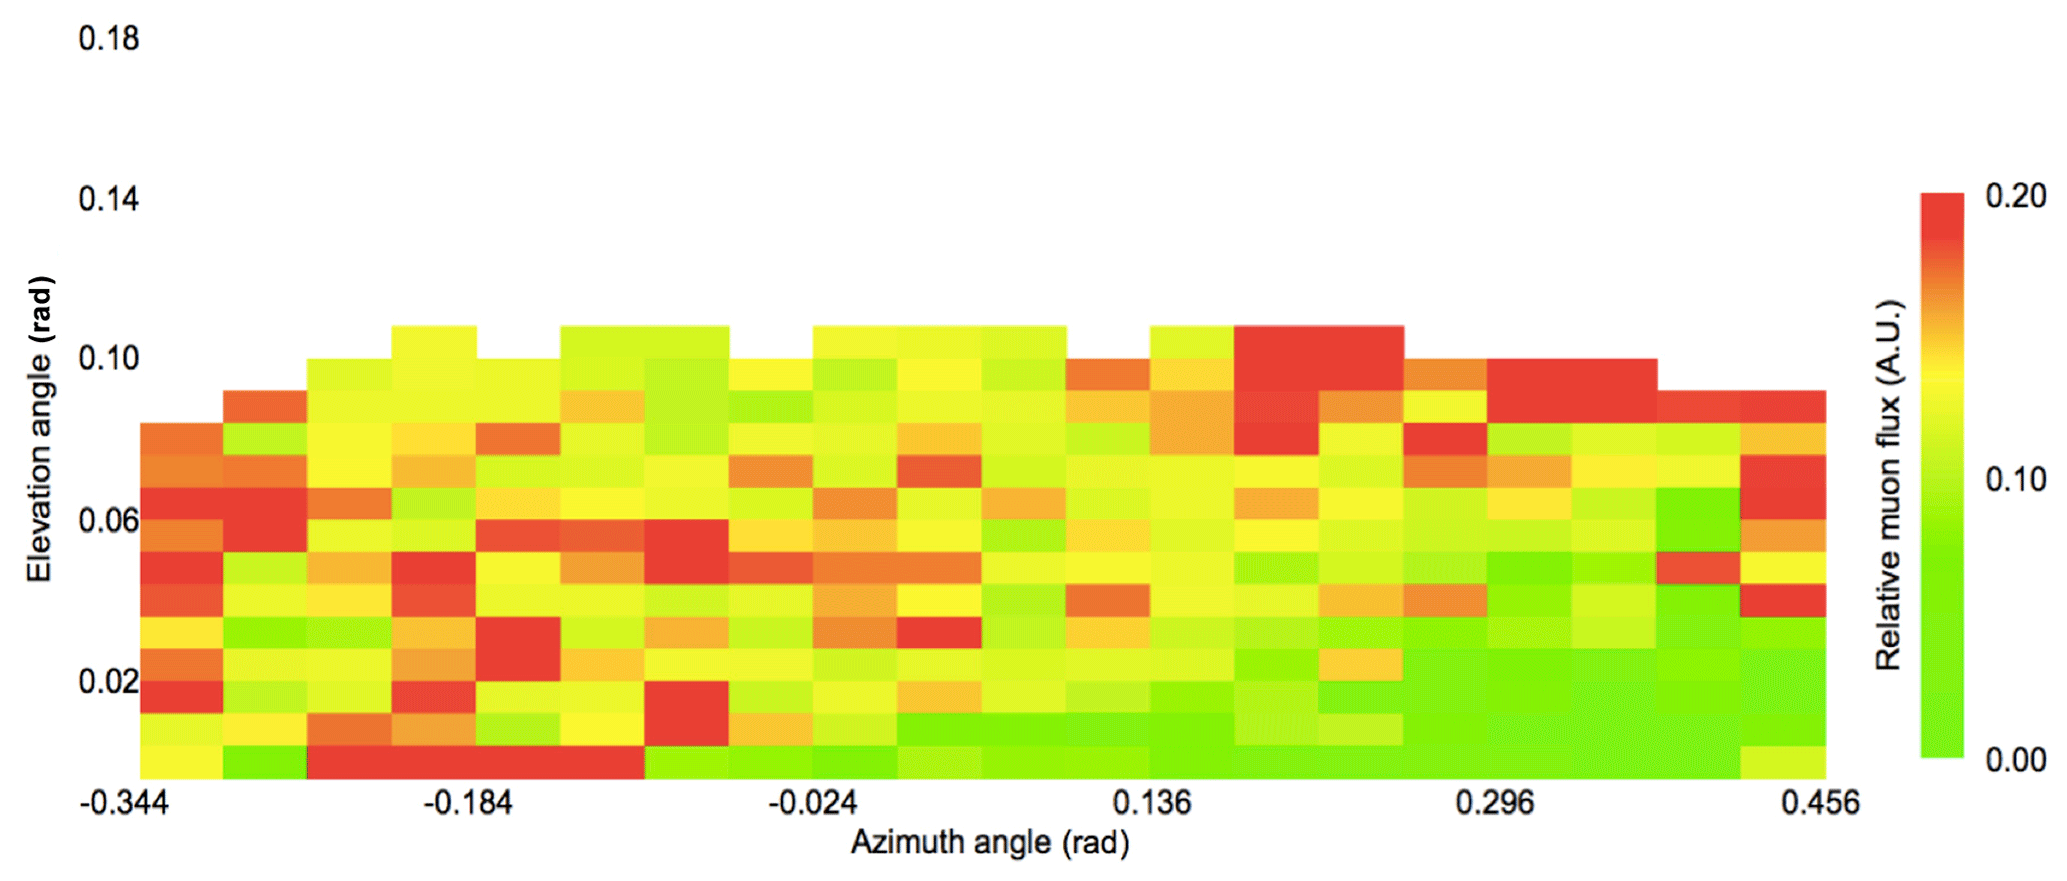
Figure 3Angular distribution of the relative muon flux, as was observed from the measurement at Position A. The horizontal and vertical bin widths are respectively 40 and 8 mrad. The azimuthal distribution of the relative muon flux was normalized to the total number of muons counted at each elevation angle.
Figure 4 shows the azimuthal distribution of the relative muon flux at shallow depths (at elevation angles of 108 mrad, Fig. 4a, and 100 mrad, Fig. 4b). The solid lines are the expected muon flux. These lines were drawn based on the geometrical thickness of the mound along the muon paths (Fig. 1) by assuming the uniform density distribution inside the mound. In these three images, the following three features can be found. (A) Overall, the excessive flux of muons was observed in the positive azimuthal angle region. This indicates that the average density in the positive azimuthal angle region is lower than that in the negative angle region. An overall density variation between them is 10 %–20 %. (B) A strongly excessive muon flux can be found in the azimuthal angle region between 176 and 296 mrad in Fig. 4a and b. The statistical significance was more than 4σ. (C) In Fig. 4a, there is also a low-density region within the azimuthal angle range between 296 and 456 mrad. The position of this low-density region corresponds to that of Trench F (dotted lines in Fig. 1). From (A) and (B), it was inferred that a large almost vertical crack exists in the shallow region; however, its existence was not clear because of the effects of overlapping in the rectangular-shaped background mound deeper than 2 m (see the green-colored area in the bottom right region of Fig. 3). The density variations of this possible crack were 20 %–30 % in comparison to the average density of the other part of the mound. The crack width was 80–120 mrad that is equivalent to 6–8 m when considering the distance between the detector and Crack A of 70 m.
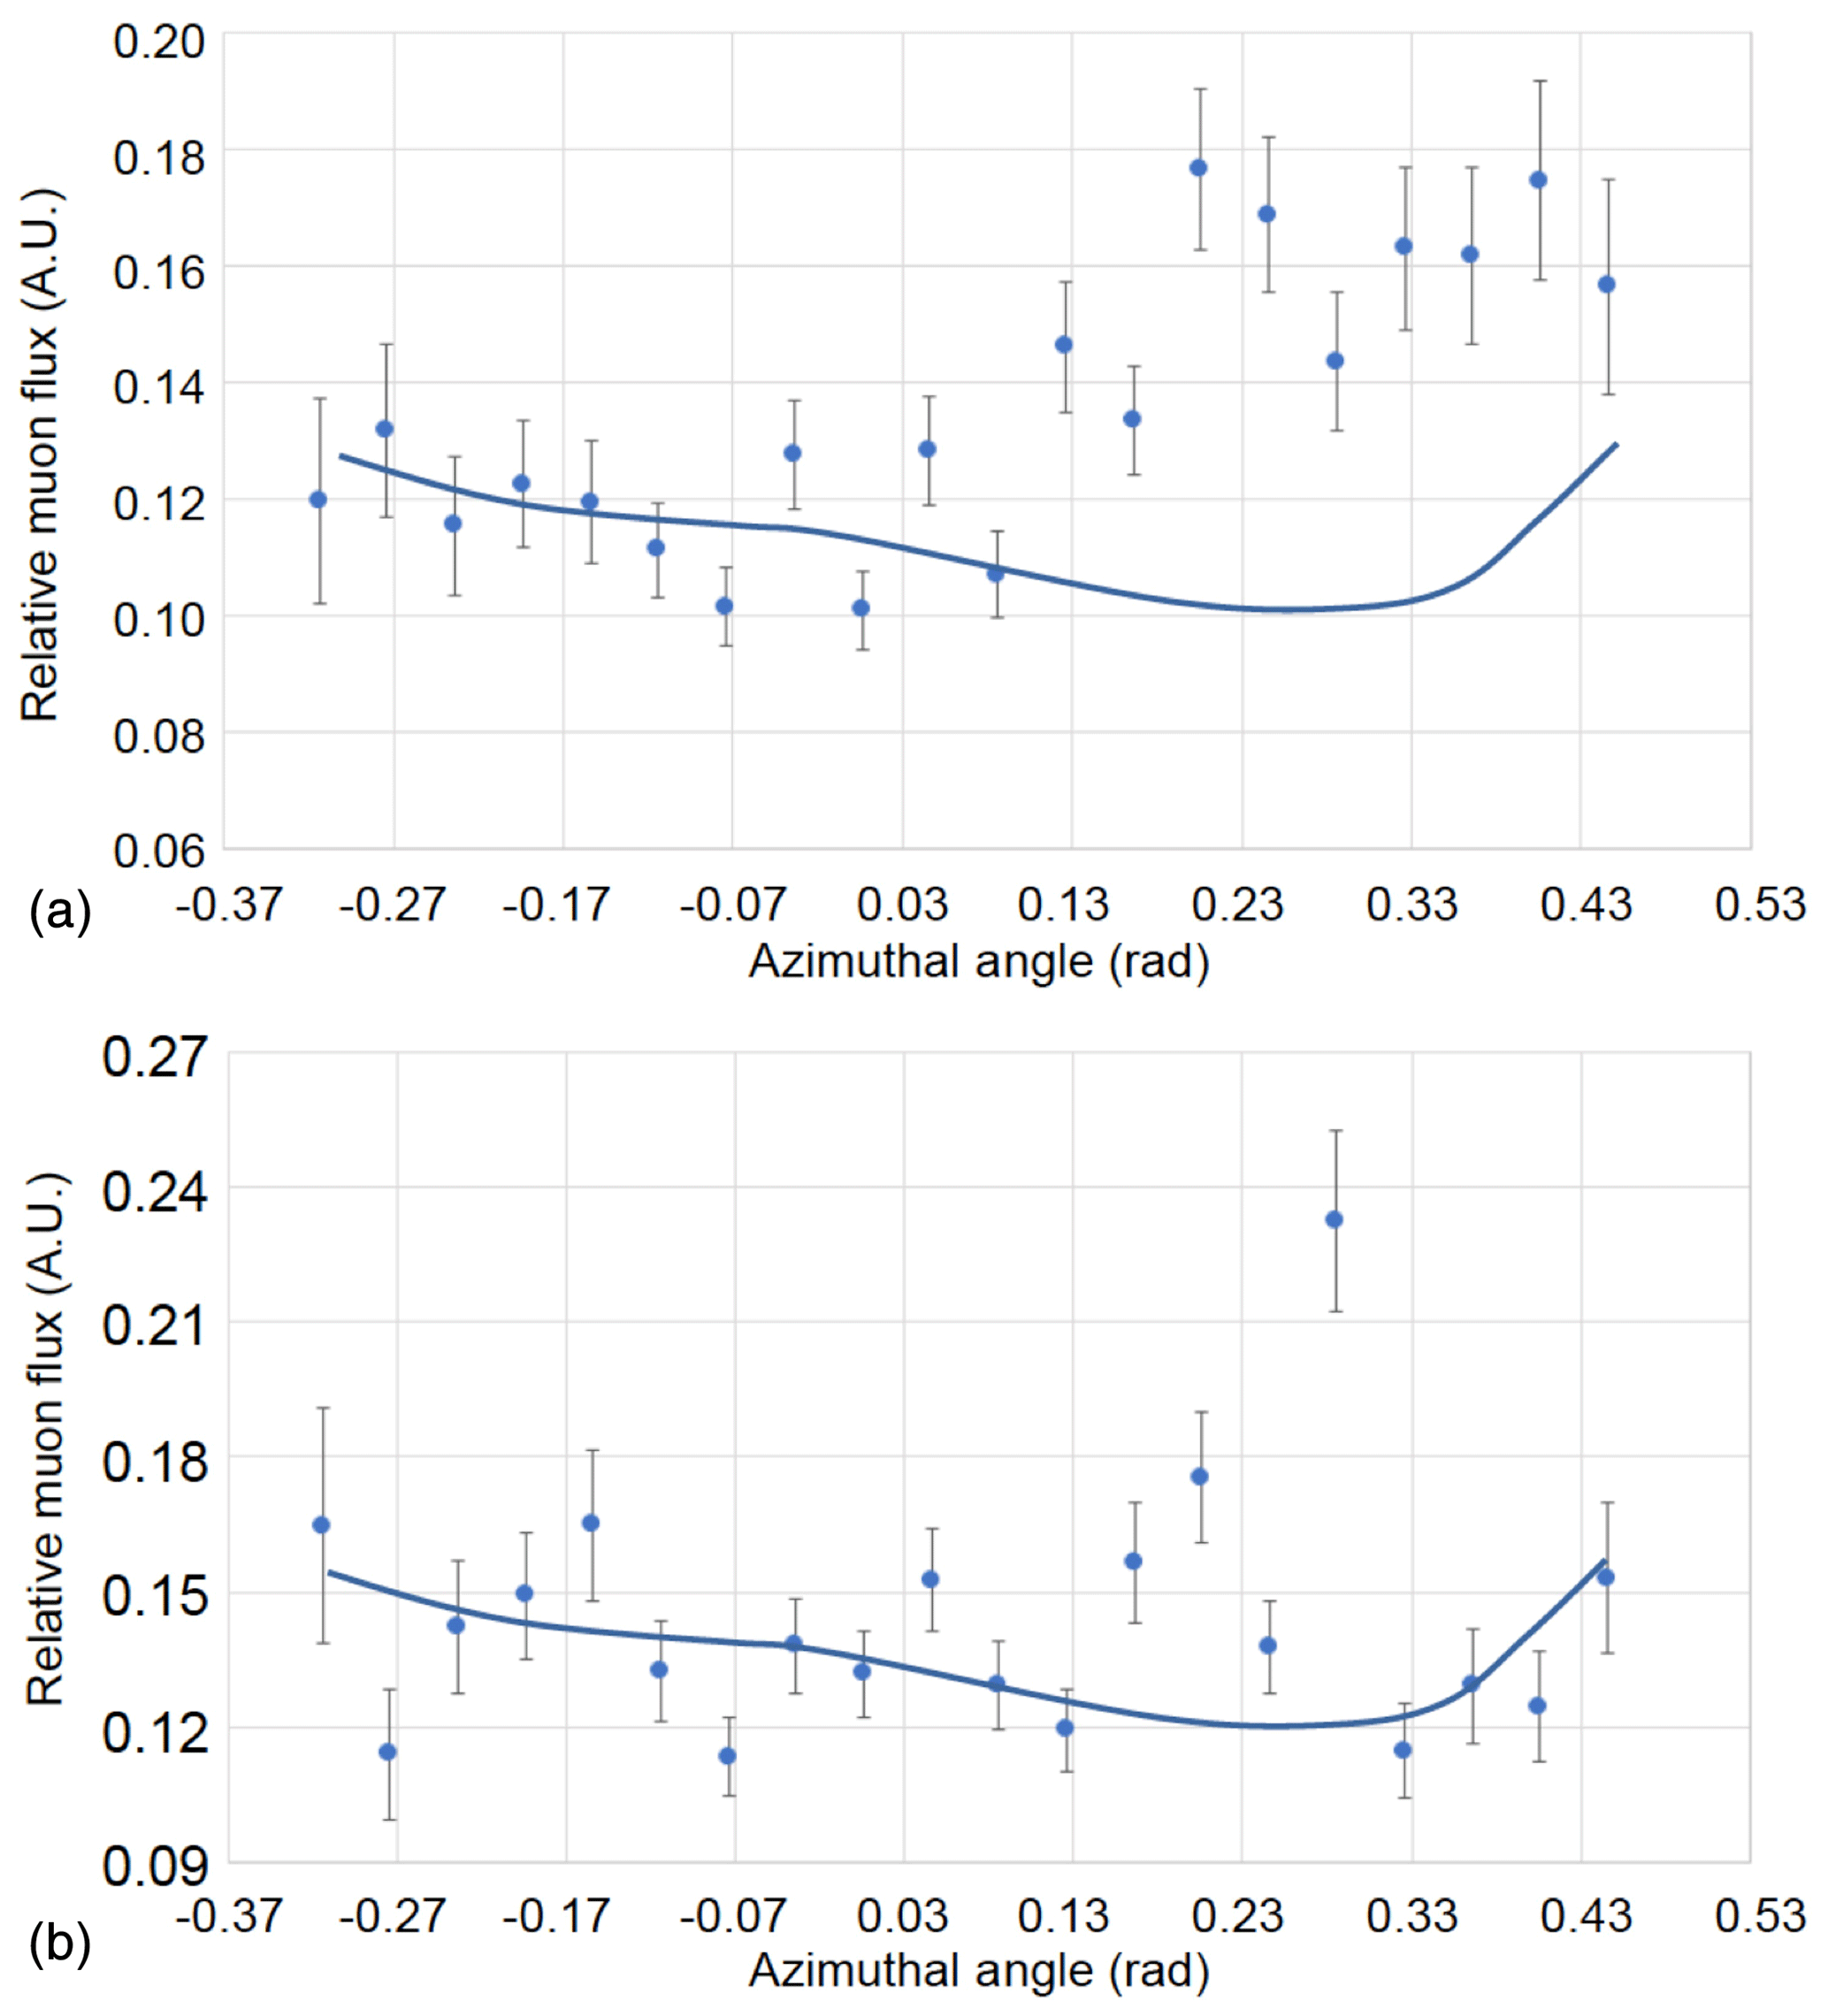
Figure 4Azimuthal distribution of the relative muon flux for elevation angles of (a) 100 and (b) 92 mrad. The solid curves indicate the expected horizontal muon flux variations.
Crack A was not parallel to the muon's ray path at Position B (Fig. 1); however, Crack B was parallel to those in the azimuthal angle range between 300 and 420 mrad. Therefore, it was expected that the similar structure to Crack A would be observed in this angular region. Figure 5 shows the muographic image (Image B) taken at Position B. Since the distance to the mound peak (50 m) was closer at Position B, the spatial resolution at the mound peak was improved for a given angular resolution of the tracker. The total number of muons collected at Position B in the elevation angle region below 180 mrad was 15 214. The number of muons recorded in the bins at an azimuthal angle of 0 ranged from 15 to 100 depending on the elevation angle. The data were normalized to the azimuthal distribution of the muon tracks recorded within the elevation range between 300 and 360 mrad in order to derive the relative muon flux. Corresponding azimuthal angles (−0.376 to 0.424 rad) are shown in Fig. 1.

Figure 5Angular distribution of the relative muon flux observed at Position B. The horizontal and vertical bin widths are respectively 40 and 8 mrad. The azimuthal distribution of the relative muon flux was normalized to the total number of muons counted at each elevation angle.
In Fig. 6, the azimuthal distribution of the relative muon flux for elevation angles of 68–172 mrad are shown. In these images, the excessive muon flux was found within the azimuthal angle range between 264 and 424 mrad. The statistical significance was overall more than 1σ, which was increased to 2–3 σ in the shallower region of the mound. This low-density region was interpreted as the combination of cracks A and B, and it was found that the vertical extent of the crack was much deeper than what could be seen in Image A. The crack width was at least 80–160 mrad which is equivalent to 4–8 m when considering the distance between the detector and Crack B. The reddish region in Fig. 5 that can be seen on the left side of Crack B indicates a low-density collapsed landslide mass with a mixture of the remnant of the past excavation at Trench F.
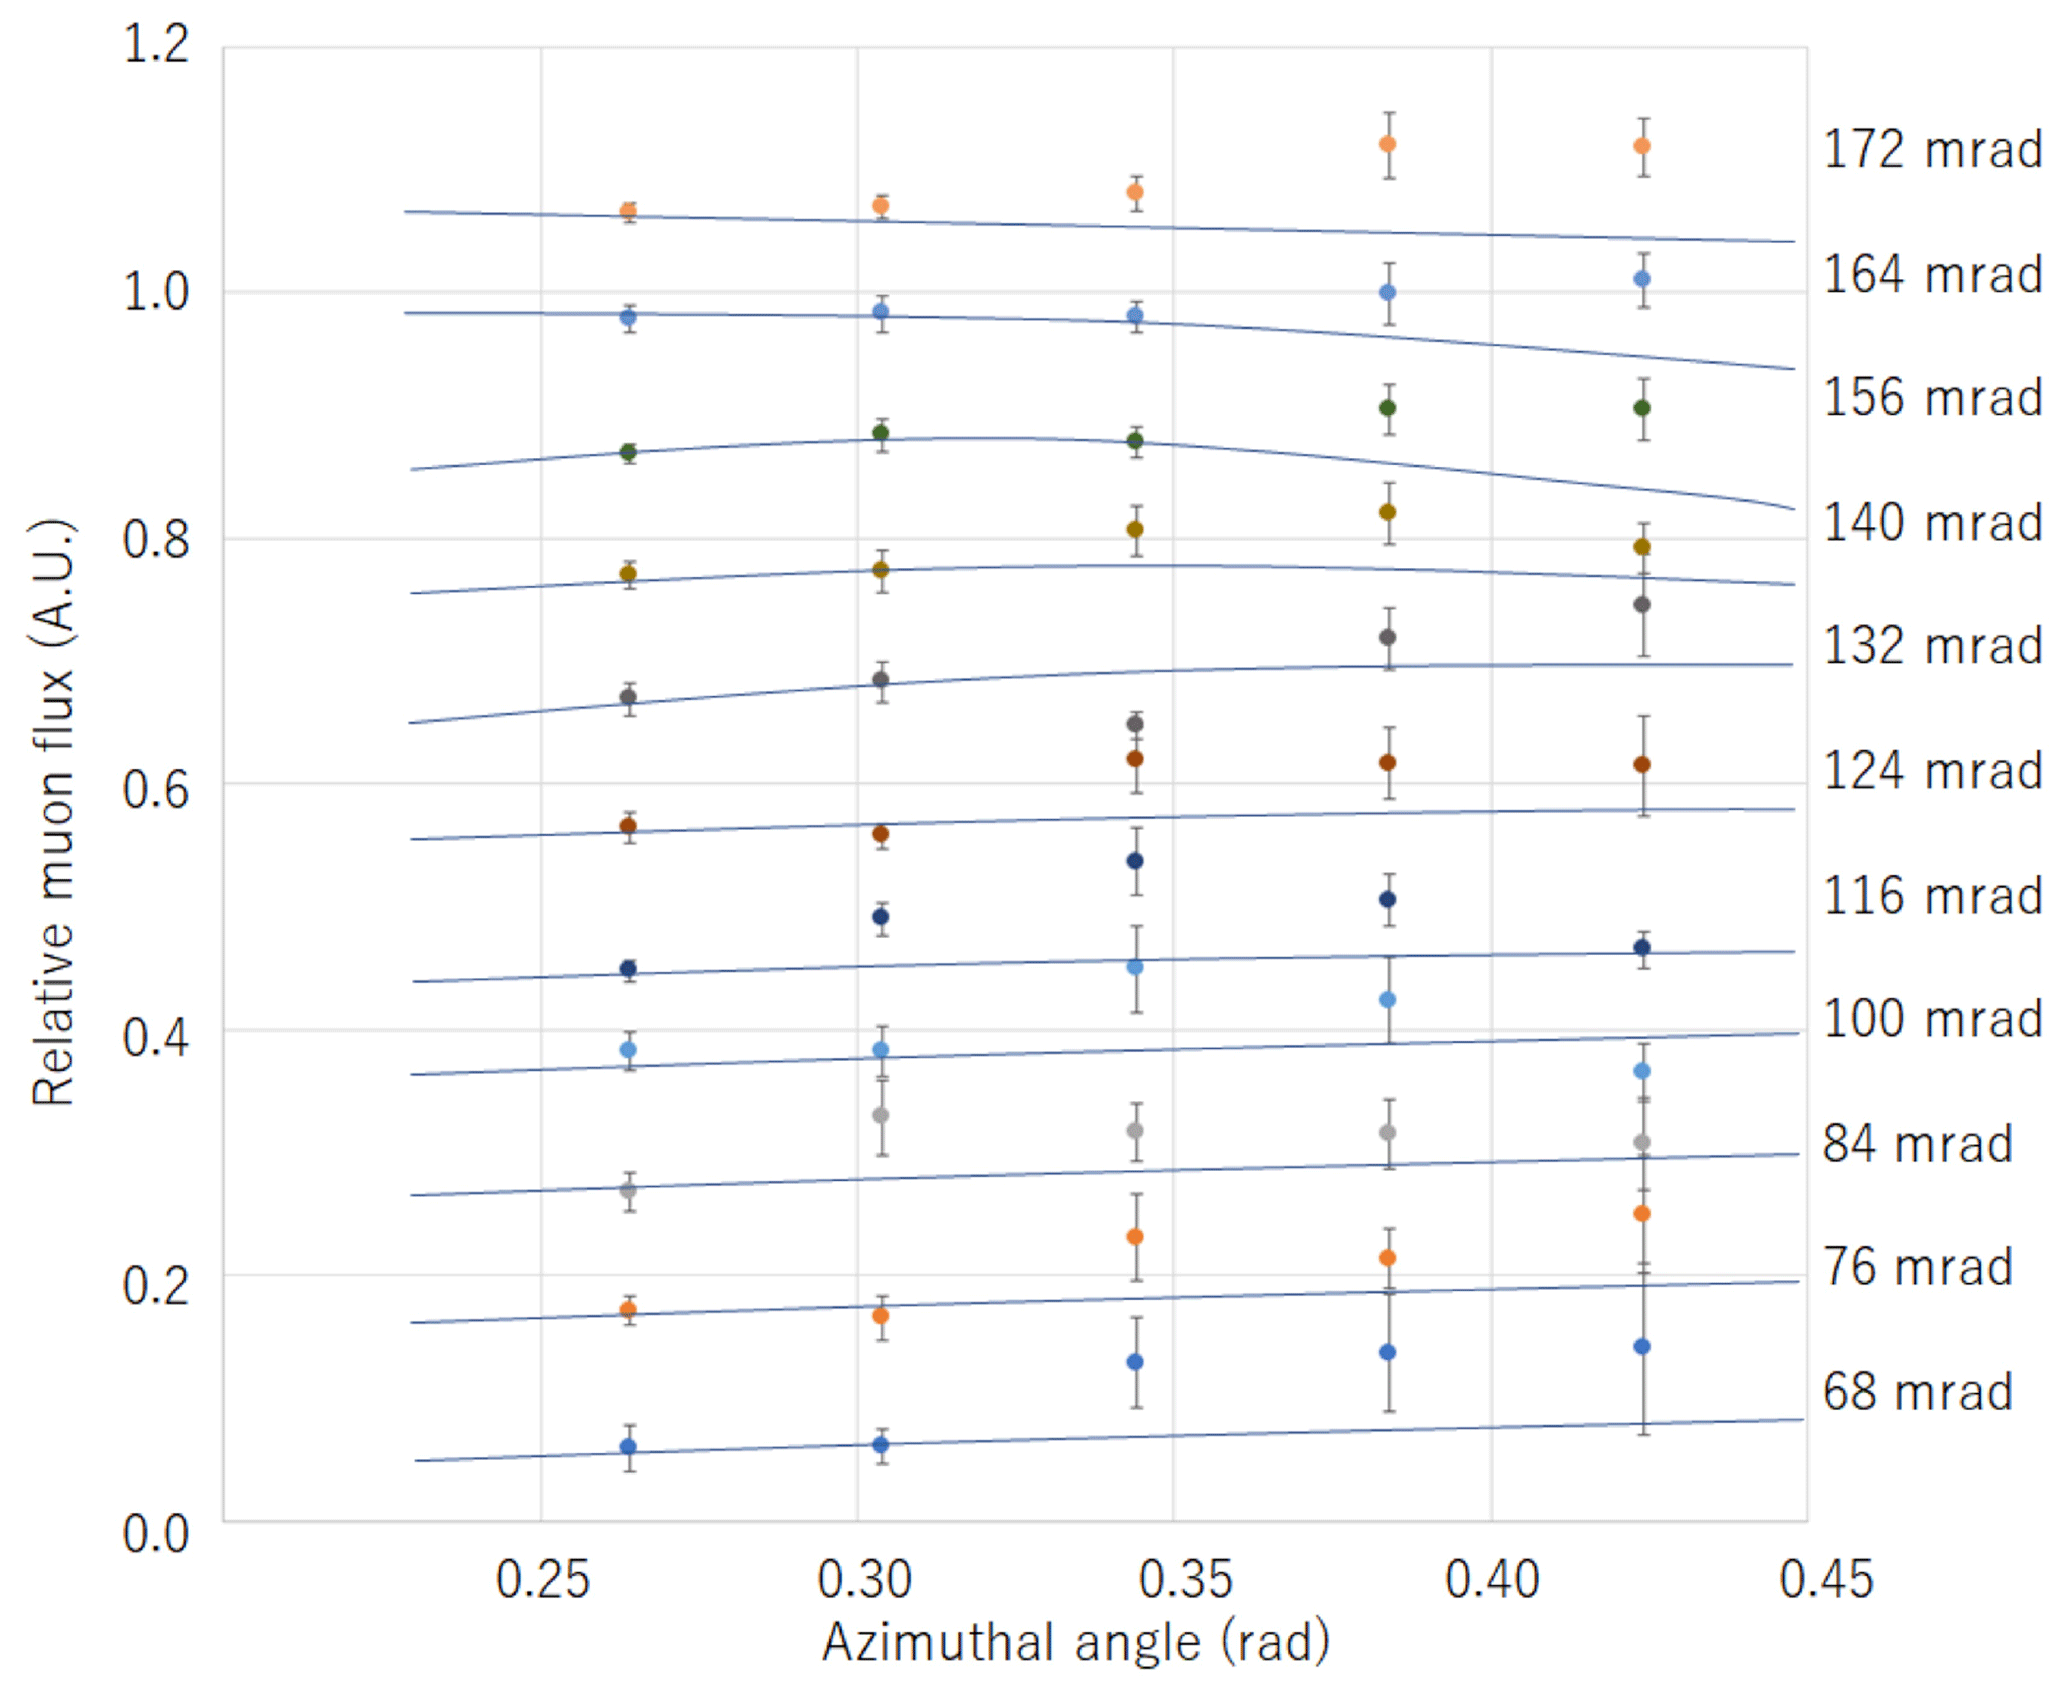
Figure 6Azimuthal distribution of the relative muon flux for various elevation angles. The solid curves indicate the expected horizontal muon flux variations. The relative muon flux values were multiplied for better visualization.
From the bidirectional muographic images taken in the current measurements, the following interpretations were derived.
The vertical low-density regions at the top of the mound in images A and B show that there is a large-scale vertical crack behind the landslide headscarp. The widths of these vertical cracks were both 4–8 m; thus, it is reasonable to assume they are associated with the same scarp.
In conclusion, the following picture is proposed. In prior trench-survey-based works, most of the landslides that deformed this burial mound structure were found to have been caused by a translational process. On the other hand, an exceptionally large-scale rotational slide was found in the northern region of the round-shaped section of the mound, and the stone chamber was deformed and destroyed by this collapse process. However, in the current muographic observations, a large-scale vertical crack was discovered at the top of the round-shaped section, and it was found that the burial mound deformation that connected to the translational collapse process also occurred behind this rotational landslide. These data indicate that there was an intrinsic problem with the stability of the basic foundation of the Imashirozuka mound before the 1596 Fushimi earthquake. Changes in the foundation as a response to shaking from the earthquake may have produced this large-scale burial mound collapse.
The burial mound seems to have a robust structure, more stable against earthquakes than slender buildings like clock towers. However, a number of the ancient burial mounds throughout Japan have collapsed from earthquakes, and many modern buildings are now built upon them. A small fraction has survived since early times; however, they do not always indicate the earthquake-free sites. They represent an example of the final designs of ancient Japanese construction since they have remained even after having experienced a number of destructive earthquakes.
The technique of muography, which can probe seismically damaged ancient mounds, is similar to medical radiography which seeks to find the position, formation, and size of the fractured zone inside the human body. In general, it is difficult to understand the extent of damage, for example, of a patient's external wound without also understanding what is happening inside the body. The outside structure of ancient mounds is similar. The surface of them has usually been naturally or artificially eroded with added vegetation covering the shape during the long period of time that it has existed. However, the inside is more intact. For this reason, the trench survey technique (physically digging a trench into the structure) to understand the “inside” can reveal valuable data. However, similar to the manner in which x-ray photographs are usually applied to a diagnosis before surgery is considered, muography is a more convenient and noninvasive technique to effectively understand the overall inside structure to assess the effect of time and natural disasters on the structure as a whole.
The current proof of concept measurement has attempted to show whether the technique of muography increases the possibilities of finding more physical evidence related to past earthquakes by selecting the Imashirozuka mound as an example. Obviously, the specific earthquake damage of each burial mound is unique and cannot be generalized. Its response depends not only on the material properties of the mound including the mechanical properties of its foundations (strength and rigidity) but also on the ground motion during an earthquake. Surveying and mapping various mounds that are thought to be affected by the earthquake will provide valuable data for us to verify and sort out the factors that caused the damage.
Not only the Imashirozuka mound but also other various burial mounds including the Mishima mound group and the Kobo mound group are concentrated along the Rokko active fault system and its next neighbor, the Arima–Takatsuki Tectonic Line. The current muographic results suggest that a combination of muography and the techniques of trench survey or other conventional geophysical techniques can contribute towards the construction of a more comprehensive understanding of the seismic response and deformation of each burial mound. The characteristics of muography would allow researchers to conduct an investigation of several sites quickly and efficiently to grasp the general trend of the ensemble of these sites. Incorporating the muographic visualization technique with engineering expertise and in conjunction with historical comparanda would utilize a new potential: by acquiring these new, valuable data from these ancient burial mounds in Japan and other similar sites worldwide, we would increase our ability to tackle future challenges of natural disaster preparation.
Data are available upon reasonable request to the corresponding author.
HKMT wrote the text and prepared the figures. KS conducted the measurements and collected data. LO developed the software for analysis. All of the authors reviewed the paper.
The authors declare that they have no conflict of interest.
The authors acknowledge Toshitaka Kamai for valuable discussions about the current muographic observation results. The authors also acknowledge Takefumi Hayashi for his coordination and support with the current measurements, Fumitaka Yoneda and Chikara Inoue for their valuable archeological advice, Ichiro Kanegae for the provision of past excavation research materials of the Imashirozuka mound, and Masao Uchida for his support as the chief administrator of Imashirozuka park. The authors acknowledge two anonymous referees for their valuable suggestions.
This paper was edited by Lev Eppelbaum and reviewed by two anonymous referees.
Alvarez, L. W., Anderson, J. A., El Bedwei, F., Burkhard, J., Fakhry, A., Girgis, A., Goneid, A., Hassan, F., Iverson, D., Lynch, G., Miligy, Z., Moussa, A. H., Sharkawi, A., and Yazolino, L.: Search for hidden chambers in the pyramid, Science, 167, 832–739, https://doi.org/10.1126/science.167.3919.832, 1970.
Ambraseys, N. N., Banda, E., Irving, J., Mallard, D., Melville, C., Morse, T., Muir-Wood, R., Munoz, D., Serva, L., Shilston, D., Surinach, E., and Vogt, J.: Notes on Historical Seismicity, B. Seismol. Soc. Am., 73, 1917–1920, 1983.
Carbone, D., Gibert, D., Marteau, J., Diament, M., Zuccarello, L., and Galichet, E.: An experiment of muon radiography at Mt. Etna (Italy), Geophys. J. Int., 196, 633–643, 2014.
Cimmino, L., Baccani, G., Noli, P., Amato L., Ambrosino, F., Bonechi, L., Bongi, M., Ciulli, V., D'Alessandro, R., D'Errico, M., Gonzi, S., Melon, B., Minin, G., Saracino, G., Scognamiglio, L., Strolin P., and Viliani, L.: 3D Muography for the Search of Hidden Cavities, Sci. Rep.-UK, 9, 2974, https://doi.org/10.1038/s41598-019-39682-5, 2019.
Daly, P., Sieh, K., Yew Seng, T., McKinnon, E. E., Parnell, A. C., Ardiansyah, R., Feener, M., Ismail, N., Nizamuddin, and Majewski, J.: Archaeological evidence that a late 14th-century tsunami devastated the coast of northern Sumatra and redirected history, P. Natl. Acad. Sci. USA, 116, 11679–11686, 2019.
Dey, H., Goodman-Tchernov, B., and Sharvit, J.: Archaeological evidence for the tsunami of January 18, A.D. 749: a chapter in the history of Early Islamic Qaysariyah (Caesarea Maritima), Journal of Roman Archaeology, 27, 357–373, 2014.
Elson, M. and Ort, M. H.: Archaeological Volcanology, in: The Encyclopedia of Archaeological Sciences, edited by: López Varela, S. L., John Wiley & Sons, Inc., New Jersey, 1–5, 2018.
Guardincerri, E., Bacon, J. D., Barros, N., Blasi, C., Bonechi, L., Chen, A., D'Alessandro, R., Durham, J. M., Fine, M., Mauger, C., Mayers, G., Morris, C., Newcomer, F. M., Okasinski, J., Pizzico, T., Plaud-Ramos, K., Poulson, D. C., Reilly, M. B., Roberts, A., Saeid, T., Vaccaro, V., and Van Berg, R.: Imaging the dome of Santa Maria del Fiore using cosmic rays, Philos. T. R. Soc. A, 377, 20180136, https://doi.org/10.1098/rsta.2018.0136, 2018.
Guidoboni, E., Comastri, A., and Traina, G.: Catalogue of Ancient Earthquakes in the Mediterranean Area up to the 10th Century, Istituto Nazionale di Geofisica, Rome, 1994.
Hanazato, T. and Tanaka, H. K. M.: Inspection of the internal structure of the UNESCO-World Heritage with cosmic rays, Isotope News, 741, 60–64, 2016.
Kamai, T., Sangawa, A., and Shuzui, H.: Landslides on Ancient Burial Mounds Induced by the 1596 Keicho-Fushimi Earthquake, J. Japan Soc. Eng. Geol., 48, 285–298, 2008.
Korjenkov, A. M. and Mazor, E.: Archaeoseismology in Mamshit, Southern Israel, cracking a millennia-old code of earthquake preserved in ancient ruins, Archäologischer Anzeiger, 2, 51–82, 2003.
Lesparre, N., Gibert, D., Marteau, J., Komorowski, J.-C., Nicollin, F., and Coutant, O.: Density muon radiography of La Soufriere of Guadeloupe volcano: comparison with geological, electrical resistivity and gravity data, Geophys. J. Int., 190, 1008–1019, 2012.
Mahon, D., Clarkson, A., Gardner, S., Ireland, D., Jebali, R., Kaiser, R., Ryan, M., Shearer, C., and Yang, G.: First-of-a-kind muography for nuclear waste characterization, Philos. T. R. Soc. A, 377, 20180048, https://doi.org/10.1098/rsta.2018.0048, 2018.
Morishima, K., Kuno, M., Nishio, A., Kitagawa, N., Manabe, Y., Moto, M., Takasaki, F., Fujii, H., Satoh, K., Kodama, H., Hayashi, K., Odaka, S., Procureur, S., Attié, D., Bouteille, S., Calvet, D., Filosa, C., Magnier, P., Mandjavidze, I., Riallot, M., Marini, B., Gable, P., Date, Y., Sugiura, M., Elshayeb, Y., Elnady, T., Ezzy, M., Guerriero, E., Steiger, V., Serikoff, N., Mouret, J. B., Charlès, B., Helal, H., and Tayoubi, M.: Discovery of a big void in Khufu's Pyramid by observation of cosmic-ray muons, Nature, 552, 386–390, https://doi.org/10.1038/nature24647, 2017.
Oláh, L., Barnaföldi, G. G., Hamar, G., Melegh, H. G., Surányi, G., and Varga, D.: CCC-based muon telescope for examination of natural caves, Geosci. Instrum. Method. Data Syst., 1, 229–234, https://doi.org/10.5194/gi-1-229-2012, 2012.
Oláh, L., Tanaka, H. K. M., Ohminato, T., and Varga, D.: High-definition and low-noise muography of the Sakurajima volcano with gaseous tracking detectors, Sci. Rep.-UK, 8, 3207, https://doi.org/10.1038/s41598-018-21423-9, 2018.
Oláh, L., Tanaka, H. K. M., Ohminato, T., Hamar, G., and Varga, D.: Plug Formation Imaged Beneath the Active Craters of Sakurajima Volcano With Muography, Geophys. Res. Lett., GL084784, https://doi.org/10.1029/2019GL084784, 2019.
Sangawa, A. and Miyazaki, Y.: Traces of Landslides found in Imashirosuka mound, 18th meeting of Japan Society for Scientific Studies on Cultural Property, Japan Society for Scientific Studies on Cultural Property, Tokyo, 24–25, 2001.
Schouten, D.: Muon geotomography: selected case studies, Philos. T. R. Soc. A, 377, 20180061, https://doi.org/10.1098/rsta.2018.0061, 2018.
Tanaka, H. K. M.: Development of stroboscopic muography, Geosci. Instrum. Method. Data Syst., 2, 41–45, https://doi.org/10.5194/gi-2-41-2013, 2013.
Tanaka, H. K. M. and Ohshiro, M.: Muographic data analysis method for medium-sized rock overburden inspections, Geosci. Instrum. Method. Data Syst., 5, 427–435, https://doi.org/10.5194/gi-5-427-2016, 2016.
Tanaka, H. K. M. and Muraoka, H.: Interpreting muon radiographic data in a fault zone: possible application to geothermal reservoir detection and monitoring, Geosci. Instrum. Method. Data Syst., 2, 145–150, https://doi.org/10.5194/gi-2-145-2013, 2013.
Tanaka, H. K. M., Nakano, T., Takahashi, S., Yoshida, J., Takeo, M., Oikawa, J., Ohminato, T., Aoki, Y., Koyama, E., Tsuji, H., and Niwa, K.: High resolution imaging in the inhomogeneous crust with cosmic-ray muon radiography: The density structure below the volcanic crater floor of Mt. Asama, Japan, Earth Planet. Sc. Lett., 263, 104–113, 2007.
Tanaka, H. K. M., Uchida, T., Tanaka, M., Takeo M., Oikawa J., Ohminato T., Aoki Y., Koyama, E., and Tsuji, H.: Detecting a mass change inside a volcano by cosmic-ray muon radiography (muography): First results from measurements at Asama volcano, Japan, Geophys. Res. Lett., 36, GL039448, https://doi.org/10.1029/2009GL039448, 2009.
Tanaka, H. K. M., Miyajima, H., Kusagaya, T., Taketa, A., Uchida, T., and Tanaka, M.: Cosmic muon imaging of hidden seismic fault zones: Raineater permeation into the mechanical fracture zone in Itoigawa-Shizuoka Tectonic Line, Japan, Earth Planet. Sc. Lett., 306, 156–162, 2011.
Tanaka, H. K. M., Kusagaya, T., and Shinohara, H.: Radiographic visualization of magma dynamics in an erupting volcano, Nat. Commun., 10, 3381, https://doi.org/10.1038/ncomms4381, 2014.
Varga, D., Gál, Z., Hamar, G., Molnár, J. S., Oláh, E., and Pázmándi, P.: Cosmic muon detector using proportional chambers, Eur. J. Phys., 36, 065006, https://doi.org/10.1088/0143-0807/36/6/065006, 2015.
Varga, D., Nyitrai, G., Hamar, G., and Oláh, L.: High Efficiency Gaseous Tracking Detector for Cosmic Muon Radiography, Adv. High Energy Phys., 2016, 1962317, https://doi.org/10.1155/2016/1962317, 2016.