the Creative Commons Attribution 4.0 License.
the Creative Commons Attribution 4.0 License.
 | 24 Feb 2021
Evaluation of climate change impact on extreme temperature variability in the Blue Nile Basin, Ethiopia
Mostafa Abdel-Hameed Mohamed
Mohamed El-Sayed El-Mahdy
Climate change raises important issues concerning hydrological engineering. The impact of climate change on important river basins should be investigated rigorously. Extreme temperature variability has a direct impact on the hydrological cycle, especially the evaporation component. In this paper, spatial and temporal patterns of changes in extreme temperatures were investigated using 10 meteorological stations' data for the period 1950–2018 in the Blue Nile Basin. Long-term trends in the Blue Nile Basin annual and monthly temperatures were investigated. The statistical significance of the trend was calculated by applying the Mann–Kendall (MK) test. The analysis of data was performed using the coefficient of variance and anomaly index. The results showed that the annual maximum and minimum temperatures were increasing significantly with a magnitude of 0.037 and 0.025 ∘C per decade respectively in the period from 1950 to 2018. The result of the Mann–Kendall analysis test revealed a marked increase in the mean maximum and minimum temperature trends over time during the study period (the minimum temperature rate is more evident than the maximum). The long-term anomalies of mean annual minimum temperature revealed the interannual variability while the trend after 1977 was higher than the long-term average, which is proof of the warming trend's existence during the last two decades of the 20th century.
- Article
(2702 KB) - Full-text XML
- BibTeX
- EndNote


Climate change is perceived to affect the whole world and there has been, and still is, a growing concern about its trend and consequences. The Blue Nile River Basin (BNRB) is affected by climate change in temperature increases and rainfall decreases. The BNRB is the most important river basin in the Nile Basin and has a great development potential. Many development projects are under construction currently in the BNRB without thorough, detailed climate change analysis. These projects are essential for irrigation schemes, hydropower generation, and national economic growth. As a trans-boundary river basin, it attracts the attention of some neighboring countries. For sound management and planning of water resources, it is important to predict the climate change and variability of crucial metrological factors such as temperature and precipitation (Tamiru, 2011). Temperature and precipitation directly affect the hydrology of the basin (Sobhy et al., 2019). Since temperature affects both evaporation and evapotranspiration, and precipitation is the source of runoff, so the study of these factors is very important in water resources management. Here it is decided to explore the impact of climate change on temperature, and in a forthcoming paper the impact on rainfall will be studied.
The assessment of extreme temperature variability due to climate change will help to better manage the development projects in the BNRB. Global and regional rises in air temperature, together with their collateral rises in water temperature, result in negative alterations in water quality, even with the same precipitation (Collins et al., 2019). Lake Tana, located upstream of the BNRB, is one of the greatest natural lakes of Africa (El-Mahdy, 2014). Generally, the lakes are sensitive to a wide range of climate change consequences. Even a slight change in climate can result in huge changes in lake salinity and levels (El-Mahdy et al., 2018; Mengistu et al., 2014; Tamiru, 2011).
The symptoms of global warming can be noticed almost everywhere around the world. Heat waves and droughts are striking a lot of places, so that precipitation, humidity, and temperatures are rarely normal. These phenomena among others are considered as evidence of the presence of climate variability (Sohoulande Djebou and Singh, 2016). The analysis of data from ground stations and satellites showed that the mean surface temperature of the world has increased by about 0.6 ∘C over the 20th century (Lindzen and Giannitsis, 2002; Tapley et al., 2019). The warmest years in this century have all occurred since 1980 (Janssens et al., 2020). The warmest recorded year was 1998 (Mann et al., 1999). These alterations appear to be out of the natural variability range (Houghton, 1996; Mann et al., 1999; Sippel et al., 2020; Watson et al., 1996). A lot of research studied the impact of temperature rise on runoff and it was found, with high confidence, that the runoff increased in winter and decreased in summer and spring. In addition higher peak flows have occurred in these basins (Anache et al., 2018; Bergström et al., 2001; Chen et al., 2012; Yan et al., 2020).
The results of the simulation studies conducted by Gleick (2000) in the USA showed that small alterations in rainfall and temperature may lead to huge impacts on runoff. It was found that if temperature increases without a change in rainfall, the runoff will decrease. A 10 % decrease in rainfall together with a temperature rise of 2 ∘C will reduce the runoff by 13 %–40 %. On the other hand, if rainfall increases by 10 % and the temperature rises by 4 ∘C, the rainfall increase will balance evaporation losses and no alteration on runoff is predicted. Although these findings are not comprehensive, they reveal the possible size and uncertainty encircling the hydrologic and climatic implications of greenhouse warming (El-Mahdy, 2011).
The temperature is a continuous variable in both space and time. The monthly mean temperature (MMT) and the maximum and minimum monthly temperature (MT) always follow a normal distribution (Jones and Hulme, 1996).
The predicted climate change may affect most of the Ethiopian districts. Drought remains Ethiopia's major hazard, with floods following in another place (Conway and Schipper, 2011). Recently, it is clear that both drought and flood have increased in both frequency and size (Margaret, 2003).
A recent study by Gebrehiwot and van der Veen (2013) indicated that climate change in Ethiopia could lead to extreme temperatures and rainfall events, leading to more heavy and extended droughts and floods. Changes in sea surface temperature and El Niño–Southern Oscillation (ENSO) periods in the Indian and Atlantic oceans have effects on the timing and amount of rainfall in Ethiopia (Fekadu, 2015; Shanko and Camberlin, 1998). Asfaw et al. (2018) found that the drought events of Ethiopia are the result of both ENSO, sea surface temperature (SST) variations in the Indian and Atlantic, and anthropogenic activities. Kiros et al. (2016) found that the result of different studies of temperature trend analyses in northern Ethiopia is a mixture of nonsignificant negative and positive trends. Mengistu et al. (2014) noted that the trend of temperature was significantly increasing in Ethiopia. Although the concept of global warming and its impact on the BNRB has been studied before, the analysis of long enough time series over multiple weather stations with the appropriate statistical tools was not found. Investigation of extreme temperature variability in the BNRB is not well presented in the literature. Making use of the statistical tools to explore climate change impacts on Ethiopia is not performed in thorough studies. The availability of the long time series data (1950–2018) invokes the research on the climate change impact on the basin. The main objective of this research is to detect any climate change through the evaluation of extreme temperature variability using trend analysis of long temperature time series in the BNRB, Ethiopia.
2.1 Description of the study area
The BNRB starts at the outlet of Lake Tana in Ethiopia and flows downstream to Khartoum in Sudan where it meets the White Nile. The basin surface area is 324 530 km2. The terrain of the BNRB is generally hilly and contains valleys, highlands, and a lot of rock peaks. The Lake Tana Basin is located in northwestern Ethiopia at latitude 10.95 to 12.7∘ N, and longitude 36.89 to 38.2∘ E with a drainage area of about 15 000 km2 (Sintayehu, 2015). Lake Tana, upstream of the BNRB, is the greatest natural lake in Ethiopia and the third greatest natural lake in the Nile Basin, which is located in this basin. The main rivers that feed Lake Tana are Gilgil Abai, Gomera, Rip, and Magek (El-Mahdy, 2017). These short-length rivers constitute about 93 % of the outflow of the lake (Kebede et al., 2006). The climate of Ethiopia is composed of three distinct seasons named Belg, Kiremt, and Bega (Haile, 2005). Belg is a short rain season which covers the period from February to May. The rainfall in the Belg season results from the humid southeastern and eastern winds that originate from the Indian Ocean. Kiremt is a long rainy season that starts in June and normally ends in September. The Kiremt season's rainfall results substantially from the convergence of low-pressure winds and the Intertropical Convergence Zone (ITCZ). Finally, the dry season, called the Bega, extends from October to January (Tabari et al., 2015). The highest temperature recorded in the BNRB is located in the northwestern part at Dangla station. In some parts of Dabus, Dinder, Rihad, and Beles, the maximum recorded temperature reaches 38 ∘C and the minimum approaches 15 ∘C. On the other hand, the lower temperature is recorded in the eastern and central parts of the basin in the Ethiopian highlands. In these areas, the maximum temperature is 20 ∘C and the minimum is −1 ∘C (Tamiru, 2011).
2.2 Types of data
Temperature data, which are used in the variability and time series trend analysis, have been obtained from the Ethiopia Meteorological Authority. A total of 10 stations covering different parts of the BNRB have been chosen to study the variability of their data sets (see Table 1 and Fig. 1). The climate data consist of maximum and minimum MT data with many years of records for 10 stations that have been collected in the BNRB. The length of the record of the data made available for this analysis varies from 62 to 68 years of MMT, maximum, and minimum MT. Most analyses have focused on changes in mean values due to the lack of the availability of high-quality daily data required for monitoring, detecting, and attributing climate extremes changes (Jones, 1999). The study period (1950–2018) was chosen according to the availability of the recorded data for all stations. Although there are almost no missing data for the studied period, the missing data of a specific month were calculated using the average of the previous year's data of the same month and subsequent years' monthly data (for missed monthly data), but the analysis excluded annual missing data.
Table 1Selected weather stations of the Blue Nile Basin and their general information. Source: Ethiopia Meteorological Authority.
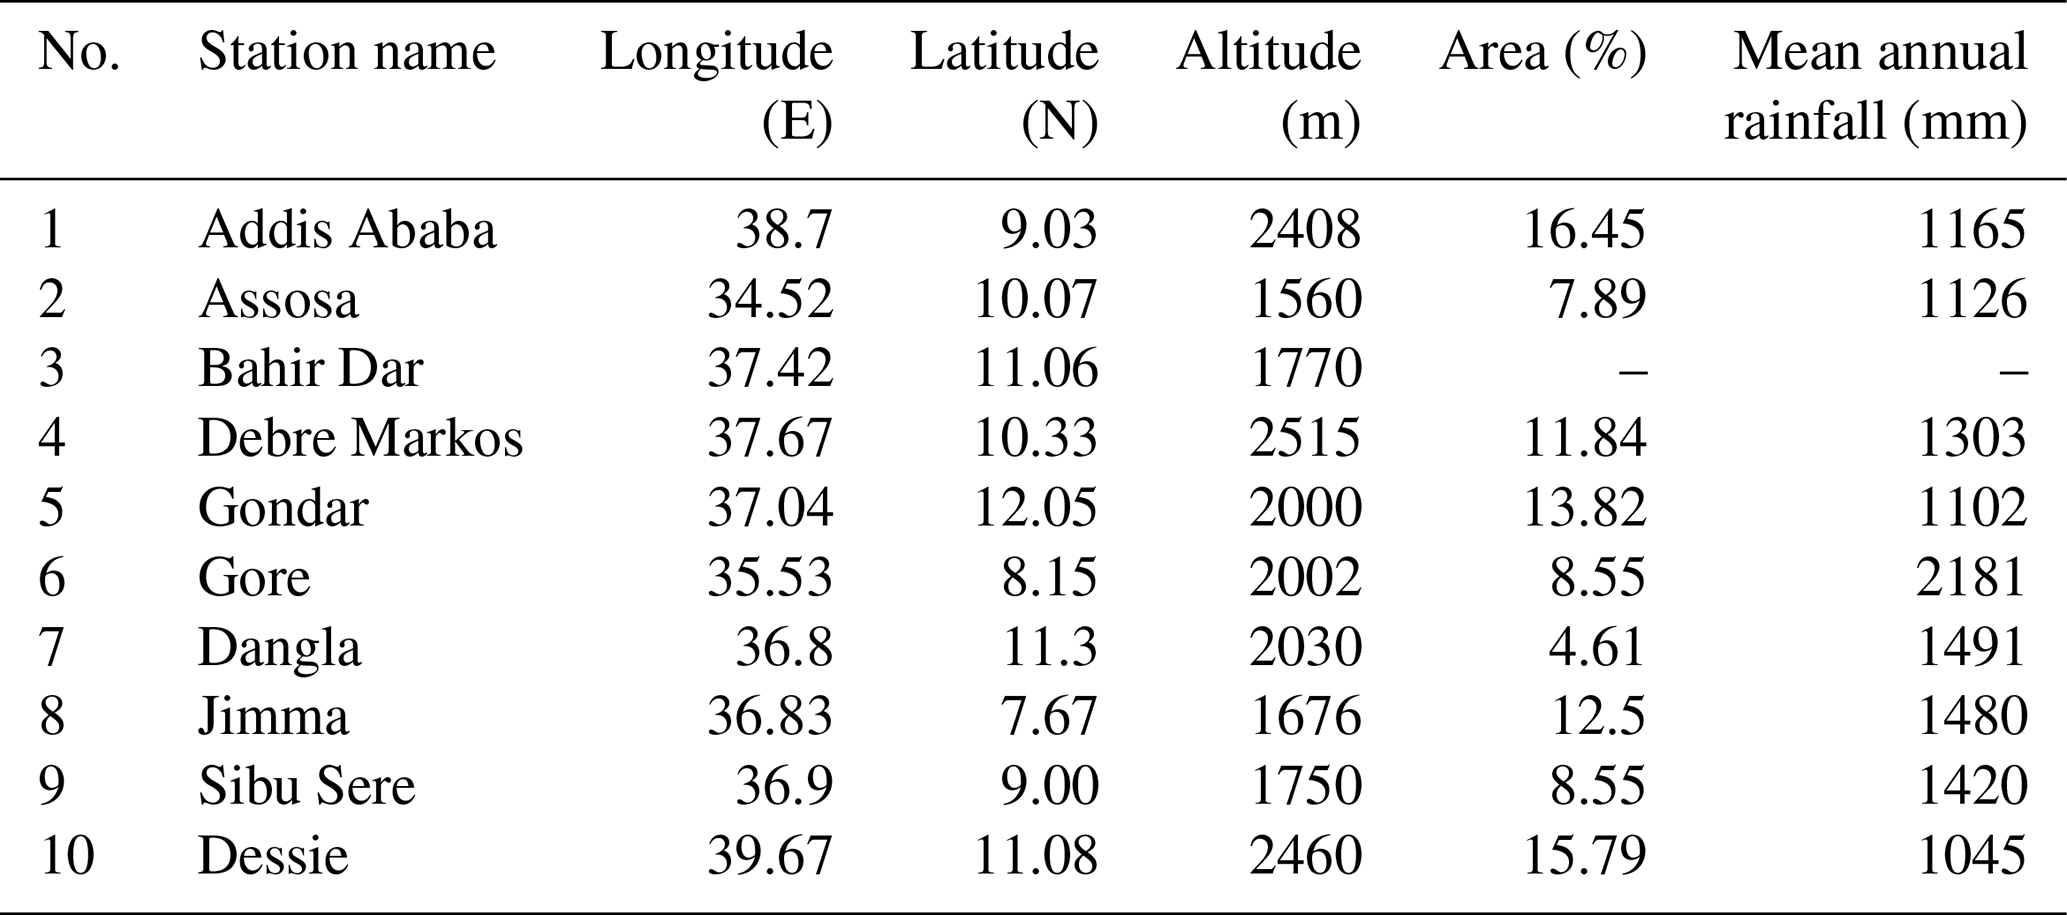
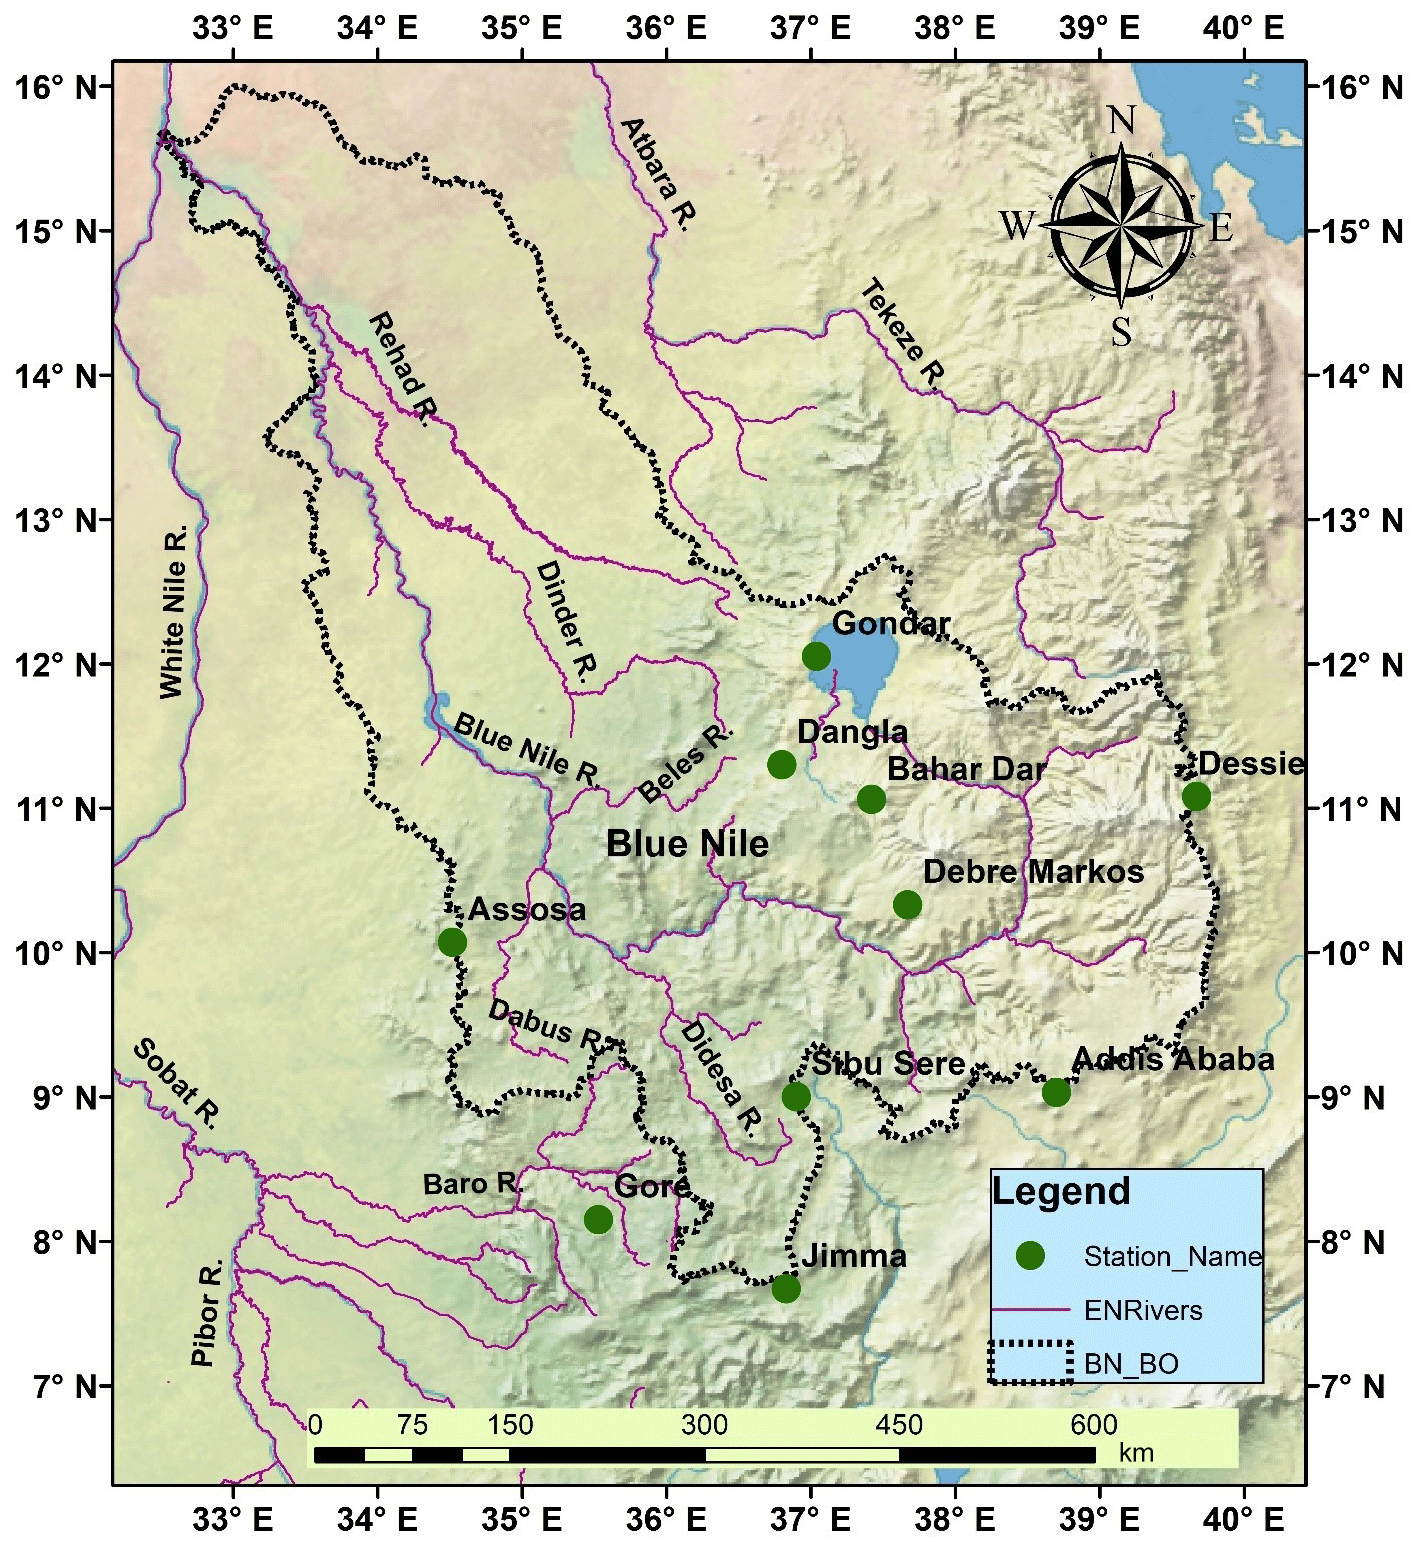
Figure 1Location map of the Blue Nile Basin and the selected meteorology.
2.3 Methods
The analysis of temperature was performed using many techniques. These techniques are generally categorized as variability and trend analysis. The variability analysis encompasses the coefficient of variation (CV), moving average, and percentage departure from the mean (Gebrechorkos et al., 2020). On the other hand, trend analysis is applied to consistent data only utilizing parametric and nonparametric tests (Onyutha, 2017; Partal and Kahya, 2006). The homogeneity and normality of the variance over the data series are usually affected by missing data and outliers in parametric tests. The nonparametric test is used to overcome the problem of non-normally distributed, missing data, and outliers. This problem is repeatedly found in the hydrological and meteorological time series. For these reasons, the Mann–Kendall (MK) test is commonly utilized to discover the trends of meteorological and hydrological variables (Degefu and Bewket, 2014; Kiros et al., 2016; Seleshi and Camberlin, 2006; Tabari and Tavakoli, 2016). MK is a nonparametric test that assesses the trend of any time series without assuming that the trend is nonlinear or linear. MK test is commonly used to discover the monotonic (increasing or decreasing) trends in the time series of hydrological, meteorological, and environmental data (Yue et al., 2002). Totaro et al. (2020) conducted trend detection using a numerical investigation. The study focused on exploring the power of nonparametric and parametric tests in annual maximum time series data. The results showed paramount practical implications. It was proved that the dependence of test power on the parameters of parent distribution might significantly affect the results of both nonparametric and parametric tests. This result is comprising the widely applied MK test. The results of Monte Carlo simulations showed that the power of the MK test has a direct relationship with the data variance in addition to the trend magnitude (Wang et al., 2020). Németh et al. (2020) analyzed the characteristics of the test of the likelihood ratio for extremes by simulations and introduced a simulation-based method to overcome the issue of scarce data. A novel return level calculation procedure is proposed. The probability or power of discovering trends relies on the development of efficient multivariate statistical and deterministic procedures for forecasting future trends in processes of the earth system (Vogel et al., 2013). In the current paper, the variability of temperature was calculated employing the SD and CV tests. Moreover, MK and Sen's slope estimator test were employed to reveal the temperature trend. SPSS v22 software was used to perform the data analysis. CV is computed to evaluate the rainfall variability. The higher the CV value, the larger the variability of rainfall. CV is calculated using the following equation:
where CV is the coefficient of variation, σ is the standard deviation, and μ is the mean (Isioma et al., 2018). The test of homogeneity was conducted employing Pettitt's test (Pettitt, 1979) to ensure that the data are homogenous and no misleading data are present. In this test, every value in the time series is compared with all posterior values in the data series. If the value of the subsequent period is greater than the value of the preceding period, the statistic (S) is raised by one and vice versa. The summation of all increments and decrements reveals the total value of the statistic (S). MK test was employed to explore the presence of monotonic trends in the time series, and the statistical significance of the trend. Since outliers cannot be averted in any time series, the MK test is advantageous because it is based on the (+ or −) signs instead of the random variable values. Therefore, the MK test is less influenced by the outliers (Asfaw et al., 2018). The MK test statistic “S” is calculated based on Mann (1945), McLeod (2005), and Yue et al. (2002), using the following formula:
The trend test is applied on a time series xi which is ranked as i=1, 2…n−1 and xj, which is ranked as . Each of the data points xi is taken as a reference point to be compared with the other data points xj so that
where xi and xj are the data values in the years i and j respectively (j>i).
It was reported that, if the number of observations is greater than 10 (n≥10), the statistic (S) is usually normally distributed around the mean (McLeod, 2005). So, the variance could be formulated as follows:
where n is the number of observation and ti are the ties of the sample time series. The test statistic Zc is as follows:
If Zc follows a normal distribution, its positive or negative value refers to an upward or downward trend for the studied period respectively. The trend magnitude could be calculated by slope estimator methods (Sen, 1968). Here, the slope (Ti) of all data pairs is calculated according to Sen (1968). In general, Ti for any time series x could be predicted from the following:
where xj and xk are considered as data values at time j and k (j>i) correspondingly. The median of these N values of Ti is represented as Sen's estimator of the slope which is calculated as if N is an odd number, and it is computed as if N is an even number. A positive value of Ti indicates an upward or increasing trend and a negative value of Ti gives a downward or decreasing trend in the time series.
The MK test and Sen's slope estimator were applied to the time series 1950–2018 for the 10 meteorological stations in the BNRB. The annual and seasonal means of the climatic parameters, particularly minimum and maximum MMT, were analyzed. Table 2 shows the MK test statistics and p values at 5 %, 1 %, and 0.1 % levels of significance. In the MK test, parameters such as Kendall's tau, S, and Z statistics were computed to determine the positive or negative trend of climate parameters in the long time series studied.
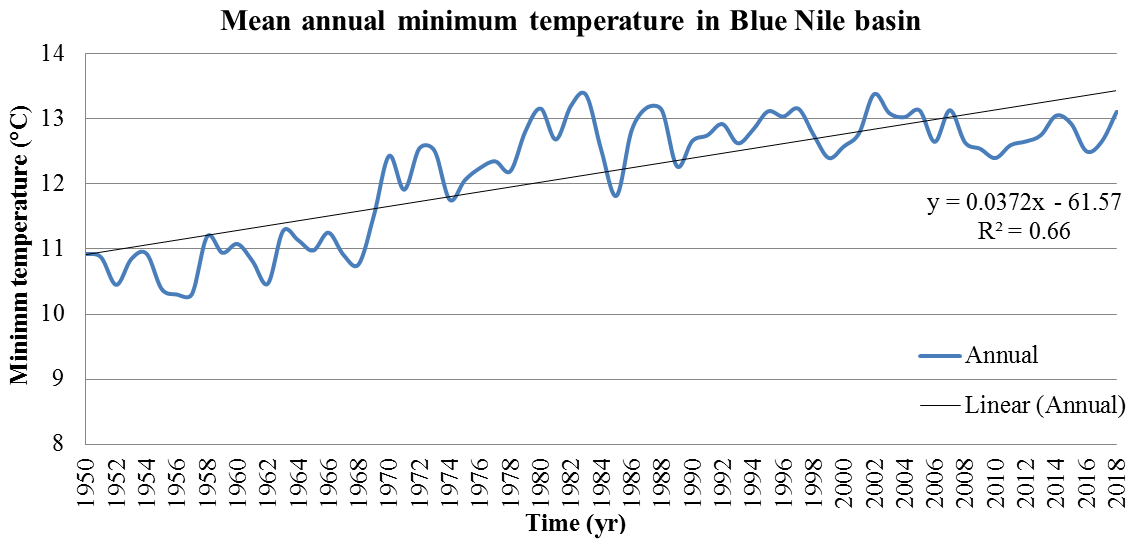
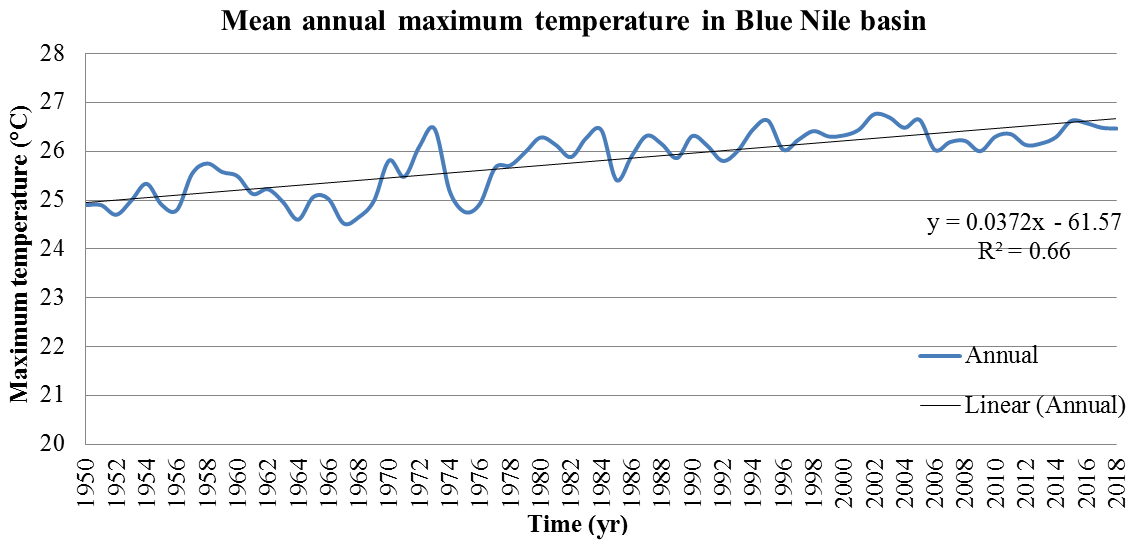
Table 2Basic statistics and MK trend analysis of minimum temperature in the Blue Nile Basin (1950–2018).
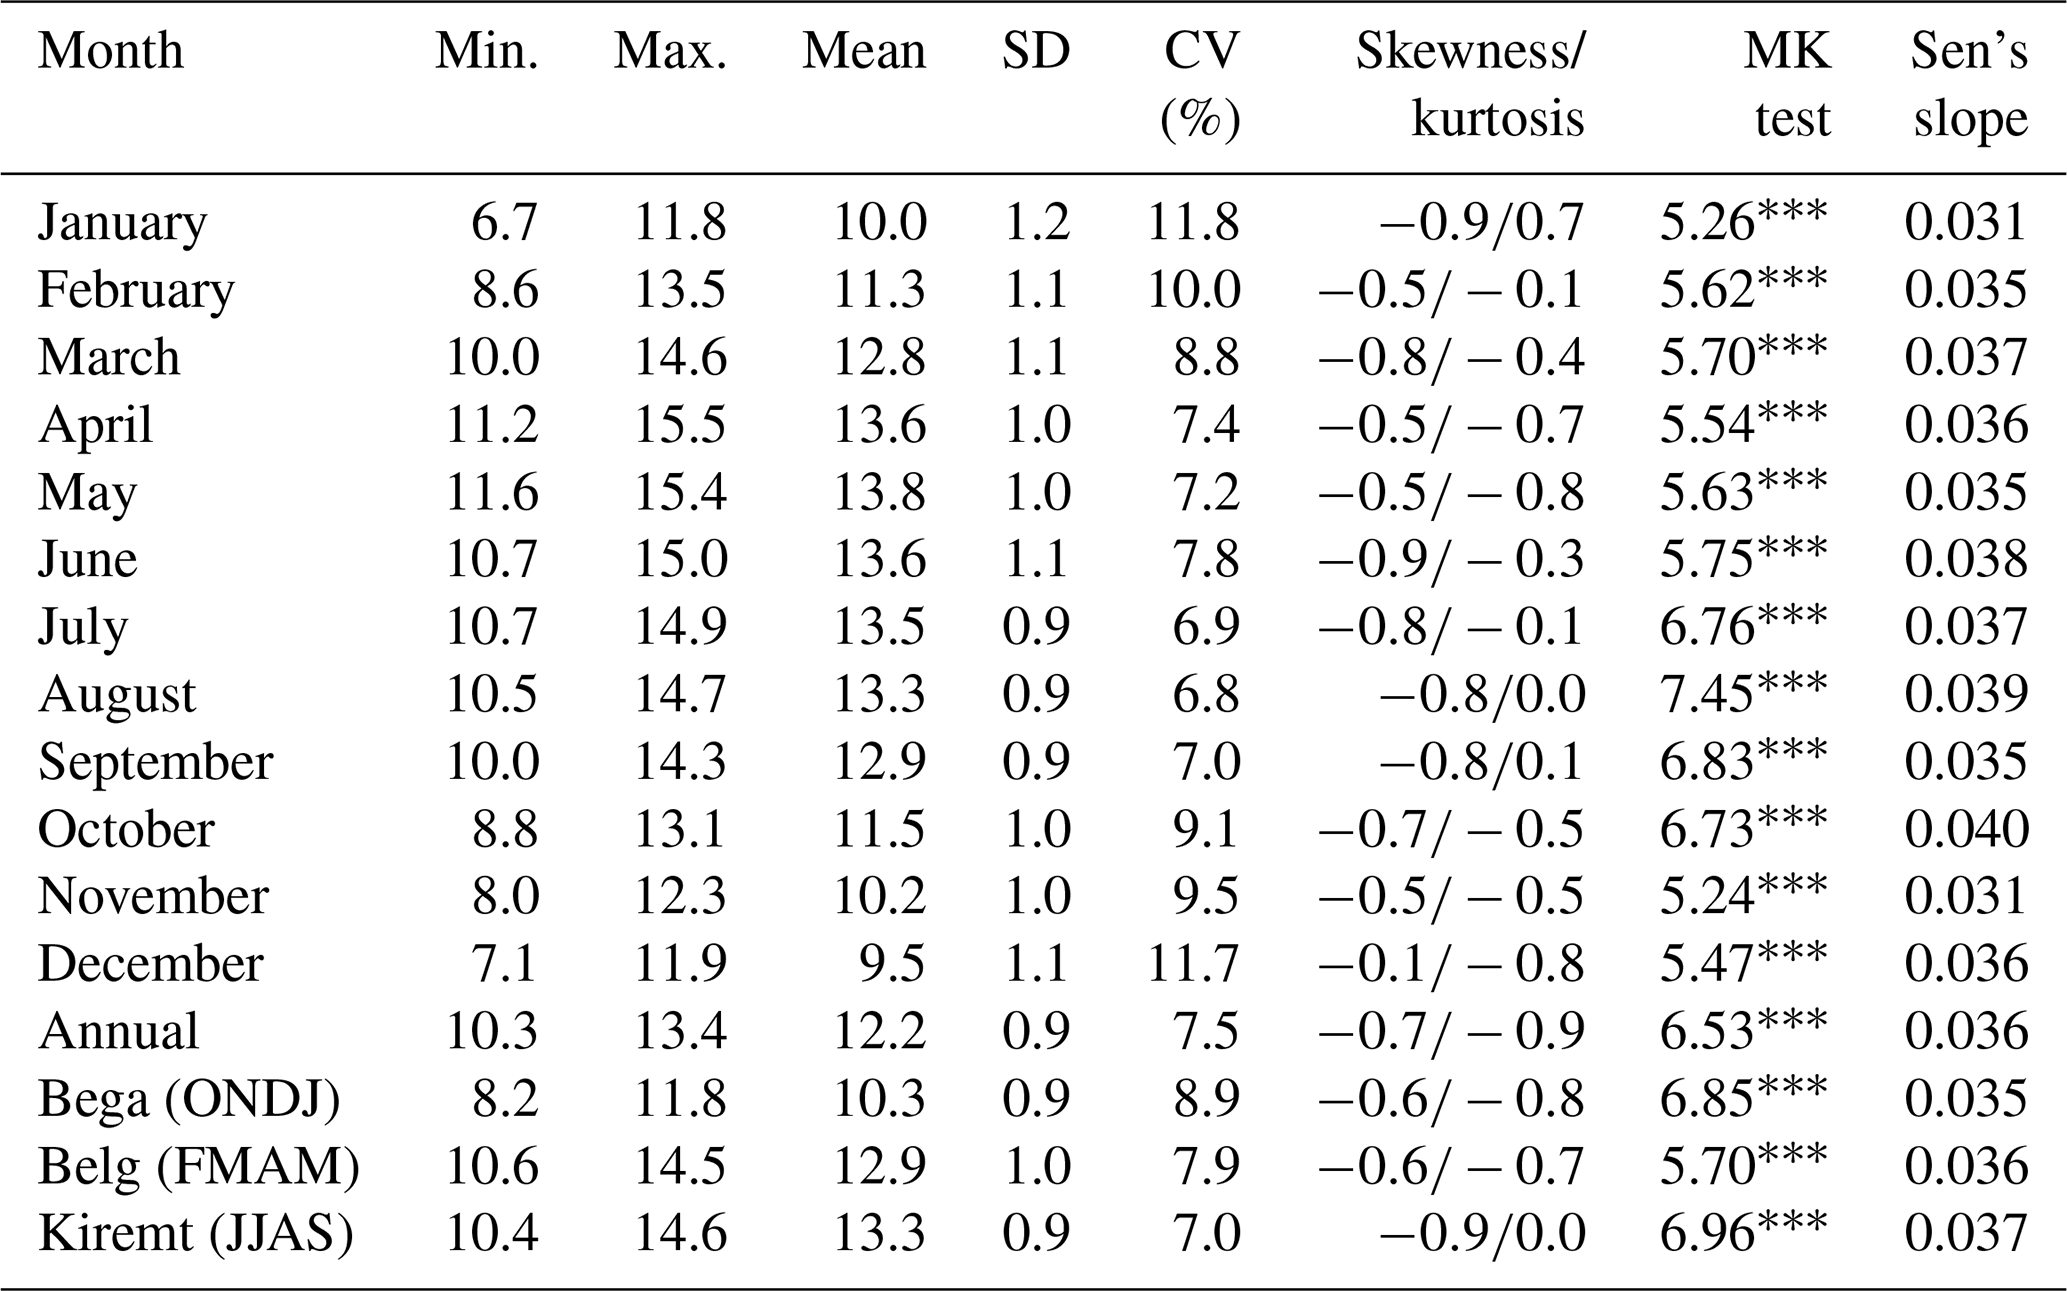
* Significant at 5 % significance level. Significant at 1 % significance level. Significant at 0.1 % significance level.
Table 3Linear regression result (annual minimum temperature and Bega, Belg, and Kiremt seasons) (1950–2018).
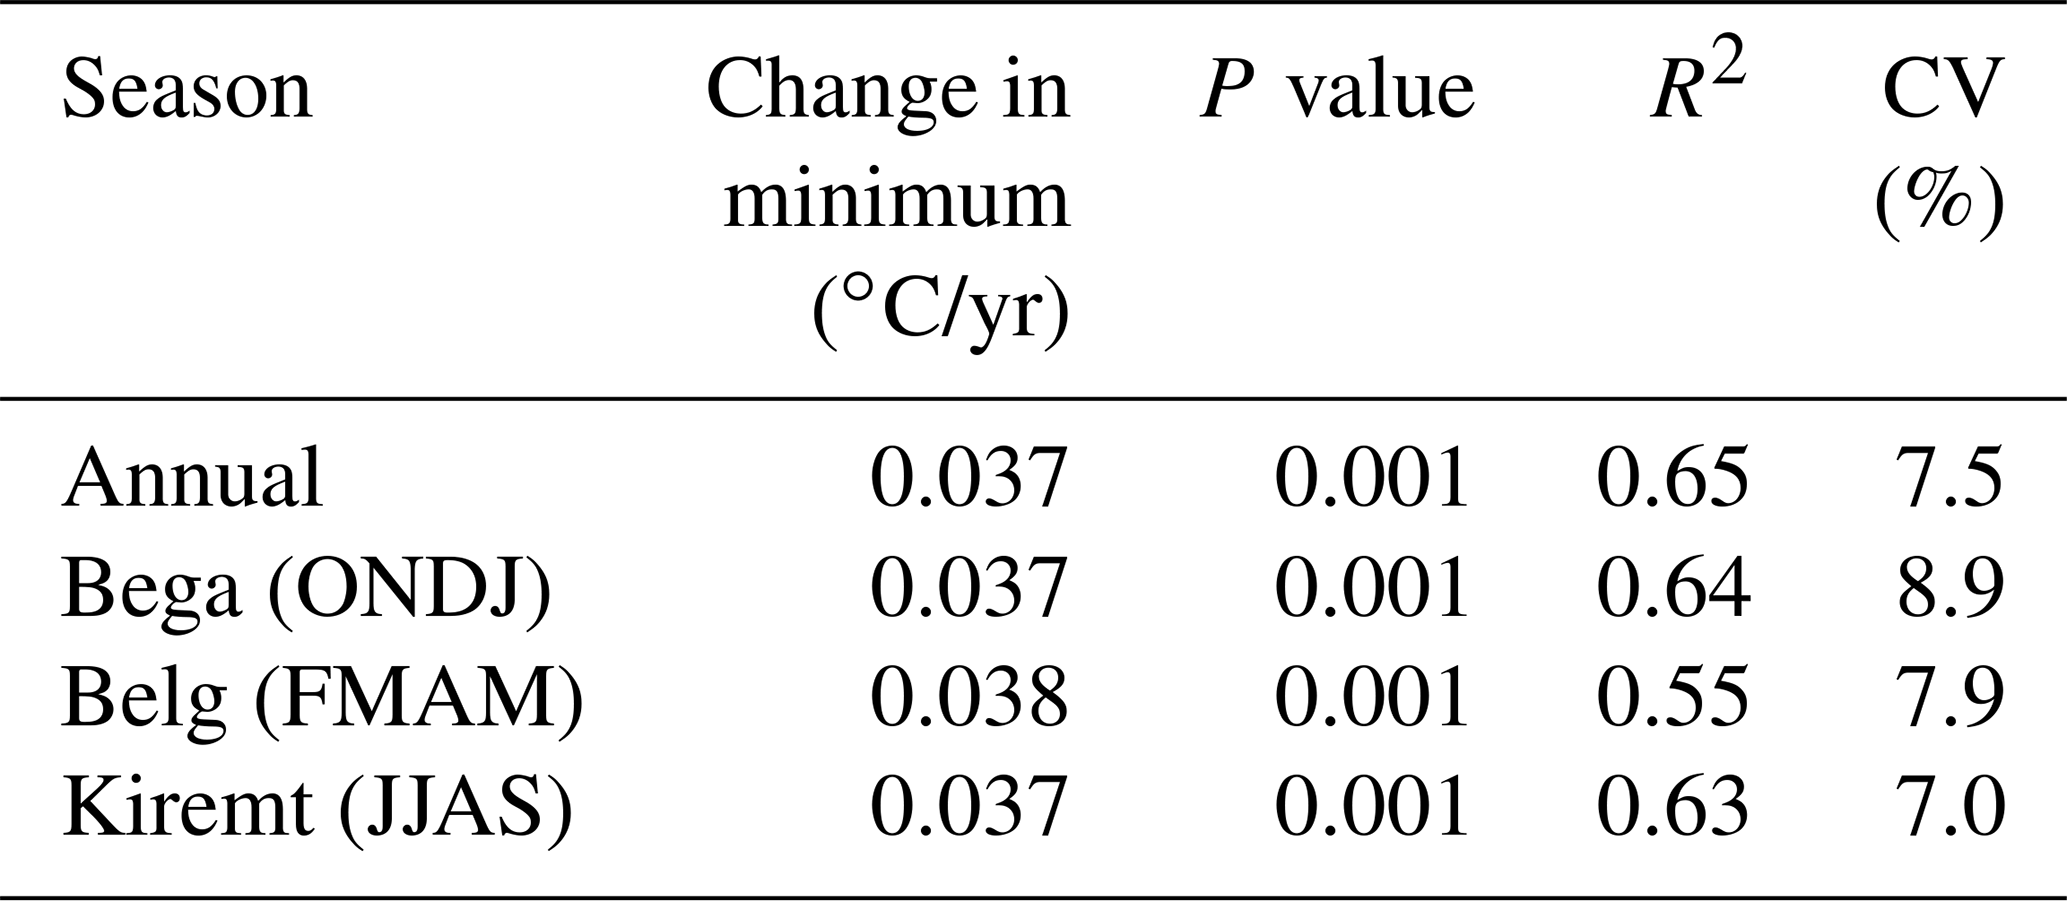
Table 4Basic statistics and MK trend analysis of maximum temperature in the Blue Nile Basin (1950–2018).
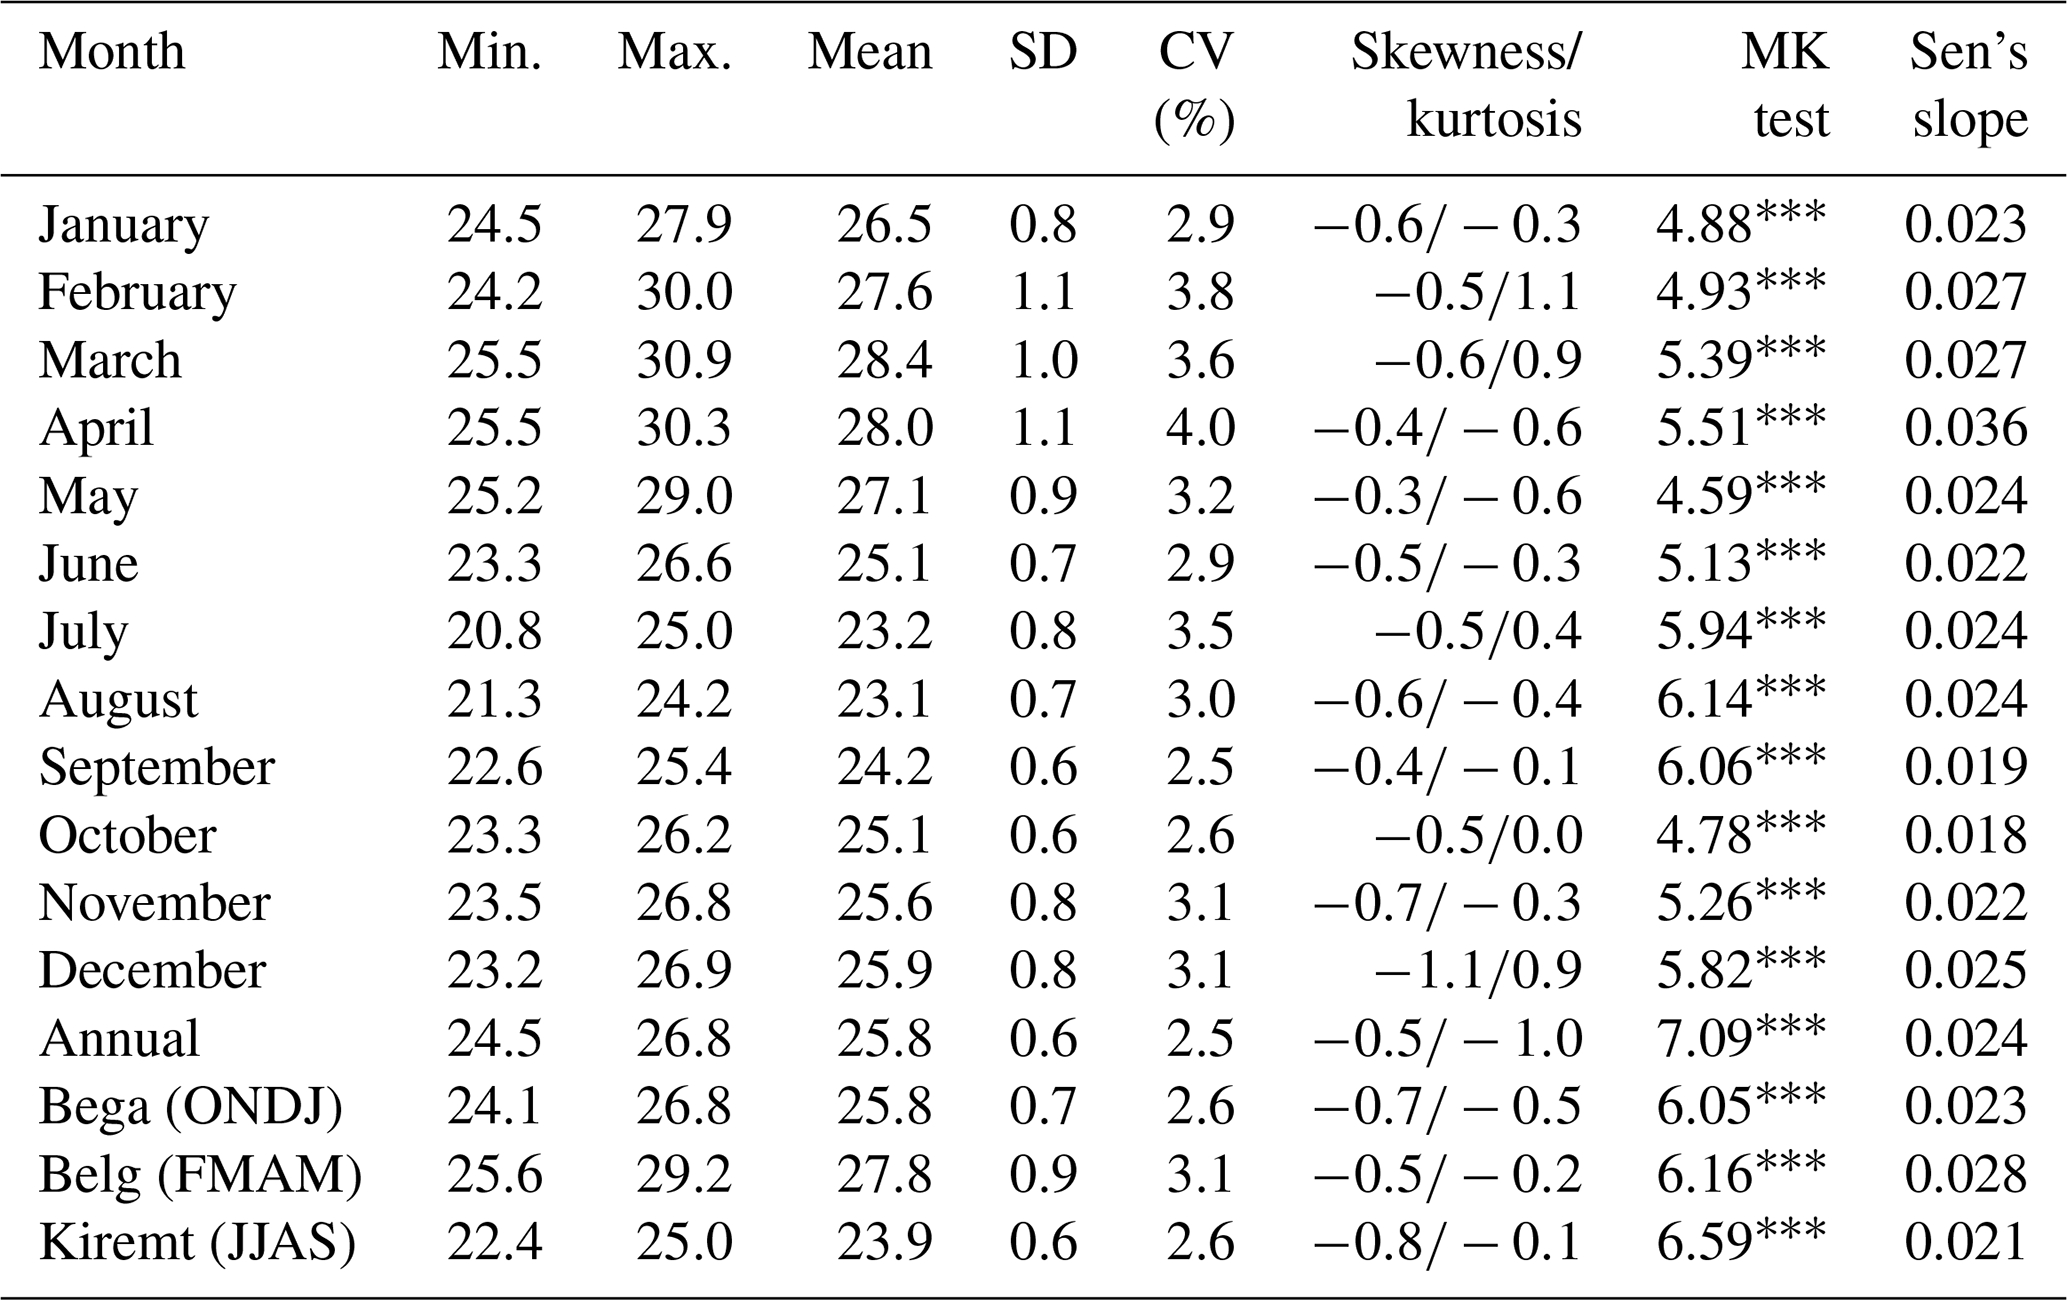
* Significant at 5 % significance level. Significant at 1 % significance level. Significant at 0.1 % significance level.
Table 5Linear regression result (annual maximum temperature and Bega, Belg, and Kiremt seasons) (1950–2018).
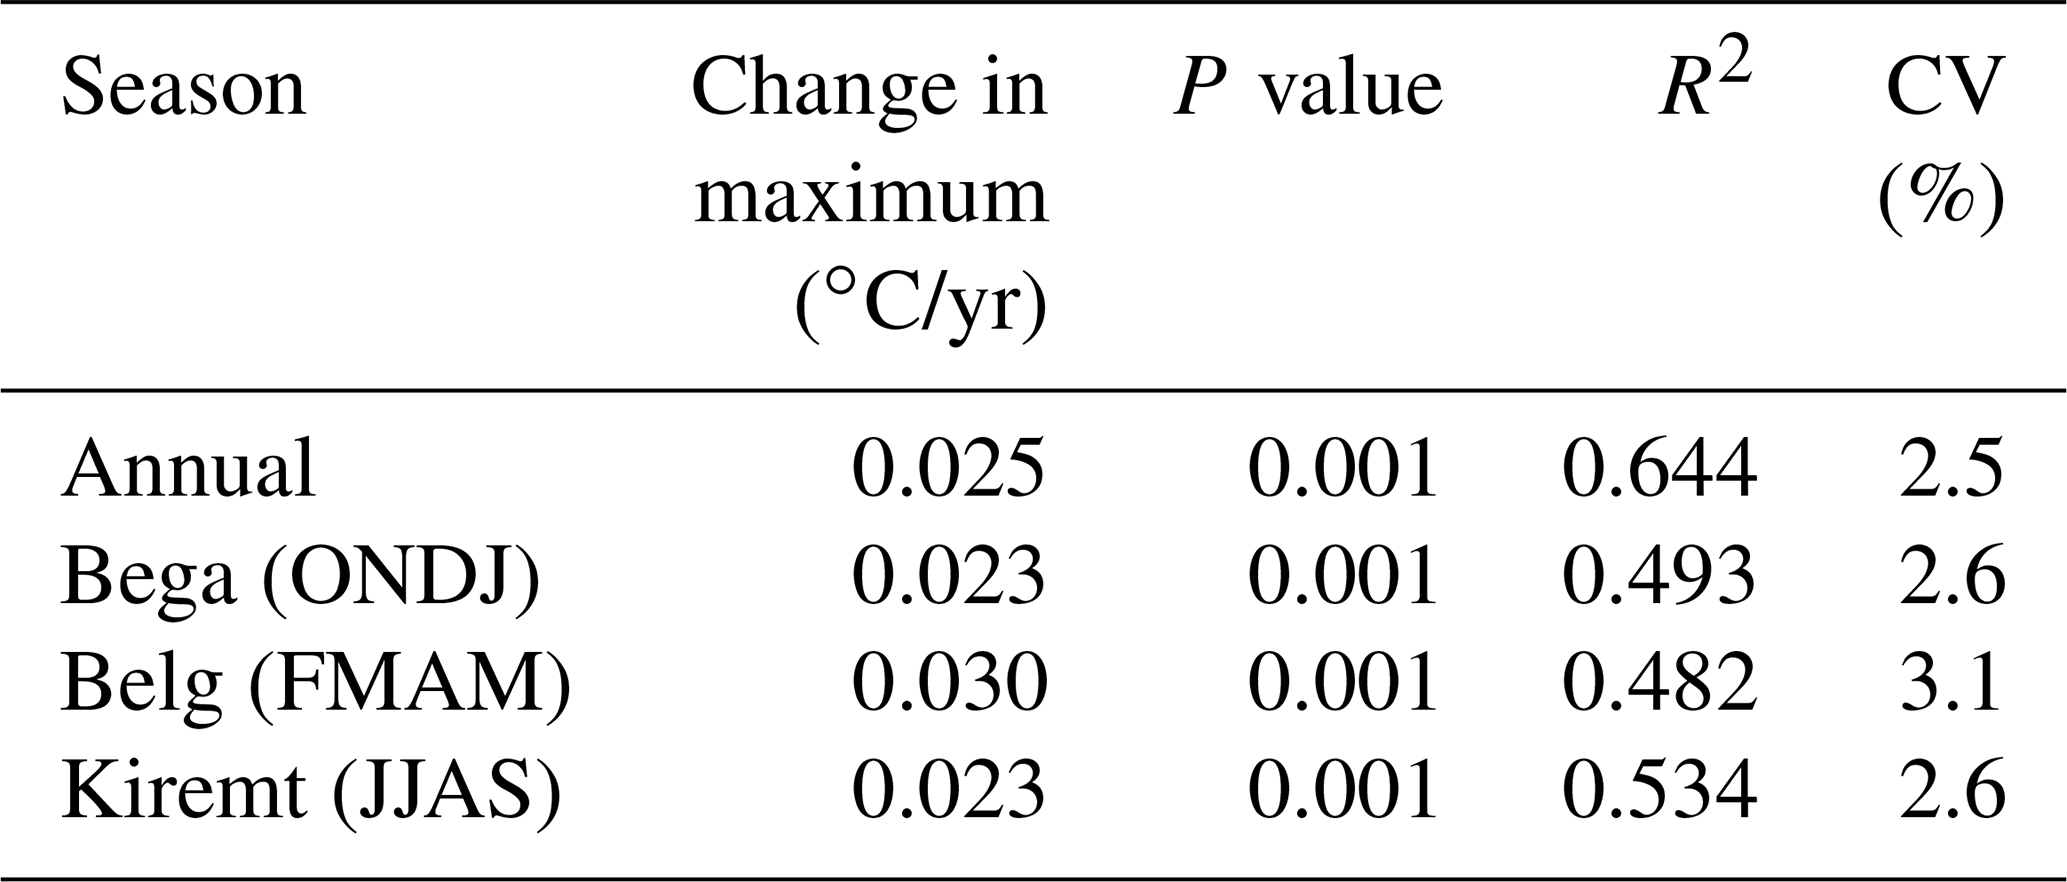
Tables 2 and 4 show the annual and monthly maximum and minimum MT and MMT and their trend during the study period. The mean minimum temperature in the BNRB area was 6.7 ∘C and the mean maximum was 25.5 ∘C, with a mean annual temperature of 16.1 ∘C. The regression line slope is about 0.036 and 0.024 ∘C per decade for minimum and maximum annual temperatures respectively for the studied period of 1950–2018 as shown in Tables 3 and 5 in addition to Figs. 2 and 3. These results are close to the previously found global warming rate which is 0.06 ∘C per decade for the last century (Pachauri and Meyer, 2014). Figures 4 and 5 showed the long-range anomalies of mean annual minimum and maximum temperatures. It is clear that the trend after 1985 was greater than the long-term average. This is considered as strong evidence for the global warming trend during the last two decades of the 20th century. This result enhances the previously found results that the climate became warmer since the end of the last century (Bathiany et al., 2018; Guo et al., 2020; Nijsse et al., 2019). Surface air temperature rises globally, although global warming is uniform across the world, both temporally and spatially (Turner et al., 2020). The surface temperature increase is the direct demonstration of global climate change (Brunet et al., 2007). However, other researchers proved that the last four decades of the 20th century showed a significantly increasing trend in global warming (Bhutiyani et al., 2008). Interannual variability of rainfall and temperature has intensified from the late 1960s. Also, droughts occur more frequently and over a greater spatial distribution. A stronger statistical relation between climate change and the ENSO phenomenon is observed (Fauchereau et al., 2003). As shown in Tables 2 and 4, the result of the MK test detected that the mean maximum and minimum temperatures increased significantly over time at a 99 % confidence level. The trend for monthly minimum and maximum temperature is increasing significantly for all months. The gross increase in the observed annual temperature is attributed to the increase in the minimum temperature. Many researchers have reported that the minimum temperature rises more than the maximum (Bayramzadeh et al., 2018; Crimp et al., 2018; Gross et al., 2018; Scott et al., 2017) The minimum temperature incremental increase is more evident than that of the maximum. The results are in good agreement with the results by Asfaw et al. (2018). The results of the MK analysis revealed a significant increase in both mean and minimum temperatures throughout the studied period. On the other hand, the maximum temperature has a nonsignificant increasing trend. The studies that agree with these results such as Mengistu et al. (2014) and Roy and Das (2013) found that the increasing trends in the maximum temperature series were less than the minimum temperature series. That the minimum temperature increases more than the maximum may be explained by the sensitivity of minimum temperature to the greenhouse being higher than the maximum (Salawitch, 1998). In this regard, the maximum temperature over India was higher than the mean for the period (1901–2007) with a low trend. However, the minimum temperature displayed an upward trend (Kothawale et al., 2010). This result supported the findings of the current paper over the BNRB. Table 6 showed that the minimum temperature has an increasing trend in Bega, Belg, and Kiremt seasons in the stations of Bahir Dar, Debre Markos, Gondar, Gore, and Jimma with a level of significance 5 %, 1 %, and 0.1 %. Also, the maximum temperature in the three seasons has a significant increasing trend in Addis Ababa, Bahir Dar, Gondar, and Gore stations, and the trend is statistically significant at 0.1 %, 1 %, and 5 % level of significance as shown in Table 7.
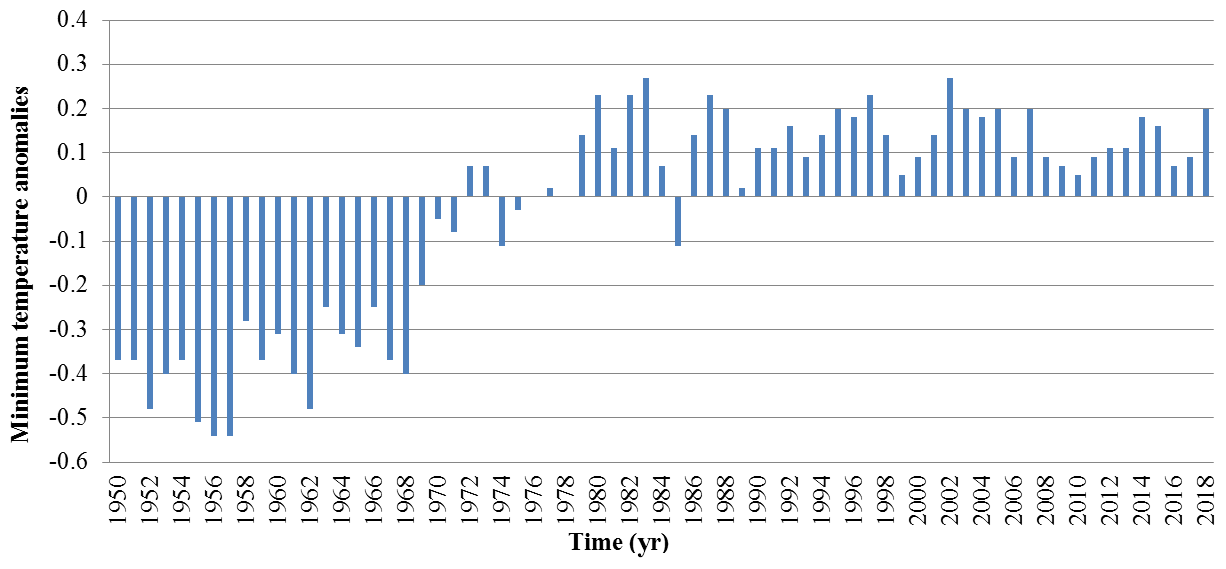
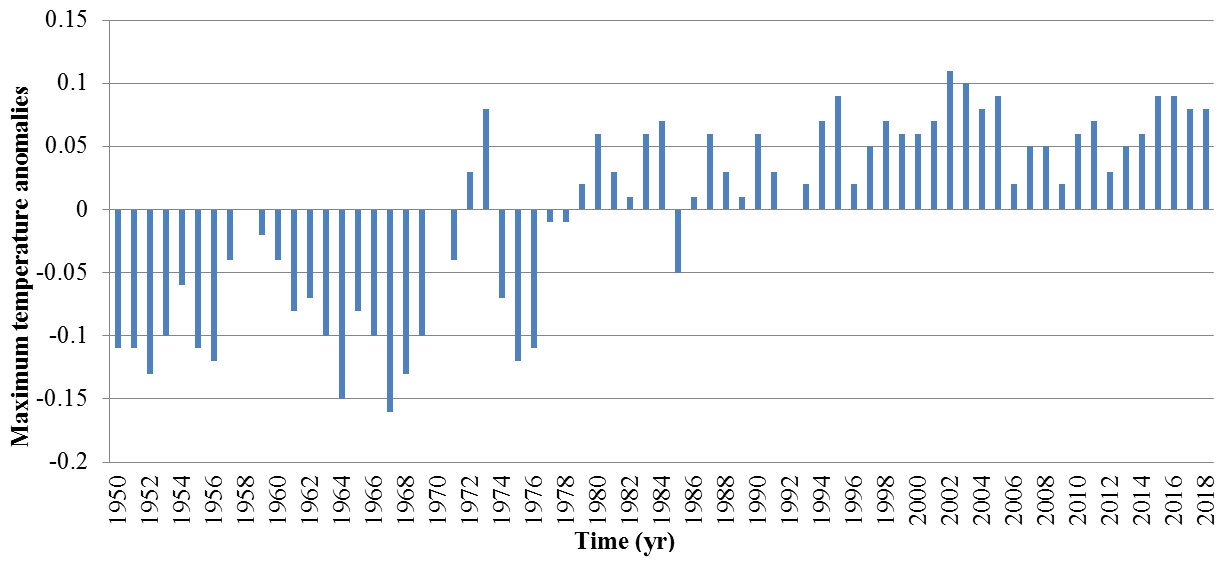
Table 6Mann–Kendall minimum temperature trend analysis (based on gauge stations).
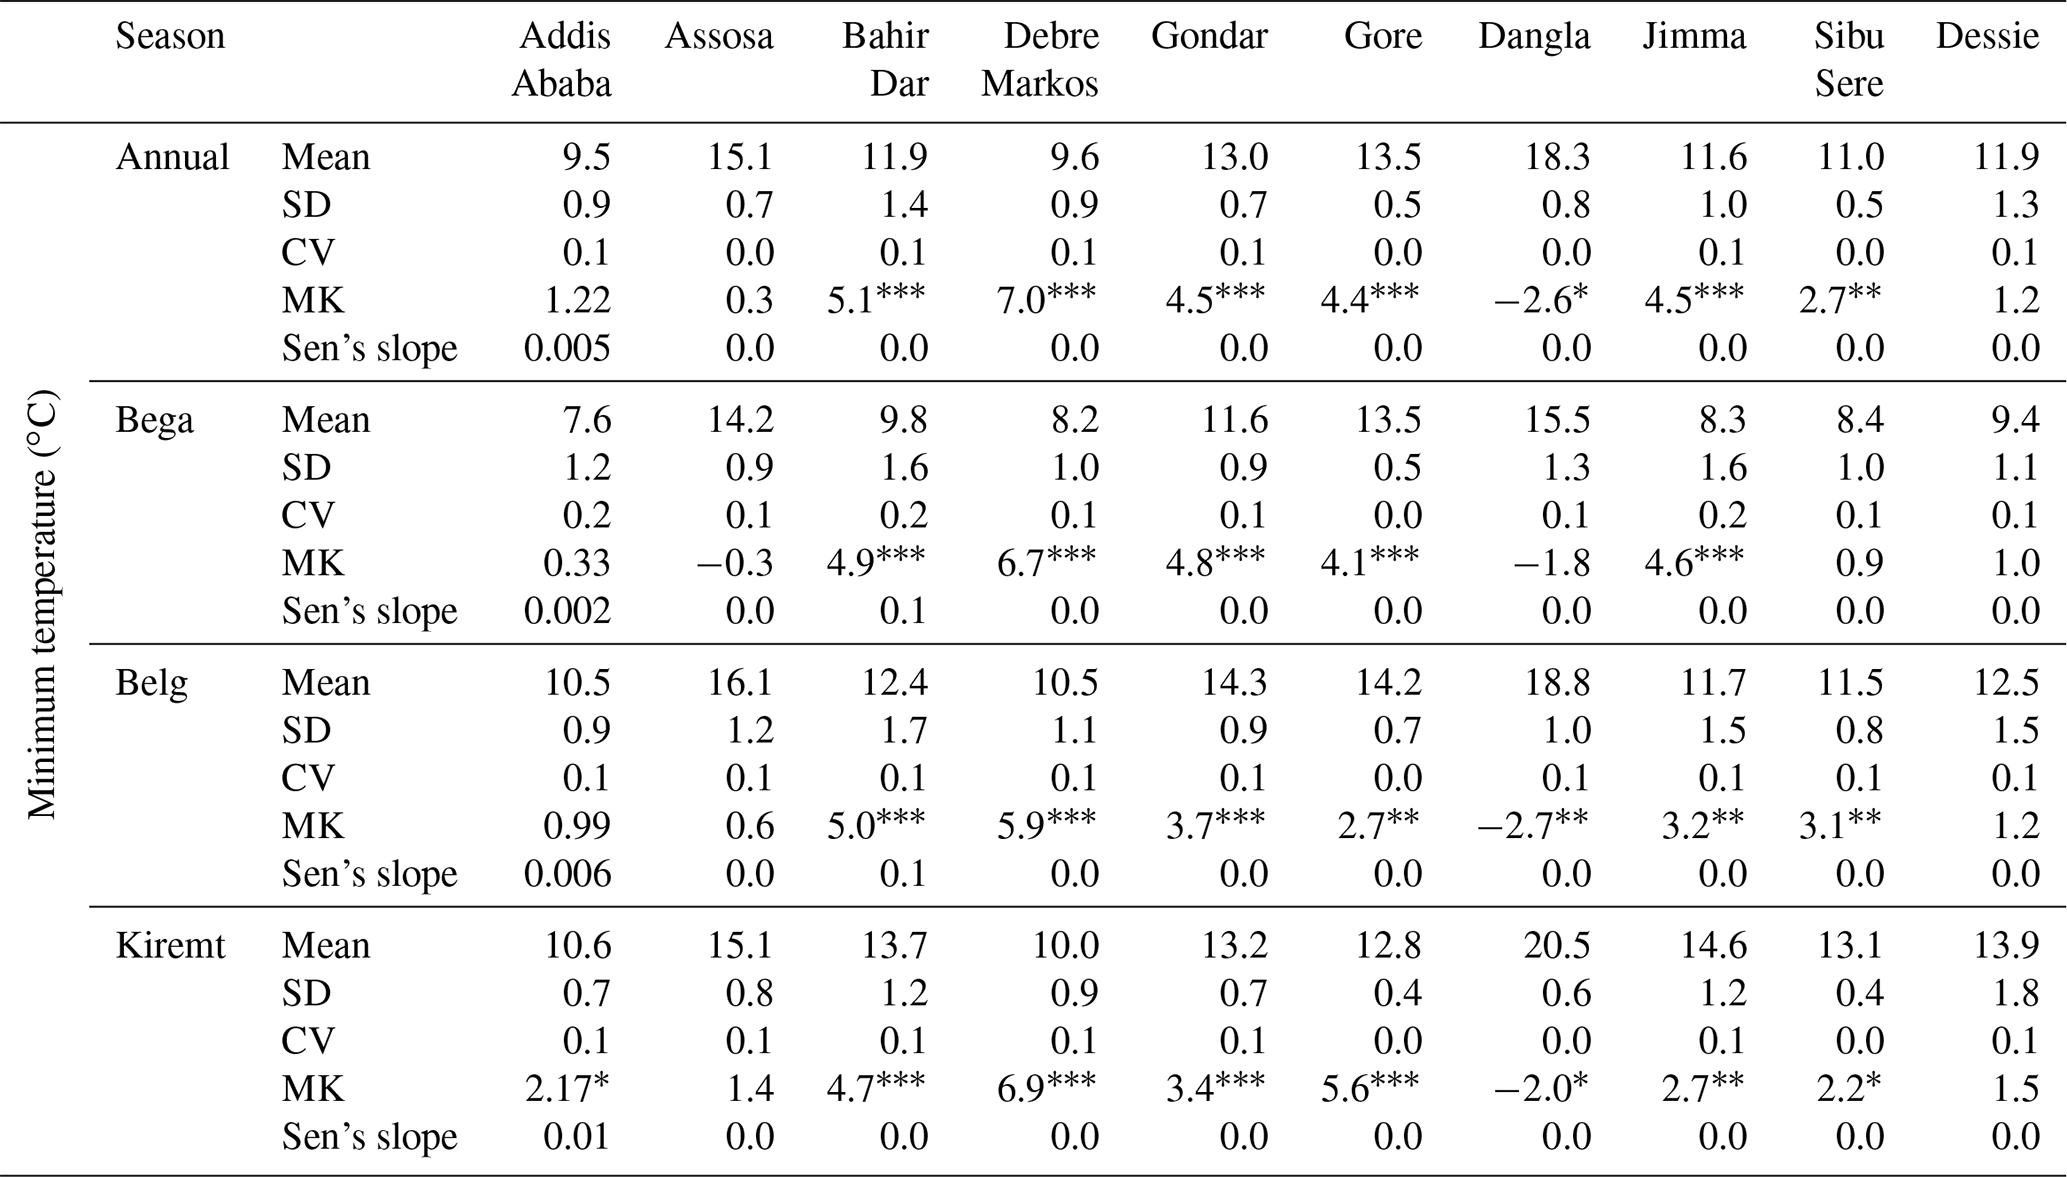
* Significant at 5 % significance level. Significant at 1 % significance level. Significant at 0.1 % significance level.
Table 7Mann–Kendall maximum temperature trend analysis (based on gauge stations).
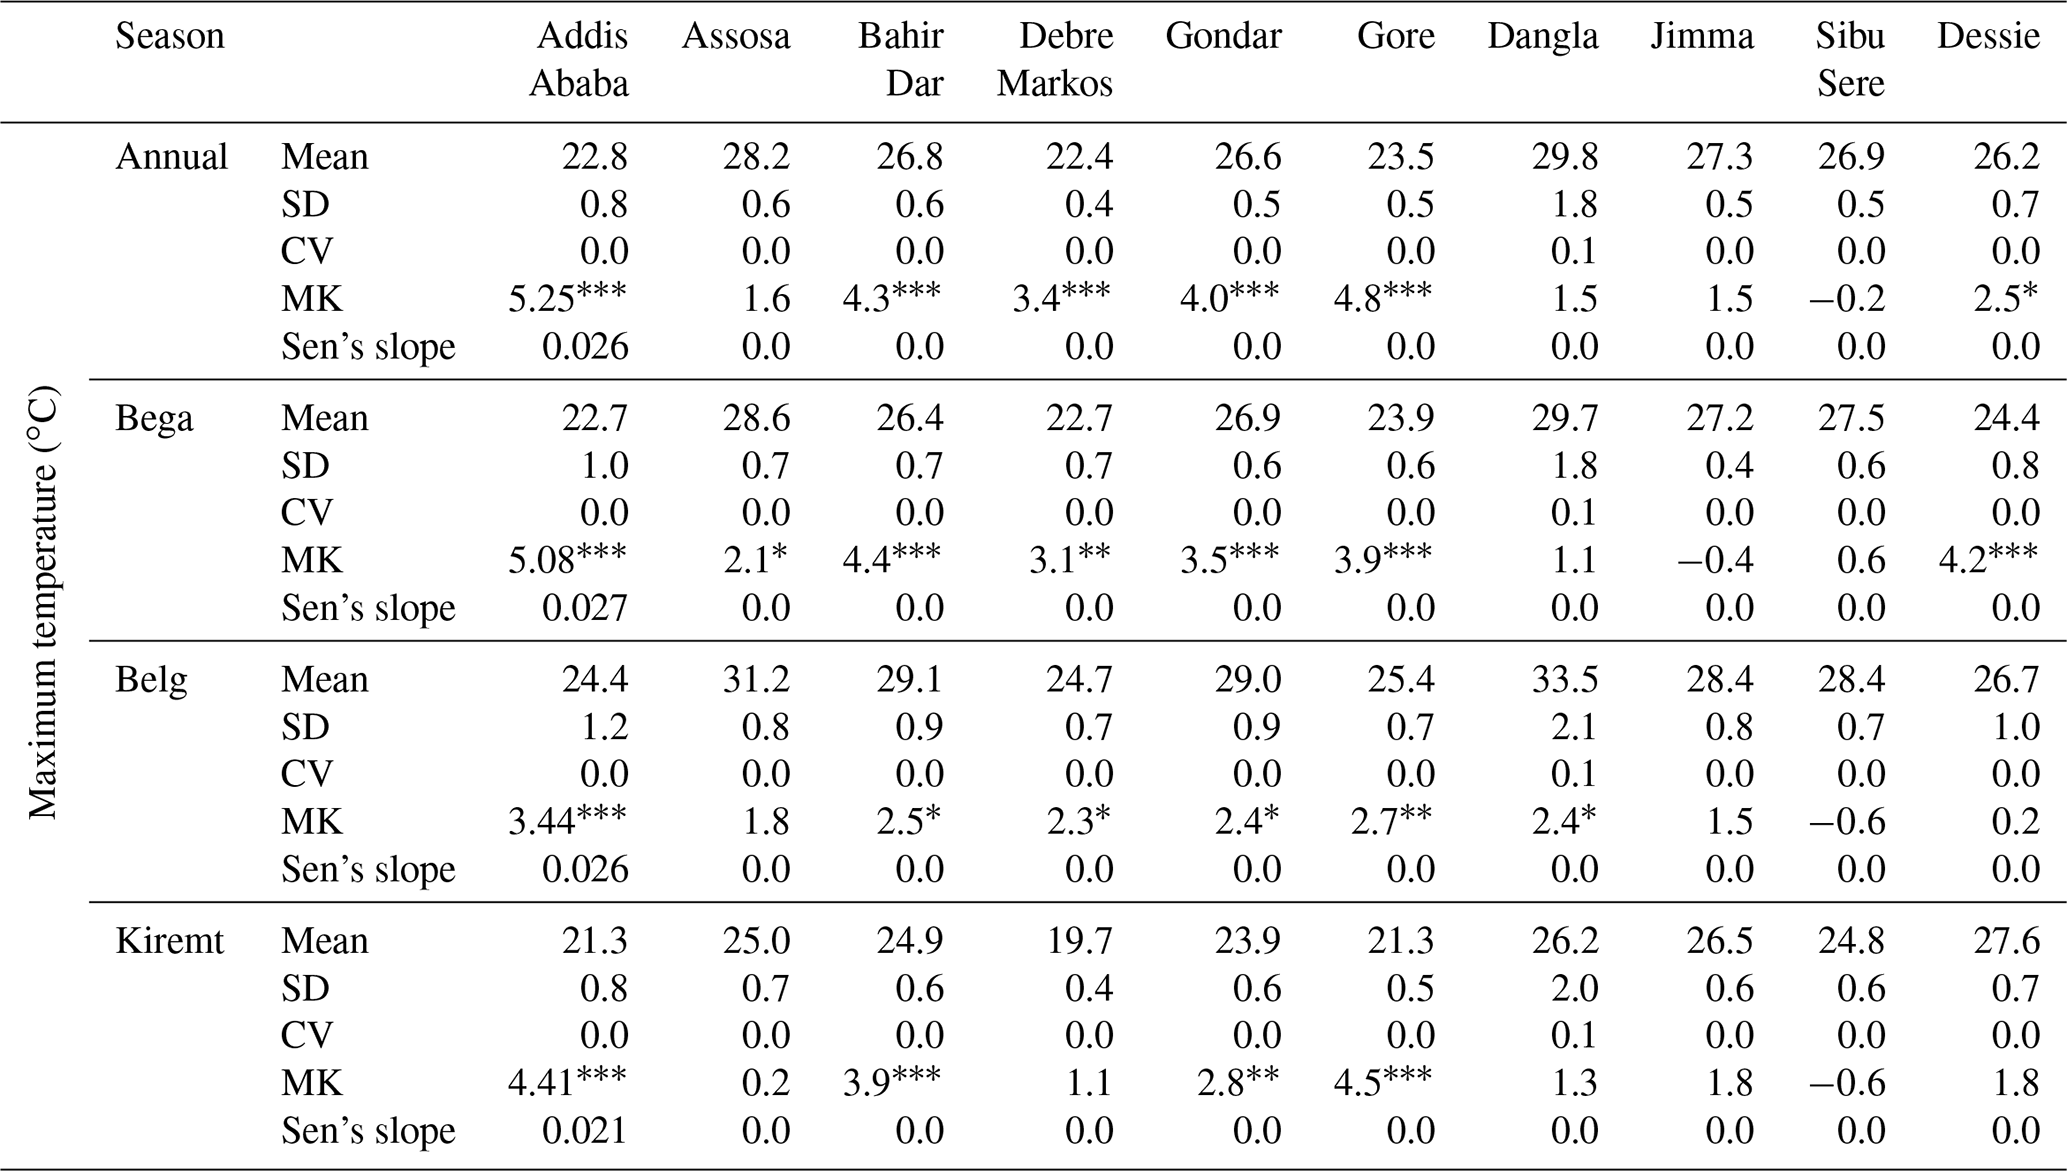
* Significant at 5 % significance level. Significant at 1 % significance level. Significant at 0.1 % significance level.
Temporal and spatial patterns of changes in extreme temperatures were investigated in the Blue Nile River basin. The study used data from 10 meteorological stations in the basin for the period 1950–2018. The statistical data analysis used in this research work includes standard deviation, coefficient of variation, skewness/kurtosis, Mann–Kendall test, and Sen's slope. The results showed that there is an increase in both maximum and minimum temperatures in the basin over the study period of 68 years. The rate of temperature increase was found to be 0.037 and 0.025 ∘C per decade for minimum and maximum temperatures, respectively. The trend of the mean minimum annual temperature for the last quarter of the 20th century was greater than the long-term average. The trend analysis test showed a significant increase in the mean minimum and maximum temperatures for all months. The rate of increase for the minimum temperature is more pronounced than the maximum. Consequently, this indicates that minimum temperature is more sensitive to climate change. Some stations showed a decrease in the interannual temperature range. rational climate change may aggravate the situations of climate extremes. Therefore, appropriate adaptation and mitigation strategies should be planned to lessen the impacts of such climatic risks in the Blue Nile River Basin. The detailed analysis of the impact of these factors on basin hydrology will be addressed by forthcoming research. A further enhancement of the current work could be attained using a long record of daily data. A more thorough investigation of the techniques used for trend analysis could lead to more accurate trend values. A holistic climate change assessment over the whole Nile River Basin should get more attention and a thorough investigation. Research on climate change detection should be done using various approaches in collaboration with worldwide concerned bodies.
Some or all data, models, or code generated or used during the study are available from the corresponding author by request.
All the processes of the paper, including but not limited to conceptualization, data curation, formal analysis, investigation, methodology, project administration, resources, software, supervision, validation, visualization, and writing (original draft preparation, writing, review, and editing), were carried out equally by MAHM and MESEM.
The authors declare that they have no conflict of interest.
This paper was edited by Ciro Apollonio and reviewed by two anonymous referees.
Anache, J. A., Flanagan, D. C., Srivastava, A., and Wendland, E. C.: Land use and climate change impacts on runoff and soil erosion at the hillslope scale in the Brazilian Cerrado, Sci. Total Environ., 622, 140–151, 2018.
Asfaw, A., Simane, B., Hassen, A., and Bantider, A.: Variability and time series trend analysis of rainfall and temperature in northcentral Ethiopia: A case study in Woleka sub-basin, Weather Clim. Ext,, 19, 29–41, 2018.
Bathiany, S., Dakos, V., Scheffer, M., and Lenton, T. M.: Climate models predict increasing temperature variability in poor countries, Sci. Adv., 4, eaar5809, https://doi.org/10.1126/sciadv.aar5809, 2018.
Bayramzadeh, V., Zhu, H., Lu, X., Attarod, P., Zhang, H., Li, X., Asad, F., and Liang, E.: Temperature variability in northern Iran during the past 700 years, Sci. Bull., 63, 462–464, 2018.
Bergström, S., Carlsson, B., Gardelin, M., Lindström, G., Pettersson, A., and Rummukainen, M.: Climate change impacts on runoff in Sweden assessments by global climate models, dynamical downscaling and hydrological modelling, Clim. Res., 16, 101–112, 2001.
Bhutiyani, M., Kale, V. S., and Pawar, N.: Changing streamflow patterns in the rivers of northwestern Himalaya: implications of global warming in the 20th century, Curr. Sci., 95, 618–626, 2008.
Brunet, M., Jones, P., Sigró, J., Saladié, O., Aguilar, E., Moberg, A., Della-Marta, P., Lister, D., Walther, A., and López, D.: Temporal and spatial temperature variability and change over Spain during 1850–2005, J. Geophys. Res.-Atmos., 112, D12117, https://doi.org/10.1029/2006JD008249, 2007.
Chen, H., Xu, C.-Y., and Guo, S.: Comparison and evaluation of multiple GCMs, statistical downscaling and hydrological models in the study of climate change impacts on runoff. J. Hydrol., 434, 36–45, 2012.
Collins, S., Yuan, S., Tan, P., Oliver, S., Lapierre, J., Cheruvelil, K., Fergus, C., Skaff, N., Stachelek, J., and Wagner, T.: Winter precipitation and summer temperature predict lake water quality at macroscales, Water Recour. Res., 55, 2708–2721, 2019.
Conway, D. and Schipper, E. L. F.: Adaptation to climate change in Africa: Challenges and opportunities identified from Ethiopia. Global Environ. Change, 21, 227–237, 2011.
Crimp, S., Nicholls, N., Kokic, P., Risbey, J. S., Gobbett, D., and Howden, M.: Synoptic to large-scale drivers of minimum temperature variability in Australia–long-term changes, Int. J. Climatol., 38, e237–e254, 2018.
Degefu, M. A. and Bewket, W.: Variability and trends in rainfall amount and extreme event indices in the Omo-Ghibe River Basin, Ethiopia, Reg. Environ. Change, 14, 799–810, 2014.
El-Mahdy, M. E.: Recent changes of Lake Nasser hydrology, MSc thesis, P241, Cairo University, 2011.
El-Mahdy, M. E.: Tana Lake Free Water Evaporation. Sustainable Development of Natural Resources in the Nile Basin Countries-Cairo University, Giza, Egypt, 353–389, 2014.
El-Mahdy, M. E.: Modelling Eastern Nile Basin Hydrology, Cairo University, 2017.
El-Mahdy, M. E., Abbas, M. S., and Sophy, H. M.: Investigating the Water Quality of the Water Resources Bank of Egypt: Lake Nasser. Conventional Water Resources and Agriculture in Egypt, Springer, New York City, USA, 2018.
Fauchereau, N., Trzaska, S., Rouault, M., and Richard, Y.: Rainfall variability and changes in southern Africa during the 20th century in the global warming context, Nat. Hazards, 29, 139–154, 2003.
Fekadu, K.: Ethiopian seasonal rainfall variability and prediction using canonical correlation analysis (CCA), Earth Sci., 4, 112–119, https://doi.org/10.11648/j.earth.20150403.14, 2015.
Gebrechorkos, S. H., Hülsmann, S., and Bernhofer, C.: Analysis of climate variability and droughts in East Africa using high-resolution climate data products, Glob. Planet. Change, 186, 103130, https://doi.org/10.1016/j.gloplacha.2020.103130, 2020.
Gebrehiwot, T. and Van der Veen, A.: Assessing the evidence of climate variability in the northern part of Ethiopia, J. Dev. Agr. Econ., 5, 104–119, 2013.
Gleick, P. H.: Water: the potential consequences of climate variability and change for the water resources of the United States, Pacific Institute for Studies in Development, Environment, and Security, USA, 2000.
Gross, M. H., Donat, M. G., Alexander, L. V., and Sisson, S. A.: The sensitivity of daily temperature variability and extremes to dataset choice, J. Climate, 31, 1337–1359, 2018.
Guo, Y., Li, Y., Wang, F., Wei, Y., and Rong, Z.: Processes Controlling Sea Surface Temperature Variability of Ningaloo Niño. J. Climate, 33, 4369–4389, 2020.
Haile, M.: Weather patterns, food security and humanitarian response in sub-Saharan Africa, Philos. T. Roy. Soc. B, 360, 2169–2182, 2005.
Houghton, E.: Climate change 1995: The science of climate change: contribution of working group I to the second assessment report of the Intergovernmental Panel on Climate Change, Cambridge University Press, Cambridge, 1996.
Isioma, I. N., Rudolph, I. I., and Omena, A. L.: Non-parametric Mann-Kendall Test Statistics for Rainfall Trend Analysis in Some Selected States within the Coastal Region of Nigeria, J. Civil Constr. Environ. Eng., 3, 17–28, https://doi.org/10.11648/j.jccee.20180301.14, 2018.
Janssens, C., Havlík, P., Krisztin, T., Baker, J., Frank, S., Hasegawa, T., Leclère, D., Ohrel, S., Ragnauth, S., and Schmid, E.: Global hunger and climate change adaptation through international trade, Nat. Clim. Change, 10, 829–835, https://doi.org/10.1038/s41558-020-0847-4, 2020.
Jones, P.: Sur face Air Tem per a ture and Its Vari a tions over the Last 150 Years, Rev. Geophys., 37, 173–199, https://doi.org/10.1029/1999RG900002, 1999.
Jones, P. D. and Hulme, M.: Calculating regional climatic time series for temperature and precipitation: methods and illustrations, Int. J. Climatol., 16, 361–377, 1996.
Kebede, S., Travi, Y., Alemyehu, T., and Marc, V.: Water balance of Lake Tana and its sensitivity to fluctuations in rainfall, Blue Nile basin, Ethiopia, J. Hydrol., 316, 233–247, 2006.
Kiros, G., Shetty, A., and Nandagiri, L.: Analysis of variability and trends in rainfall over northern Ethiopia, Arabian J. Geosci., 9, 451, https://doi.org/10.1007/s12517-016-2471-1, 2016.
Kothawale, D., Munot, A., and Kumar, K. K.: Surface air temperature variability over India during 1901–2007, and its association with ENSO, Clim. Res., 42, 89–104, 2010.
Lindzen, R. S. and Giannitsis, C.: Reconciling observations of global temperature change, Geophys. Res. Lett., 29, 24-1–24-3, 2002.
Mann, H. B.: Nonparametric tests against trend, Econometrica, 13, 245–259, https://doi.org/10.2307/1907187, 1945.
Mann, M. E., Bradley, R. S., and Hughes, M. K.: Northern hemisphere temperatures during the past millennium: Inferences, uncertainties, and limitations, Geophys. Res. Lett., 26, 759–762 1999.
Margaret, F.: Planning for the Next Drought, Ethiopia Case Study, USAID, Washington, 2003.
McLeod, A. I.: Kendall rank correlation and Mann-Kendall trend test, R Package Kendall, available at: http://www.stats.uwo.ca/faculty/aim (last access: 23 February 2021), 2005.
Mengistu, D., Bewket, W., and Lal, R.: Recent spatiotemporal temperature and rainfall variability and trends over the Upper Blue Nile River Basin, Ethiopia, Int. J. Climatol., 34, 2278–2292, 2014.
Németh, L., Hübnerová, Z., and Zempléni, A.: Comparison of trend detection methods in GEV models, Commun. Stat. Simulat., 13, 1–16, https://doi.org/10.1080/03610918.2020.1804580, 2020.
Nijsse, F. J., Cox, P. M., Huntingford, C., and Williamson, M. S.: Decadal global temperature variability increases strongly with climate sensitivity, Nat. Clim. Change, 9, 598–601, 2019.
Onyutha, C.: On rigorous drought assessment using daily time scale: Non-stationary frequency analyses, revisited concepts, and a new method to yield non-parametric indices, Hydrology, 4, 48, https://doi.org/10.3390/hydrology4040048, 2017.
Pachauri, R. K. and Meyer, L.: Climate change 2014 Synthesis Report-Summary for Policymakers, Intergovernmetnal Panel on Climate Change (IPCC), IPCC, Geneva, Switzerland, 151 pp., 2014.
Partal, T. and Kahye, E.: Trend analysis in Turkish precipitation data, Hydrol. Process., 20, 2011–2026, 2006.
Pettitt, A.: A non-parametric approach to the change-point problem. J. Roy. Stat. Soc. Ser. C., 28, 126–135, 1979.
Roy, T. D. and Das, K. K.: Temperature Trends at Four Stations of Assam during the period 1981–2010, Int. J. Sci. Res. Publ, 3, 1–3, 2013.
Salawitch, R. J.: A greenhouse warming connection, Nature, 392, 551–552 1998.
Scott, A. A., Zaitchik, B., Waugh, D. W., and O'Meara, K.: Intraurban temperature variability in Baltimore, J. Appl. Meteorol. Climatol., 56, 159–171, 2017.
Seleshi, Y. and Camberlin, P.: Recent changes in dry spell and extreme rainfall events in Ethiopia, Theor. Appl. Climatol., 83, 181–191, 2006.
Sen, P. K.: Estimates of the regression coefficient based on Kendall's tau. J. Am. Stat. Assoc., 63, 1379–1389, 1968.
Shanko, D. and Camberlin, P.: The effects of the Southwest Indian Ocean tropical cyclones on Ethiopian drought, INt. J. Climatol., 18, 1373–1388, 1998.
Sintayehu, L.: Application of the HEC-HMS model for runoff simulation of upper blue Nile River Basin, Hydrol. Current Res., 6, 1–8, 2015.
Sippel, S., Meinshausen, N., Fischer, E. M., Székely, E., and Knutti, R.: Climate change now detectable from any single day of weather at global scale, Nat. Clim. Change, 10, 35–41, 2020.
Sobhy, H. M., Abbas, M. S., and El-Mahdy, M. E.-S.: Development of mass-transfer evaporation model for Lake Nasser, Egypt, J. Water Clim. Change, jwc2019116, https://doi.org/10.2166/wcc.2019.116, 2019.
Sohoulande Djebou, D. C. and Singh, V. P.: Impact of climate change on precipitation patterns: A comparative approach, Int. J. Climatol., 36, 3588–3606, 2016.
Tabari, M. M. R. and Tavakoli, S.: Effects of stepped spillway geometry on flow pattern and energy dissipation, Arab. J. Sci. Eng., 41, 1215–1224, 2016.
Tabari, H., Taye, M. T., and Willems, P.: Statistical assessment of precipitation trends in the upper Blue Nile River basin, Stoch. Environ. Res. Risk Assess., 29, 1751–1761, https://doi.org/10.1007/s00477-015-1046-0, 2015.
Tamiru, M.: Evaluation of Extreme Rainfall and Temperature Variability (In Upper Blue Nile, Ethiopia), Addis Ababa University, Addis Ababa, Ethiopia, 115 pp., 2011.
Tapley, B. D., Watkins, M. M., Fletchner, F., Reigber, C., Bettadpur, S., Rodell, M., Sasgen, I., Famiglietti, J. S., Landerer, F. W., Chambers, D. P., Reager, J. T., Gardner, A. S., Save, H., Ivins, E. R., Swenson, S. C., Boening, C., Dahle, C., Wiese, D. N., Dobslaw, H., Tamisiea, M. E., and Velicgna, I.: Contributions of GRACE to understanding climate change, Nat. Clim. Chang, 5, 358–369, 2019.
Totaro, V., Gioia, A., and Iacobellis, V.: Numerical investigation on the power of parametric and nonparametric tests for trend detection in annual maximum series, Hydrol. Earth Syst. Sci., 24, 473–488, https://doi.org/10.5194/hess-24-473-2020, 2020.
Turner, J., Marshall, G. J., Clem, K., Colwell, S., Phillips, T., and Lu, H.: Antarctic temperature variability and change from station data, Int. J. Climatol., 40, 2986–3007, 2020.
Vogel, R. M., Rosner, A., and Kirshen, P. H.: Brief Communication: Likelihood of societal preparedness for global change: trend detection, Nat. Hazards Earth Syst. Sci., 13, 1773–1778, https://doi.org/10.5194/nhess-13-1773-2013, 2013.
Wang, F., Shao, W., Yu, H., Kan, G., He, X., Zhang, D., Ren, M., and Wang, G.: Re-evaluation of the Power of the Mann-Kendall Test for Detecting Monotonic Trends in Hydrometeorological Time Series, Front. Earth Sci., 8, 14, https://doi.org/10.3389/feart.2020.00014, 2020.
Watson, R. T., Zinyowera, M. C., and Moss, R. H.: Climate change 1995, Impacts, adaptations and mitigation of climate change: Scientific-technical analyses, Press Syndicate of the University of Cambridge, Cambridge, United Kingdom, 925 pp., 1996.
Yan, Y., Xue, B., Yinglan, A., Sun, W., and Zhang, H.: Quantification of climate change and land cover/use transition impacts on runoff variations in the upper Hailar Basin, NE China, Hydrol. Res., 51, 976–993, https://doi.org/10.2166/nh.2020.022, 2020.
Yue, S., Pilon, P., and Cavadias, G.: Power of the Mann–Kendall and Spearman's rho tests for detecting monotonic trends in hydrological series, J. Hydrol., 259, 254–271, 2002.