the Creative Commons Attribution 4.0 License.
the Creative Commons Attribution 4.0 License.
 | 05 Jan 2026
Pituffik (PIF), a new magnetic observatory in the Arctic
Anna Willer
Lars William Pedersen
Jan Oechsle
Marie Vigger Eldor
Pituffik is a newly established geomagnetic observatory located in the high Arctic – a region with sparse geomagnetic observational coverage. Positioned within the polar cap at Quasi-Dipole geomagnetic coordinates 83.19° latitude and 25.25° longitude, the observatory provides valuable data from a geophysical significant area. The observatory was carefully designed and constructed using non-magnetic materials with special considerations for the Arctic conditions. All building components were pre-assembled and tested in Denmark before being disassembled, shipped, and reassembled at the remote site in northwest Greenland. This paper presents the observatory design, and an analysis of over one year of operational data, including baseline stability, temperature control, and calibrated vector and scalar magnetic field measurements. The results demonstrate stable baselines and high data quality, confirming the observatory's readiness for data-distribution to the international geomagnetic community.
- Article
(2853 KB) - Full-text XML
- BibTeX
- EndNote


There are over 100 geomagnetic observatories worldwide that contribute to the continuous monitoring of Earth's magnetic field (INTERMAGNET, 2025). In the high northern latitudes, observatories are sparsely distributed, making each station particularly valuable for geomagnetic research and modelling. One of the northernmost observatories is the Qaanaaq (THL) observatory, located in northwest Greenland at a Quasi-Dipole geomagnetic latitude of 84.05° (calculated after Emmert et al., 2010, with IGRF12 coefficients, for a geodetic height of 0 km, and for epoch 2015.0). Since its establishment in 1956, THL has provided high-quality geomagnetic data and plays a crucial role in generating the IAGA-endorsed Polar Cap (PC) index. However, the observatory will likely be magnetically disturbed due to construction activity near the current site in the coming years. To ensure the continued availability of reliable data from this region, a new magnetic observatory has been established at Pituffik (PIF), situated nearby at Quasi-Dipole geomagnetic coordinates 83.19° latitude and 25.25° longitude.
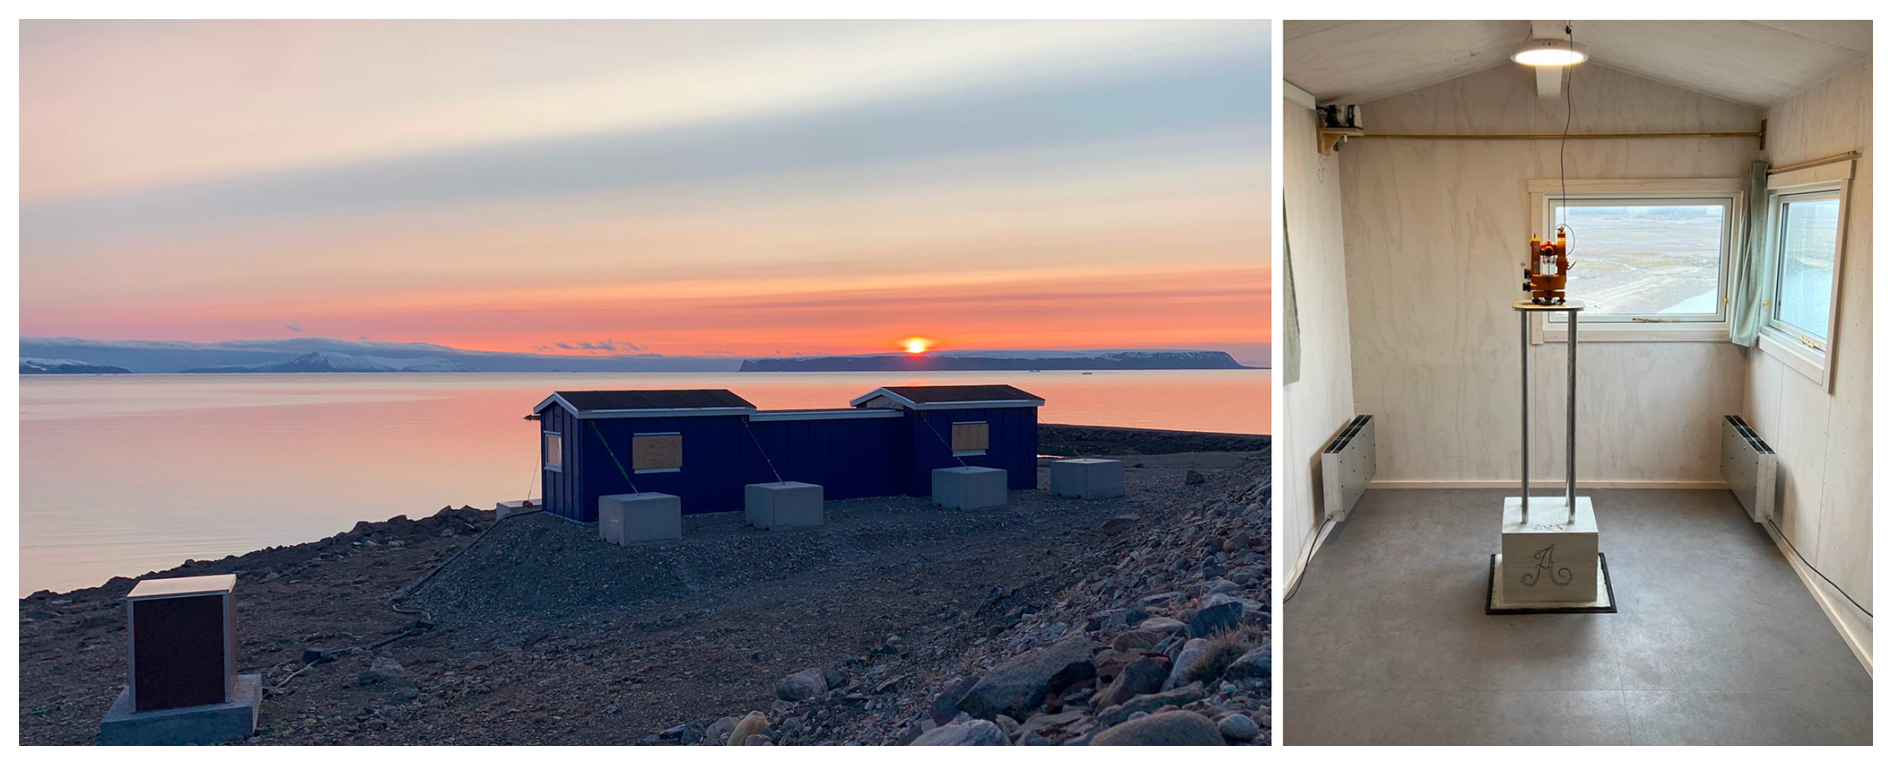
Figure 1The Arctic magnetic observatory at Pituffik, with IAGA code PIF. Left: Exterior view of the observatory. The variometer enclosure is visible in the far-left corner, with the absolute building in the centre connected via a corridor to the electronics building on the right. Right: Interior of the absolute building, showing the fluxgate theodolite mounted on Pillar A (centre) and the scalar instrument located in the upper left corner on location F.
The financial funding for the observatory buildings was ensured in 2021, as part of a larger project named GIOS (Greenland Integrated Observing System), supported by the Danish Agency for Higher Education and Science. The buildings were preassembled near the Brorfelde magnetic observatory (IAGA code BFE), in Denmark, allowing for material testing during construction to ensure magnetic cleanliness. Once completed, the structures were disassembled, packed into containers and shipped to Pituffik in 2022. Due to the short summer season and rough autumn weather in the region, the assembly of the buildings was postponed to 2023. Figure 1 shows the exterior view of the observatory and the interior of the absolute building to the right. A schematic layout of the observatory, including approximate dimensions and distances, is shown in Fig. 2.
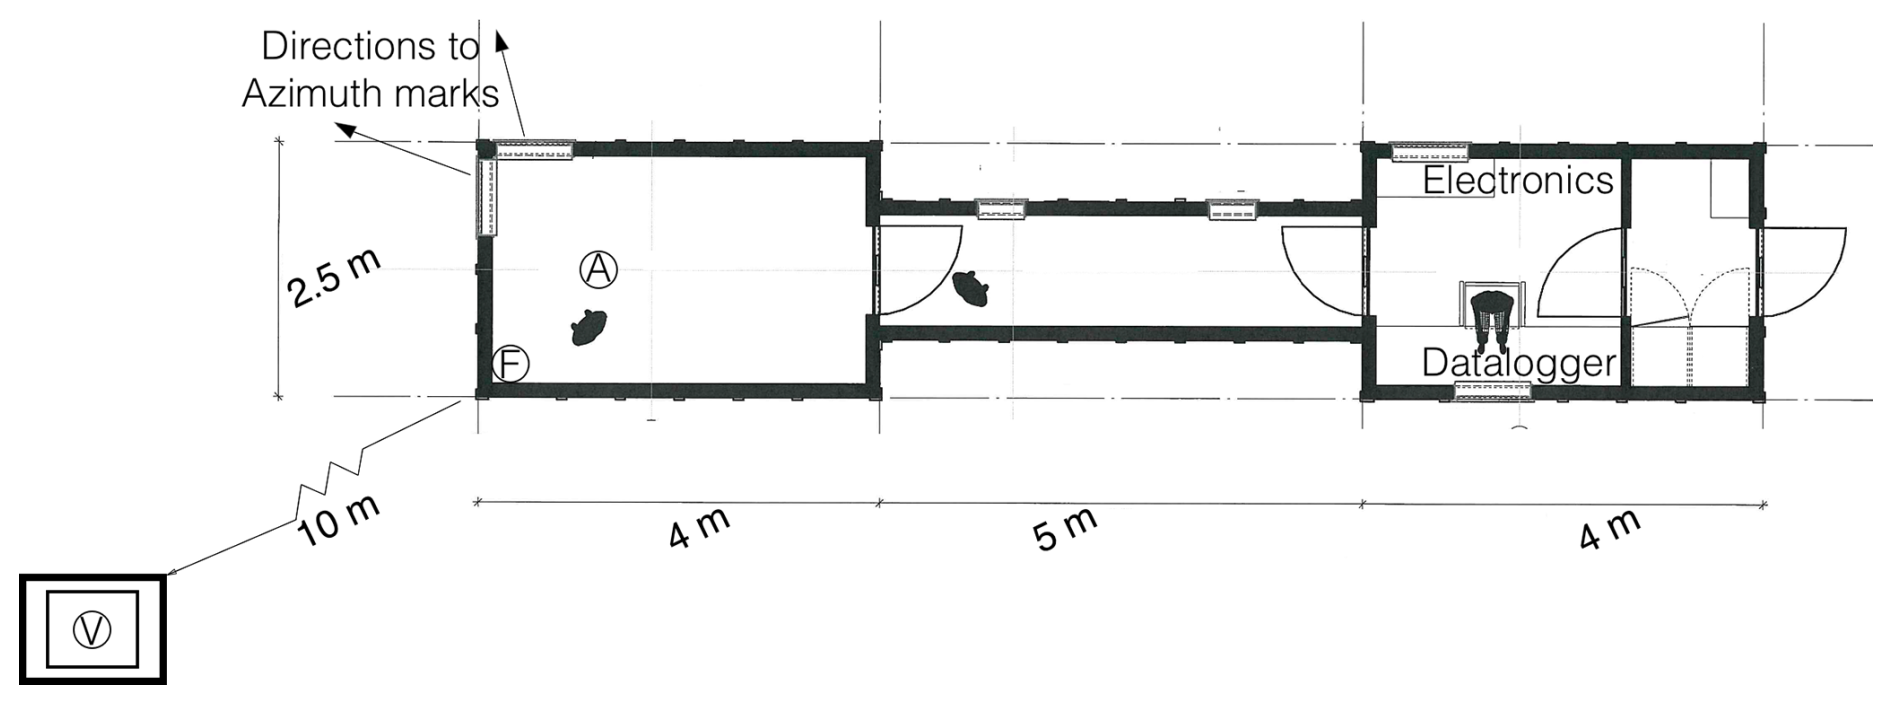
Figure 2Schematic layout of the magnetic observatory at Pituffik (PIF). The electronics building (right) houses the variometer- and scalar electronics and associated data loggers. Magnetic items such as shoes, jackets, and tools are removed and stored in the entrance area. The absolute building (left) contains the scalar magnetometer at location F and the fluxgate theodolite at Pillar A, where absolute magnetic field measurements are conducted. A connecting corridor between the two buildings allows the observer to access the absolute house without exposure to outdoor conditions. The variometer is located approximately 10 m from the absolute building, installed in an insulated enclosure on Pillar V.
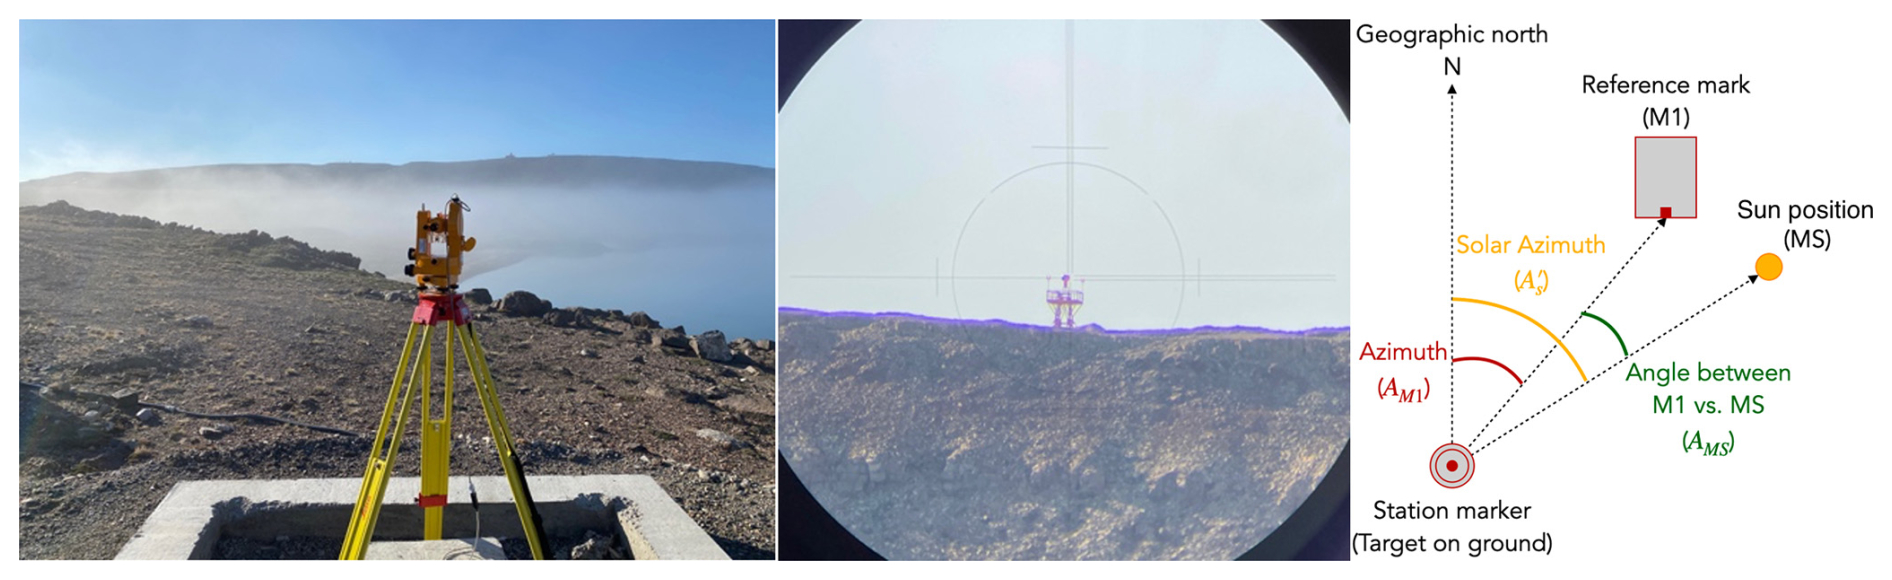
Figure 3Sun observations for azimuth determination. Left: The fluxgate theodolite mounted above the Pillar A foundation at PIF, aligned toward a distant reference mark located several kilometres away. Centre: View of the reference mark (M1) through the theodolite's monocular. Right: Illustration (by Marie V. Eldor) showing the key angles involved in a sun observation. AM1 is the essential azimuth angle for accurate declination measurements.
2.1 Reference mark
Absolute measurements with the fluxgate theodolite require precise knowledge of the instrument's orientation in the horizontal plane. This is achieved by referencing horizontal angle readings from the absolute pillar to a fixed azimuth mark with a known angle relative to true north. The azimuth of the reference mark can be determined through solar observations, using a sun filter mounted on the theodolites monocular. The method used at Pituffik is described in Newitt et al. (1996). Figure 3 shows an example of the sun observation prior the construction in Pituffik, above Pillar A, including one of the reference marks. The figure includes an illustration of the angles, including the azimuth to the reference mark.
2.2 The pillars
The foundations for the variometer pillar (Pillar V) and the declination–inclination pillar (Pillar A) are anchored several meters down to the bedrock and reinforced with fiberglass to ensure long-term stability. Pillar A is constructed with a layer of aerated concrete blocks above the foundation, supporting an aluminium stand with a top plate for mounting the fluxgate theodolite. The scalar instrument is mounted on a simple shelf located in the upper corner of the absolute house (location F). The scalar difference between location F and pillar A was determined through simultaneous measurements using a GSM-19 scalar magnetometer placed at Pillar A.
2.3 Special considerations for Arctic observatories
Due to extreme weather conditions, the presence of polar bears, and the remoteness of the site, special considerations are necessary for Arctic observatories. In Pituffik, personnel typically carry portable, mobile radio devices to ensure reliable communication and to receive alerts – for instance, in the event of sudden, severe weather. The radio devices are magnetic but do not interfere with scientific measurements when kept in the electronics building. Because the absolute and electronics buildings are connected via an enclosed corridor, observers can access the communication devices and maintain contact without going outdoors. For safety, the observatory's main door is equipped with a polar bear-resistant handle made from non-magnetic materials. The main door, corridor, and both buildings also have windows that allow personnel to visually check for polar bears. Additionally, the windows in both buildings can be opened and serve as emergency exits if necessary.
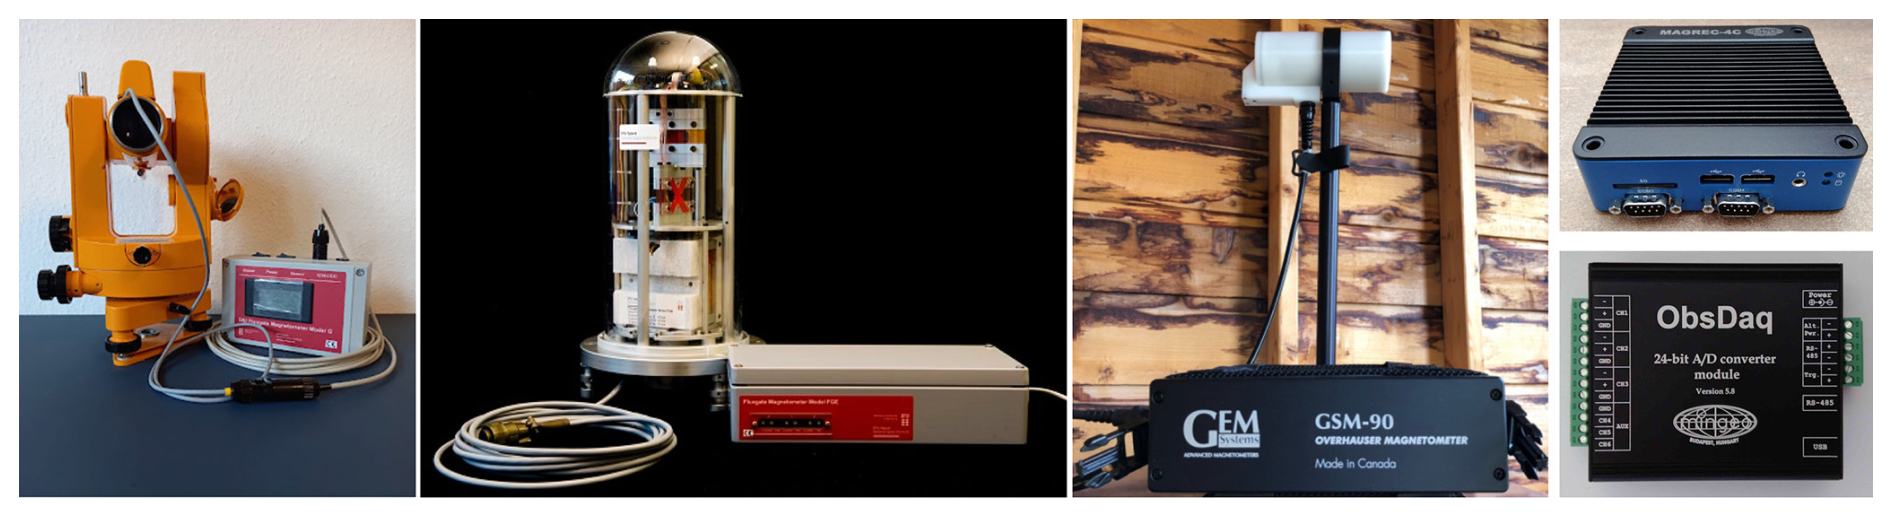
Figure 4DI instrument: Fluxgate theodolite (converted Zeiss THEO 020) with DI Magnetometer Model G (to the left, picture from DTU Space), Variometer: 3-axis Fluxgate Magnetometer Model FGM-FGE (left middle, picture from DTU Space), Scalar instrument: GEM Systems Overhauser GSM-90 Scalar Magnetometer (right middle, the picture is from GEM systems), Datalogger: MinGeo Magrec-4C with ObsDaq 24-bit fast A/D converter (to the right, the pictures are from MinGeo).
The observatory is equipped with DTU Space three-axis fluxgate magnetometer (model FGM-FGE, suspended version, DTU Space, 2025), a GEM Systems Overhauser scalar magnetometer (model GSM-90) (GEM Systems Inc, 2025), and a MinGeo Magrec-4C data logger paired with an ObsDaq 24-bit high-speed analogue-to-digital converter (MinGeo Ltd., 2025). Additionally, a MinGeo fluxgate theodolite (converted Zeiss THEO 020) equipped with DTU Space DI Magnetometer Model G is used for declination and inclination measurements. Pictures of the equipment is shown in Fig. 4.
A variometer station typically consists of a three-axis magnetometer designed for continuous geomagnetic recording, without strict requirements for absolute accuracy. It captures short-term variations with high resolution, while the baselines may drift over time. These baselines are essential to derive the full vector magnetic field at the variometer station and can be determined either through an absolute measurement, i.e., observations of the total field strength, inclination, and declination, or by using geomagnetic model data. The magnetometer at Pituffik was installed in 2013 and has operated as a variometer station since. It is mounted on a well-founded pillar, equipped with temperature regulation, and housed within an insulated, non-magnetic protective enclosure. The long-term data series from this variometer has demonstrated good stability over the years, confirming both the instrument and its location as well-suited for observatory magnetic measurements. It requires high-quality data to reach observatory status, which in turn demands quality-controlled data, temperature control and frequent absolute measurements. These absolute measurements are used to solve the baseline equations, and regular absolute measurements ensure accurate and reliable data (Hansen and Willer, 2020). This section presents the absolute measurement results, temperature stability, and a basic validation of the calibrated data.
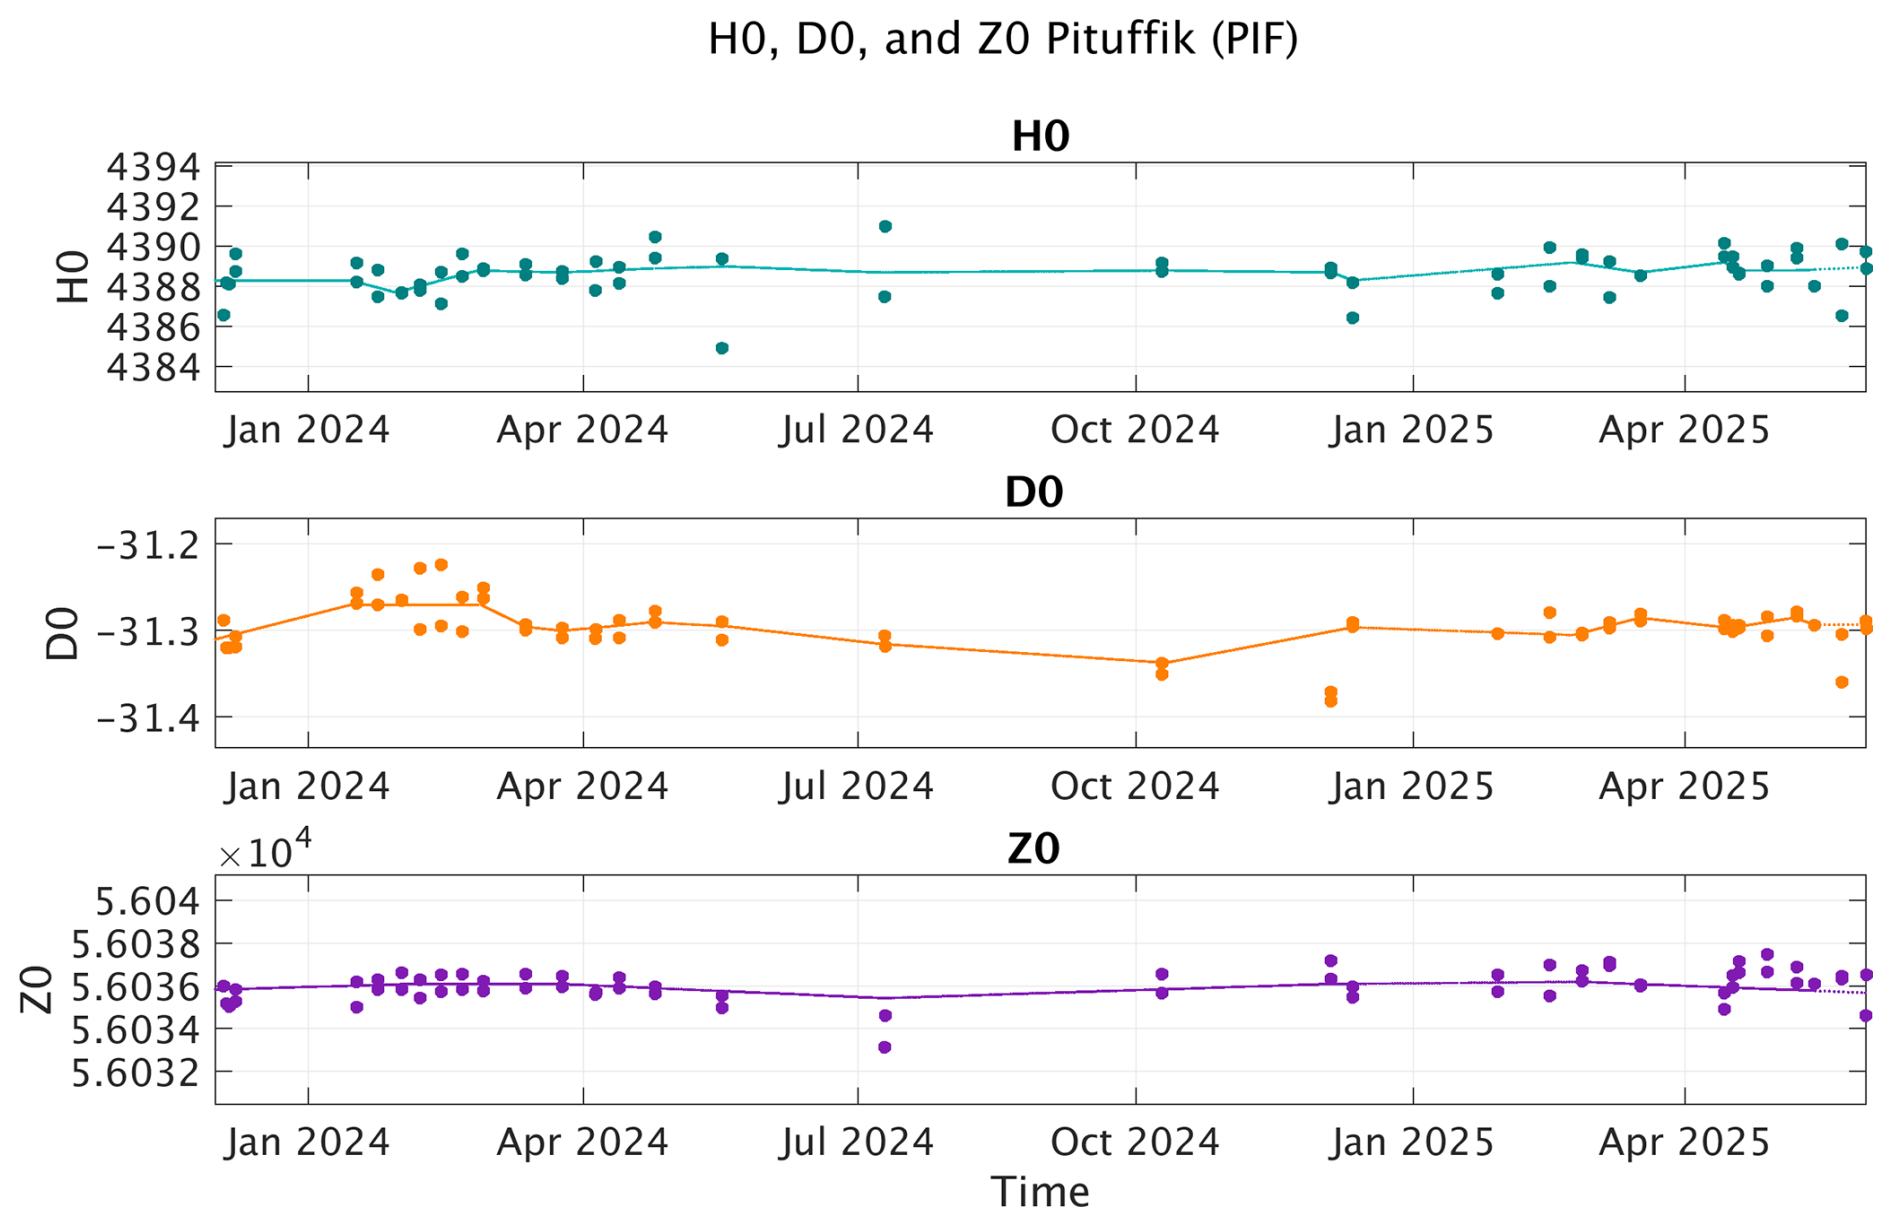
Figure 5Baseline values for the magnetic observatory from December 2023 to May 2025. Dots indicate the baselines from measurements, and the lines indicate the adopted baselines for the observatory. The top panel shows H0, the baseline for the local geomagnetic northward (horizontal) component, in nanotesla (nT). The middle panel shows D0, the baseline for magnetic declination in degrees. The bottom panel shows Z0, the baseline for the vertical component of the magnetic field, also in nanotesla (nT).
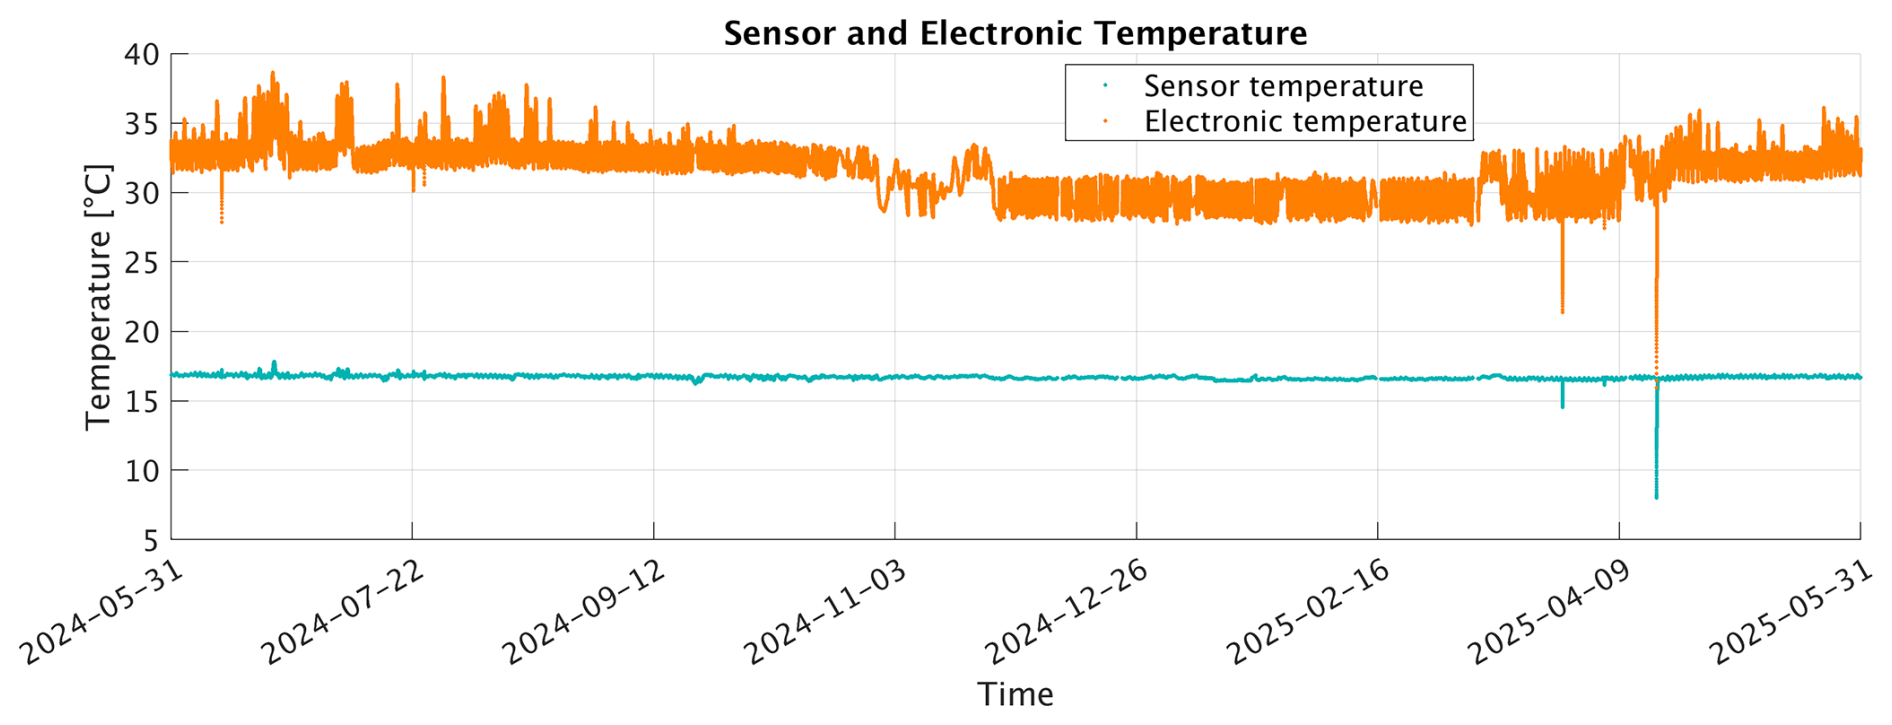
Figure 6Sensor and electronic temperature data (1 s resolution) for the 3-axis FGM-FGE magnetometer at PIF in the period 31 May 2024–31 May 2025.
4.1 Absolute data
The absolute measurements were performed in accordance with the procedure described by Jankowski and Suckstorff (1996). All three baselines appear similar over the observed period, as can be seen in Fig. 5. The baseline for the horizontal component sensor (H0), the declination baseline (D0), and the vertical component baseline (Z0) varies with approximately 4389 nT ± 2 nT, and 56036 nT ± 1.5 nT, respectively.
4.2 Temperature stability
Temperature is continuously monitored and regulated for both the magnetometer sensor located at Pillar V and the electronics housed in the electronics building. Both systems maintain stable temperature conditions throughout the year. Figure 6 presents a representative example, showing one year temperature data from May 2024 to May 2025. During this period, the sensor temperature typically fluctuates around 16.5 °C ± 0.5 °C, while the electronics temperature remains near 30, 31 or 33 °C ± 1.5 °C. Larger electronic temperature variations up to 5 °C can be seen, in particularly the beginning of 2024. The two large temperature spikes seen in both sensor and electronic temperature are probably caused by two power outages.
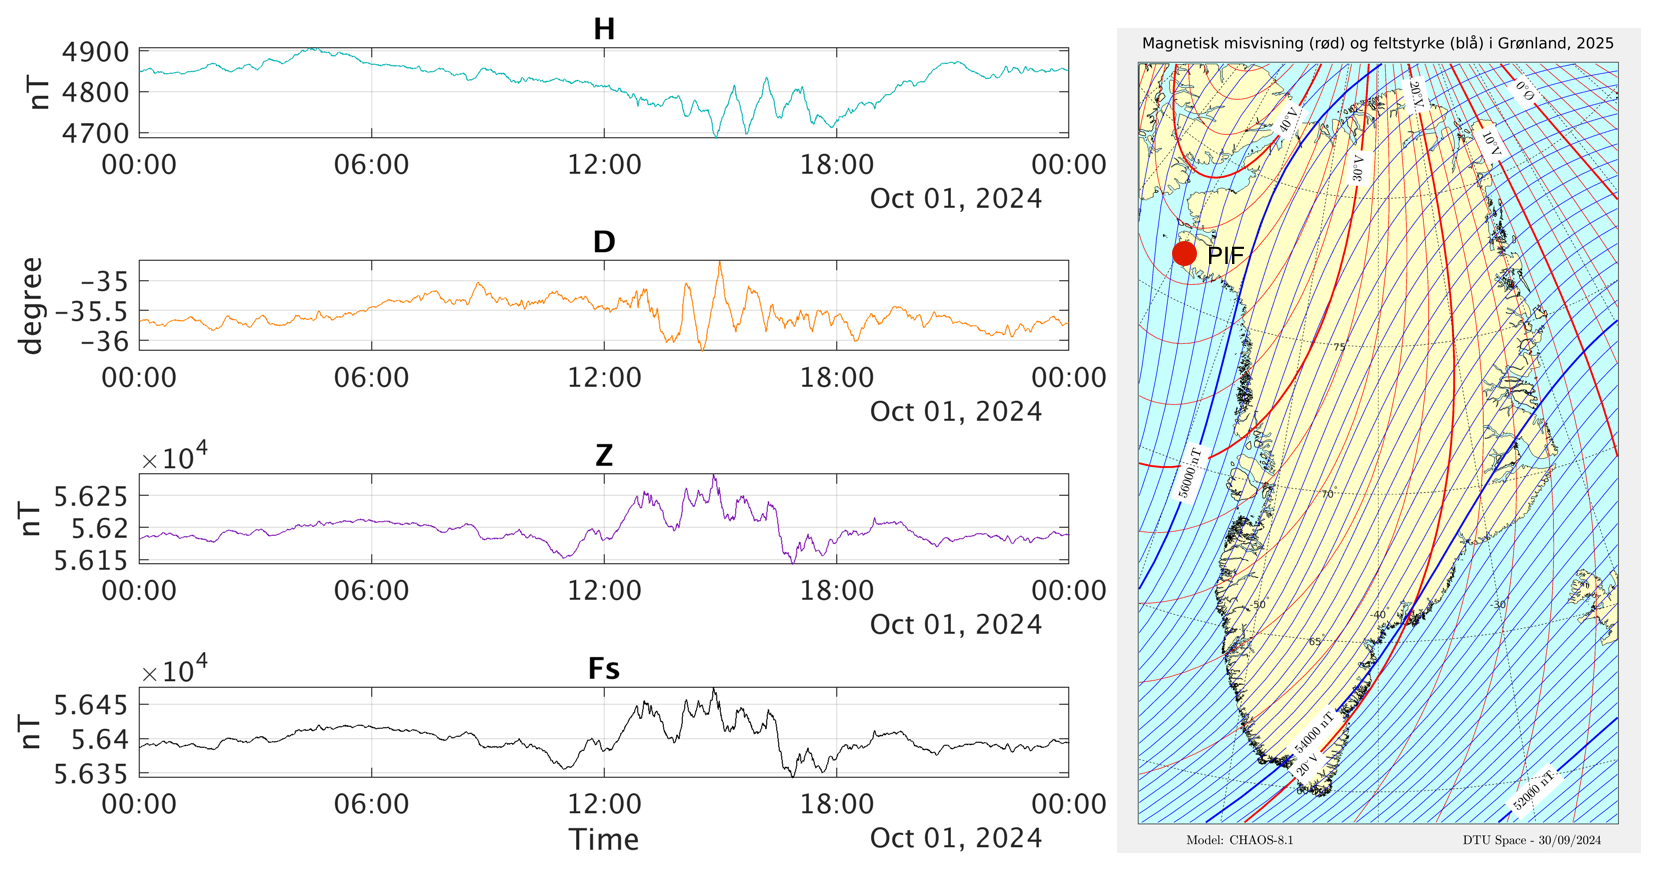
Figure 7To the left: One day data with 1 s resolution, 1 October 2024. Top: The horizontal intensity, H, Middle: The declination, D, and the vertical component Z. Bottom: the measured scalar field Fs. To the right: a map with the declination (red) and total field strength (blue) over Greenland, generated using the CHAOS-8.1 magnetic field model. This model was developed by Clemens Kloss, Chris Finlay and Nils Olsen from DTU Space, who also provided the map. Additionally, the location of Pituffik is marked on the map with a red circle.
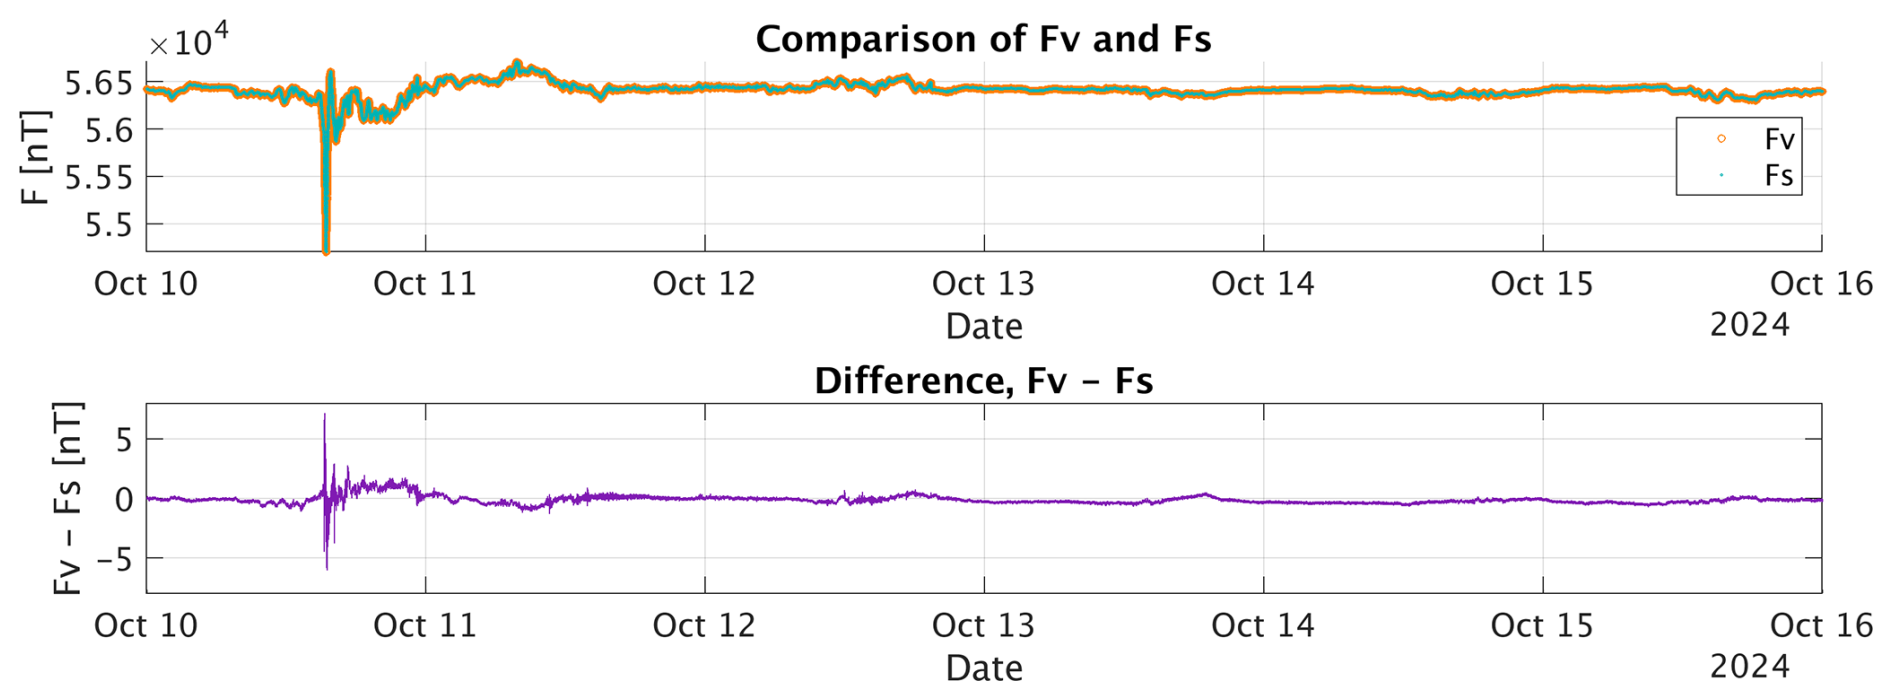
Figure 8Comparison of 1 s scalar magnetic field strength from 10–15 October 2024, including the geomagnetic storm starting 10 October. Top: Measured scalar values (Fs), including the pillar offset correction (in cyan), are shown alongside the calculated scalar field derived from variometer data (Fv, in yellow). Bottom: Difference between the two datasets (Fv-Fs).
4.3 Validation of an example day
The full vector field has been calibrated based on the baseline measurements in Fig 5. As an example, a single day of data from the 1 October 2024 is shown to the left in Fig. 7. According to the CHAOS-8.1 model (Kloss et al., 2024), a declination around −37° is expected nearby PIF in 2025 (see the map to the right in Fig. 7, with the declination in red), fitting well with the declination plot (D plot, to the left in Fig. 7) that varies between approximately −36 and −35°. The model also predicts a scalar field around 56 300 nT, again similar with what the measurements at the observatory gives, see an example in the scalar measurements (Fs) plot, to the left in Fig. 7, showing values around 56 400 nT. Exact agreements between model and measurements are not expected, due to the local crustal and external magnetic field in Greenland. Figure 8 shows an example of the scalar measurements plus the pillar difference measured on site, and the calculated scalar field based on variometer data (Fv). The two datasets, Fs and Fv, show generally good agreement. However, discrepancies are observed during periods of geomagnetic activity. The example from 10–15 October 2024 shows differences within ±7 nT during the storm 10 October, and small differences up to ±0.6 nT the following less active days. These differences may be attributed to limited time synchronization accuracy and different data filtering between the instruments or to localized induced magnetic fields that vary between the two measurement sites. Further investigation is required to determine the exact cause and to identify potential improvements in measurement accuracy and system performance.
The new Arctic magnetic observatory in Pituffik in Greenland is strategically located in a region with sparse coverage of geomagnetic observatories, contributing valuable data from a critical high-latitude area. The site was carefully selected to ensure an undisturbed environment with minimal magnetic interference. The observatory is thoughtfully designed and well-constructed using non-magnetic materials, and it is equipped with high-quality instruments and data acquisition hardware, including temperature-controlled magnetometers.
Routine absolute measurements indicate largely consistent baselines throughout the observation period. The comparison between scalar magnetometer readings and scalar values calculated from variometer data shows overall good agreement. Small discrepancies during periods of magnetic activity may be attributed to local induced magnetic fields, different filtering, or timing inaccuracies between instruments; these effects warrant further investigation to improve data consistency.
Overall, the observatory delivers high-quality magnetic field data and is well-prepared for integration into the global geomagnetic observation network.
The data used in this article can be accessed here: https://doi.org/10.11583/DTU.30903911 (Willer, 2025).
LWP, JO and AW designed the observatory, tested all material during construction, worked on the interior (for example Pillar A), installed the scalar magnetometer and the fluxgate theodolite, made the first absolute measurements, and analysed the data. MVE contributed with text and illustration to Sect. 2.1 Reference mark. AW drafted the manuscript, with all co-authors contributing to its editing.
The contact author has declared that none of the authors has any competing interests.
Publisher's note: Copernicus Publications remains neutral with regard to jurisdictional claims made in the text, published maps, institutional affiliations, or any other geographical representation in this paper. While Copernicus Publications makes every effort to include appropriate place names, the final responsibility lies with the authors. Views expressed in the text are those of the authors and do not necessarily reflect the views of the publisher.
This article is part of the special issue “Geomagnetic observatories, their data, and the application of their data”. It is a result of the XXth IAGA Workshop on Geomagnetic Observatory Instruments, Data Acquisition, and Processing , Vassouras, Brazil, 30 October–6 November 2024.
The authors wish to acknowledge the Danish Agency for Higher Education and Science, that financially supports the GIOS (Greenland Integrated Observing System) project.
The authors used the AI tool ChatGPT (https://chat.openai.com, last access: 1 April 2025) to assist with improving the English language in specific parts of the manuscript.
This research has been supported by the Danish Agency for Science and Higher Education.
This paper was edited by Anne Neska and reviewed by Jürgen Matzka and Yuri Sumaruk.
DTU Space: 3-axis Fluxgate Magnetometer Model FGE, https://www.space.dtu.dk/FGM_FGE (last access: 2 May 2025), 2025.
Emmert, J. T., Richmond, A. D., and Drob, D. P.: A computationally compact representation of magnetic Apex and Quasi-Dipole coordinates with smooth base vectors, J. Geophys. Res., 115, A08322, https://doi.org/10.1029/2010JA015326, 2010.
GEM Systems Inc.: GEM Scalar Magnetometers for Observation, https://www.gemsys.ca (last access: 20 May 2025), 2025.
Hansen, L. T. and Willer, A.: Note on calibration of triaxial fluxgate magnetometers, Tromsø Geophysical Observatory Reports No. 5, https://www.tgo.uit.no/tgor/TGOR5_digital.pdf (last access: 12 April 2025), 2020.
INTERMAGNET: International Real-time Magnetic Observatory Network, https://intermagnet.org (last acccess: 20 May 2025), 2025.
Jankowski, J. and Sucksdorff, C.: Guide for magnetic measurements and observatory prectice. International Association of geomagnetism and Aeronomy, https://www.iaga-aiga.org/data/uploads/pdf/guides/iaga-guide-observatories.pdf (last access: 31 January 2025) 1996.
Kloss, C., Finlay, C. C., Olsen, N., Tøffner-Clausen, L., Gillet, N., and Grayver, A.: The DTU geomagnetic field parent model and derived IGRF-14 candidate models, https://www.spacecenter.dk/files/magnetic-models/CHAOS-8/ (last access: 2 May 2025), 2024.
MinGeo Ltd.: Providing magnetometers and data aquisition systems, https://www.mingeo.com/products.html (last access: 20 May 2025), 2025.
Newitt, L. R., Barton, C. E., and Bitterly, J.: Guide for magnetic repeat station surveys, Determination of azimuth from sun observations, chapter 5.4.2, International Association of Geomagnetism and Aeronomy J.A. Joselyn, Secretary General, NOAA Space Environment Center, 325 Broadway, Boulder, CO 80303-3328, 34–38, USA, ISBN 0-9650686-1-7, 1996.
Willer, A.: Data from the new geomagnetic observatory in Pituffik (PIF), Technical University of Denmark [data set], https://doi.org/10.11583/DTU.30903911, 2025.
- Abstract
- Introduction
- Observatory design, construction and installation
- Equipment specification
- From variometer data to magnetic observatory data
- Conclusions
- Data availability
- Author contributions
- Competing interests
- Disclaimer
- Special issue statement
- Acknowledgements
- Financial support
- Review statement
- References