
the Creative Commons Attribution 4.0 License.
the Creative Commons Attribution 4.0 License.
 | 08 Oct 2026
The ECOSENSE forest: a distributed sensor and data management system for real-time monitoring of ecosystem processes and stresses
Jasmin Tesch

Kathrin Kühnhammer
Delon Wagner
Andreas Christen
Carsten Dormann
Julian Frey
Rüdiger Grote
Teja Kattenborn
Markus Sulzer
Ulrike Wallrabe
Markus Weiler
Christiane Werner
Samaneh Baghbani
Julian Brzozon
Laura Maria Comella
Lea Dedden
Stefanie Dumberger
Yasmina Frey
Matthias Gassilloud
Timo Gerach
Anna Göritz
Simon Haberstroh
Johannes Klüppel
Luis Kremer
Jürgen Kreuzwieser
Hojin Lee
Joachim Maack
Julian Müller
Oswald Prucker
Sanam K. Rajak
Jürgen Rühe
Stefan J. Rupitsch
Helmer Schack-Kirchner
Christian Scharinger
Uttunga Shinde
Till Steinmann
Clara Stock
Josef Strack
Forests provide crucial ecosystem services, but are vulnerable to climate-related physical and biological stresses, such as droughts, pests and pathogens. The rapid climate change currently observed increases the pressure on forest ecosystems, with already drastic consequences, e.g., widespread tree mortality across Central Europe. However, we fall short of understanding underlying process dynamics and their impacts on the Earth system. To better understand and predict forest ecosystem dynamics and the associated energy, carbon and water fluxes, detailed knowledge of ecosystem structure, processes and functioning under constantly varying conditions and across different spatial and temporal scales is needed. The ECOSENSE project brings together engineers, environmental and data scientists to establish novel environmental monitoring approaches and to capture distributed forest carbon and water flux dynamics in space and time with a wide range of established measurement technologies and newly developed sensors. Here, we describe the required infrastructure – called ECOSENSE forest – with regard to physical structures, power supply, communication network and data management, that supports such novel environmental sensor networks. We established a comprehensive monitoring system in this ECOSENSE forest, spanning from below-ground to above-canopy with three large scaffold towers in different plots. More than 670 commercial and 430 self-built sensors monitor over 90 distinct parameters, fluxes, or processes generating upwards of 4500 time series that capture soil, tree and atmosphere processes with high spatial and temporal resolution. In particular, our design objective is to provide a stable, flexible and secure forest research infrastructure with power, communication and data management using low-cost and commercially available components that meet the needs of various research disciplines. Our considerations and experiences provide impulses and practical solutions for establishing robust, distributed field research infrastructures and thus increase data continuity and resilience to disruptions at remote locations. The ECOSENSE forest may thus serve as a blueprint for future projects with similar goals and challenges.
- Article
(5132 KB) - Full-text XML
-
Supplement
(421 KB) - BibTeX
- EndNote


Resilient forest ecosystems are highly relevant for society and an integral part of the UN Sustainable Development Goals (FAO and UNEP, 2020). They contribute to a diverse and productive global biosphere (Storch et al., 2020) and provide significant ecosystem services, including climate regulation (Ehbrecht et al., 2021), carbon sequestration (Pan et al., 2024), drinking water (Winter et al., 2025) and flood protection (Mengist and Soromessa, 2019). Many forests are also used for timber and fuel production (Messier et al., 2022), but at the same time, they harbor biodiversity, health and recreational benefits (Eriksson et al., 2012; Mengist and Soromessa, 2019; Storch et al., 2020).
Despite their adaptive capacities, forest ecosystems are sensitive to abiotic and biological stresses such as climate extremes, pests and pathogens. In particular, under the currently observed rapid climate change, forests have been under unprecedented pressure, resulting, for example, in widespread tree mortality in Central Europe (Hartmann et al., 2022; Schiefer et al., 2025; Schuldt et al., 2020), even reaching local tipping points in ecosystem functioning (Haberstroh et al., 2022, 2026). Increased tree mortality already has negative impacts on, e.g., drinking water quality (Winter et al., 2025) and can shift forest ecosystems to become a net carbon source (Haberstroh et al., 2026).
Forests and their underlying processes are complex ecosystems. Assessing and predicting their dynamics requires detailed information on their structure, processes and functioning under constantly varying influences, i.e., weather, water availability, or biological stresses (De Frenne et al., 2021). Standard forest inventories reveal long-term trends via structural data sampled at multi-year timescales (e.g., George et al., 2022). This temporally and spatially sparse sampling, however, is not suitable to assess the rapid dynamics and impacts of stressors on trees and ecosystems as a result of individual or cumulative weather extremes (Schiefer et al., 2025). While space-based or aerial Earth observation can provide temporally and spatially continuous information on forest conditions, approaches fall short of revealing key processes and abiotic and biotic interactions at the required spatial and physiological detail (International Tree Mortality Network, 2025; Turner et al., 2004; Wang et al., 2010). Flux tower networks, on the other hand, allow for continuous measurements of energy, water and carbon fluxes between forests and the atmosphere (Friend et al., 2007; Gielen et al., 2017), but are incapable of attributing these dynamics to plant functional types, species and individuals.
Plant functional diversity and species-specific responses to environmental stresses such as extreme drought are important controls of ecosystem fluxes (Anderegg et al., 2018; Werner et al., 2021). Moreover, species-specific acclimation and adaptation potential play a key role in ecosystem functioning (Werner et al., 2025). Besides biological controls, small-scale variation in abiotic site conditions, such as plant-available water or microclimate introduce substantial variability in ecosystem dynamics in space and time (De Frenne et al., 2019). Hence, to comprehensively monitor changing forest structure, functioning and diversity and to advance our process understanding of forest carbon and water fluxes, we need novel and distributed observational systems – systems that provide spatially detailed and temporally continuous information on key plant physiological processes at the leaf, tree and ecosystem level, together with information on the variability in soil conditions and canopy microclimates (De Frenne et al., 2025; Mahecha et al., 2024).
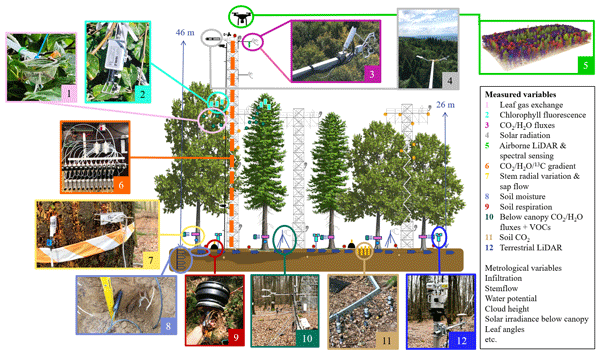
We argue that such an in-depth monitoring of key ecosystem processes and fluxes across different spatial and temporal scales can provide a holistic understanding of ecosystem functioning and disturbance. In the Collaborative Research Center ECOSENSE (SFB 1537), funded by the German Research Foundation, we develop and test novel environmental sensing techniques and apply them to enhance our understanding and modeling of forest functioning and processes (Werner et al., 2024). We consider this fundamental to predict sustainable forest functioning and hence ecosystem services that buffer climate change. Specifically, with a distributed sensor network approach, we study the impact of forest heterogeneity in space and time in response to hydro-climatic extremes and stresses at an unprecedented level of detail (Werner et al., 2024). Currently, we focus on the dynamics of carbon and water fluxes and their driving factors. Figure 1 presents a schematic overview of the multitude of ecosystem measurements conducted. These measurements encompass a wide range of variables collected at the ground as well as within and above the crowns from towers or via drones. For further details, see Sect. 2.6 and Table 1.
ECOSENSE brings together engineers, environmental and data scientists. Utilizing this high level of interdisciplinarity, we aim to establish an efficient and scalable monitoring set-up that captures key components of forest carbon and water fluxes. Data from newly developed sensors can then be validated with established measurement devices and the resulting unprecedented abundance of collected data is used to (1) enable integrated data-driven modeling for process revelation and (2) evaluate assumptions of physiology-oriented models regarding spatial and temporal distribution of process activity. This not only enhances mechanistic understanding but also provides the means for scenario analysis as well as extrapolation to other sites, species and forest structures. The overarching long-term goal of ECOSENSE is thus to use a scientific framework that integrates cutting-edge hardware technologies with data management and analytics to transfer new mechanistic knowledge into comprehensive and transferable modeling and forecasting systems. Developing and deploying such a sensor network in forest ecosystems, however, entails many challenges, which translate to the following six design criteria for distributed forest sensing networks:
-
The structural complexity of forests and the resulting process heterogeneity, even within a single tree, requires a large number of small, lightweight and spatially distributed sensors that measure fluxes, stresses and processes at an exceptional level of detail. The sensors need to be easily distributable, scalable and affordable so they can be deployed in representative quantities on tree leaves and branches, in the soil or on delicate structures.
-
Sensor networks need to measure continuously from minutes to decades to capture the rare nature of climate extremes and their spatial variability. The resolution and continuity of such data streams are typically challenged by power for sensing, storing and transmitting data. Hence, a sensor network system in a forest requires intelligent, resilient and distributed power management and data transmission.
-
Forest sensor networks need to sample in soils, trees, on leaves and in the atmosphere to provide concurrent data across the different ecosystem compartments with enough repetitions to account for spatial and temporal variability.
-
Sensor networks require sufficient robustness to endure challenging and rough environmental conditions (rain, heat, humid and freezing conditions, tree motions, partially with high acceleration and damage caused by animals), as these situations provide the most valuable scientific insights into ecological disturbances and tipping points.
-
Ideally, data from sensor networks are provided in near real-time for rapid analysis to allow for data completeness, (remote) maintenance and assistance, including the planning of special observation campaigns with additional manual measurements or intelligent sampling.
-
Effective data management is required to ensure that the vast and diverse datasets generated by forest sensor networks are centrally stored, standardized in format and accompanied by consistent quality flags and metadata. This enables cross-comparison, the application of deep-learning algorithms and the integration into ecosystem models. It also ensures long-term availability and (re-)usability.
Within the ECOSENSE project, we have embraced these design criteria to develop, test and deploy novel environmental sensors in a prototype forest observatory, called the ECOSENSE forest, located in southwest Germany. Here, we present an overview of the hardware, sensor, power and communication infrastructure that supports our vision of integrated forest sensor networks. We discuss the needs, challenges and implementation of the ECOSENSE forest sensing and data management infrastructure. The concepts, infrastructure and technologies presented are transferable to other environmental and ecological forest observatories and may serve as a blueprint for a novel forest sensing network.
The following section provides a short description of the ECOSENSE forest – its geographical setting, followed by details on power supply, communication infrastructure and the established monitoring system, with a focus on newly developed sensors or self-built and less-common measurement systems. For specific details on deployed hardware and software, see Table S1 in the Supplement. It summarizes essential infrastructure components, including manufacturer and model numbers and also provides additional information, further thoughts and comments from our own practical experience. Devices that are listed in Table S1 and also named in the text are marked with +.
2.1 ECOSENSE forest structure and site conditions
Our experimental site, the ECOSENSE forest, is a mixed temperate forest ecosystem located in the municipality of Ettenheim, Germany at the foothills of the Black Forest (reference point mixed plot tower: 48.26852173° N, 7.87821731° E, WGS-84, height 521 ). The climate is classified as Cfb (temperate air temperature, no dry season, warm summer) in the current Köppen–Geiger climate map (Beck et al., 2023). Mean annual precipitation sum and air temperature at the closest official weather stations are 911 mm (station Ettenheim/Ettenheimmünster 2.71 km to the south, 214 ) and 11.0 °C (station Lahr 11.37 km to the northwest, 156 ), respectively (DWD, 2023, reference period 1991–2020). The managed (low-impact) forest ecosystem is dominated by European beech (Fagus sylvatica L.), interspersed with Norway spruce (Picea abies L.), English oak (Quercus robur L.), European silver fir (Abies alba MILL.), Douglas fir (Pseudotsuga menziesii MIRBEL) and Scots pine trees (Pinus sylvestris L.). Two representative soil profiles were analyzed according to IUSS Working Group WRB (2022): In the southern part of the area a Dystric Stagnic Cambisol (loamic), derived from carbonate-free quaternary loess over strongly weathered mesozoic shell-limestone, is found. Below 40 cm redoximorphic features occur from seasonal water logging. In the northern part a Dystric Skeletic Cambisol (siltic, humic) was identified, derived from carbonate-free quaternary loess over colored/platy sandstone. Below 40 cm a strong platy structure and a high stone content occurs. Both profiles are strongly acidified with a pH (KCl) between 3.5 and 4.5. The forest floor is thin, consisting mostly of OL and shows a patchy OF layer.
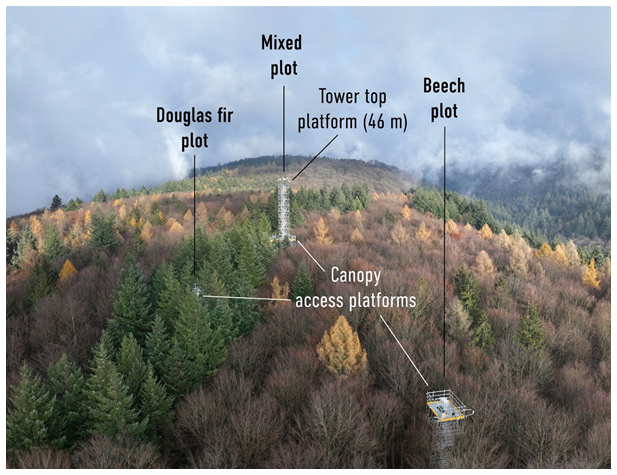
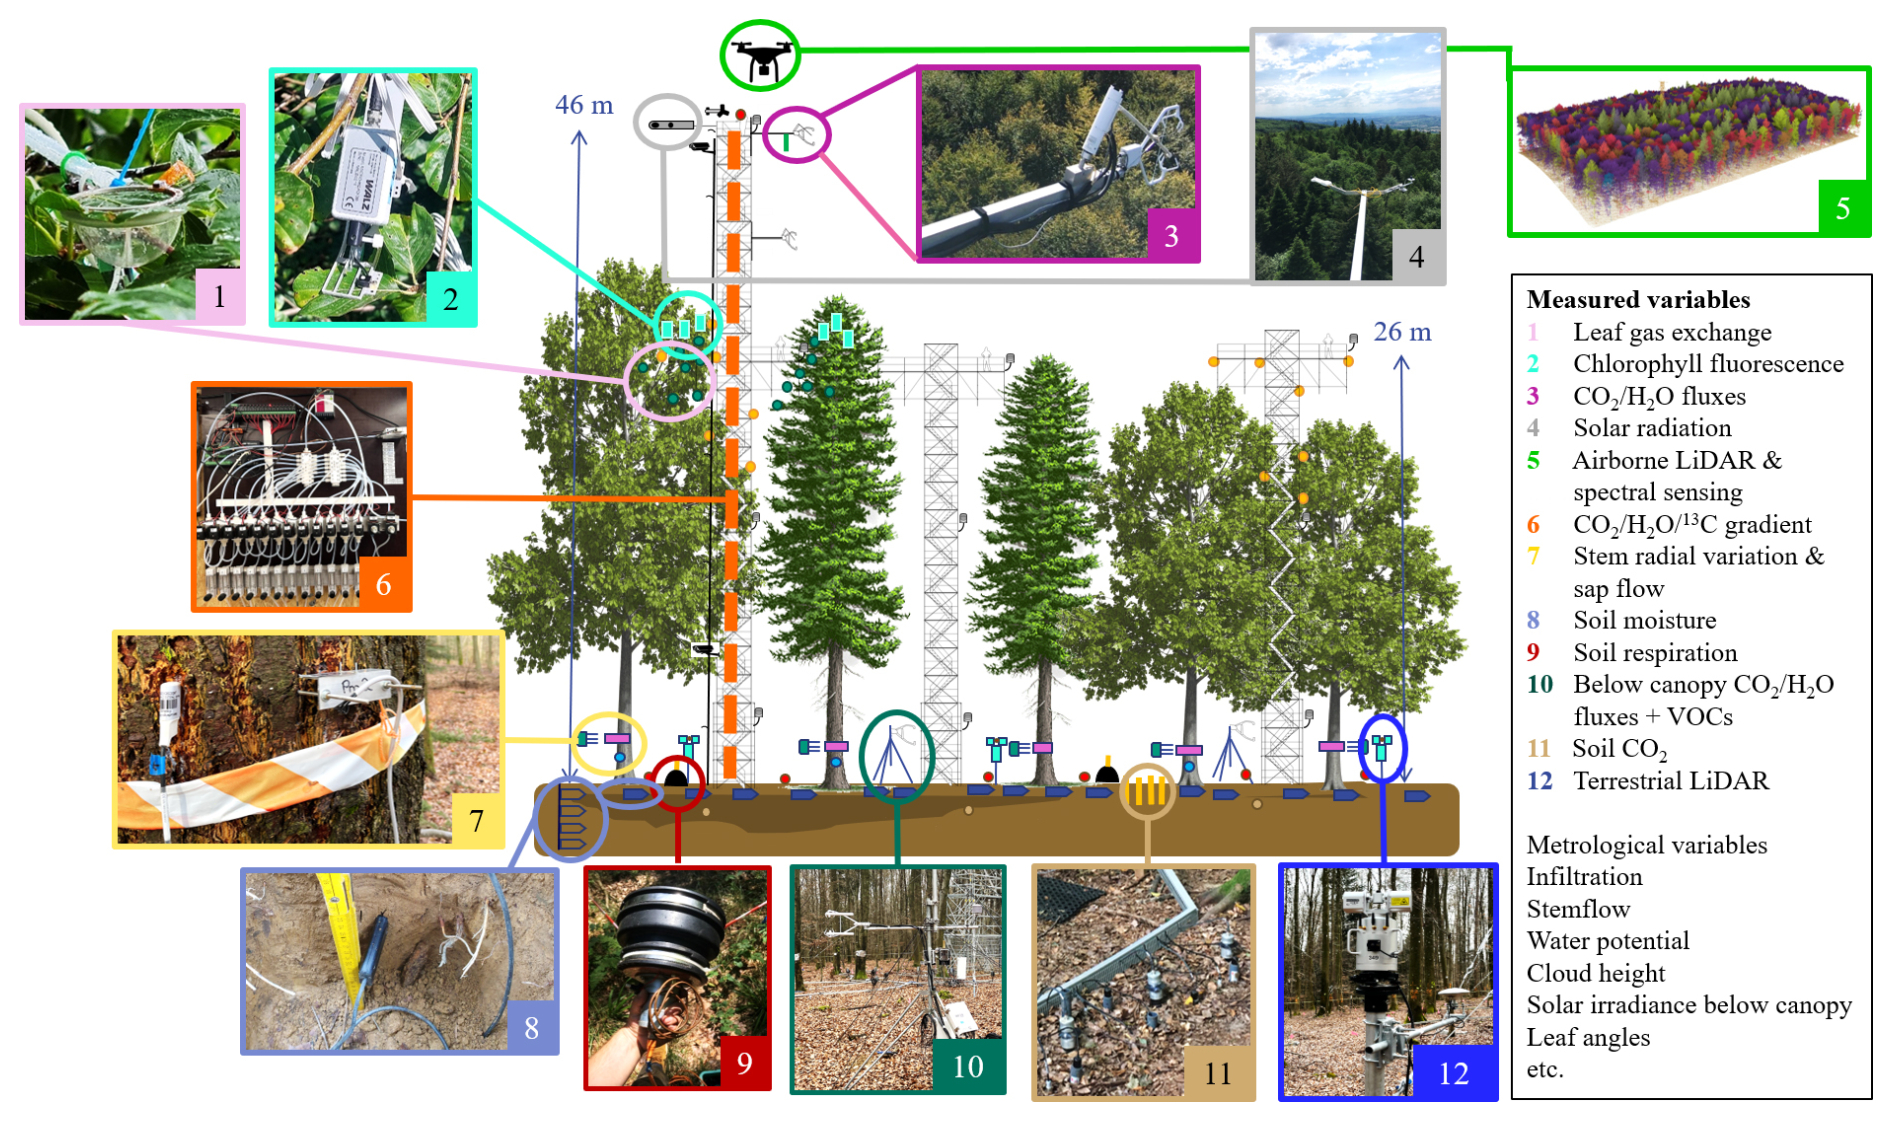
Figure 2Unmanned Aerial Vehicle (UAV) image of the ECOSENSE forest facing north. The three measurement plots are each equipped with a tower platform providing canopy access. The tower at the mixed plot extends above the treetops (total height: 46 m) and is used for above-canopy flux measurements. The wintertime photo from Dec 2024 illustrates the contrasting tree coverage with dominantly coniferous Douglas firs, leafless European beech trees and European larch with yellow foliage.
Figure 3Map of power (left) and communication network infrastructure (right) in the ECOSENSE forest.
2.2 Measurement plots and scaffold towers
In the ECOSENSE forest, we established three intensive measurement plots, of which one is dominated by European beech (“beech plot”), one by Douglas Fir (“Douglas fir plot”) and one contains a mix of the two species (“mixed plot”). Within each of these plots, we installed three scaffold towers that allow access to the tree canopies for sensor installation, manual measurements, e.g., of leaf gas exchange and destructive sampling (Fig. 2). For this purpose, towers were equipped with canopy-access platforms in 24–26 m height. The tower located in the mixed plot extends above the treetops to a total height of 46 m and accommodates an eddy covariance system for continuous measurements of net ecosystem CO2 and H2O fluxes over the forest (Sulzer et al., 2025) as well as other sensors and instruments capturing environmental variables (see Sect. 2.6 for more details). The three towers were placed in an arrangement so that the Douglas fir plot and the beech plot are located within the long-term turbulent footprint (measurement area) of the eddy covariance system at the mixed plot. The scaffold towers were constructed in April 2024. To keep the impact on forest soil, i.e., amount of sealed surface area, as low as possible, we opted for small concrete foundations (in the size of tower base areas, depth 0.80 m) and micropiles (eight per tower, in two different distances from the tower) as anchors for tower guy wires providing static stability. We also operate a weather station at a nearby clearing (see Fig. 3). An additional measurement plot with Silver firs (supplied with power but not connected to the communication network) is located 245 m southeast and downhill from the beech plot.
2.3 Measurement container
Central to our field site infrastructure is a custom-built measurement container (2 m × 4.8 m), mounted on a trailer chassis. It functions as the backbone for power distribution and network connectivity in the field, which will be described in detail in the following sections (see Sect. 2.4 and 2.5). It also houses gas analyzers that are not rated for outdoor use. Since some instruments only function at moderate temperatures and additionally produce considerable heat during operation, the container is ventilated and equipped with a redundant air conditioning system: if one unit fails, the second takes over automatically to maintain cool and stable indoor conditions and avoid overheating of expensive and sensible devices. The interior of the container is insulated with closed-cell rubber foam+ and covered with wooden paneling. This allows for the easy installation of shelves, lighting and additional hardware. The container's sheet metal construction provides inherent protection against lightning strikes. In addition to instruments and IT hardware, the container stores tools, first aid supplies, a defibrillator and work benches for preparing samples and performing small tasks. Pressurized gas cylinders are stored in a separate, lockable metal shed next to the measurement container.
2.4 Power supply
To provide power to the ECOSENSE forest, we tap into the municipal power grid at a high-voltage transformer (20 kV) via a three-phase transformer located around 700 m from the measurement container. Within the container, a three-phase (400 V) power line is routed in and split into multiple fused circuits, effectively distributing power across separate 230 V lines. Individual circuits are additionally protected with fault-current circuit breakers (RCDs) and their respective power consumptions are monitored with power meters+. Those also allow for remote surveillance and shutdown of (parts of) the power supply. Additionally, we use DC-RCDs to protect from DC failures. The entire system is equipped with surge protection, which diverts lightning and other events to ground or short-circuits them. Critical infrastructure and sensitive measuring devices run on uninterruptible power supply units (UPS) within the container to reduce the risk of damage during (short) power failure or current spikes.
For safety reasons, we decided to only provide 230 V AC power within the measurement container, reduce voltage there via AC/DC-converters+ and distribute power across the ECOSENSE forest at protective extra-low voltage (< 50 V DC, DIN norm VDE 0100-410:2018-10). For this, fused power lines+ in cable conduits+ were laid to each of the measurement plots. There, voltages are further converted by DC/DC-converters+, usually to 24 or 12 V, as required by measurement devices and data loggers. The various power lines are galvanically isolated to avoid failure of the entire electricity network in case of, e.g., malfunctional devices or external factors like lightning strikes. We emphasize that it has proven useful that each device connected to the power infrastructure is individually and appropriately fused to avoid negative mutual influence in case of broken equipment or human errors in operations among researchers of different projects. An overview of power supply, distribution and access points across the ECOSENSE forest can be found in Fig. 3.
2.5 Communication network and remote control
Due to limited mobile phone network coverage in the ECOSENSE forest, we decided to install a satellite-based internet access point+. The receiving device was installed on top of the 46 m above-canopy tower (mixed plot). From there, an Ethernet cable+ connects to the main network switch+ inside the measurement container. The whole network in the ECOSENSE forest is directly connected to the network of the University of Freiburg via a VPN (virtual private network) tunnel. This approach facilitates easier access to research data, management systems and underlying servers (see Sect. 3), some of which are only accessible within the university network. Additionally, static IP addresses within a defined address pool can be manually assigned to devices in the ECOSENSE forest. This makes servers, computers and data loggers remotely accessible from the university network or through the university's VPN client. These are centrally managed by the ECOSENSE technicians. The remaining IP addresses available (253 addresses in total) are assigned dynamically to devices connecting to the network on site. The gateway+, which establishes the connection via VPN tunnel, is protected by a Fortinet firewall managed by the RZ (Computing Center) of the University of Freiburg. To restrict and track access from the outside, the University of Freiburg hosts a MAC filter, meaning only computers/servers with pre-registered MAC addresses can connect to the ECOSENSE forest directly. Another possibility for remote access is through the university's VPN client, which requires a login with a personalized user ID. To further enhance network security, the Wi-Fi access points are centrally managed, allowing continuous monitoring of connected clients. The network is secured using WPA2 encryption, which significantly increases the difficulty of unauthorized access. The LoRaWAN (Long Range Wide Area Network, see below) network is secured with AES-128 encryption. This allows us to prevent attacks against the ECOSENSE forest network from both outside and inside.
From the main network switch, the network spans to various other switches+, located at the three plots at ground level, on the tower platforms and at the weather station (see Fig. 3). For the most part, we laid patch cables for connections. Only for the long distance (> 450 m) from the main tower to the clearing with the weather station, we used a coaxial cable that was buried in a tube underground, together with the main power cable. For all important network nodes, intelligent and controllable managed layer-two network switches+ were procured to facilitate remote troubleshooting and allow for remote restart and restriction of data transfer over specific ports. To minimize the risk of surge damage, e.g., in case of lightning strikes, we included surge protectors+ at important network junctions and in front of sensitive and expensive devices, in particular protecting the main network switch and the server+ inside the measurement container. All sensors within the network can regularly retrieve the network time from the field site server to account for a potential time drift.
In addition to connection via Ethernet ports, we installed various Wi-Fi access points+ covering the three main plots (compare Fig. 3). In case an Ethernet cable is damaged or the connection is otherwise faulty, the Wi-Fi network automatically takes over part of the network traffic, offering redundancy and thus increasing network stability.
For newly developed sensors, we provide LoRaWAN as a local data transmission protocol. The PoE (Power over Ethernet) powered LoRaWAN gateways are installed on top of the measurement container and on each tower platform to increase transmission reliability and redundancy. In Europe, LoRaWAN gateways typically operate at 433.05–434.79 MHz (ISM band EU433) or 863–870 MHz (ISM band EU863). Due to its energy efficiency during transmissions, LoRaWAN provides an advantage for sensors that are autonomous or miniaturized. The gateways send their data via the network in the ECOSENSE forest to “The Things Network”, from where the measurements are then pushed to the server inside the measurement container.
Prospectively, network interconnection between plots should be changed to fiber-optic cables, as the amount of data transported is larger than expected, in particular due to sensors with a high temporal resolution or image-based sensors, that were in part not included in the initial project plan. This would also expand network capacity for future technical developments and collaborations that will likely further increase data traffic within the ECOSENSE forest.
2.6 Environmental monitoring setup
We established a comprehensive monitoring system in the ECOSENSE forest across multiple scales, i.e., from leaf to stand level. More than 670 commercial and 430 self-built sensors monitor over 90 distinct parameters, fluxes, or processes generating upwards of 4500 time series that capture soil, tree and atmospheric processes with high spatial and temporal resolution. The volume of incoming data varies considerably throughout the year: on average, we receive 1 GB time series data from in situ sensors per month, while high-throughput instruments such as leaf angle cameras, phenocams, terrestrial LiDAR, isotope and volatile organic compound (VOC) analyzers, and (relaxed) eddy covariance systems generate substantially larger raw data volumes. The field site server handles over 66 TB of traffic per month, of which only 240 GB is transferred to the university, as most raw output is preprocessed on-site and only a small fraction is retained long-term. Campaign data, particularly the monthly LiDAR flights, can produce many gigabytes per flight, but only a much smaller processed version is retained. This processing is carried out outside our server infrastructure. With this large amount of data collected at different scales, we aim to improve upscaling approaches and modeling of ecosystem processes and stresses (see Sect. 4.1).
Table 1Inventory of measured variables in the ECOSENSE forest. Fluxes and processes shown in bold are measured by novel sensors, i.e., those developed within the ECOSENSE project.
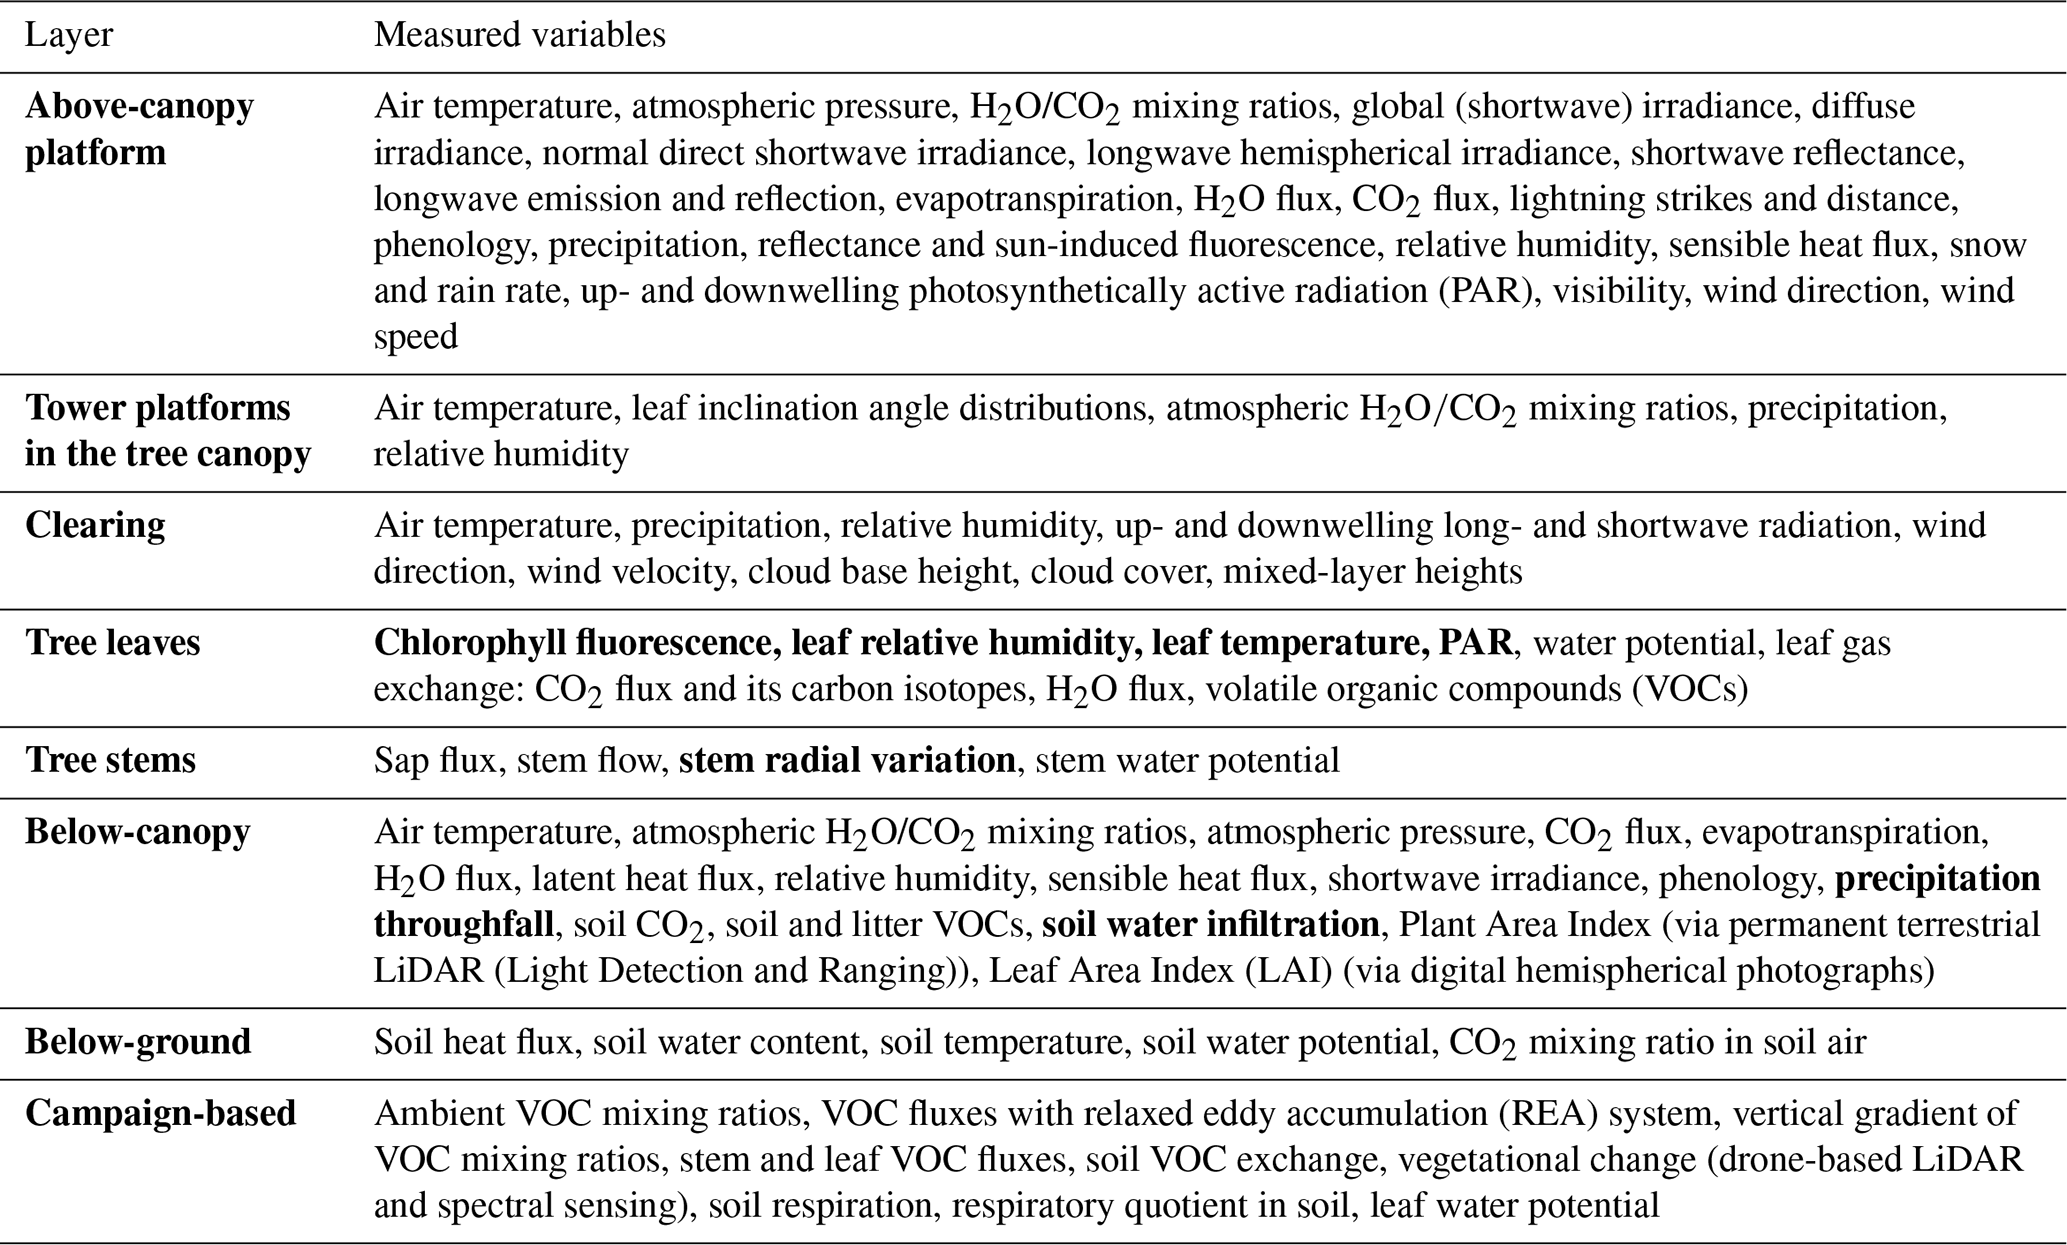
The following inventory (Table 1) provides an overview of the main measured processes and fluxes, based on ecosystem compartments in the ECOSENSE forest. Fluxes and processes shown in bold are measured by novel sensors, i.e., those developed within the ECOSENSE project.
A central feature of the ECOSENSE project is the high spatial resolution of forest measurements, enabled by the deployment of a wide range of sensing technologies. Both commercially available instruments and newly developed sensors were implemented to capture environmental processes across multiple spatial scales. The monitoring system was designed to cover macroscopic (> 10 cm), mesoscopic (< 10 and > 1 cm) and microscopic (< 1 cm) dimensions. Macroscopic sensors were primarily installed on the ground and within tree stems, mesoscopic devices extended measurements into branches and twigs and miniaturized lightweight sensors were attached directly to individual leaves.
In the following, we briefly describe a selection of notable sensors, measurements and systems, from above-canopy to ground-based. We refer to Table S2 for a complete list of all deployed devices, including manufacturers, model numbers, quantities and other useful information, such as associations with larger systems. Devices listed there and mentioned in the text are marked with #.
Monthly airborne LiDAR scans conducted via drone overflights generate geospatial point clouds used to monitor the forest's structure (Gassilloud et al., 2025). To further characterize vegetation structure, permanent terrestrial laser scanners# on the ground provide a daily estimate of the plant area index (Calders et al., 2023). Monthly digital hemispheric photographs# are used to estimate the LAI (Zhang et al., 2005). Both indices represent the amount of plant surface area – either total or leaf-specific – and play a key role in influencing ecosystem processes while providing insight into a changing vegetation structure. Complementing these structural measurements, canopy and below-canopy phenology is tracked with two phenocams# mounted on the mixed plot tower (Brown et al., 2016).
The top tower platform also hosts a high-resolution, non-imaging spectrometer system# for continuous and spectrally resolved measurements of vegetation reflectance and sun-induced chlorophyll-a fluorescence above the canopy. In addition, the same platform supports an above-canopy eddy covariance system# that continuously measures wind fluctuations, air temperature fluctuations and density changes of CO2 and H2O and calculates ecosystem sensible heat, CO2 and H2O fluxes on-site. Approximately 10 m below, a relaxed eddy accumulation (REA)# system (Kunz et al., 2025; Sarkar et al., 2020) is installed to measure VOC fluxes in campaign mode, complemented by soil VOC fluxes (Kreuzwieser et al., 2025). At canopy height (approximately 26 m) a network of 26 leaf-angle cameras# (Kattenborn et al., 2022, 2024; Kremer et al., 2026) monitors leaf movement to investigate radiative transfer, relationships with water supply and related physiological plant stress. Leaf gas exchange, leaf δ13C discrimination and biogenic VOC (BVOC) emissions from 24 leaf enclosures located in the sun and shade canopies of European beech and Douglas fir trees are continuously monitored using a gas sampling system comprising a zero-air supply and automated switching, measurement and flushing units (Werner et al., 2021). Six cavicams# (Brodribb et al., 2016) measure branch shrinking and swelling, enabling continuous monitoring of xylem water potential. Along the tower profile, a custom-built gas sampling system draws air from 12 inlets at different heights for sequential on-site measurements of CO2 and H2O concentrations. With this data we calculate CO2 storage below and inside the canopy used to correct above-canopy eddy covariance measurements (Foken et al., 2012). Inside the measurement container, the air sampled along the height gradient can also be directed to other analyzers usually connected to the leaf gas exchange system mentioned above, e.g., to a carbon isotope and gas concentration analyzer# and a proton-transfer-reaction time-of-flight mass spectrometer# to determine δ13C values and VOC concentrations, respectively. At ground level, eddy covariance measurements are conducted beneath the canopy (Douglas fir and beech plots) (Paul-Limoges et al., 2017). An additional REA system is deployed in the Douglas fir plot. This distributed network enables atmospheric quantification of CO2 and H2O fluxes across different forest strata. In addition to the measurement plots, three intensive soil measurement plots were established near the Douglas fir and mixed towers. At these plots, soil CO2 efflux is estimated using the gradient method (Maier and Schack-Kirchner, 2014), which applies moisture-specific gas diffusivity to determine fluxes at increasing radial distances from three selected tree stems. To continuously monitor soil CO2 dynamics, one of the intensive plots was equipped with low-cost soil CO2 sensors enclosed by specially manufactured gas-permeable membranes, while the other two plots were equipped with established soil CO2 sensors.
Alongside these measurements, an extensive sensor network was deployed across the site to monitor ecosystem functioning at multiple spatial and temporal scales. The most represented sensors at the site include 507 soil moisture probes# distributed across multiple soil depths to quantify infiltration and water availability, 58 sap flux sensors# to assess tree-level water use and 20 soil CO2 sensors# to monitor carbon cycling and related processes such as soil CO2-efflux and water retention. Precipitation is recorded using 20 tipping-bucket gauges# and 13 air temperature and humidity sensors# provide reference data and microclimatic/vertical differences.
In addition to the commercial instruments, a suite of newly developed sensors was deployed to expand measurement capabilities and overcome persistent challenges in environmental monitoring (details in the following paragraph). Rainfall redistribution in the forest is measured by 5 throughfall trough systems# below the canopy and 12 stemflow collar systems# around selected trees. Spread in a stratified sampling pattern across the ECOSENSE forest, 60 self-developed infiltration samplers measure infiltration of both canopy throughfall and stemflow from the forest floor into the soil (Dedden and Weiler, 2026). A total of 33 self-built dendrometers# were installed to record stem radial variation and growth dynamics (Dumberger et al., 2025). Furthermore, newly developed leaf-scale sensors# (Wallrabe et al., 2025) were implemented. These consist of three complementary modules that can function as part of a system but can also be deployed independently: (i) a minimally invasive gas sampling cuvette (ECOvette#) for CO2, δ13C, H2O and VOC fluxes, connected via tubing to a centralized gas analyzer (Frey et al., 2025b), (ii) a sensor module measuring leaf and ambient temperature (Frey et al., 2025a), relative humidity and PAR (Klüppel et al., 2026) and (iii) a chlorophyll fluorescence sensor (Baghbani et al., 2025, 2026). They are operated by newly developed microcontroller platforms that enable unified control (Shinde et al., 2025) and data transmission via the LoRaWAN network+ (Bäumker et al., 2019). There are currently 22 chlorophyll fluorescence sensors#, 27 ECOvettes# and another 22 self-built needle-cuvettes# installed on Douglas fir trees distributed across the forest. All of these are equipped with PAR and temperature sensors#. Cuvettes additionally measure air humidity inside and outside the leaf enclosure.
The functioning of all above-described environmental sensors is regularly challenged by high variability in relative humidity, intensive rainfall and storms, fog (condensation), air temperatures below 0 °C in the winter months, high air temperatures and UV irradiation during the summer months, tree motion and the presence of animals and insects. Under these conditions, all sensors and electronics need to be robust and suitable for long-term and continuous measurements or regular campaigns. We therefore discuss some challenges encountered and the lessons learned from operating the sensor network in the ECOSENSE forest. To ensure water resistance and enhance long-term durability, sensor boards were coated with Plastic70. The electrical contacts remained uncoated for maintenance and reflashing of microcontrollers. Parylene C was used to prevent gas diffusion of newly developed leaf cuvettes. Within the ECOSENSE project, we additionally work on novel, nanostructured perfluoroacrylate-based coatings preventing biofouling and soiling on sensitive sensor surfaces. The exposure to wind and resulting tree motions are particularly challenging for measurement devices attached to branches and leaves, as it can induce vibrations and sudden displacements at high speeds and accelerations. To mitigate this, sufficient slack was left in the power cables and gas sampling tubes connected to affected sensors, allowing them to absorb wind-induced forces. In addition, predetermined breaking points were incorporated into both cables and tubing to reduce the risk of damage. A range of sensors attached to branches and leaves operate on batteries instead of wind-prone power cables, but this introduces other challenges: batteries are difficult to replace in the canopy and add weight that stresses leaves and twigs, counteracting our lightweight design approach. To enhance overall system resilience, we therefore work towards energy autonomy. Wind, however, not only affects sensors but also our towers. We found that they move with unexpected variability under windy conditions. Therefore, in spring 2025, we added tube insulation as tower padding to minimize the impact of towers on surrounding trees and in particular sample branches. Another source of equipment malfunction arises from various animals present in the forest, such as voles, birds, wild boars, snails and insects. Issues arose, e.g., from insects feeding on leaves equipped with cuvettes and voles gnawing on sensors and cables or nesting inside infiltration sampler systems. Combined measures of increased physical barriers and chemical repellents, such as metal grids in the soil, cable channels with steel wool and chili spray on cable insulation, proved effective. Overall, regular maintenance and repair remain tasks whose time expenditure should not be underestimated and should be considered in project planning.
3.1 Data acquisition framework
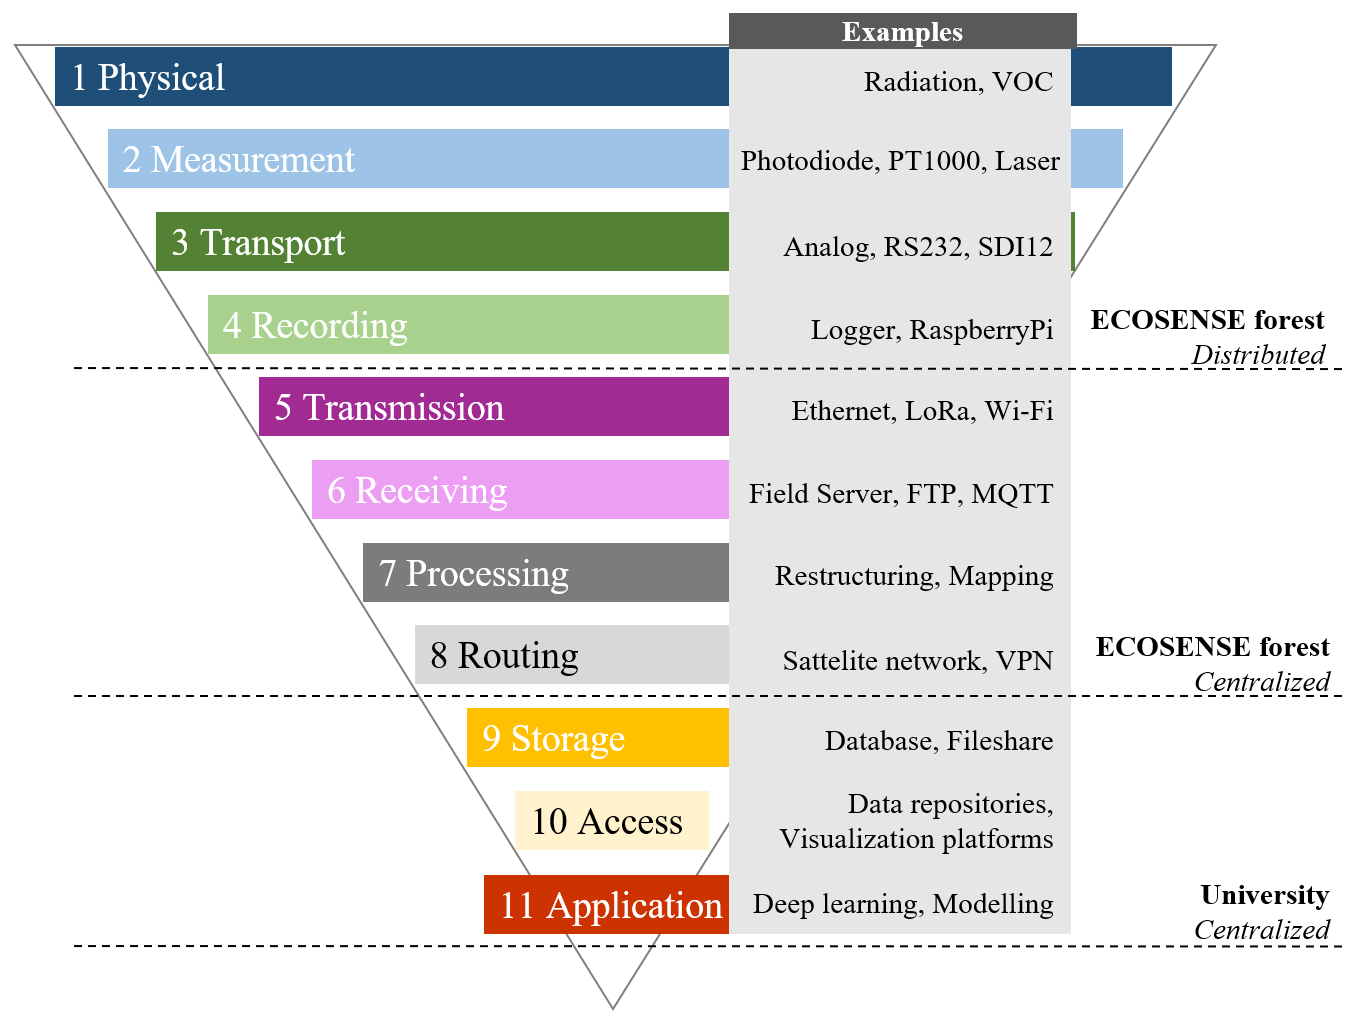
The research data life cycle of the various, heterogeneous data streams originating from all instruments can be structured into a hierarchical data acquisition framework (Fig. 4). The framework resembles a funnel, starting broad with diverse sensors measuring numerous environmental variables across the ecosystem and gradually narrowing as data are transmitted, unified and processed. Ultimately, all streams converge into centralized servers and databases, ensuring structured, consistent and accessible datasets for scientific analysis and long-term archiving.
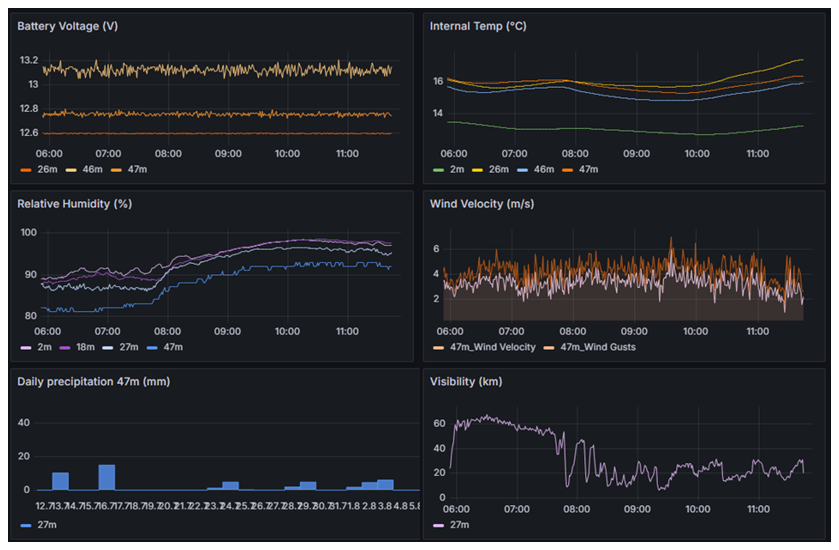
Figure 5Screenshot of Grafana dashboard showing data from weather stations installed on the above-canopy tower.
The physical layer (1) represents all environmental and ecosystem variables and fluxes measured. Sensors directly measure (2) variables or related proxies and transport the data (3) using different communication protocols (e.g., SDI-12, analog, RS232) to recording devices (4), mostly commercial or self-built data loggers. These devices transmit the data (5) via Ethernet, Wi-Fi, or LoRaWAN to various receivers (6), such as the server in the measurement container or “The Things Network”. The server offers a range of services (see also Table S1), e.g., FTP server (file transfer protocol), HTTP interface (hypertext transfer protocol), MQTT (Message Queueing Telemetry Transport) broker, virtual machines with specialized software, e.g., “Node-RED” for processing. All data streams, with the exception of campaign data, which are typically processed off-site, converge at the FTP server hosted on the field site server. The server functions as a central hub for initial data handling (7), i.e., parsing and preprocessing data with Python scripts into a unified format to ensure consistency across data sources and reduce data volume. Once formatted to fit the database structure, the processed data are uploaded directly from the Python script via a dedicated API call, and transmitted to the database within the university network over a VPN-secured, satellite-based internet connection (8). There, time series data are stored (9) in a specific SQL database (“Aquarius”+). Spatial or complex data are temporarily held locally for further processing and made available later on the shared network-attached storage (NAS). The university-based NAS infrastructure functions as a centralized repository, where project members can access (10) data internally – either through file-based access or the SQL database – and interactively explore it using tools such as Grafana (Grafana Labs, 2025, compare Fig. 5). While pure data access is currently restricted to project members, derived data products (see Sect. 4) may already be available. Completed datasets are published in open repositories to ensure open-source accessibility for the wider research community. Meanwhile, the acquired data are actively employed (11) for scientific analyses, including ecosystem model evaluation, model forcing and training of deep learning algorithms (see Sect. 4).
The end of the research data life cycle comprises the structured data publication and archiving, ensuring that data remains Findable, Accessible, Interoperable and Reusable (FAIR, Wilkinson et al., 2016) for future research. This is implemented and supported via the University of Freiburg's publication platform “FreiData” (https://freidata.uni-freiburg.de/, last access: 5 October 2026), which provides storage, registers digital objects and generates their DOIs. For large remote-sensing datasets, such as aerial imagery and LiDAR point clouds that often exceed a volume of several gigabytes, storage and archiving are provided by the domain-specific hubs “deadtrees.earth” (aerial imagery, https://deadtrees.earth/, last access: 5 October 2026) and “3Dtrees.earth” (LiDAR scans, https://3dtrees.earth/, last access: 5 October 2026), which are hosted at the University of Freiburg and supported by the National Infrastructure of the Earth System sciences (NFDI4Earth). These platforms also enable rapid access, interactive web visualization and AI-based data analytics (Möhring et al., 2025; Mosig et al., 2026). In parallel, several data streams recorded in ECOSENSE are ingested in specific databases, including the global PhenoCam Network (https://phenocam.nau.edu/, last access: 5 October 2026) and the European Fluxes Database (https://europe-fluxdata.eu/, last access: 5 October 2026), contributing to broader coordinated environmental monitoring frameworks.
3.2 Data streams in the ECOSENSE forest
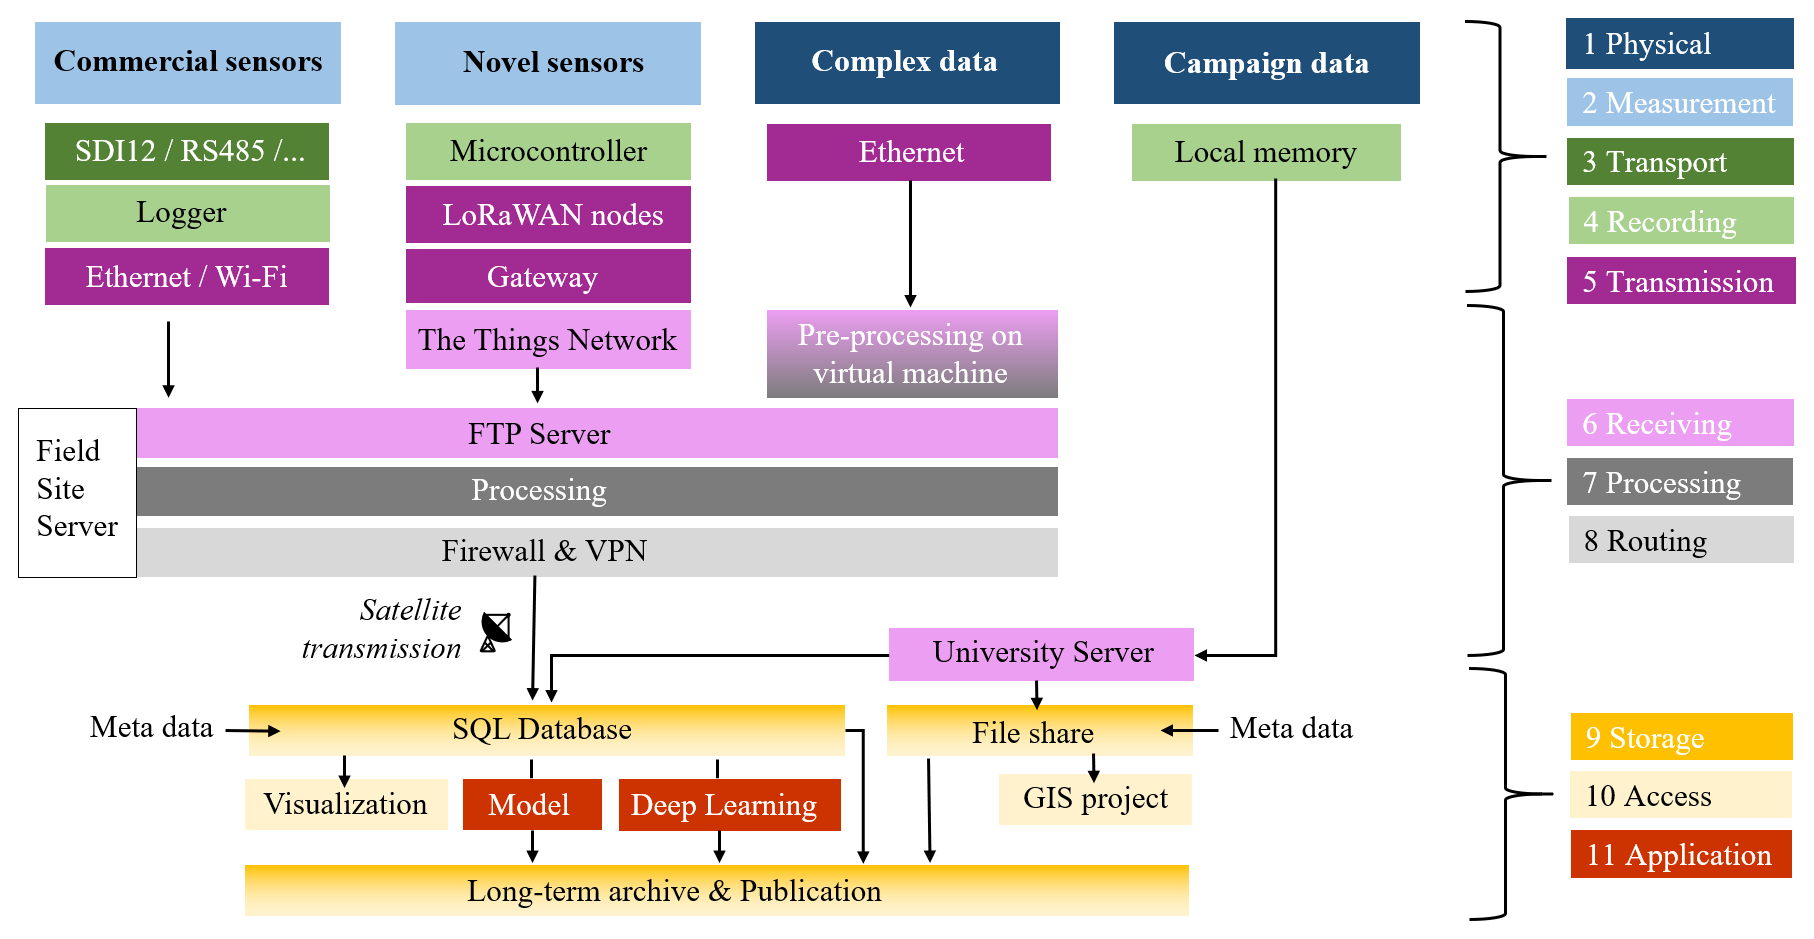
Having defined the layered architecture – from physical measurement through transport, processing, storage, access, quality control and FAIR publication – we now elaborate how this operates from four end-to-end streams from the forest to data publication. We depict four different flows as data are primarily acquired from those distinct sources: (1) commercial sensors which are connected to loggers communicating via Ethernet or Wi-Fi, (2) novel sensor systems, built on low-power microcontrollers transmitting data through wireless LoRaWAN nodes and a LoRaWAN gateway linking to “The Things Network”, (3) scientific instruments producing complex data, such as gradient gas sampling setups and eddy covariance systems that analyze and partially process data on-site using dedicated virtual machines, and (4) campaign-based data collection, where measurements are gathered during field campaigns and stored locally on internal memory devices. These four exemplary data streams, their transmission and application are depicted in Fig. 6.
It is worth noting that the current top-down workflow shown in Figs. 5 and 6 is planned to become a loop. One of the key future directions involves feeding outputs from modeling and deep learning processes back into the field operations. For example, insights gained from pattern recognition could trigger adjustments to a sensor's measurement interval or the number of sensors measuring. This adaptive feedback loop would not only enhance the scientific value of the data but would also improve the efficiency and intelligence of the monitoring setup.
3.3 Data standardization, metadata and quality control
As mentioned above, we aim to ensure the FAIR principles for all data collected. Essential components of FAIR data are the systematic documentation and preservation of metadata associated with all spatial and temporal datasets (Wilkinson et al., 2016). To foster standardized and consistent research data management across all sub-project, the data manager organized a series of workshops covering: (1) an introduction to research data management (RDM) structure, including data collection and transmission; (2) file data upload, including input data parsing, metadata, QA/QC, and time series storage in Aquarius; (3) technical data management, covering FAIR principles, documentation tools and formats, and both commercial and open-access software (e.g., GitLab); (4) geographic information systems, centered on a GIS tutorial introducing users to the ECOSENSE QGIS project; and (5) Aquarius, focusing on the web-based GUI for finding, filtering, visualizing, and downloading data. Acquisition frequencies are set by the respective researchers according to their specific research questions, and in some cases are further constrained by sensor characteristics (e.g., heating phase of sap flow sensors). Rather than homogenizing frequencies across all datasets, we instead rely on Aquarius' processing capabilities to aggregate raw data as needed. For instance, high-frequency precipitation data (1 min resolution) are aggregated into hourly and daily sums. Since measurement frequency requirements vary across modeling approaches and applications, users are expected to further process the data to fit their specific needs. Measurement units are standardized through a parameter and unit list distributed to the consortium at the onset of the project. While this approach worked well for programmable data loggers, other cases required calculation of time series within the database to convert sensor outputs into standardized units (e.g., analog signals from mV, or hPa to kPa).
A key component of the established framework is the assignment of unique sensor IDs that are linked with meta data. Each sensor and its measured time series are accompanied by key contextual information, including spatial coordinates, instrument identifier, data ownership, measured parameter, unit of measurement, sampling interval, observation period and time reference. Due to predetermined and unalterable database architecture, it is not possible to integrate all metadata into the active datasets using a standardized schema. Therefore, upon completion of each time series, metadata are appended in the form of XML or JSON schema files, in accordance with an appropriate metadata standard, i.e., “DataCite” (Brase, 2009). The specific metadata standard is selected in consultation with the Central Data Facility (CDF) of the University of Freiburg and NFDI4Earth, with the goal of ensuring long-term interoperability and broad usability. Our choice of a relational database, compared to alternatives such as HDF5 or ZARR, as the primary data storage system reflects the structure of our time series data, which consist predominantly of tabular sensor time series rather than large multidimensional gridded datasets. However, similar to standards such as the HDF5 group recommendations, we follow the general principle of self-describing, co-located metadata by storing core contextual metadata (as listed above) directly alongside the observations.
In general, the scientific value and (re-)usability of environmental data depend on the data quality. Real-time monitoring enables early detection of anomalies or sensor malfunctions, minimizing data gaps and poor-quality measurements. After data collection, the implementation of quality control procedures is an important aspect within the ECOSENSE project. Rather than removing questionable measurements, nearly all observations are retained and assigned a quality flag on a per-data-point basis. Three categories are applied: good, fair and poor. Data flagged as good have passed certain checks and are deemed reliable for analysis. Data flagged as fair may be plausible but come with uncertainties that might require inspection in further analysis, while poor data should be treated with substantial caution and might not be suitable for subsequent analysis. The only values permanently removed from the dataset are those resulting from major technical failures, where it is certain that no valid measurement was obtained. The type of quality control applied depends on the measured parameter, but common approaches include variance analysis, threshold testing and cross-checking with related variables (e.g., substantial increases in soil moisture must be preceded by precipitation). While some of these processes are automated through scripts, much of the evaluation still relies on expert judgement via visual inspection. Ultimately, the goal is to publish all data with quality flags.
Transforming raw data into meaningful information is a central objective of environmental monitoring and research. This process involves multiple layers of interaction with the data, both in real-time and retrospectively, serving internal and external purposes. At its core, environmental datasets form the foundation for scientific research and publication. They can be analyzed for mechanistic relationships and used for comparative studies and long-term ecological analyses, potentially after development or improvement of physiological process-based models that describe these relations.
4.1 Data repository, ECOSENSE publications and examples for first results
Analysis and interpretation of the wide range of data collected is still ongoing. A current list of publications associated with ECOSENSE can be found on our website (https://uni-freiburg.de/ecosense/publications, last access: 5 October 2026) and by searching for ECOSENSE in FreiDok, the institutional publication repository of the University of Freiburg (https://freidok.uni-freiburg.de, last access: 5 October 2026). After publication, the data used in the respective paper will be made available via FreiData (https://freidata.uni-freiburg.de/communities/ecosense_sfb1537, last access: 5 October 2026).
To illustrate the usage of the data collected at the ECOSENSE forest, we provide a short summary of current publications and manuscripts: Lee et al. (2025) revealed pronounced spatial heterogeneity in forest floor VOC emissions, with strongly enhanced toluene emissions under waterlogged, low-redox conditions, demonstrating the importance of localized emission hotspots for ecosystem VOC budgets. Lee et al. (2026) further showed that tree stems are a highly variable source of VOCs across six major European tree species and, by scaling the measurements with the ECOSENSE forest inventory, quantified the contribution of stem emissions at the ecosystem level. Taking advantage of a variety of tree physiological measurements including our novel in situ leaf cuvette system, Dumberger et al. (2026) investigated inter- and intra-specific differences in leaf gas exchange. They found pronounced differences in seasonal dynamics of stomatal regulation and VOC emissions between the two investigated species and sun and shade leaves, demonstrating the value of data at high temporal and spatial resolution. Making use of extensive soil respiration measurements, our detailed tree species inventory and data on soil physical properties, Brzozon et al. (2026) investigated drivers of soil respiration patterns. They found that temporal patterns were strongly affected by meteorological conditions, while tree species distribution explained some of the spatial heterogeneity. Stock et al. (2026) combined continuous measurements of active chlorophyll fluorescence with eddy flux and meteorological data to investigate the impact of cold spells on forest carbon dynamics. They found species-specific differences of photoinhibition in response to low air temperatures and highlight the value of chlorophyll fluorescence measurements for early stress detection in forest trees.
4.2 Terrestrial ecosystem modeling
The collected data are further used to evaluate models and explain ecosystem responses to environmental changes using data and models. Therefore, it is essential to obtain representative ecological and biophysical knowledge from measurements at small scales, e.g., leaf-level, derive course-effect relationships, put these into functional and process-based relationships and apply rules about how triggers and processes are temporally and spatially related, considering bidirectional interactions and feedback loops (see e.g., Mahecha et al., 2010). Both functional relationships as well as scaling laws have been integrated into physiological-oriented, process-based models such as LandscapeDNDC (Grote et al., 2011a; Haas et al., 2013). This dynamic vegetation model has been initialized, applied and will be further developed with data obtained at the ECOSENSE forest. It has been demonstrated that the model covers full carbon-, nitrogen- and water balances as well as growth responses of various forests (Cameron et al., 2013; Grote et al., 2011b; Mahnken et al., 2022). The intriguing aspect of this model is that it not only considers microclimate in high vertical resolution, but is also capable of representing very small soil- (e.g., N2O, Cade et al., 2021) and plant-related fluxes (incl. BVOCs, Havermann et al., 2022). Such models can serve as an instrument to analyze small scale observations and to use this knowledge to estimate larger-scale impacts of particular environmental influences. Thereby, it is possible to evaluate previous knowledge, estimate unmeasured fluxes (gap-filling), test the plausibility of measurements at different scales, judge the importance of specific findings for the ecosystem response and extrapolate responses beyond observed impacts in scenario analyses. At the same time, measurements will reveal mismatches between real-world responses and the model's virtual reality, which is important information to adjust the model's functionality and parameterization. Confirmatory or deviating results could also guide a reduction and/or intensification/redistribution of sensors in order to increase their efficiency.
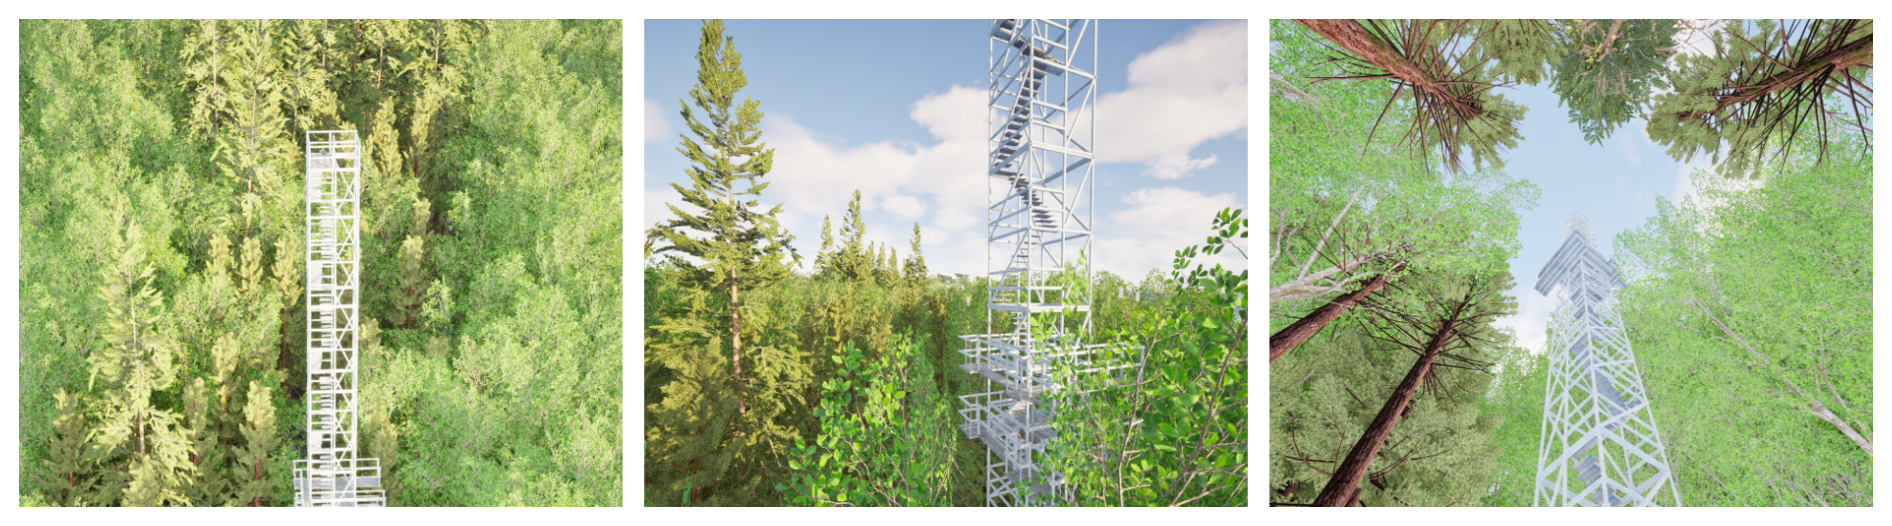
Figure 7Virtual Reality (VR) representation of the ECOSENSE forest based on the 3D Digital twin. The visualizations are based on the Unreal 3D engine, enabling immersive virtual “walks” through the ECOSENSE site.
4.3 Deep-learning
A complementary approach to the described process modeling is a data-driven analysis of interrelations among measurements. The breakthrough in neural network-based machine learning, typically referred to as deep learning or artificial intelligence (AI), also facilitates using a different form of inputs. When traditional statistical and machine-learning approaches use tabular data, deep learning can mix those with time series, images and even sound and video information (Pichler and Hartig, 2023). However, such flexibility comes at a cost: firstly, the amount of data required to fit deep learning models is substantially larger than for the less flexible traditional regression-like approaches; secondly, the resulting multi-dimensional representation of data in such a network typically remains extremely opaque, despite attempts to deduce the main relationships implicitly encoded (through “explainable AI”: Adadi and Berrada, 2018; Briegel et al., 2020; or symbolic regression: Udrescu and Tegmark, 2020). What we get is a representation of the interrelationship of observed data. Since the neural network is ignorant of biology and physics, some of these relationships will be indirect or spurious and this is where the complementarity with the process-based models arises. We can efficiently explore, for specific environmental conditions, how deep-learning models predict the tree or stand response. These data-driven relationships and hypotheses emerging from them can subsequently be tested with physiology-oriented models. Discrepancies between the two approaches can then be investigated in detail. Is the process correctly depicting our biological understanding for this specific situation? Did our process-based understanding lack cardinal components? Or is the lack of auxiliary data the reason why the neural network makes deviating predictions?
4.4 Transforming measurements to a digital twin and virtual reality
To ground model-based analyses in field data, all sensor systems, infrastructure and trees in the three-hectare core zone of the ECOSENSE experiment are precisely georeferenced using GNSS (Global Navigation Satellite System). In the current setup, the main purpose of georeferencing is to ensure consistent relative co-registration of sensors, trees, infrastructure and repeated 3D observations within the ECOSENSE forest. This enables sensor observations to be linked to individual trees, canopy positions and plots, and provides the spatial basis for tree- and plot-level modeling as well as digital twin and virtual reality (VR) applications. Temporal synchronization is tailored to the relevant process dynamics, typically within seconds to minutes, enabling the precise coupling of rapidly interacting processes such as changes in irradiance and resulting responses in chlorophyll fluorescence or leaf temperature. Regular terrestrial and drone-based laser scans capture the architecture and seasonal dynamics of every tree, creating a detailed and living 3D structural model of the forest. This dynamic 3D representation together with the sensor-derived data streams form the foundation for the ECOSENSE 3D digital twin, developed in collaboration with the XR Future Forests Lab at the university campus. Using advanced engines like Unity (Unity Technologies, 2025) and Unreal (Epic Games, 2025), the 3D digital twin is brought to life in immersive VR, offering realistic and interactive experiences of the ECOSENSE site (Fig. 7). VR opens new dimensions for teaching and outreach. It allows hundreds of students to virtually “walk” through the forest without setting foot on site and can bring ECOSENSE to people around the world. Hidden sensors, buried in the soil or perched high in the canopy, become visible and invisible processes like CO2 fluxes, sap flux and soil-plant-atmosphere interactions are animated in space and time. As the temporal coverage of the ECOSENSE forest grows, the 3D digital twin will also allow users to “time travel” through the site's development and dynamics, enabling an interactive and immersive experience of ecological change across years.
4.5 From tree to data stream: field access via QR codes
During the GNSS-assisted inventory of the ECOSENSE site, approximately 1400 trees not only received precise coordinates and a unique identifier, but also a durable physical tag featuring a scannable QR code and an alphanumeric ID. These QR codes can be accessed with any smartphone or tablet and link directly to the ECOSENSE database (Fig. 8). This includes structural properties of that tree as obtained from LiDAR campaigns (e.g., crown volume, height, position) and the sensor-based data streams. Moreover, this system transforms the forest into a living, responsive archive: users in the field can not only instantly retrieve data but they can also input data – whether it is recording a mortality event, updating diameter measurements, or documenting sensor maintenance.
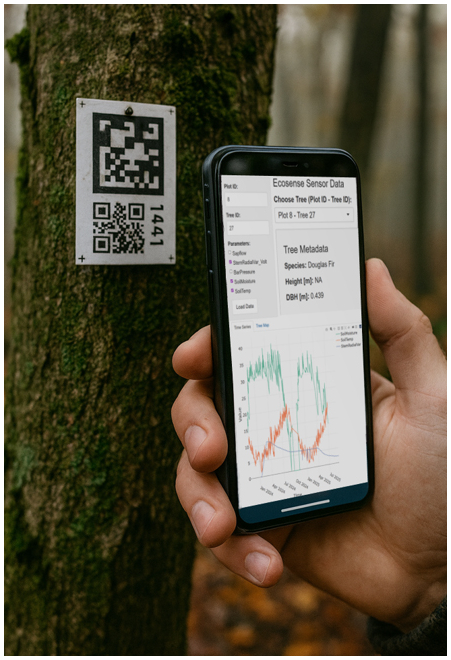
Figure 8Field access to tree-level data streams. Scanning a QR-coded tag on a tree launches the ECOSENSE Shiny app on a smartphone, retrieving the associated tree information, such as time series from the central database.
For students and researchers alike, the QR code acts as a gateway into the tree's digital history. Linked metrics like height, crown dimensions, or growth rates provide insight into individual development. Moreover, time series from associated sensors, such as sap flux or soil moisture, can be directly accessed and visualized on mobile devices, contextualizing tree responses to environmental conditions. In essence, these QR codes turn each tree into a smart node within the digital twin of ECOSENSE, revealing processes and ecological dynamics in real time or from the past.
In response to the growing vulnerability of forest ecosystems to climate-induced stressors, the ECOSENSE forest observatory offers a comprehensive, integrated platform to monitor and better understand ecosystem dynamics. Following our design criteria, the presented infrastructure enables high-resolution sensing, both in space and time, across different ecosystem compartments and scales, with a variety of commercial and novel sensors. We established distributed power and communication systems and a flexible data infrastructure capable of managing, accessing and analyzing heterogeneous, large datasets, also remotely. This co-designed environmental observatory demonstrates the potential of integrated monitoring systems to advance environmental research and inform more effective forest management and conservation strategies.
Designed as a transferable blueprint for future observatories, the ECOSENSE forest showcases how modular, multi-sensor networks can be deployed in structurally complex environments. Establishing the infrastructure – including three measurement towers, grid connections, a measurement container and a site-wide communication network – required more than two years. Beyond financial and technical challenges, the organizational and regulatory demands were considerable, involving expert assessments and permits such as ordnance clearance, species protection evaluations and structural analyses of the tower statics. These experiences underscore the logistical, administrative and environmental complexities involved in building and operating such advanced ecosystem monitoring platforms. This is particularly true for research projects that are often limited to a few years and thus under considerable time pressure.
Despite these challenges, the ECOSENSE forest provides real-world experience for developing similar observatories. While not a one-fits-all solution, ECOSENSE offers practical insights into the design and implementation of integrated monitoring systems. We hope that the descriptions of this field site can support others in establishing similar infrastructures and foster continued innovation in ecosystem monitoring across different environments and research needs.
No data sets were used in this article.
Table S1 provides the bill of materials (BoM) for the monitoring infrastructure, such as network, power supply, and mounting hardware. Table S2 lists the sensors and instruments deployed in the forest to measure ecosystem processes and fluxes. The supplement related to this article is available online at https://doi.org/10.5194/gi-15-253-2026-supplement.
JT, KK and DW prepared the original manuscript with contributions from all co-authors. AC, CD, JF, RG, TK, MS, UW, MW, CW supported the conceptualization of the manuscript. AC, CD, UW, MW, CW, LC, AG, SH, OP JR, SJR, HSK acquired the projects' funding. AC, CD, RG, TK, UW, MW, CQ, AG, JKr, OP, JR, SJR, HSK scientifically supervised the research. KK, DW, JS provided the technical infrastructure and support of the project. JT coordinated the project's data management. JMü did the project administration. MS, SB, JB, LD, SD, YF, MG, TG, AG, SH, JKL, LK, JKr, HL, SKR, US, TS, CSt conducted the research and developments. JT, KK, DW, MS, JMa contributed visualizations. JMa, CSc, JS realized software solutions.
The contact author has declared that none of the authors has any competing interests.
Publisher's note: Copernicus Publications remains neutral with regard to jurisdictional claims made in the text, published maps, institutional affiliations, or any other geographical representation in this paper. The authors bear the ultimate responsibility for providing appropriate place names. Views expressed in the text are those of the authors and do not necessarily reflect the views of the publisher.
The authors gratefully acknowledge the city of Ettenheim for granting access to their forest and supporting the establishment of the ECOSENSE forest research site. We sincerely thank the entire ECOSENSE team, collaborating colleagues and students for their invaluable contributions; special thanks go to our former colleagues, Julia Schwarz, L. Erik Daber, Benjamin Gebert and the late Dr. Cornelia Herschbach. We also thank Salim Soltani, for performing the GNSS-based inventory, including QR-Code installations; and Paul Lakos and Maximilian Sperlich for implementing the ECOSENSE Digital Twin, the virtual reality design and the QR-Code applications. We used AI (ChatGPT) for a final spelling and punctuation check of the manuscript.
We gratefully acknowledge financial support by the German Research Foundation via the Collaborative Research Center ECOSENSE (CRC 1537, Project ID: 459819582).
This open-access publication was funded by the University of Freiburg.
This paper was edited by Jean Dumoulin and reviewed by Thibaud Toullier and one anonymous referee.
Adadi, A. and Berrada, M.: Peeking Inside the Black-Box: A Survey on Explainable Artificial Intelligence (XAI), IEEE Access, 6, 52138–52160, https://doi.org/10.1109/ACCESS.2018.2870052, 2018.
Anderegg, W. R. L., Konings, A. G., Trugman, A. T., Yu, K., Bowling, D. R., Gabbitas, R., Karp, D. S., Pacala, S., Sperry, J. S., Sulman, B. N., and Zenes, N.: Hydraulic diversity of forests regulates ecosystem resilience during drought, Nature, 561, 538–541, https://doi.org/10.1038/s41586-018-0539-7, 2018.
Baghbani, S., Sarlak, A., and Rupitsch, S. J.: B7.1 – Enhanced Signal Detection for Chlorophyll a Fluorescence Signal, in: SMSI 2025 Conference, Sensor and Measurement Science International, 119–120, https://doi.org/10.5162/SMSI2025/B7.1, 2025.
Baghbani, S., Akkoc, U., Klueppel, J., Stock, C., Comella, L. M., Werner, C., and Rupitsch, S. J.: Development of a Low-Cost, Autonomous Pulse Amplitude Modulated (PAM) Chlorophyll Fluorometer for In Situ Monitoring of Photosystem II Efficiency, IEEE Sens. J., 26, 24225–24238, https://doi.org/10.1109/JSEN.2026.3710005, 2026.
Bäumker, E., Miguel Garcia, A., and Woias, P.: Minimizing power consumption of LoRa® and LoRaWAN for low-power wireless sensor nodes, J. Phys. Conf. Ser., 1407, 012092, https://doi.org/10.1088/1742-6596/1407/1/012092, 2019.
Beck, H. E., McVicar, T. R., Vergopolan, N., Berg, A., Lutsko, N. J., Dufour, A., Zeng, Z., Jiang, X., van Dijk, A. I. J. M., and Miralles, D. G.: High-resolution (1 km) Köppen–Geiger maps for 1901–2099 based on constrained CMIP6 projections, Sci. Data, 10, 724, https://doi.org/10.1038/s41597-023-02549-6, 2023.
Brase, J.: DataCite – A Global Registration Agency for Research Data, in: 2009 Fourth International Conference on Cooperation and Promotion of Information Resources in Science and Technology, 257–261, https://doi.org/10.1109/COINFO.2009.66, 2009.
Briegel, F., Lee, S. C., Black, T. A., Jassal, R. S., and Christen, A.: Factors controlling long-term carbon dioxide exchange between a Douglas-fir stand and the atmosphere identified using an artificial neural network approach, Ecol. Model., 435, 109266, https://doi.org/10.1016/j.ecolmodel.2020.109266, 2020.
Brodribb, T. J., Bienaimé, D., and Marmottant, P.: Revealing catastrophic failure of leaf networks under stress, P. Natl. Acad. Sci. USA, 113, 4865–4869, https://doi.org/10.1073/pnas.1522569113, 2016.
Brown, T. B., Hultine, K. R., Steltzer, H., Denny, E. G., Denslow, M. W., Granados, J., Henderson, S., Moore, D., Nagai, S., SanClements, M., Sánchez-Azofeifa, A., Sonnentag, O., Tazik, D., and Richardson, A. D.: Using phenocams to monitor our changing Earth: toward a global phenocam network, Front. Ecol. Environ., 14, 84–93, https://doi.org/10.1002/fee.1222, 2016.
Brzozon, J., Lang, F., Schwarzkopf, P., Kattenborn, T., Frey, J., and Schack-Kirchner, H.: Predictions of spatio-temporal patterns of soil respiration in a mixed forest: Downscaled meteorological data outperform local parameters, bioRxiv [preprint], https://doi.org/10.64898/2026.01.21.700858, 2026.
Cade, S. M., Clemitshaw, K. C., Molina-Herrera, S., Grote, R., Haas, E., Wilkinson, M., Morison, J. I. L., and Yamulki, S.: Evaluation of LandscapeDNDC Model Predictions of CO2 and N2O Fluxes from an Oak Forest in SE England, Forests, 12, 1517, https://doi.org/10.3390/f12111517, 2021.
Calders, K., Brede, B., Newnham, G., Culvenor, D., Armston, J., Bartholomeus, H., Griebel, A., Hayward, J., Junttila, S., Lau, A., Levick, S., Morrone, R., Origo, N., Pfeifer, M., Verbesselt, J., and Herold, M.: StrucNet: a global network for automated vegetation structure monitoring, Remote Sens. Ecol. Conserv., 9, 587–598, https://doi.org/10.1002/rse2.333, 2023.
Cameron, D. R., Van Oijen, M., Werner, C., Butterbach-Bahl, K., Grote, R., Haas, E., Heuvelink, G. B. M., Kiese, R., Kros, J., Kuhnert, M., Leip, A., Reinds, G. J., Reuter, H. I., Schelhaas, M. J., De Vries, W., and Yeluripati, J.: Environmental change impacts on the C- and N-cycle of European forests: a model comparison study, Biogeosciences, 10, 1751–1773, https://doi.org/10.5194/bg-10-1751-2013, 2013.
De Frenne, P., Zellweger, F., Rodríguez-Sánchez, F., Scheffers, B. R., Hylander, K., Luoto, M., Vellend, M., Verheyen, K., and Lenoir, J.: Global buffering of temperatures under forest canopies, Nat. Ecol. Evol., 3, 744–749, https://doi.org/10.1038/s41559-019-0842-1, 2019.
De Frenne, P., Lenoir, J., Luoto, M., Scheffers, B. R., Zellweger, F., Aalto, J., Ashcroft, M. B., Christiansen, D. M., Decocq, G., De Pauw, K., Govaert, S., Greiser, C., Gril, E., Hampe, A., Jucker, T., Klinges, D. H., Koelemeijer, I. A., Lembrechts, J. J., Marrec, R., Meeussen, C., Ogée, J., Tyystjärvi, V., Vangansbeke, P., and Hylander, K.: Forest microclimates and climate change: Importance, drivers and future research agenda, Glob. Change Biol., 27, 2279–2297, https://doi.org/10.1111/gcb.15569, 2021.
De Frenne, P., Beugnon, R., Klinges, D., Lenoir, J., Niittynen, P., Pincebourde, S., Senior, R. A., Aalto, J., Chytrý, K., Gillingham, P. K., Greiser, C., Gril, E., Haesen, S., Kearney, M., Kopecký, M., le Roux, P. C., Luoto, M., Maclean, I., Man, M., Penczykowski, R., van den Brink, L., Van de Vondel, S., De Pauw, K., Lembrechts, J. J., Kemppinen, J., and Van Meerbeek, K.: Ten practical guidelines for microclimate research in terrestrial ecosystems, Methods Ecol. Evol., 16, 269–294, 2025.
Dedden, L. and Weiler, M.: Technical note: An innovative monitoring approach to measure spatio-temporal throughfall patterns in forests, Hydrol. Earth Syst. Sci., 30, 3245–3261, https://doi.org/10.5194/hess-30-3245-2026, 2026.
Dumberger, S., Kinzinger, L., Weiler, M., Werner, C., and Haberstroh, S.: Dynamic Shifts in Radial Sap Flow of Two Temperate Tree Species in Response to the Dry Summer 2022, Ecohydrology, 18, e70054, https://doi.org/10.1002/eco.70054, 2025.
Dumberger, S., Frey, Y., Stock, C., Wehlings-Schmitz, S., Wagner, D., Kühnhammer, K., Dedden, L., Weiler, M., Sulzer, M., Christen, A., Kreuzwieser, J., Wallrabe, U., Werner, C., and Haberstroh, S.: Seasonal dynamics and sun/shade heterogeneity of leaf gas exchange and VOC emissions inside a tall temperate forest canopy, Tree Physiol., 46, tpag111, https://doi.org/10.1093/treephys/tpag111, 2026.
DWD: Vieljährige Mittelwerte – Temperatur und Niederschlag, https://dwd.de/DE/leistungen/klimadatendeutschland/vielj_mittelwerte.html (last access: 2 September 2025), 2023.
Ehbrecht, M., Seidel, D., Annighöfer, P., Kreft, H., Köhler, M., Zemp, D. C., Puettmann, K., Nilus, R., Babweteera, F., Willim, K., Stiers, M., Soto, D., Boehmer, H. J., Fisichelli, N., Burnett, M., Juday, G., Stephens, S. L., and Ammer, C.: Global patterns and climatic controls of forest structural complexity, Nat. Commun., 12, 519, https://doi.org/10.1038/s41467-020-20767-z, 2021.
Epic Games: Unreal Engine, Version 5.6, https://unrealengine.com/ (last access: 5 October 2026), 2025.
Eriksson, L., Nordlund, A. M., Olsson, O., and Westin, K.: Recreation in Different Forest Settings: A Scene Preference Study, Forests, 3, 923–943, https://doi.org/10.3390/f3040923, 2012.
FAO and UNEP: The State of the World's Forests 2020, FAO and UNEP, 2020.
Foken, T., Leuning, R., Oncley, S. R., Mauder, M., and Aubinet, M.: Corrections and Data Quality Control, in: Eddy Covariance: a practical guide to measurement and data analysis, edited by: Aubinet, M., Vesala, T., and Papale, D., Springer Netherlands, Dordrecht, 85–131, https://doi.org/10.1007/978-94-007-2351-1_4, 2012.
Frey, Y., Simon, L., Dumberger, S., Werner, C., and Wallrabe, U.: Sensor Evaluation for Leaf Temperature within a minimally invasive leaf cuvette, Sensor. Actuats A-Phys., 396, 117045, https://doi.org/10.1016/j.sna.2025.117045, 2025a.
Frey, Y., Dumberger, S., Haberstroh, S., Werner, C., and Wallrabe, U.: The ECOvette: Unveiling Plant Dynamics Through Direct Leaf Emission Analysis, ACS EST Eng., 5, 3096–3106, https://doi.org/10.1021/acsestengg.5c00462, 2025b.
Friend, A. D., Arneth, A., Kiang, N. Y., Lomas, M., Ogée, J., Rödenbeck, C., Running, S. W., Santaren, J.-D., Sitch, S., Viovy, N., Ian Woodward, F., and Zaehle, S.: FLUXNET and modelling the global carbon cycle, Glob. Change Biol., 13, 610–633, https://doi.org/10.1111/j.1365-2486.2006.01223.x, 2007.
Gassilloud, M., Koch, B., and Göritz, A.: Occlusion mapping reveals the impact of flight and sensing parameters on vertical forest structure exploration with cost-effective UAV based laser scanning, Int. J. Appl. Earth Obs. Geoinf., 139, 104493, https://doi.org/10.1016/j.jag.2025.104493, 2025.
George, J.-P., Bürkner, P.-C., Sanders, T. G. M., Neumann, M., Cammalleri, C., Vogt, J. V., and Lang, M.: Long-term forest monitoring reveals constant mortality rise in European forests, Plant Biol., 24, 1108–1119, https://doi.org/10.1111/plb.13469, 2022.
Gielen, B., de Beeck, M. O., Loustau, D., Ceulemans, R., Jordan, A., and Papale, D.: Integrated carbon observation system (ICOS): An infrastructure to monitor the european greenhouse gas balance, in: Terrestrial Ecosystem Research Infrastructures, CRC Press, 505–520, https://doi.org/10.1201/9781315368252-25, 2017.
Grafana Labs: Grafana v11.5.1, https://grafana.com/docs (last access: 24 September 2025), 2025.
Grote, R., Korhonen, J., and Mammarella, I.: Challenges for evaluating process-based models of gas exchange, For. Syst., 20, 389–406, https://doi.org/10.5424/fs/20112003-11084, 2011a.
Grote, R., Kiese, R., Grünwald, T., Ourcival, J.-M., and Granier, A.: Modelling forest carbon balances considering tree mortality and removal, Agr. Forest Meteorol., 151, 179–190, https://doi.org/10.1016/j.agrformet.2010.10.002, 2011b.
Haas, E., Klatt, S., Fröhlich, A., Kraft, P., Werner, C., Kiese, R., Grote, R., Breuer, L., and Butterbach-Bahl, K.: LandscapeDNDC: a process model for simulation of biosphere–atmosphere–hydrosphere exchange processes at site and regional scale, Landsc. Ecol., 28, 615–636, https://doi.org/10.1007/s10980-012-9772-x, 2013.
Haberstroh, S., Werner, C., Grün, M., Kreuzwieser, J., Seifert, T., Schindler, D., and Christen, A.: Central European 2018 hot drought shifts scots pine forest to its tipping point, Plant Biol., 24, 1186–1197, https://doi.org/10.1111/plb.13455, 2022.
Haberstroh, S., Christen, A., Sulzer, M., Scarpa, F., and Werner, C.: Recurrent hot droughts cause persistent legacy effects in a temperate Scots Pine forest, Plant Biol., 28, 622–636, https://doi.org/10.1111/plb.70066, 2026.
Hartmann, H., Bastos, A., Das, A. J., Esquivel-Muelbert, A., Hammond, W. M., Martínez-Vilalta, J., McDowell, N. G., Powers, J. S., Pugh, T. A. M., Ruthrof, K. X., and Allen, C. D.: Climate Change Risks to Global Forest Health: Emergence of Unexpected Events of Elevated Tree Mortality Worldwide, Annu. Rev. Plant Biol., 73, 673–702, https://doi.org/10.1146/annurev-arplant-102820-012804, 2022.
Havermann, F., Ghirardo, A., Schnitzler, J.-P., Nendel, C., Hoffmann, M., Kraus, D., and Grote, R.: Modeling Intra- and Interannual Variability of BVOC Emissions From Maize, Oil-Seed Rape, and Ryegrass, JAMES, 14, e2021MS002683, https://doi.org/10.1029/2021MS002683, 2022.
International Tree Mortality Network: Towards a global understanding of tree mortality, New Phytol., 245, 2377–2392, https://doi.org/10.1111/nph.20407, 2025.
IUSS Working Group WRB: World Reference Base for Soil Resources. International soil classification system for naming soils and creating legends for soil maps, 4th edn., International Union of Soil Sciences (IUSS), Vienna, Austria, 2022.
Kattenborn, T., Richter, R., Guimarães-Steinicke, C., Feilhauer, H., and Wirth, C.: AngleCam: Predicting the temporal variation of leaf angle distributions from image series with deep learning, Methods Ecol. Evol., 13, 2531–2545, https://doi.org/10.1111/2041-210X.13968, 2022.
Kattenborn, T., Wieneke, S., Montero, D., Mahecha, M. D., Richter, R., Guimarães-Steinicke, C., Wirth, C., Ferlian, O., Feilhauer, H., Sachsenmaier, L., Eisenhauer, N., and Dechant, B.: Temporal dynamics in vertical leaf angles can confound vegetation indices widely used in Earth observations, Commun. Earth Environ., 5, 550, https://doi.org/10.1038/s43247-024-01712-0, 2024.
Klüppel, J., Jurczak, M., Wallrabe, U., and Comella, L. M.: Calibration of Multi-Spectral Photosynthetically Active Radiation Sensor, Measurement, 270, 120734, https://doi.org/10.1016/j.measurement.2026.120734, 2026.
Kremer, L., Pisek, J., Richter, R., Frey, J., Lusk, D., Werner, C., Wirth, C., and Kattenborn, T.: AngleCam V2: Predicting leaf inclination angles across taxa from daytime and nighttime photos, Biogeosciences, 23, 5607–5624, https://doi.org/10.5194/bg-23-5607-2026, 2026.
Kreuzwieser, J., Lee, H., Köhler, A., Christen, A., Sulzer, M., Schack-Kirchner, H., Brzozon, J., Lang, F., Daber, L. E., Bechtold, R., and Werner, C.: Biotic and abiotic factors controlling terpenoid exchange from soil of a mixed temperate forest ecosystem, Soil Biol. Biochem., 211, 109991, https://doi.org/10.1016/j.soilbio.2025.109991, 2025.
Kunz, A.-K., Borchardt, L., Christen, A., Della Coletta, J., Eritt, M., Gutiérrez, X., Hashemi, J., Hilland, R., Jordan, A., Kneißl, R., Legendre, V., Levin, I., Preunkert, S., Rubli, P., Stagakis, S., and Hammer, S.: A relaxed eddy accumulation flask sampling system for 14C-based partitioning of fossil and non-fossil CO2 fluxes, Atmos. Meas. Tech., 18, 5349–5373, https://doi.org/10.5194/amt-18-5349-2025, 2025.
Lee, H., Stippich, T., Petersen, J., Meine, D., Brzozon, J., Sulzer, M., Dedden, L., Christen, A., Kattenborn, T., Werner, C., and Kreuzwieser, J.: Strong toluene and p-cymene emission from waterlogged hotspots of a temperate mixed-forest soil, EGUsphere [preprint], https://doi.org/10.5194/egusphere-2025-5426, 2025.
Lee, H., Cadman, F. A., Dumberger, S., Frey, J., Soltani, S., Kattenborn, T., Haberstroh, S., Werner, C., and Kreuzwieser, J.: Unexpectedly high aldehyde emissions from stems of six major European tree species, Agr. Forest Meteorol., 385, 111193, https://doi.org/10.1016/j.agrformet.2026.111193, 2026.
Mahecha, M. D., Reichstein, M., Jung, M., Seneviratne, S. I., Zaehle, S., Beer, C., Braakhekke, M. C., Carvalhais, N., Lange, H., Le Maire, G., and Moors, E.: Comparing observations and process-based simulations of biosphere-atmosphere exchanges on multiple timescales, J. Geophys. Res.-Biogeo., 115, https://doi.org/10.1029/2009JG001016, 2010.
Mahecha, M. D., Bastos, A., Bohn, F. J., Eisenhauer, N., Feilhauer, H., Hickler, T., Kalesse-Los, H., Migliavacca, M., Otto, F. E. L., Peng, J., Sippel, S., Tegen, I., Weigelt, A., Wendisch, M., Wirth, C., Al-Halbouni, D., Deneke, H., Doktor, D., Dunker, S., Duveiller, G., Ehrlich, A., Foth, A., García-García, A., Guerra, C. A., Guimarães-Steinicke, C., Hartmann, H., Henning, S., Herrmann, H., Hu, P., Ji, C., Kattenborn, T., Kolleck, N., Kretschmer, M., Kühn, I., Luttkus, M. L., Maahn, M., Mönks, M., Mora, K., Pöhlker, M., Reichstein, M., Rüger, N., Sánchez-Parra, B., Schäfer, M., Stratmann, F., Tesche, M., Wehner, B., Wieneke, S., Winkler, A. J., Wolf, S., Zaehle, S., Zscheischler, J., and Quaas, J.: Biodiversity and Climate Extremes: Known Interactions and Research Gaps, Earths Future, 12, e2023EF003963, https://doi.org/10.1029/2023EF003963, 2024.
Mahnken, M., Cailleret, M., Collalti, A., Trotta, C., Biondo, C., D'Andrea, E., Dalmonech, D., Marano, G., Mäkelä, A., Minunno, F., Peltoniemi, M., Trotsiuk, V., Nadal-Sala, D., Sabaté, S., Vallet, P., Aussenac, R., Cameron, D. R., Bohn, F. J., Grote, R., Augustynczik, A. L. D., Yousefpour, R., Huber, N., Bugmann, H., Merganičová, K., Merganic, J., Valent, P., Lasch-Born, P., Hartig, F., Vega del Valle, I. D., Volkholz, J., Gutsch, M., Matteucci, G., Krejza, J., Ibrom, A., Meesenburg, H., Rötzer, T., van der Maaten-Theunissen, M., van der Maaten, E., and Reyer, C. P. O.: Accuracy, realism and general applicability of European forest models, Glob. Change Biol., 28, 6921–6943, https://doi.org/10.1111/gcb.16384, 2022.
Maier, M. and Schack-Kirchner, H.: Using the gradient method to determine soil gas flux: A review, Agr. Forest Meteorol., 192–193, 78–95, https://doi.org/10.1016/j.agrformet.2014.03.006, 2014.
Mengist, W. and Soromessa, T.: Assessment of forest ecosystem service research trends and methodological approaches at global level: a meta-analysis, Environ. Syst. Res., 8, 22, https://doi.org/10.1186/s40068-019-0150-4, 2019.
Messier, C., Bauhus, J., Sousa-Silva, R., Auge, H., Baeten, L., Barsoum, N., Bruelheide, H., Caldwell, B., Cavender-Bares, J., Dhiedt, E., Eisenhauer, N., Ganade, G., Gravel, D., Guillemot, J., Hall, J. S., Hector, A., Hérault, B., Jactel, H., Koricheva, J., Kreft, H., Mereu, S., Muys, B., Nock, C. A., Paquette, A., Parker, J. D., Perring, M. P., Ponette, Q., Potvin, C., Reich, P. B., Scherer-Lorenzen, M., Schnabel, F., Verheyen, K., Weih, M., Wollni, M., and Zemp, D. C.: For the sake of resilience and multifunctionality, let's diversify planted forests!, Conserv. Lett., 15, e12829, https://doi.org/10.1111/conl.12829, 2022.
Möhring, J., Kattenborn, T., Mahecha, M. D., Cheng, Y., Schwenke, M. B., Cloutier, M., Denter, M., Frey, J., Gassilloud, M., Göritz, A., Hempel, J., Horion, S., Jucker, T., Junttila, S., Khatri-Chhetri, P., Korznikov, K., Kruse, S., Laliberté, E., Maroschek, M., Neumeier, P., Pérez-Priego, O., Potts, A., Schiefer, F., Seidl, R., Vajna-Jehle, J., Zielewska-Büttner, K., and Mosig, C.: Global, multi-scale standing deadwood segmentation in centimeter-scale aerial images, ISPRS Open Journal of Photogrammetry and Remote Sensing, 18, 100104, https://doi.org/10.1016/j.ophoto.2025.100104, 2025.
Mosig, C., Vajna-Jehle, J., Mahecha, M. D., Cheng, Y., Hartmann, H., Montero, D., Junttila, S., Horion, S., Adu-Bredu, S., Al-Halbouni, D., Allen, M., Altman, J., Angiolini, C., Astrup, R., Barrasso, C., Bartholomeus, H., Brede, B., Buras, A., Carrieri, E., Chirici, G., Cloutier, M., Cushman, K. C., Dalling, J. W., Dempewolf, J., Denter, M., Ecke, S., Eichel, J., Eltner, A., Fabi, M., Fassnacht, F., Feirreira, M. P., Frey, J., Frick, A., Ganz, S., Garbarino, M., Garćıa, M., Gassilloud, M., Ghasemi, M., Giannetti, F., Gonzalez, R., Gosper, C., Greinwald, K., Grieve, S., Gutierrez, J. A., Göritz, A., Hajek, P., Hedding, D., Hempel, J., Hernández, M., Heurich, M., Honkavaara, E., Jucker, T., Kalwij, J. M., Khatri-Chhetri, P., Klemmt, H.-J., Koivumäki, N., Korznikov, K., Kruse, S., Krüger, R., Laliberté, E., Langan, L., Latifi, H., Lehmann, J., Li, L., Lines, E., Lopatin, J., Lucieer, A., Ludwig, M., Ludwig, A., Lyytikäinen-Saarenmaa, P., Ma, Q., Marino, G., Maroschek, M., Meloni, F., Menzel, A., Meyer, H., Miraki, M., Moreno-Fernández, D., Muller-Landau, H. C., Mälicke, M., Möhring, J., Müllerova, J., Neumeier, P., Näsi, R., Oppgenoorth, L., Palmer, M., Paul, T., Potts, A., Prober, S., Puliti, S., Pérez-Priego, O., Reudenbach, C., Rossi, C., Ruehr, N. K., Ruiz-Benito, P., Runge, C. M., Scherer-Lorenzen, M., Schiefer, F., Schladebach, J., Schmehl, M.-T., Schwarz, S., Schwenke, M. B., Seidl, R., Shafeian, E., Simone, L. de, Sohrabi, H., Sotomayor, L., Sparrow, B., Steer, B. S. C., Stenson, M., Stöckigt, B., Su, Y., Suomalainen, J., Torresani, M., Umlauft, J., Vargas-Ramírez, N., Volpi, M., Vásquez, V., Weinstein, B., Ximena, T. C., Zdunic, K., Zielewska-Büttner, K., Oliveira, R. A. de, Wagtendonk, L. van, Dosky, V. von, and Kattenborn, T.: deadtrees.earth – An Open-Access and Interactive Database for Centimeter-Scale Aerial Imagery to Uncover Global Tree Mortality Dynamics, Remote Sens. Environ., 332, 115027, https://doi.org/10.1101/2024.10.18.619094, 2026.
Pan, Y., Birdsey, R. A., Phillips, O. L., Houghton, R. A., Fang, J., Kauppi, P. E., Keith, H., Kurz, W. A., Ito, A., Lewis, S. L., Nabuurs, G.-J., Shvidenko, A., Hashimoto, S., Lerink, B., Schepaschenko, D., Castanho, A., and Murdiyarso, D.: The enduring world forest carbon sink, Nature, 631, 563–569, https://doi.org/10.1038/s41586-024-07602-x, 2024.
Paul-Limoges, E., Wolf, S., Eugster, W., Hörtnagl, L., and Buchmann, N.: Below-canopy contributions to ecosystem CO2 fluxes in a temperate mixed forest in Switzerland, Agr. Forest Meteorol., 247, 582–596, https://doi.org/10.1016/j.agrformet.2017.08.011, 2017.
Pichler, M. and Hartig, F.: Machine learning and deep learning—A review for ecologists, Methods Ecol. Evol., 14, 994–1016, https://doi.org/10.1111/2041-210X.14061, 2023.
Sarkar, C., Turnipseed, A., Shertz, S., Karl, T., Potosnak, M., Bai, J., Serça, D., Bonal, D., Burban, B., Lopes, P. R. C., Vega, O., and Guenther, A. B.: A portable, low-cost relaxed eddy accumulation (REA) system for quantifying ecosystem-level fluxes of volatile organics, Atmos. Environ., 242, 117764, https://doi.org/10.1016/j.atmosenv.2020.117764, 2020.
Schiefer, F., Schmidtlein, S., Hartmann, H., Schnabel, F., and Kattenborn, T.: Large-scale remote sensing reveals that tree mortality in Germany appears to be greater than previously expected, Forestry, 98, 535–549, https://doi.org/10.1093/forestry/cpae062, 2025.
Schuldt, B., Buras, A., Arend, M., Vitasse, Y., Beierkuhnlein, C., Damm, A., Gharun, M., Grams, T. E. E., Hauck, M., Hajek, P., Hartmann, H., Hiltbrunner, E., Hoch, G., Holloway-Phillips, M., Körner, C., Larysch, E., Lübbe, T., Nelson, D. B., Rammig, A., Rigling, A., Rose, L., Ruehr, N. K., Schumann, K., Weiser, F., Werner, C., Wohlgemuth, T., Zang, C. S., and Kahmen, A.: A first assessment of the impact of the extreme 2018 summer drought on Central European forests, BAAE, 45, 86–103, https://doi.org/10.1016/j.baae.2020.04.003, 2020.
Shinde, U. G., Luhmann, T., Klueppel, J., Steinmann, T., Comella, L. M., Yu, W., Rupitsch, S. J., and Woias, P.: Task-Specific Energy Profiling for Microcontroller Selection in Energy-Autonomous Wireless Sensor Nodes, IEEE Sens. J., 1–1, https://doi.org/10.1109/JSEN.2025.3609827, 2025.
Stock, C., Dumberger, S., Kühnhammer, K., Sulzer, M., Christen, A., Haberstroh, S., and Werner, C.: Continuous chlorophyll fluorescence measurements trace sudden cold spell effects on the photochemical efficiency of photosystem II in a temperate mixed forest, Tree Physiol., tpag138, https://doi.org/10.1093/treephys/tpag138, 2026.
Storch, I., Penner, J., Asbeck, T., Basile, M., Bauhus, J., Braunisch, V., Dormann, C. F., Frey, J., Gärtner, S., Hanewinkel, M., Koch, B., Klein, A.-M., Kuss, T., Pregernig, M., Pyttel, P., Reif, A., Scherer-Lorenzen, M., Segelbacher, G., Schraml, U., Staab, M., Winkel, G., and Yousefpour, R.: Evaluating the effectiveness of retention forestry to enhance biodiversity in production forests of Central Europe using an interdisciplinary, multi-scale approach, Ecol. Evol., 10, 1489–1509, https://doi.org/10.1002/ece3.6003, 2020.
Sulzer, M., Brzozon, J., Christen, A., Dedden, L., Dormann, C. F., Dumberger, S., Frey, Y., Gassilloud, M., Göritz, A., Grote, R., Haberstroh, S., Kattenborn, T., Kremer, L., Kreuzwieser, J., Kühnhammer, K., Lang, F., Lee, H., Müller, J., Schack-Kirchner, H., Seifert, T., Stock, C., Strack, J., Tesch, J., Wagner, D., Wallrabe, U., Weiler, M., and Werner, C.: The ECOSENSE forest – enriching tower-based flux measurements of carbon and water exchange with novel distributed sensor networks, in: ARPHA Conference Abstracts, Greenhouse gases and carbon, water, and nitrogen cycles, e149267, https://doi.org/10.3897/aca.8.e149267, 2025.
Turner, D. P., Guzy, M., Lefsky, M. A., Ritts, W. D., Van Tuyl, S., and Law, B. E.: Monitoring Forest Carbon Sequestration with Remote Sensing and Carbon Cycle Modeling, Environ. Manage., 33, 457–466, https://doi.org/10.1007/s00267-003-9103-8, 2004.
Udrescu, S.-M. and Tegmark, M.: AI Feynman: A physics-inspired method for symbolic regression, Sci. Adv., 6, eaay2631, https://doi.org/10.1126/sciadv.aay2631, 2020.
Unity Technologies: Unity, Version 6.2, https://unity.com/ (last access: 5 October 2026), 2025.
Wallrabe, U., Baghbani, S., Comella, L., Frey, Y., Kapp, J., Klüppel, J., Prucker, O., Rajak, S. K., Rühe, J., Rupitsch, S., Schmitt, K., Shinde, U., Steinmann, T., Wöllenstein, J., Woias, P., and Werner, C.: Ecosense – Smart Sensors Alone in the Forest, in: 2025 23rd International Conference on Solid-State Sensors, Actuators and Microsystems (Transducers), Transducers 2025, 656–661, https://doi.org/10.1109/Transducers61432.2025.11111503, 2025.
Wang, K., Franklin, S. E., Guo, X., and Cattet, M.: Remote Sensing of Ecology, Biodiversity and Conservation: A Review from the Perspective of Remote Sensing Specialists, Sensors, 10, 9647–9667, https://doi.org/10.3390/s101109647, 2010.
Werner, C., Meredith, L. K., Ladd, S. N., Ingrisch, J., Kübert, A., van Haren, J., Bahn, M., Bailey, K., Bamberger, I., Beyer, M., Blomdahl, D., Byron, J., Daber, E., Deleeuw, J., Dippold, M. A., Fudyma, J., Gil-Loaiza, J., Honeker, L. K., Hu, J., Huang, J., Klüpfel, T., Krechmer, J., Kreuzwieser, J., Kühnhammer, K., Lehmann, M. M., Meeran, K., Misztal, P. K., Ng, W.-R., Pfannerstill, E., Pugliese, G., Purser, G., Roscioli, J., Shi, L., Tfaily, M., and Williams, J.: Ecosystem fluxes during drought and recovery in an experimental forest, Science, 374, 1514–1518, https://doi.org/10.1126/science.abj6789, 2021.
Werner, C., Wallrabe, U., Christen, A., Comella, L. M., Dormann, C., Göritz, A., Grote, R., Haberstroh, S., Jouda, M., Kiese, R., Koch, B., Korvink, J. G., Kreuzwieser, J., Lang, F., Müller, J., Prucker, O., Reiterer, A., Rühe, J., Rupitsch, S. J., Schack-Kirchner, H., Schmitt, K., Stobbe, N., Weiler, M., Woias, P., and Wöllenstein, J.: ECOSENSE – Multi-scale quantification and modelling of spatio-temporal dynamics of ecosystem processes by smart autonomous sensor networks, RIO, 10, e129357, https://doi.org/10.3897/rio.10.e129357, 2024.
Werner, C., Bahn, M., Grams, T. E. E., Grossiord, C., Haberstroh, S., Lenczner, G., Tuia, D., and Vallicrosa, H.: Impact of emerging compound droughts on forests: A water supply and demand perspective, Plant Biol., 28, 561–577, https://doi.org/10.1111/plb.70080, 2025.
Wilkinson, M. D., Dumontier, M., Aalbersberg, Ij. J., Appleton, G., Axton, M., Baak, A., Blomberg, N., Boiten, J.-W., da Silva Santos, L. B., Bourne, P. E., Bouwman, J., Brookes, A. J., Clark, T., Crosas, M., Dillo, I., Dumon, O., Edmunds, S., Evelo, C. T., Finkers, R., Gonzalez-Beltran, A., Gray, A. J. G., Groth, P., Goble, C., Grethe, J. S., Heringa, J., 't Hoen, P. A. C., Hooft, R., Kuhn, T., Kok, R., Kok, J., Lusher, S. J., Martone, M. E., Mons, A., Packer, A. L., Persson, B., Rocca-Serra, P., Roos, M., van Schaik, R., Sansone, S.-A., Schultes, E., Sengstag, T., Slater, T., Strawn, G., Swertz, M. A., Thompson, M., van der Lei, J., van Mulligen, E., Velterop, J., Waagmeester, A., Wittenburg, P., Wolstencroft, K., Zhao, J., and Mons, B.: The FAIR Guiding Principles for scientific data management and stewardship, Sci. Data, 3, 160018, https://doi.org/10.1038/sdata.2016.18, 2016.
Winter, C., Müller, S., Kattenborn, T., Stahl, K., Szillat, K., Weiler, M., and Schnabel, F.: Forest Dieback in Drinking Water Protection Areas—A Hidden Threat to Water Quality, Earths Future, 13, e2025EF006078, https://doi.org/10.1029/2025EF006078, 2025.
Zhang, Y., Chen, J. M., and Miller, J. R.: Determining digital hemispherical photograph exposure for leaf area index estimation, Agr. Forest Meteorol., 133, 166–181, https://doi.org/10.1016/j.agrformet.2005.09.009, 2005.