the Creative Commons Attribution 4.0 License.
the Creative Commons Attribution 4.0 License.
 | 15 Apr 2026
Multi-scale and multi-compartment monitoring of tree vitality – integrating soil, stem, crown, and remote sensing observations
Stefan Ehekircher
Andreas Braun
Armin Niessner
Tamara Schober
Göran Spangenberg
Jürgen Schäffer
Sebastian Hein
Volker Hochschild
Forest ecosystems in Central Europe are increasingly affected by climate change, with rising temperatures and more frequent drought events posing substantial challenges to dominant tree species such as beech and oak. Understanding how site-specific factors interact with climatic stressors is therefore essential for assessing forest resilience and future viability. In particular, soil properties such as texture (sand, silt, clay) influence water retention capacity and root penetration, thereby directly affecting tree growth and vitality.
To quantify tree water balance and physiological condition, trunk circumference and sap flow are continuously monitored at multiple sites. These in situ measurements are complemented by remote sensing data derived from drone-based and satellite imagery, as well as by meteorological observations. This integrative monitoring framework enables a comprehensive assessment of drought stress susceptibility in relation to site conditions.
This article introduces the research design and first findings of the DryTrees project, funded by the Baden-Württemberg Foundation, including the applied in-situ and remote sensing methodologies and initial results from the first two project years. The generated dataset has the potential to reveal unprecedented insights into biophysical and climatological interactions in typical German forest ecosystems and to support the development of site-specific, climate-resilient, and cost-efficient forest management strategies.
- Article
(9495 KB) - Full-text XML
- BibTeX
- EndNote


As the global mean temperature increases, heat waves in Central Europe affect the regional climate and therefore large parts of Germany also experience more weather extremes like heavy rain or heat waves (Polade et al., 2014; Malhi et al., 2020). At the same time, droughts accompany these heat waves in Germany as well as all over the world (Bradford et al., 2022; Messaoud, 2024). Trees suffer from such conditions in the same way as many other living organisms across biomes (Shestakova et al., 2019). If they do not have tolerance for drought stress or a mechanism to cope with this stress, trees are damaged. Drought-driven tree mortality is increasing around the world (Allen et al., 2010) and affects both plantations of high-production agricultural systems as well as man-made to fully natural landscapes, i.e. forests. In Central Europe, beech and oak trees are considered main tree species and are characteristic of European forests. The aim of the DryTrees project presented here is to better understand the mechanisms by which beech and oak trees suffer from drought stress. The findings will be used to develop management measures and site-specific recommendations for future forest interventions aimed at increasing the vitality of these tree species.
The parameters affecting the vitality of a living tree are manifold and complex. Fungi, insects, ozone, air pollution, flooding, storm damage, frost, and last but not least, drought all play a role in influencing tree development (Roloff, 2021). This integrated study aims to investigate the consequences of drought in beech and oak trees in particular. Tree vitality can be measured using different techniques. Analysis of carbohydrate content in several tissues has been used as an indicator of tree vitality (Martinez-Trinidad et al., 2010). Alternatively, the starch content using Lugol's solution has been used to evaluate the carbohydrate content (Kosola et al., 2001). Significant simplifications have been achieved using portable refractometers that offer results without complicated laboratory work to determine carbohydrate content (Waes et al., 1998). Similarly, portable and viable for determining tree vitality is the use of chlorophyll fluorescence spectrometry (Maxwell and Johnson, 2000; Martinez-Trinidad et al., 2010). One prerequisite of chlorophyll fluorescence spectrometry is the need for leaves in a tree or plant. Thus, this method can only be applied in spring and summer, if the growing periods in the mid-latitudes are considered. In addition to the methods mentioned above, the use of electrical resistances within tree trunks has been used in the evaluation of physiological processes associated with stress conditions (Ostrofsky and Shortle, 1989; Borchert, 1994; Martinez-Trinidad et al., 2010). The process is minimally invasive, has low power consumption and can be integrated into IoT (internet of things) networks and the data can be continuously logged (Matasov et al., 2020). In this study, i.a. commercially available TreeSense Pulse sensors, or wearables, are used to monitor beech and oak trees crowns with a collective of ten sensors. These wearables have the advantage to monitor the trees autonomously and continuously without the need of an operator in the field taking tissue samples for starch or glucose analysis. All monitored trees in this study are also equipped with dendrometers that measure the stem radial growth of the tree stem continuously. Sap flow metres based on the method by Granier (1985, 1987) measure the fluid flow in the xylem of each tree (Niessner et al., 2024).
Although climate change studies on high heat tolerance in tree species in general (Sperlich et al., 2019; Gauthey et al., 2024) or individual tree compartments, e.g. focussing on leaf behaviour or phenology (Anev et al., 2016; Ahrens et al., 2021; Pfenninger et al., 2025) are important, the novel approach in this study are integrated measurements. An integrated set-up that covers all tree compartments provides entirely new possibilities for high-resolution and multi-dimensional data analysis. With a measurement interval of 15 min, it is possible to record high-resolution reactions of the trees, including the tree crowns, e.g. during a drought period. These in-situ measurements are complemented by multispectral data acquired with UAS (uncrewed aircraft systems) and by satellite-based observations. The derived ortho-images are used to map the tree crown vitality using NDVI (Normalised Difference Vegetation Index). The NDVI is a well established vegetation index and suited for deciduous trees like beeches and oaks. Ecke et al. (2024) compared several vegetation indices and recommend the NDVI and the BNDVI (Blue Normalised Difference Vegetation Index). However, the BNDVI is very susceptible to weather conditions (cloudy or sunny) which is reflected in significant Rayleigh scattering above 50 m above the ground in the blue band (Suomalainen et al., 2021). Therefore, the NDVI has been chosen to represent tree vitality. Since plant vitality is also very susceptible in the red-edge part of the electromagnetic spectrum, the NDRE (Normalised Difference Red-Edge) index will be evaluated in addition (Boochs et al., 1990; Xu et al., 2019).
This work primarily presents the sensor setup and measurement methods applied in the study and provides first insights into the data collected by the deployed instruments. In addition, the study sites in south-western Germany are introduced to establish a scientific foundation for future seasonal monitoring of drought stress in sessile oak (Quercus petraea) and beech (Fagus sylvatica). At this stage, the focus lies on demonstrating the feasibility of the monitoring approach and the complementary nature of the different data sources, rather than on a fully integrated analysis across all observation scales.
An overarching objective of the DryTrees project is to transfer insights gained from the test sites to forested regions across Baden-Württemberg. In the long term, this approach may support the early identification of drought-stressed beech and oak trees and inform the development of appropriate management measures. The research questions of the DryTrees project are summarised as follows:
-
How do beech and oak trees differ in their multispectral responses to extended dry periods across varying soil types?
-
How can in-situ tree vitality parameters, such as sap flow and stem diameter variation, be used to assess drought stress?
-
Can satellite and aerial imagery be utilised to identify drought stress indicators through cross-correlations with in-situ parameters in forest areas sharing similar soil and stand characteristics?
-
How resilient are beech and oak trees to drought in Central European forests?
In this section, the physical properties of the study sites are described. For additional visual context, 360° panoramic photographs of the sites are available online at https://36o.de/drytrees/ (last access: 13 April 2026). The images are accompanied by supplementary information on the sites and the trees depicted.
2.1 Geography
The overall study area is located in the state of Baden-Württemberg, Germany (Fig. 1), and comprises three distinct sites located in a forest north-east of the city of Hechingen (Fig. 2). The forest represents a typical Central European mixed forest.
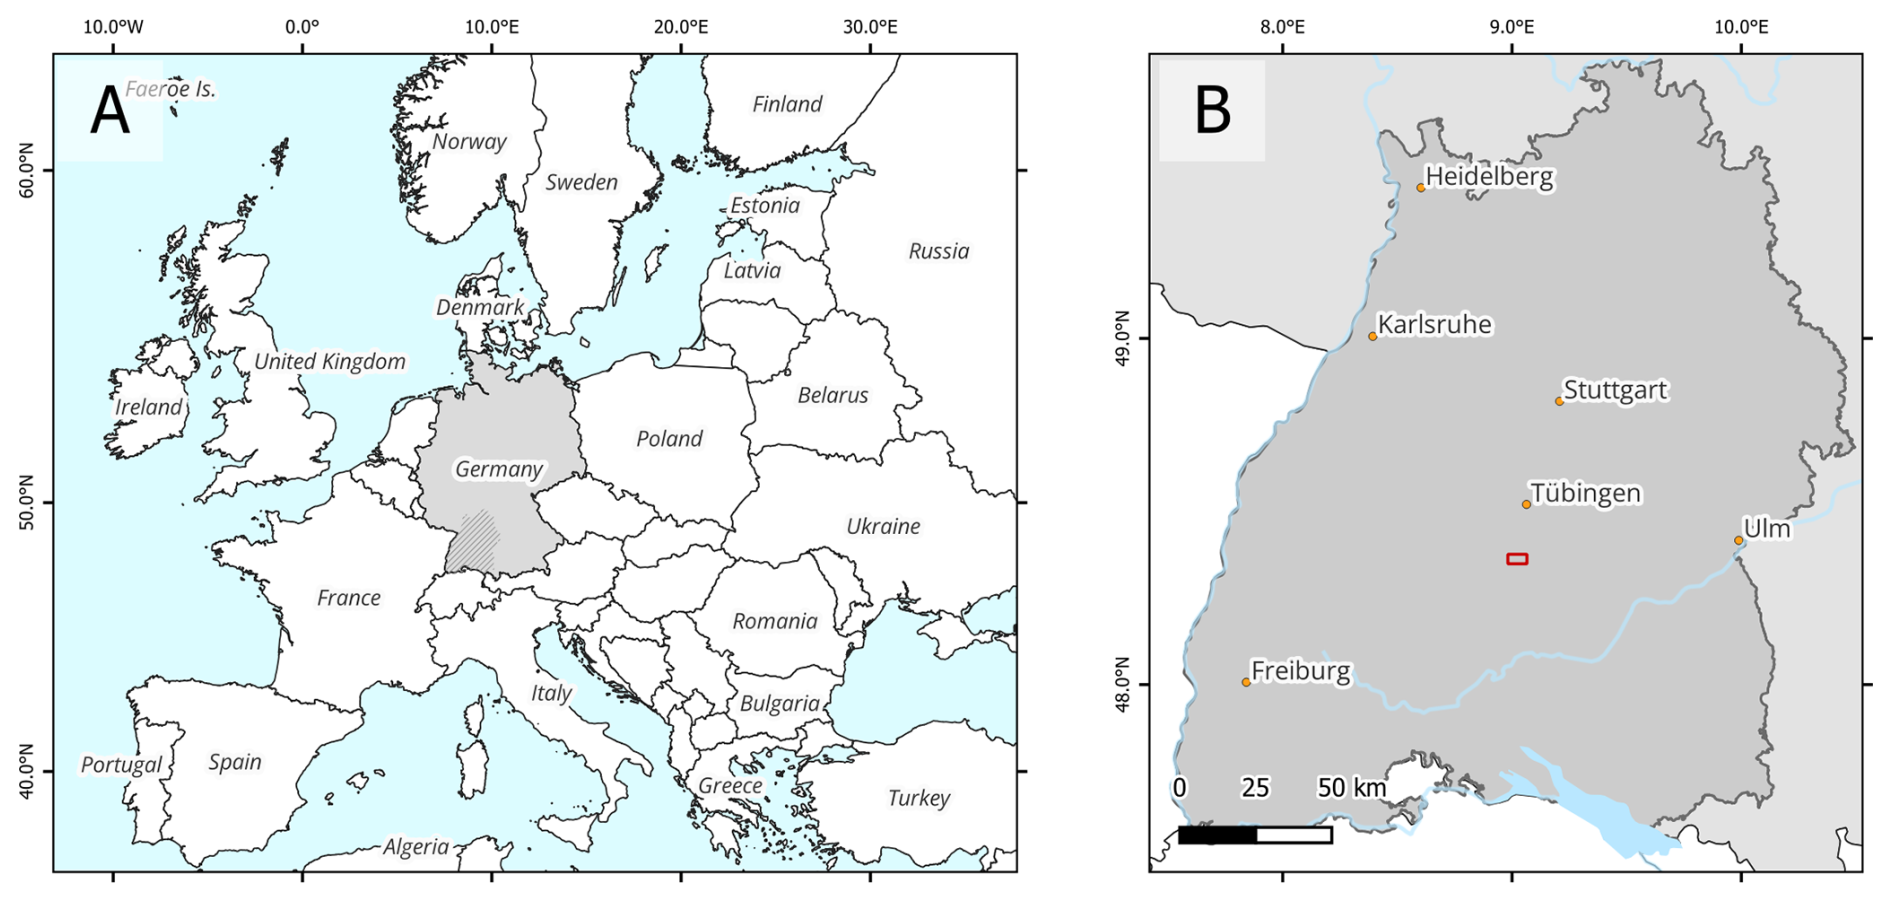
Figure 1Location of the state of Baden-Württemberg within Europe (A) and the location of the three study sites (B, red rectangle). Data sources: GADM and Natural Earth. Map created using QGIS 3.40.6.
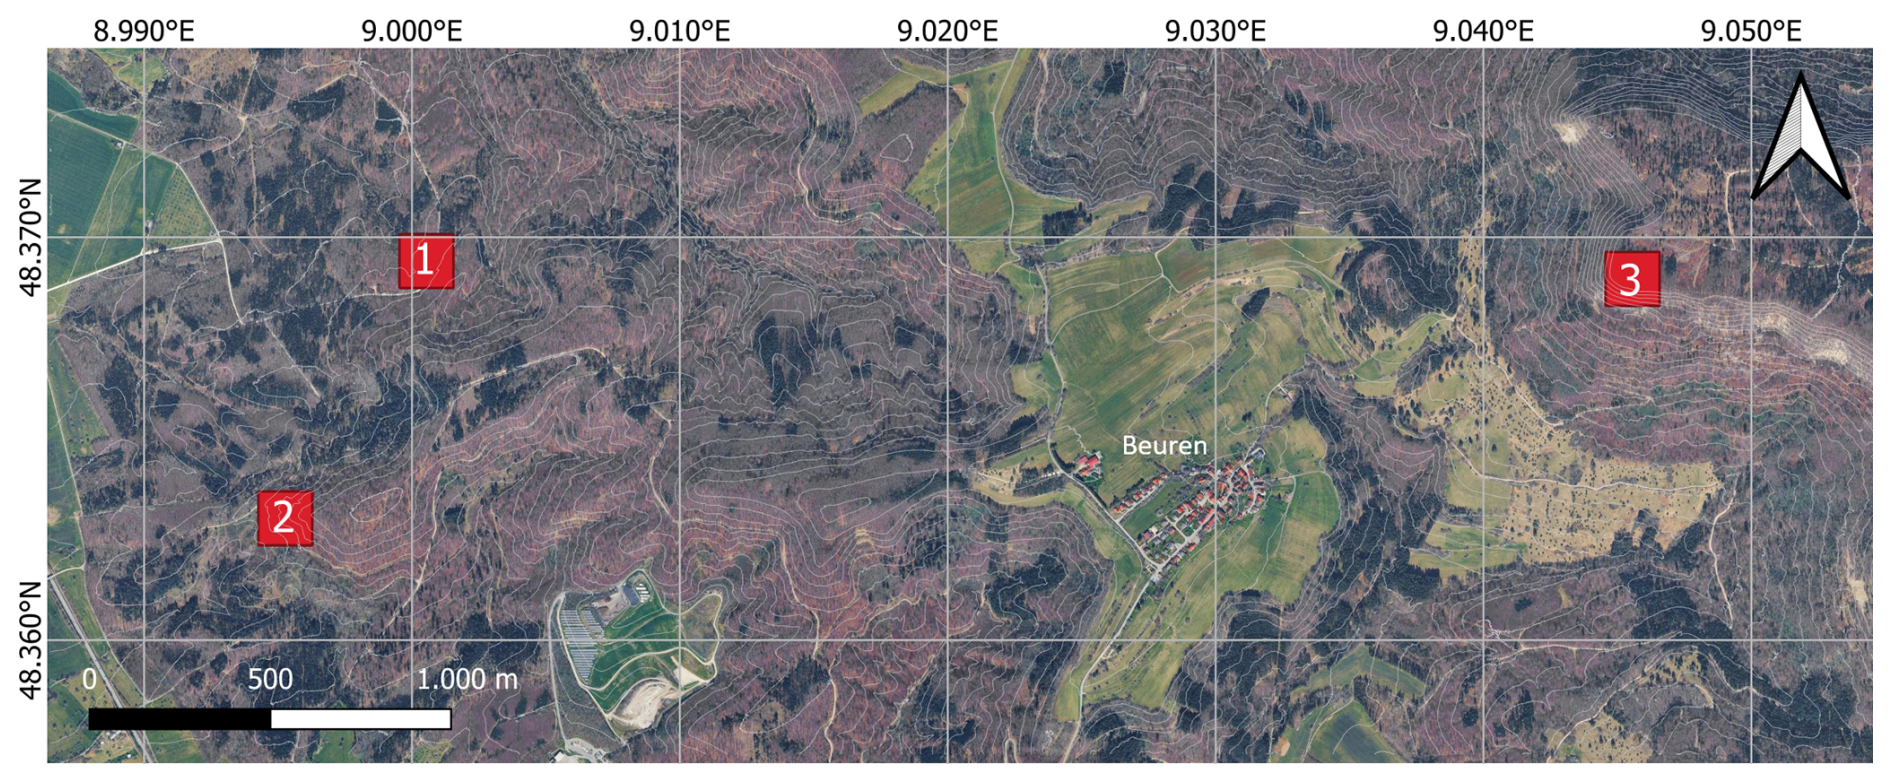
Figure 2Satellite imagery with 10 m contour lines of study locations 1, 2, and 3 north-east of Hechingen, Germany. Topography was derived from a digital elevation model (DEM) provided by the State Office for Geoinformation and Surveying of Baden-Württemberg (LGL BW). Background imagery: Map data © 2025 Google. Map created using QGIS 3.40.6.
As the project focuses on sessile oak (Quercus petraea) and beech (Fagus sylvatica), the close spatial co-occurrence of both species was a key criterion to ensure feasible sensor installation and cable management. Accordingly, three sites were selected at different altitudes that fulfil this requirement (Fig. 2). At each site, ten sessile oaks and ten beeches are distributed over an area of approximately 0.2–0.45 ha.
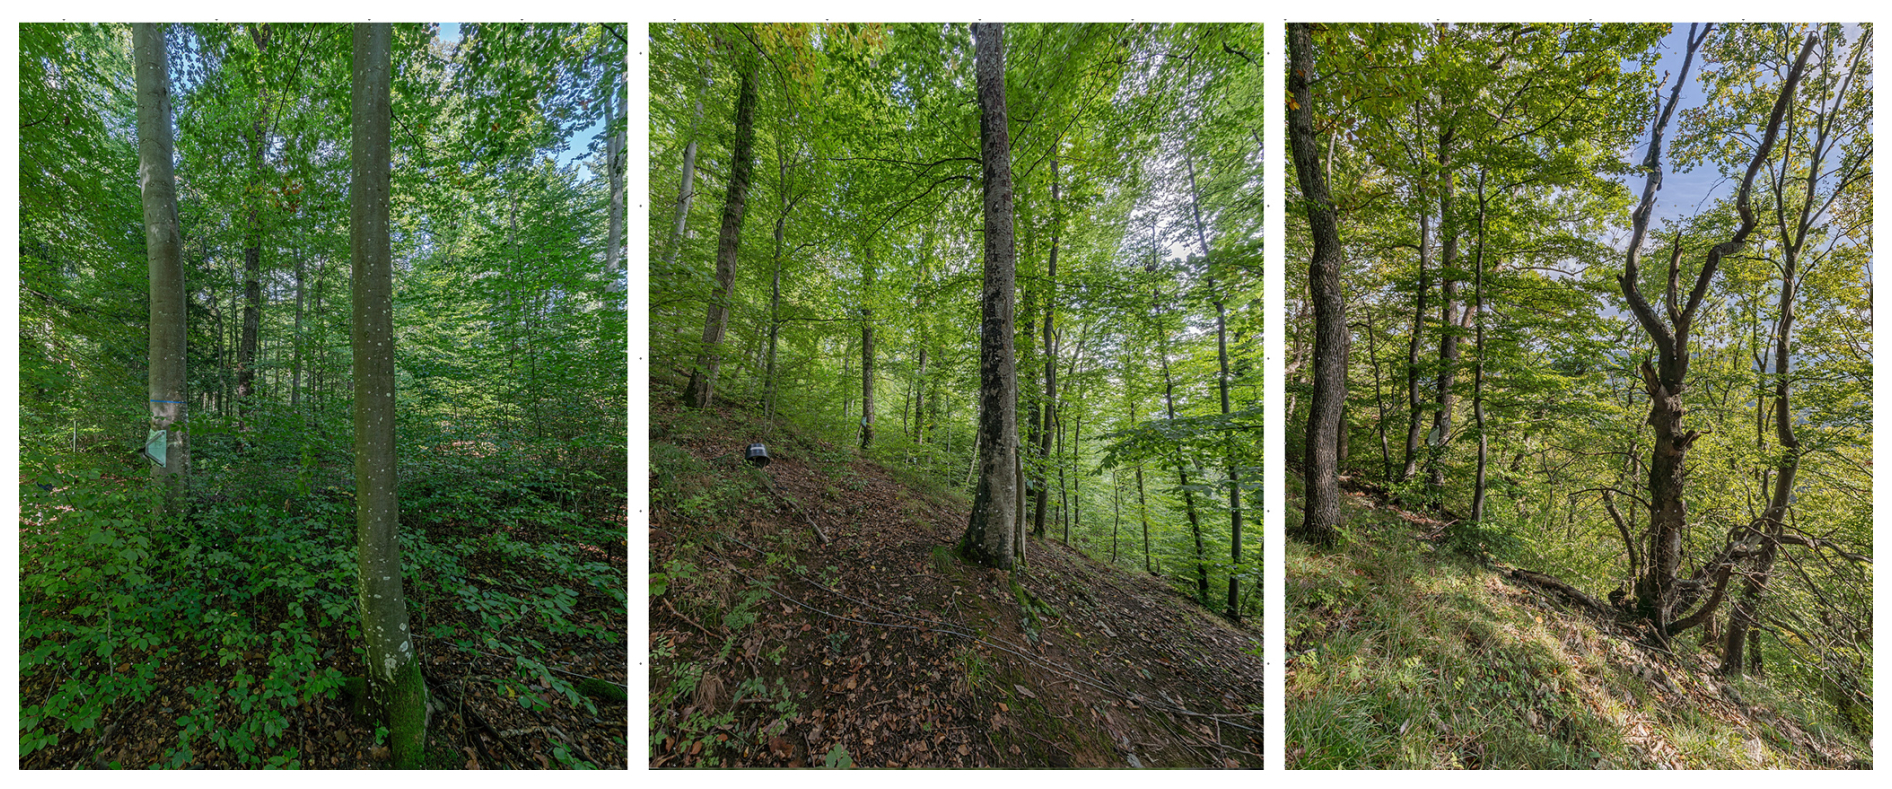
Figure 3Impressions of the terrain and tree stand structure at Sites 1, 2, and 3 from left to right (https://36o.de/drytrees/). The south-west facing slope at Site 2 and the south facing slope of Site 3 as well as the escarpment bordering Site 3 are well visible.
Table 1Basal area, stem density (stems ha−1; stem circumference ≥ 7 cm), mean diameter at breast height (DBH), mean minimum tree age in 2025 (based on the oldest measured tree ring), mean tree-ring width, and tree species composition at each site. Values are given as mean ± standard deviation. n=15 per species and site.
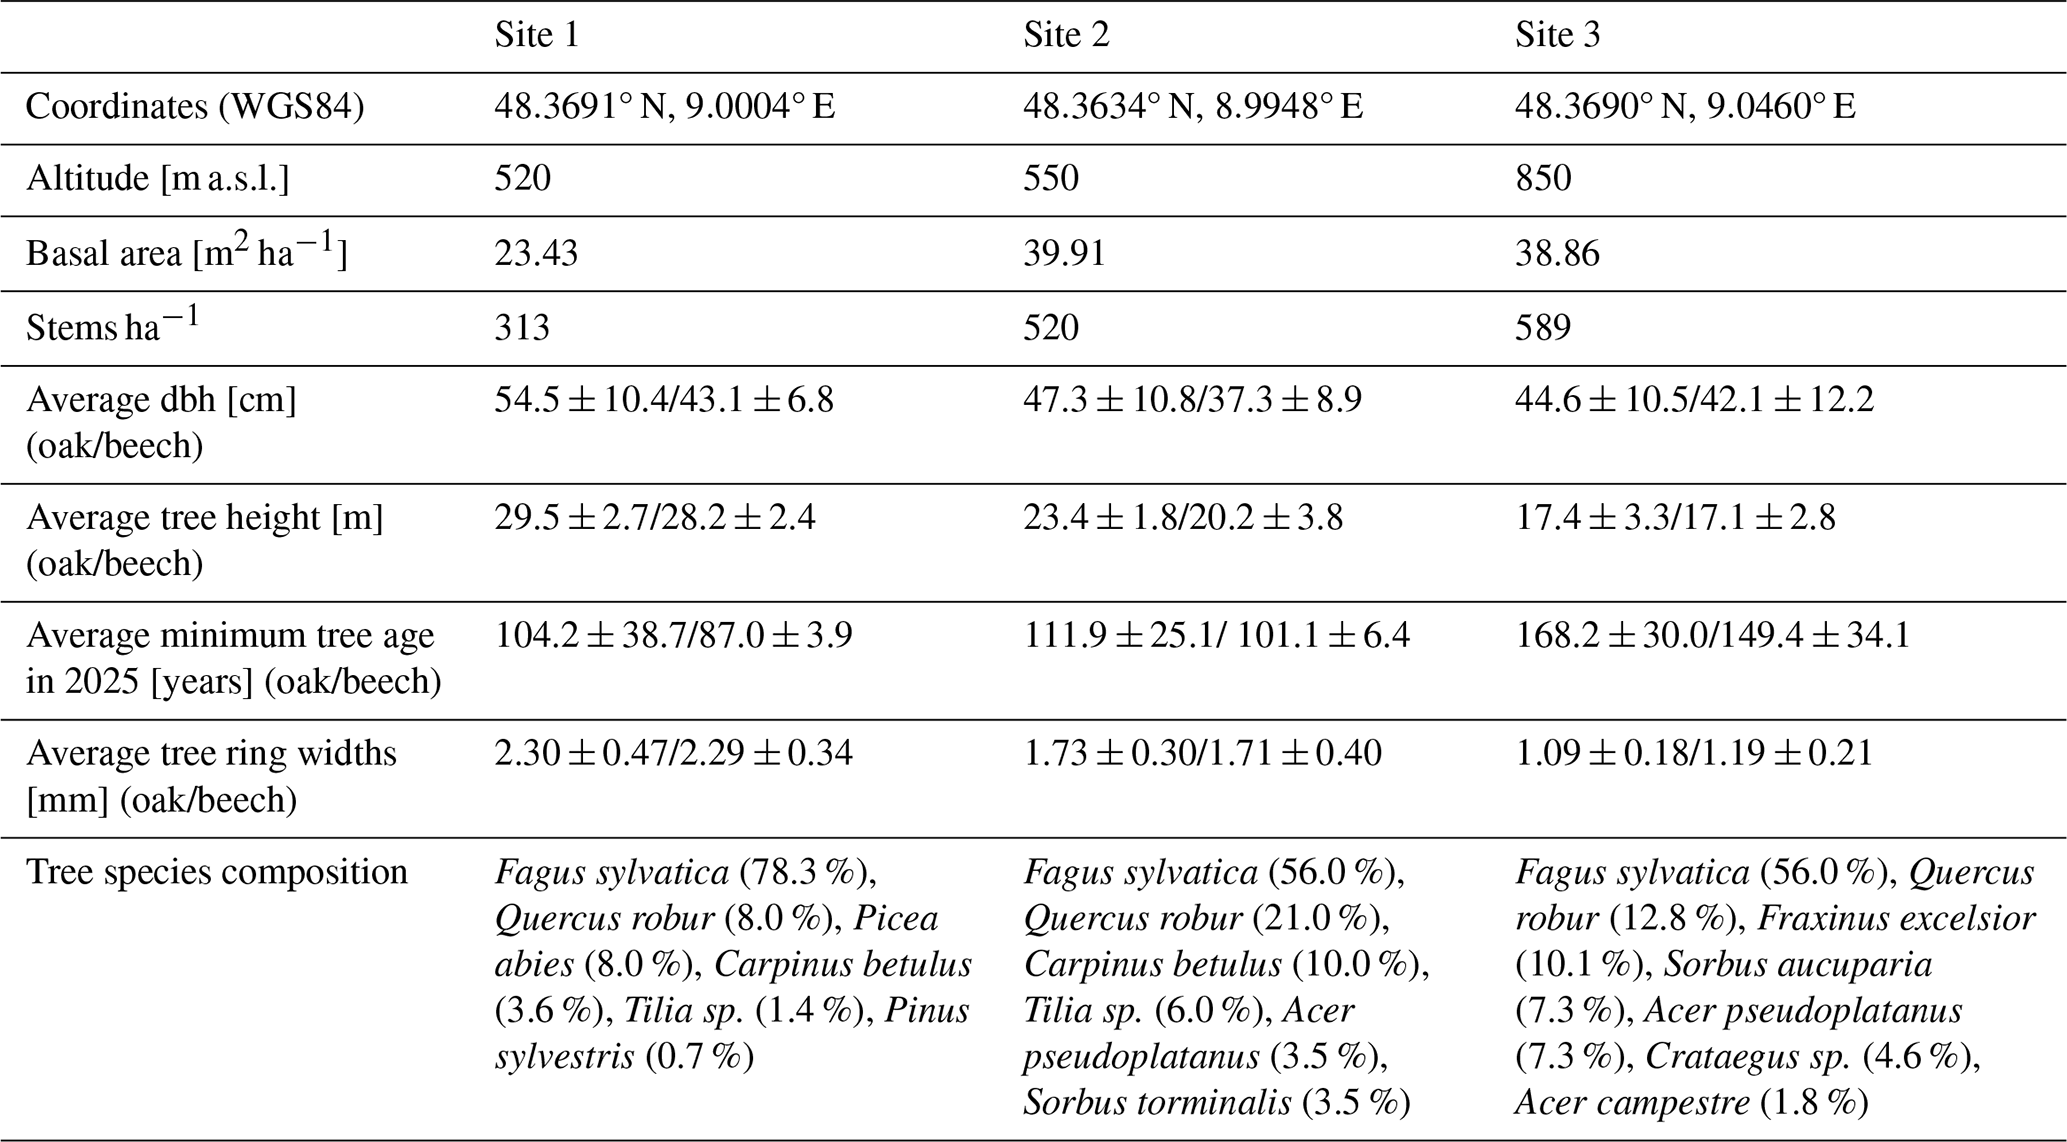
Figure 3 illustrates the terrain and examples of instrumented trees at each site. Site 1 is located on a gentle north-west-facing slope (5°), whereas Site 2 is characterised by a steeper south-west-facing slope (15–20°). Site 3, situated at the highest elevation, lies on top of an escarpment with a nearly level plateau and slope angles of up to 40° at the edge. Differences in topography and exposure, such as slope and irradiation angle, result in site-specific microclimatic conditions. The main characteristics of the three sites are summarised in Table 1.
2.2 Tree stand structure
Tree stand structure varied considerably among the three study sites (Table 1). Site 1 has the lowest basal area (23.43 m2 ha−1) and stem density (313 stems ha−1), whereas Sites 2 and 3 exhibit much higher values (basal area: 39.91 and 38.86 m2 ha−1; stems: 520 and 589 stems ha−1). The average diameter at breast height (dbh) is highest at Site 1, particularly for oaks, and generally larger in oaks than in beeches at all sites. Tree height follows a similar pattern, with taller trees at Site 1 (oak: 29.5 m; beech: 28.2 m), and comparatively shorter individuals at Site 2 (23.4 m/20.2 m) and especially at Site 3 (17.4 m/17.1 m).
Minimum tree age in 2025 averaged around 100 years at Sites 1 and 2 (oak: 104.2/111.9 years; beech: 87.0/101.1 years), but was considerably higher at Site 3 (oak: 168.2 years; beech: 149.4 years). At Site 1, four oaks between 150 and 175 years old are located at the wayside, while all others are under 100 years. At Site 2, a single 200-year-old oak is found, with the others being around 100 years. In contrast, tree ages at Site 3 are more diverse, ranging from 119 to 231 years in oaks and from 84 to 199 years in beeches. These values are based on tree-ring measurements taken at 130 cm height and typically the pith was not hit, meaning actual tree ages are likely underestimated by several years, sometimes even by one or two decades.
Species composition is dominated by Fagus sylvatica (beech) across all sites, with shares ranging from 56.0 % (Sites 2 and 3) to 78.3 % (Site 1). Quercus robur (oak) is consistently present but less abundant (8.0 %–21.0 %). Additional common species includes Carpinus betulus (hornbeam) at Sites 1 (3.6 %) and 2 (10.0 %) and Fraxinus excelsior (ash) at Site 3 (10.1 %). Numerous young beeches (< 7 cm diameter), are present at Sites 1 and 3.
2.3 Soil properties
Figure 4 shows the soil profiles of the study sites. Each profile is described in detail below. The geological subsurface at the three study sites is dominated by sediments deposited during the Jurassic period. Sites 1 and 2 (with slopes of 5 and 15–20°, respectively) are characterised by marl clays from the Opalinus Clay Formation forming the bedrock. Site 3 (40° slope) is located directly at the edge of the escarpment of the Well-Bedded Limestones. In the periglacial region, soil formation occurred in cover beds originating from solifluction and solimixture processes. The soil profile at study Site 1 exhibits a distinct upper periglacial cover bed, approximately 30 cm thick, containing a loess loam component. During soil formation in the Holocene period, a cambic horizon (Bv horizon according to the German soil classification) developed in this cover bed. Below is a clay-rich basal cover bed with a polyhedral structure (II Pv1 and II Pv2 horizons). The light grey to brown-orange mottling in the basal layer is due to the oxidation of finely dispersed pyrite contained in the marl clay and is not caused by waterlogging. Moderately weathered grey clay marl bedrock (III-elCv) underlies the transitional horizon (III-Pv-elCv). There the soil type according to the WRB is Vertic Cambisol.
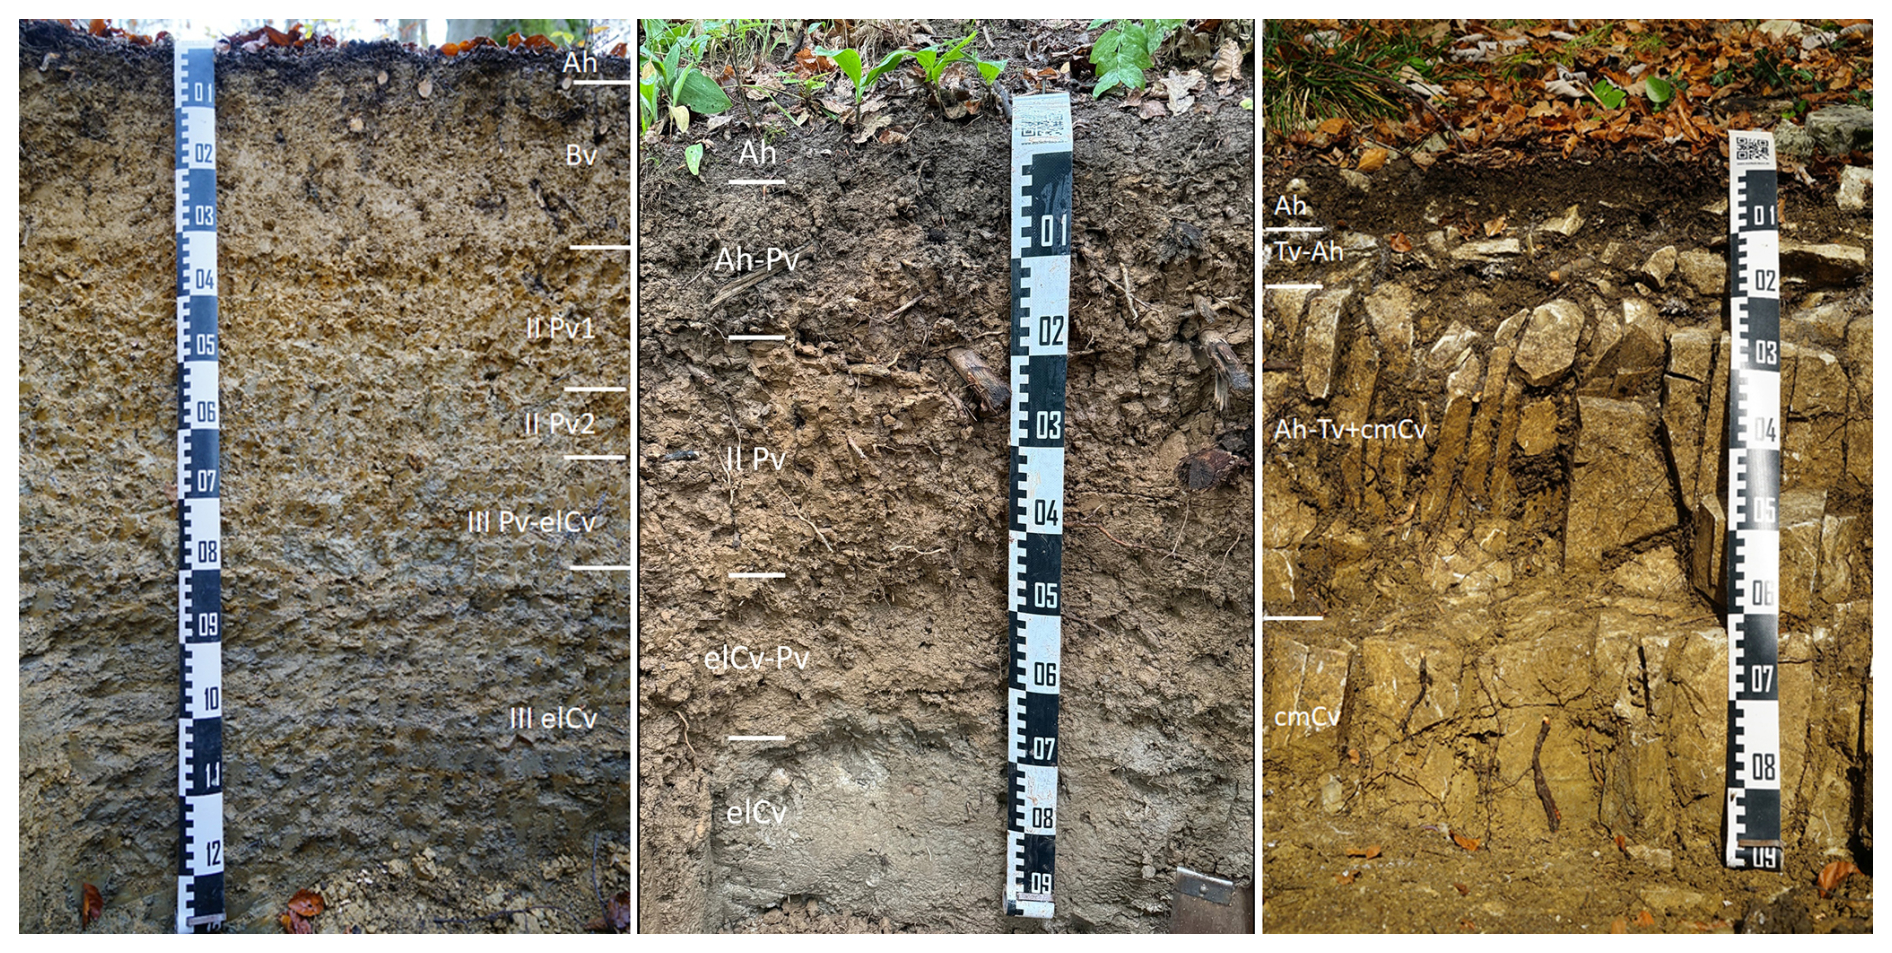
Figure 4Soil profiles at Sites 1 (left), 2 (middle), and 3 (right). The German soil classification guide (AG Boden, 2024) was used for soil description, and soil classification was done according to the World Reference Base for Soil Resources (WRB) classification system (IUSS Working Group WRB, 2022).
The profile of Site 2 is located on a steeper slope with high erosion potential. There, the upper and basal periglacial cover beds, which are typical of the periglacial region, are missing. The horizon below the Ah horizon also shows humus accumulation, as well as a distinct polyhedral structure (Pv-Ah). The presence of humic properties combined with polyhedral aggregation in this horizon can be explained by the downslope transportation and mixing of soil material during the Holocene period, which was induced by human activity. Below the Holocene cover bed are the clay-rich II Pv and elCv-Pv horizons, which cover the weathered marl stone from the Opalinus Clay Formation (elCv). The soil profile is classified as a Haplic Vertisol. At Site 3, under the humus-rich Ah horizon, there is a transition horizon rich in humus and skeletal soil material showing polyhedral structuring (II Tv-Ah). The crevices between the massif limestone bed underneath are filled with humus-rich, polyhedrally aggregated fine earth material (III Ah-Tv+cmCv). Intensive and deep rooting occurs in the interspaces, with roots extending into the underlying III cmCv horizon. The aeolian silt component, which is typical of upper periglacial layers, is still detectable in the Ah horizon. The soil is classified as a Rendzic Leptosol that developed on shallow limestone debris overlying well-bedded limestone rocks.
Due to the high base saturation in the rooted soil horizons, the trees at Sites 1 and 2 have a guaranteed nutrient supply. At Site 3, phosphorus supply may be limited due to the fixation of phosphate in the form of calcium phosphate. High calcium content in the soil solution can lead to potassium deficiency symptoms.
As this work primarily focuses on the methodological framework of the DryTrees project, the following sections present the employed approaches, including the collection of soil and tree health parameters as well as the acquisition and analysis of orthophotos using uncrewed aircraft systems (UAS).
3.1 Soil monitoring
Volumetric soil water content (VSWC, %) was measured at 20 and 40 cm depth and at four points at each of the three sites. VSWC was measured using “Teros 10” soil water content sensors (METER Group, Inc., 2026), connected to open-source data acquisition systems (“Loguino”) and recorded with a measurement accuracy of ±0.03 m3 m−3 and a temporal resolution of 30 min. Additionally, the temperature was recorded next to the sensor at 20 cm soil depth, using a D18S20 digital thermometer (±0.5 °C) (Maxim Integrated Products, Inc., USA), also connected to the Loguino.
To obtain the type and diversity of rooting at the various locations, a soil profile is dug out with the profile wall located at the border of the outer to the middle third of the crown radius of an investigated tree (Arbeitskreis Standortkartierung, 2016). At the soil profile wall, coarse and fine roots are counted using counting squares (5 × 5 cm) down to a depth of one meter. Roots with a diameter < 2 mm are classified as fine roots (Boehm, 1979).
3.2 Tree stem and crown monitoring
3.2.1 The TreeSense Pulse sensor system
To monitor tree crown vitality TreeSense Pulse sensors are installed in ten trees (five oaks and five beeches) at Site 1. The limited number of crown monitoring sensors is sourced in the limited funding for this project. These specific sensors used for this study are not in-house made. The TreeSense Pulse wearables are commercially distributed by the TreeSense GmbH located in Munich, Germany. Since 2020, TreeSense has been producing sensors to monitor the hydrological status of trees. The sensors measure the electrical resistance between two electrodes in the sapwood and the ambient temperature in the crown at 15 min intervals. The electrical resistance is largely dependent on the moisture content of the wood. The sensor box (dimensions: 8.5 × 5.5 × 3.5 cm; weight: 150 g) contains an IoT (Internet of Things) antenna that transmits the recorded data via a narrowband cellular network to a cloud-based platform, where the data become available to the user after proprietary pre-processing. The power supply is ensured by a battery (1200 mAh), which lasts up to three years.
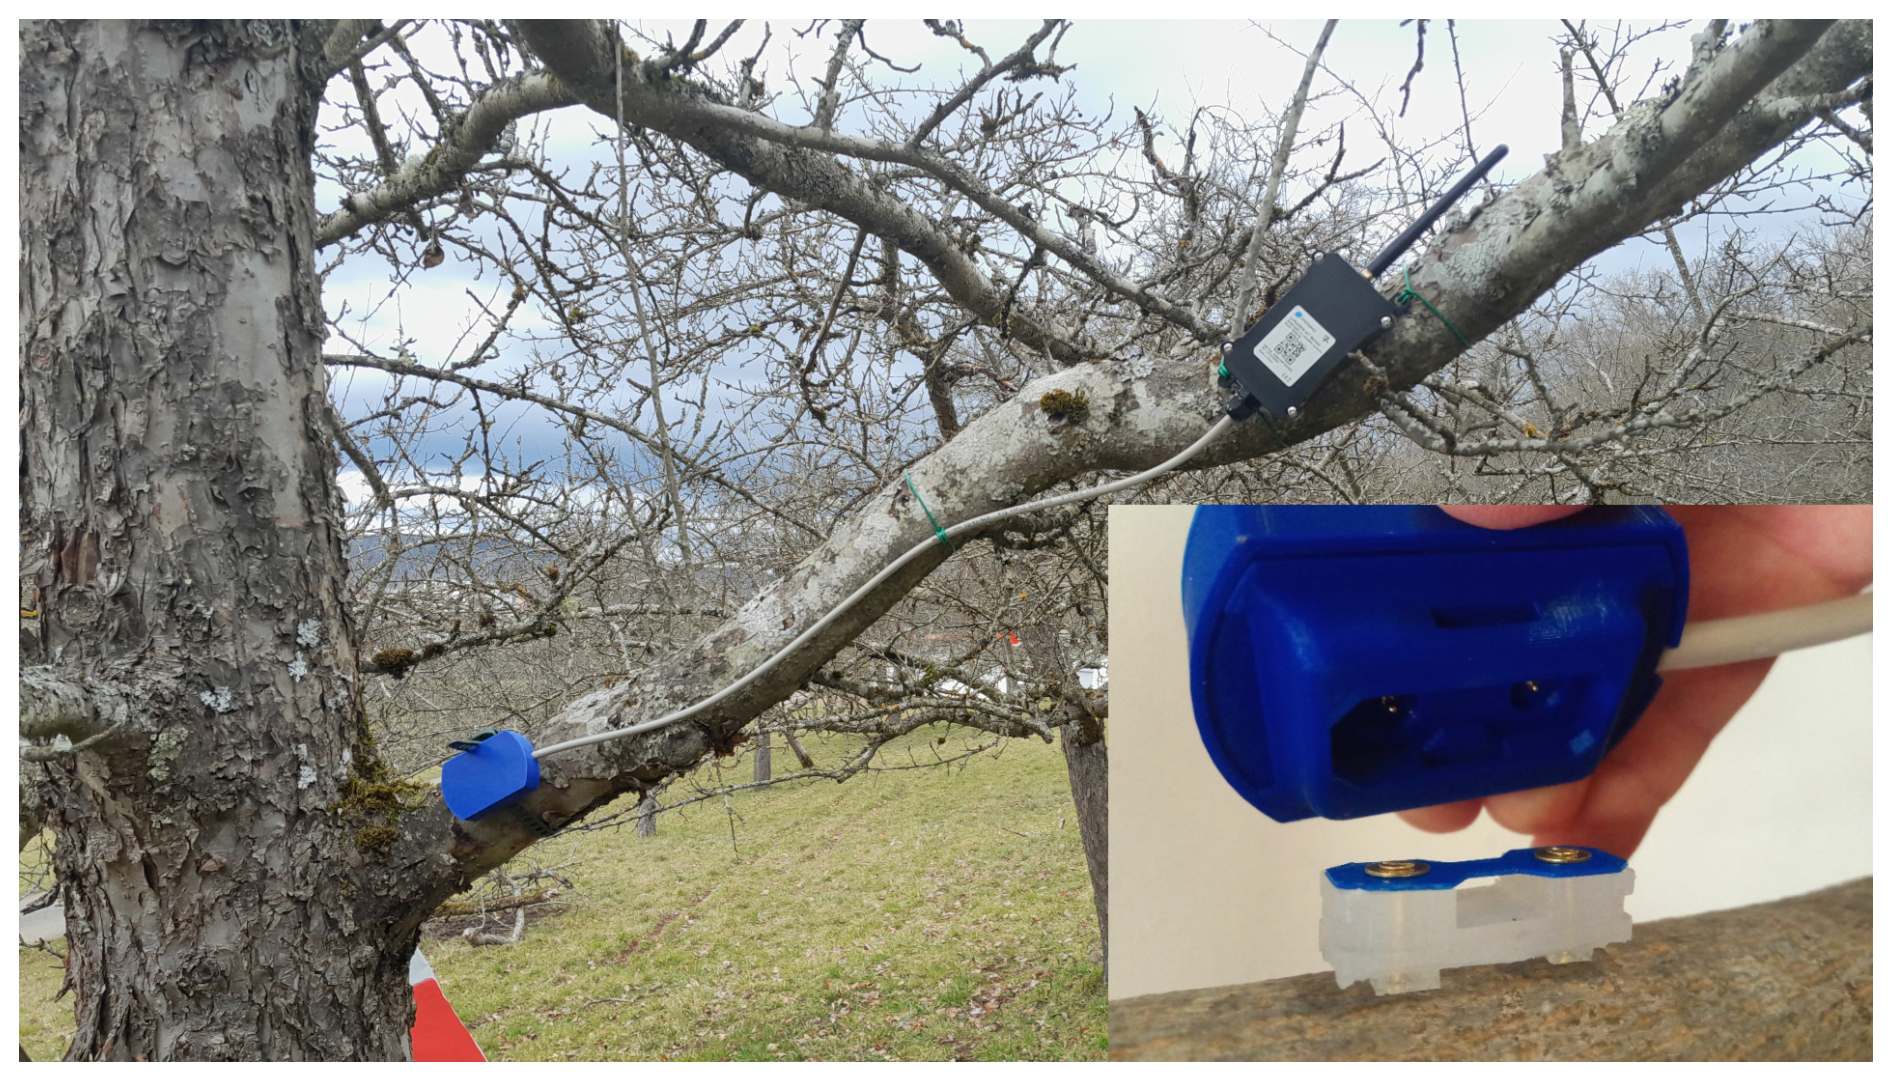
Figure 5Example of a TreeSense Pulse sensor (blue box) connected to telemetry unit on an apple tree located in an orchard meadow and embedded electrodes, screwed into a tree branch, and sensor cover with connectors to the telemetry module.
For mounting, two holes (1.5 mm diameter) are drilled approximately 9 mm deep into the sapwood at a distance of 2 cm sapwood. Brass screws are screwed into the wood as electrodes (Fig. 5). At the same time, a silicone support is attached to the screws to mount the sensor box. The predrilling and screwing in causes small wounds. However, these wounds are in the outer sapwood and therefore in very reactive tissue (Shigo, 1984), so that no relevant damage is caused to the wood.
The sensors are logging the electrical resistance in kΩ as measured values. These values initially depend on the ambient temperature of the sensors (and the sapwood). For this reason, calibration series are carried out in order to establish a compensation function (Treesense GmbH, 2020). Both the compensated values and the raw data are available to the end user. Furthermore, the measured values, for anatomical and chemical reasons, depend on the tree species. Since the electrical conductivity can also differ significantly within a tree species, it is recommended to particularly analyse the extent of the resistance fluctuations and less the absolute values (Treesense GmbH, 2020). Generally, an increase in electrical resistance, i.e. a decrease in conductivity, is interpreted as a decrease in sapwood moisture content.
3.2.2 Dendrometers
All selected trees on Site 1, 2, and 3 are equipped with spring-loaded linear displacement potentiometers (MMR 10 11 R5 K) with a resolution of < 2.5 µm and a resistance tolerance of ±2 % (MEGATRON Elektronik GmbH & Co. KG, 2026; Delta-T Devices Ltd, 2000) to record radial changes of the stem. The potentiometers, henceforth referred to as dendrometers, are mounted in the centre of stainless steel frames and then attached to the stem at a height of 1.3 m with two screws anchored at least 5 cm deep in the xylem and at least 6 cm from the measurement point. They are placed with the tips in the innermost bark after the outer parts have been partially removed without damaging the living bark or cambium. Each dendrometer is protected by a cover, connected to a Dl2e data logger (Delta-T Devices Ltd, 2000) and recorded every 30 min. Each sensor was connected to two differential mode channels of the DL2e, one channel to measure the resistance across the variable potentiometer and the second channel to measure the total resistance of the sensor's conductive plastic. The readings of the second channel are further used to compensate for the humidity dependency of the conductive plastic, like we did it in our previous projects (Niessner et al., 2024, 2025).
3.2.3 Sap flow meters
We use pairs of home-made sap flow sensors based on the method described by Granier (1985, 1987). These sensors are installed at a height of 1.3 m on the north side of each stem. Each sensor consists of a pair of copper-constantan thermocouples mounted in 2 cm long needles, placed in the xylem at a vertical distance of approximately 10 cm. The upper sensor is continuously heated with 120 mA, and the temperature difference is recorded every 10 min using a “Loguino” along with the dendrometer. Higher sap flow leads to faster heat dissipation, resulting in smaller temperature differences. Zero-flow conditions are assumed during nighttime and used for regular recalibration of the temperature difference baseline. While the thermal dissipation method is widely established for monitoring sap flow (Lu et al., 2004) and was used by us in previous projects (Niessner et al., 2024, 2025), uncertainties related to radial and circumferential variability in sap flux density and the effective sapwood depth can affect estimates of absolute sap flow. Consequently, absolute values should be interpreted with caution, whereas temporal dynamics and relative changes are generally well captured.
3.2.4 Dendrochronology
At each of the three sites, we sampled 15 individuals of beech and 15 individuals of oak, including the ten trees per species and site equipped with dendrometers, as well as five additional trees. From each tree, two increment cores (5 mm diameter) were extracted at breast height (1.3 m), perpendicular to the slope and from opposite sides of the trunk, using increment borers (Haglöf, Sweden). The cores were mounted on wooden holders and the surfaces were prepared using a corel microtome to ensure a smooth finish for subsequent analysis (Gärtner and Nievergelt, 2010). Tree-ring widths were measured using the WinDENDRO software (Regent Instruments Inc., Canada). Tree-ring boundaries were manually marked, and measurements were recorded with a resolution of 0.01 mm. The resulting data were used to determine tree age and to assess growth responses to extreme drought events, with a particular focus on resistance, recovery, and resilience (Lloret et al., 2011).
3.3 UAS orthophotography
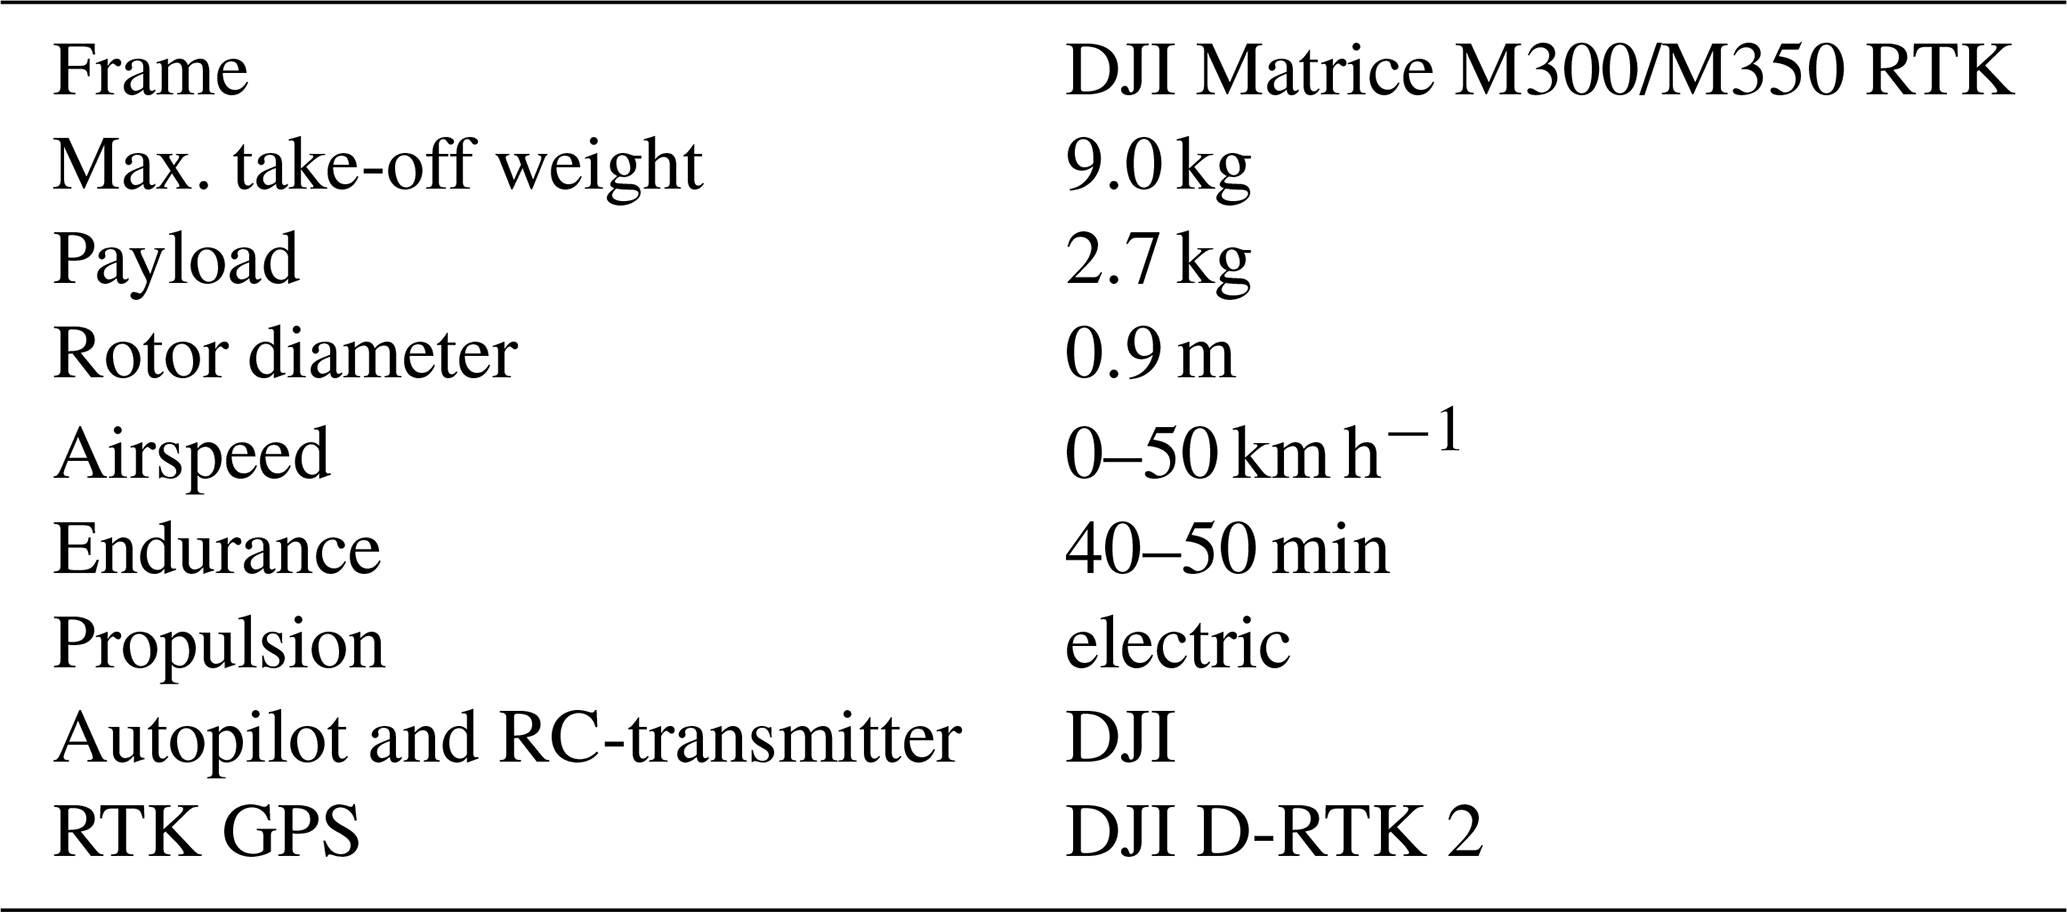
UAS-based orthophotography is part of the vitality monitoring of the studied trees. A DJI M300 RTK is used as the basis for this task and can legally be operated with a A1/A3 licence in the open category. The M300 platform enables flight missions of up to 50 min, which is more than sufficient for the 0.2 ha that are covered per measurement site. Take-off and landing points are within 150 m of the measurement locations. The terrain-following flight missions are planned in UAV Editor (http://www.uaveditor.com, last access: 13 April 2026) and the path accuracy in flight is supported by an RTK (real time kinematic) GPS system (see also Table 2 for more technical specifications). The flight legs are planned such that the overlapping of the images is at a minimum 80 %. The obtained images are merged into an orthophoto using Agisoft Metashape (see also Sect. 3.6).
3.3.1 MicaSense multi-spectral camera
The MicaSense RedEdge-MX Dual camera is a multi-spectral sensor designed for high-precision vegetation analysis and remote sensing applications. The MicaSense camera system has successfully been used for close-range plant vitality studies (Goebel and Iwaszczuk, 2023). In our study, we use the MicaSense camera in a remote sensing application to capture multi-spectral imagery in ten discrete bands (coastal blue, blue, green 1 & 2, red 1 & 2, red-edge 1 & 2, and near-infrared). These bands enable the calculation of vegetation indices such as the Normalized Difference Vegetation Index (NDVI) and the Red-Edge Chlorophyll Index. These indices provide critical insights into vegetation health, chlorophyll content, and potential drought stress in trees. The high spectral resolution of the RedEdge-MX allows for detailed canopy assessments, complementing the thermal and RGB imagery obtained from the DJI Zenmuse H20T. Mounted on an RTK-enabled UAS, the sensor ensures georeferenced data acquisition, facilitating accurate monitoring of forest conditions over time.
The RedEdge-MX Dual camera produces ten files per capture with a resolution of 2180 × 960 pixels. Each file has a size of approximately 2.5 MB and is stored as a 16-bit uncompressed TIFF image.
3.3.2 Zenmuse H20T camera
The DJI Zenmuse H20T is a high-precision multi-sensor RGB and thermal camera system designed for aerial data collection and remote sensing applications. It integrates a 20 MP zoom camera, a 12 MP wide-angle camera, a radiometric thermal camera, and a laser rangefinder, making it highly versatile for various scientific and industrial purposes. The thermal imaging module provides radiometric temperature measurements, allowing for detailed heat distribution analysis, which is particularly useful in environmental monitoring, forestry, and infrastructure inspections. The zoom and wide-angle cameras facilitate high-resolution visual mapping and object recognition, while the laser rangefinder enhances spatial accuracy by providing real-time distance measurements up to 1200 m. When paired with DJI's M300 RTK drone, the H20T benefits from RTK-enabled georeferencing, improving positional accuracy in photogrammetric applications. Due to its integrated multi-sensor design, the Zenmuse H20T is particularly well-suited for scientific studies requiring a combination of thermal, optical, and spatial data in a single acquisition workflow.
In this study, we utilise the zoom camera module to capture detailed RGB imagery, enabling precise identification of tree canopy structures and foliage conditions. Additionally, the radiometric thermal camera is employed to assess temperature variations within the forest canopy, providing insights into heat distribution and potential indicators of drought stress in trees. The combination of high-resolution RGB and thermal imaging is a valuable addition to the MicaSence multi-spectral camera and the combined systems allow for a comprehensive analysis of tree vitality, particularly in assessing stress responses to environmental factors. The thermal camera also enables an individual crown examination during a phase of developed dry stress. This enables high-frequency monitoring of less (stressed) individuals. This means that area information is lost but temporal information is obtained. Integrated with the DJI Matrice 300 RTK, the system ensures high positional accuracy, making it well-suited for repeated measurements and long-term monitoring of forest health.
3.4 Micro-climate monitoring
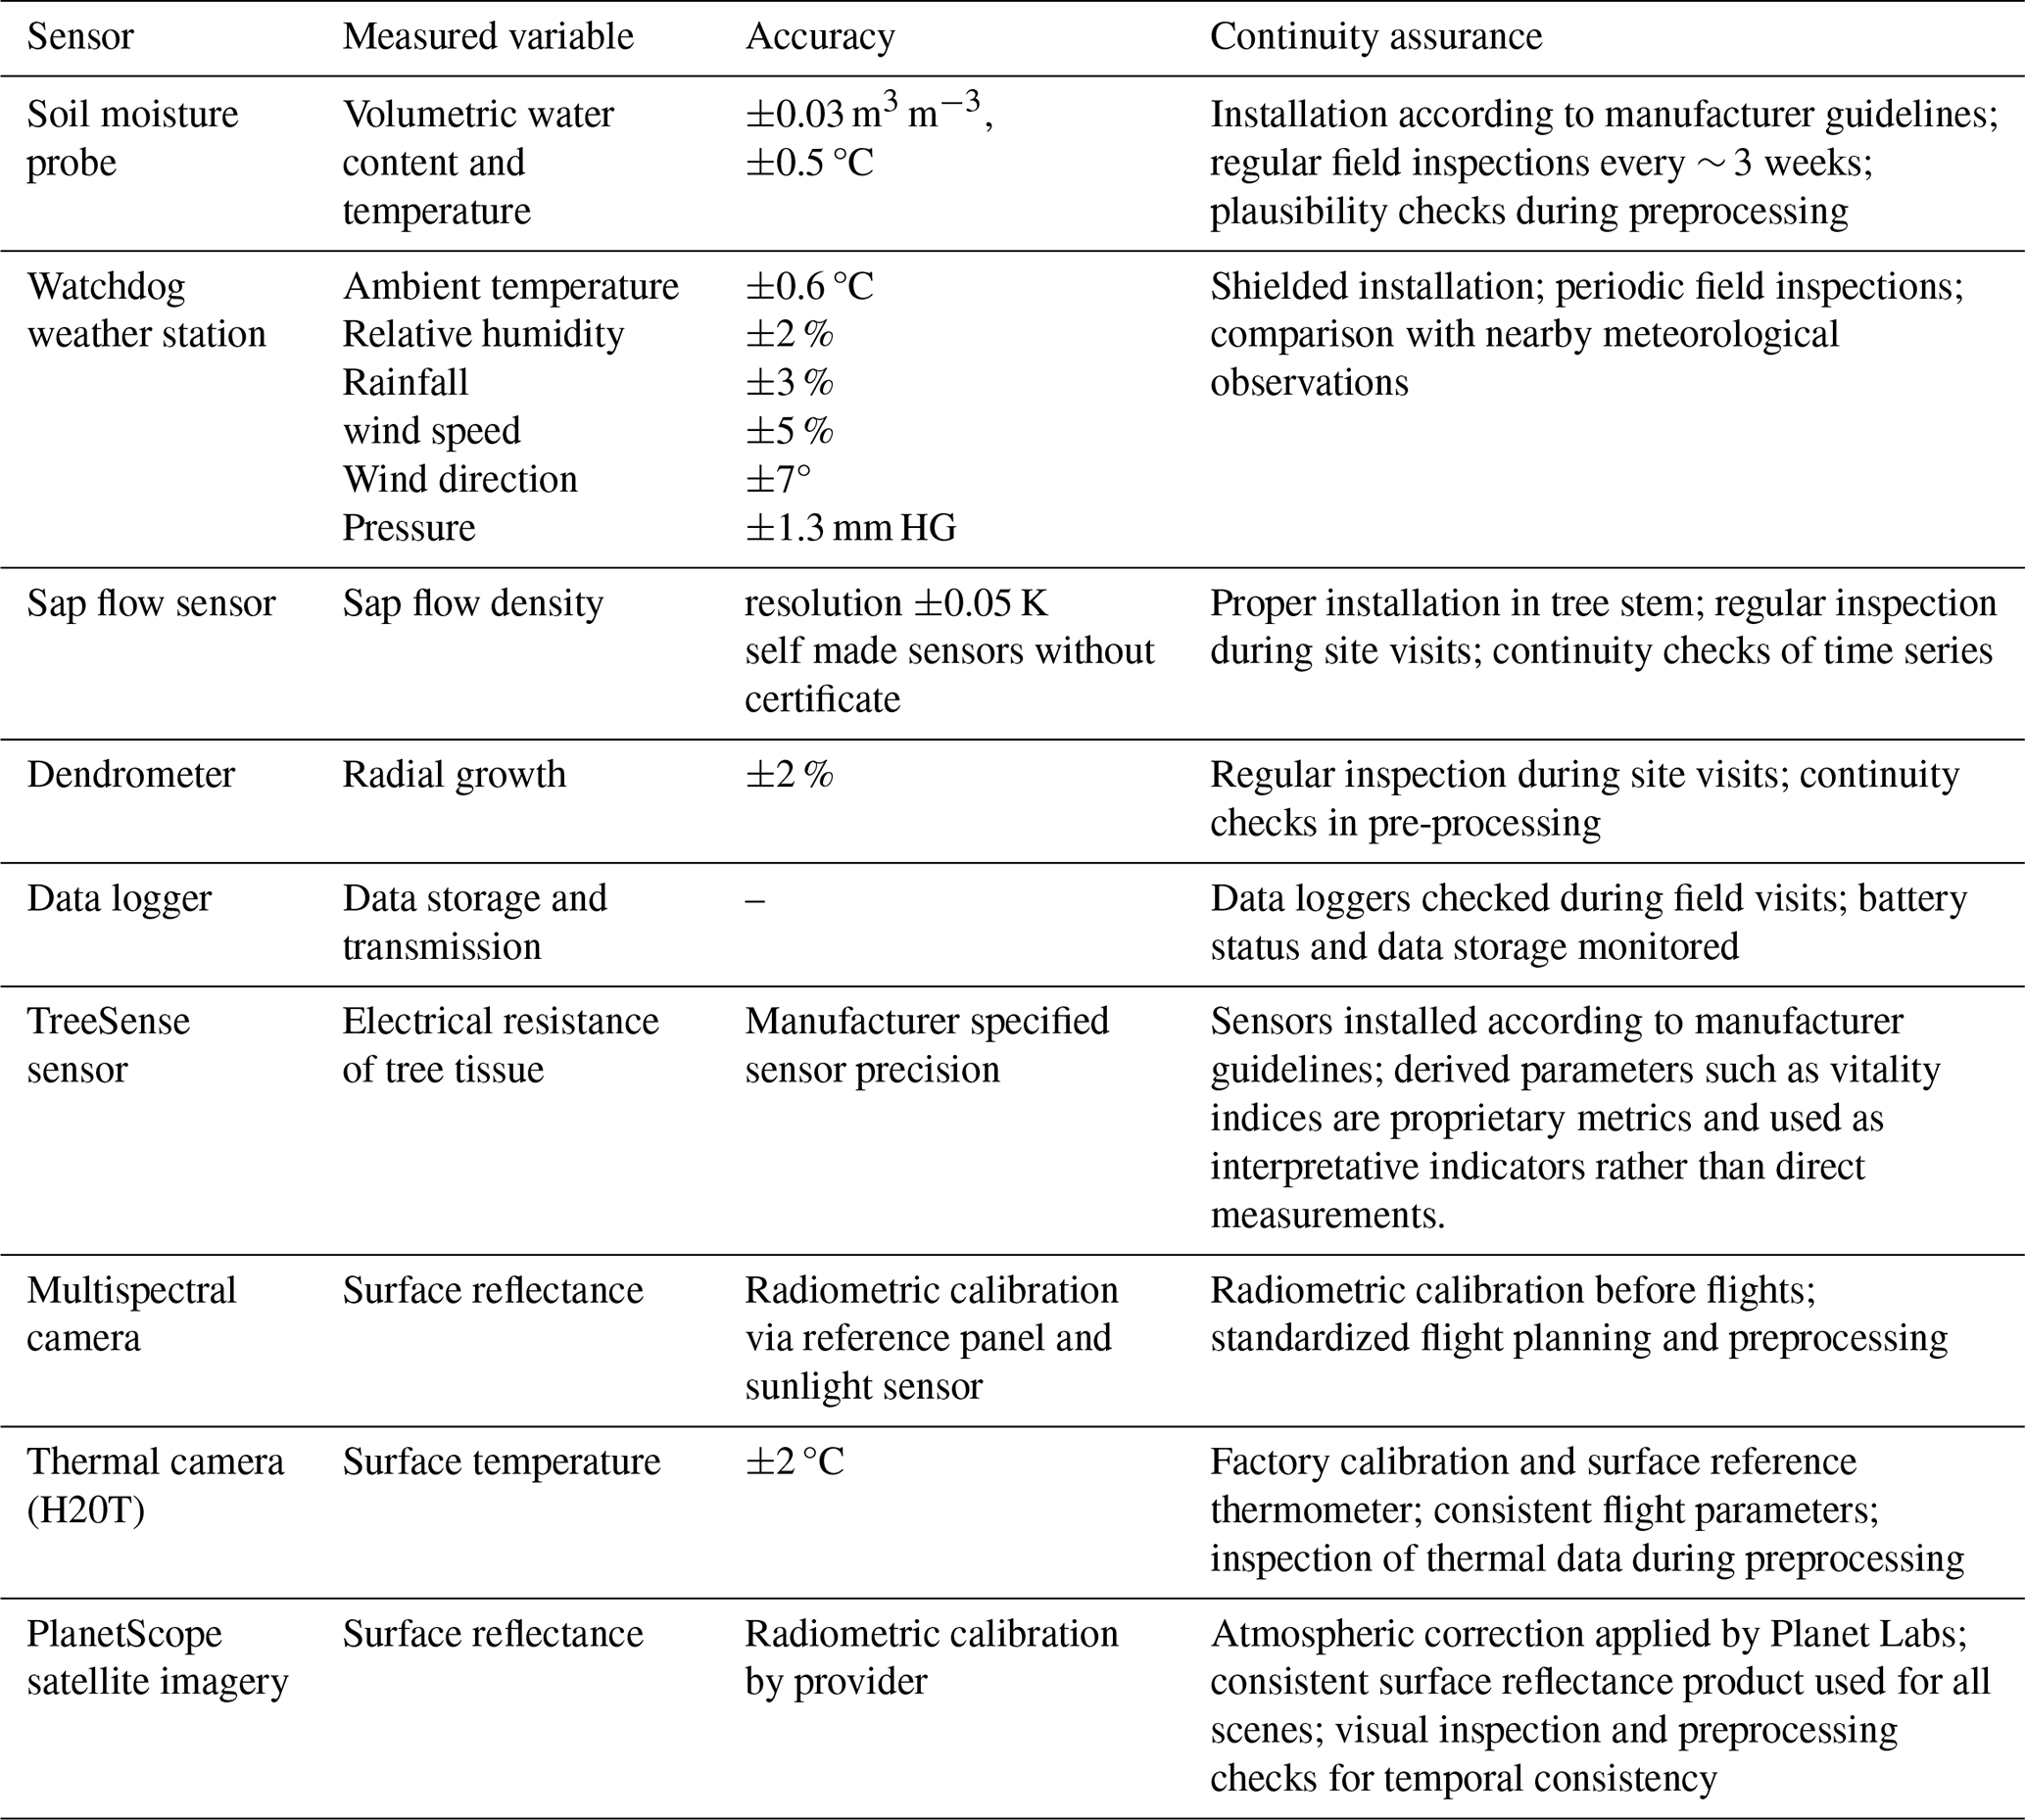
WatchDog 2700ET weather stations (Spectrum Technologies, Inc., 2008) were installed at Site 1 and Site 3. Since Site 2 is only a few hundred metres from Site 1, a separate weather station was not necessary. The weather stations record rainfall, air temperature, relative humidity, air pressure, wind speed, and direction at 15 min intervals, see Table 3 for the respective accuracies. Additional meteorological data could be obtained from the nearby DWD weather station 2074, located just 1.5 km west of Site 1. The water vapour pressure deficit (VPD, hPa) is calculated after Goff and Gratch (1946) from recorded air temperature, humidity and pressure.
Table 3Overview of sensors used in the DryTrees project, including measurement accuracy (manufacturer specification) and measures ensuring time series continuity.
3.5 Data continuity and quality assurance
To ensure data continuity and quality assurance, the following procedures were implemented. The sensors used in the DryTrees project are widely applied in environmental and ecological monitoring studies and were selected based on their proven reliability in long-term field deployments. To ensure data continuity and quality, all measurements undergo routine quality control procedures, including plausibility checks, gap detection, and inspection of the temporal consistency of the recorded time series.
TreeSense sensors installed on selected trees measure the electrical resistance of tree tissue. Derived parameters provided by the manufacturer, such as vitality indices or temperature-compensated resistance values, are not interpreted as direct physical measurements but rather as indicators supporting the interpretation of tree physiological status. In this study, these derived metrics are therefore treated as auxiliary indicators, while the primary analysis is based on the underlying measured signals and their temporal dynamics.
In addition, regular field inspections are conducted approximately every three weeks during the vegetation period to verify sensor positioning, inspect cables and installations, change batteries and check the operation of the data loggers. Dendrometers were oiled once a year and if necessary readjusted. These inspections help ensure the stability and continuity of the recorded time series.
Satellite data from the PlanetScope constellation were used as atmospherically corrected surface reflectance products provided by Planet Labs. These products are radiometrically calibrated and processed using standardized atmospheric correction algorithms, ensuring comparability between acquisition dates and supporting the analysis of temporal patterns.
3.6 Data pre-processing
A lot of data streams, from soil and weather data to tree crown observation data over stem growth data, have to be merged for further data evaluation. This data pre-processing of the in-situ sensors and the pre-processing of the remote sensing data, i.e. UAS data, is explained below.
3.6.1 TreeSense pulse crown vitality sensors
The pre-processing of the TreeSense crown sensors is done by the manufacturer. The processed data can then be downloaded from the TreeSense cloud, e.g. as a comma-separated file. The sensor vitality measure is a proprietary method for which the manufacturer does not disclose any further information.
3.6.2 Dendrometer
The raw values of the two channels per dendrometer (measured in ohms) were processed by dividing the resistance of the variable potentiometer by the total resistance of the conductive plastic. The resulting ratio was then multiplied by 1.1 to account for the sensor's measuring length of 11 mm. To obtain the accumulated change in stem radius in µm, the values are multiplied by 1000 and the initial value is subtracted from each value in the time series so that the time series starts at 0. The time series of each individual tree is visually inspected, and outliers or phases with unusual high-frequency fluctuations are deleted. Such disturbances may arise from technical issues (e.g., damaged cables or sensor malfunction) as well as external influences, including animals nesting beneath protective covers or mechanical disturbances caused by wind or human interference. These artifacts are identified by abrupt, implausible changes in the recorded signal over 25 µm between consecutive measurements. Sudden jumps in the data caused by adjusting the sensors on the stem surface are automatically detected (threshold: ) and all subsequent values are corrected accordingly. Daily stem radius changes (SRC), the maximum daily stem radius shrinkage (MDS) and the stem water deficit (TWD) are derived from these time series of each tree. The daily SRC is calculated after Köcher et al. (2012) as the difference between the maximum stem radii in the morning of two subsequent days. MDS is the difference between the morning maximum stem radius and the following midday minimum (Downes et al., 1999; Deslauriers et al., 2003). The TWD is calculated as the difference between the highest previous stem radius and the current stem radius, given that the current stem radius is smaller than previously, otherwise, TWD = 0 (Zweifel et al., 2016). In order to quantify drought stress and compare it between trees, we normalized TWD according to Peters et al. (2025). Normalized TWD (TWDnorm) was derived by dividing the pre-dawn TWD (TWDpre-dawn) by the maximum MDS observed during the vegetation period (MDSmax), where MDSmax corresponds to the 99th percentile of all multi-year MDS measurements.
3.6.3 Sap flow
Before further processing of the data, all outliers and periods without power supply are removed. Such disturbances may result from technical issues like cable breakage or sensor malfunction. These artifacts are identified based on implausible temperature differences (dT) between sensors, specifically when dT falls below 2 K or exceeds 20 K, or when dT changes by more than 1 K between consecutive measurements. The sap flow rates for each sensor and day are calculated using the following method by Granier (1987):
where dT is the actual temperature difference measured and dTdmax is a reference value for zero sap flow derived from a linear interpolation between the maximum daily temperature difference of the day before and the actual day. The determined flux of sap flow density (g cm−2 s−1) is extrapolated to the entire tree and day using the R package developed by Berdanier et al. (2016), which accounts for the sapwood area of the tree. The total area of sapwood is estimated by visual inspection of the cores of the trees. Stand water use can subsequently be estimated by extrapolating the measured tree water use of instrumented trees to all trees within a given site. By modeling sap flow based on soil moisture and vapor pressure deficit (VPD), stand water use can further be simulated under changing future climatic conditions (Niessner et al., 2025).
3.6.4 Soil moisture
At first, data outliers are removed, which are primarily caused by power shortage, cable failures, or sensor malfunctions. Data outliers are identified when a single sensor indicates a soil moisture change of more than 10 % between two measurements, while the other sensors at the same location do not record a comparable change. Then four time series at each site and soil depth are averaged for each soil depth in order to receive the site's average volumetric soil content (VSWC). The volumetric soil water content is highly influenced by soil conditions (Cassel and Nielsen, 1986). To account for this variability, VSWC has been normalised as relative extractable water (REW). REW represents the ratio of available soil water and the maximum extractable water, as described by Granier (1987), and is defined by the following equation:
In this context, VSWCmax corresponds to the soil water content at field capacity, while VSWCmin represents the permanent wilting point.
3.6.5 Data merging
To enable a consistent analysis of the various time series at high temporal resolution, all data sources are harmonised to a uniform frequency of 10 min. Dendrometer, soil moisture, and weather data, originally recorded at 30 min intervals, are resampled and interpolated using the resample and interpolate functions from the Python module pandas. TreeSense pulse data, initially logged at irregular 2 h intervals and later every 30 min – often not aligned to full hours or minutes – are processed using the time-series function of the traces module to produce interpolated values at 10 min intervals. All transformed time series are then merged using the concat function from pandas to form a synchronised dataset suitable for further analysis.
3.6.6 Multispectral UAS data
To process the UAS data for photogrammetric analysis, Structure from Motion (SfM) methods are implemented. Structure from Motion automatically extracts 3-dimensional features from a series of overlapping and unstructured single images captured by a moving sensor, here UAS (Deliry and Avdan, 2023). These processes are initiated in the Metashape software from AGISOFT. In general the acquired individual images should cover the scene or object from different angles without any gaps (Iglhaut et al., 2019). To calculate the 3-dimensional position, every point has to be redundant in at least two images. For this purpose, the flight path of the UAV is adjusted for each site. According to terrain or object, the image overlap should be set adequately (Iglhaut et al., 2019; Deliry and Avdan, 2023). At a flight height of 100 m above ground, images are taken approximately every two seconds and overlap sideways by 80 %. Forward overlap is set to 90 %. Essentially, the result of SfM strongly depends on the input image quality, in particular lighting and sharpness (Iglhaut et al., 2019). Metashape is able to use the reflectance calibration panel and a sun reflectance sensor directly mounted on the UAS in order to detect the calibration images automatically and save them for the subsequent calibration process. The reflectances of each band is stored in the calibrate reflectance menu item for the Micasense red-edge dual camera and are available for automated access for calibration. Once the images from the flight are imported into Metashape, the actual SfM workflow starts with aligning the photos. In a first step, an algorithm determines significant points (image feature points) in the individual images. These characteristic points include, for example, certain corners or other geometric properties as well as special features in the texture or contrast of objects (Mancini et al., 2013; Iglhaut et al., 2019). In general, the alignment stage includes three phases: (1) key point detection, (2) identification of matching key points and (3) removal of inconsistent key points (Deliry and Avdan, 2023). By comparing each image, key points are linked across the entire image series in each image and their position in the image sequence is tracked (Mancini et al., 2013). Based on the identified key points, 3-dimensional points in a point cloud are calculated based on pixels from 2-dimensional single images (Iglhaut et al., 2019; Deliry and Avdan, 2023). This calculation is performed in several steps. First, the so-called sparse cloud is generated. The sparse cloud contains the key points between the images and their corresponding colour values. In addition, inner and outer camera calibration parameters as well as their position and spatial orientation at the time of the respective recording are stored in here (Mancini et al., 2013; Deliry and Avdan, 2023). The points are not yet as dense and detailed in the sparse cloud as in the actual point cloud.
A subsequent, very computationally intensive operation forms the dense point cloud. Each photo is analysed in more detail and the sparse point cloud is significantly densified. The selection of reconstruction parameters such as “reconstruction quality” and “depth filtering” determines the level of detail and density, i.e. the number of points in the dense point cloud and the extent to which outliers are removed (Deliry and Avdan, 2023). The dense point cloud that is generated in this process provides the base for further SfM products and processing stages such as a 3D polygonal mesh model, various digital elevation models (DEMs) and a georeferenced orthomosaic (Iglhaut et al., 2019). The raw images captured by the MicaSense RedEdge dual camera system are stored in 16-bit format. However, the sensor's actual radiometric resolution is 15 bits (i.e., the digital numbers range from 0 to 32 767). The use of a 16-bit image format (ranging from 0 to 65 535) is due to standard data handling and file format compatibility, not to an extended dynamic range of the sensor itself. To derive reflectance values, raw pixel values are normalised by dividing by the maximum 15-bit digital number value (32 767), after applying radiometric calibration factors (e.g., gain, offset, panel correction). This ensures that the resulting reflectance values range between 0 and 1, representing the proportion of incoming radiation reflected by the surface. Subsequently, within the workflow, the orthomosaic can be created in the Metashape workflow. UAS-SfM represents a cost-efficient and time-saving method for the generation of high-resolution and detailed 3D objects and orthoimages at centimetre scale (Deliry and Avdan, 2023). Technological innovations also significantly reduced the cost and complexity of the method. Moreover, the results of UAS SfM are comparable to those of terrestrial or aerial laser scanning acquisition in numerous scenarios (Mlambo et al., 2017).
3.6.7 Multispectral satellite data
Multispectral satellite imagery from the PlanetScope (PS) constellation (Planet Labs PBC) will be used to complement UAS-based remote sensing data. The PlanetScope imagery consists of four spectral bands (blue: 455–515 nm, green: 500–590 nm, red: 590–670 nm, NIR: 780–860 nm) with a ground sample distance of 3.7 m (resampled to 3 m). The Level 3B surface reflectance product, which is atmospherically corrected and orthorectified, was used for all analyses. Images are selected to match the UAS flight dates as closely as possible.
3.7 Post-processing
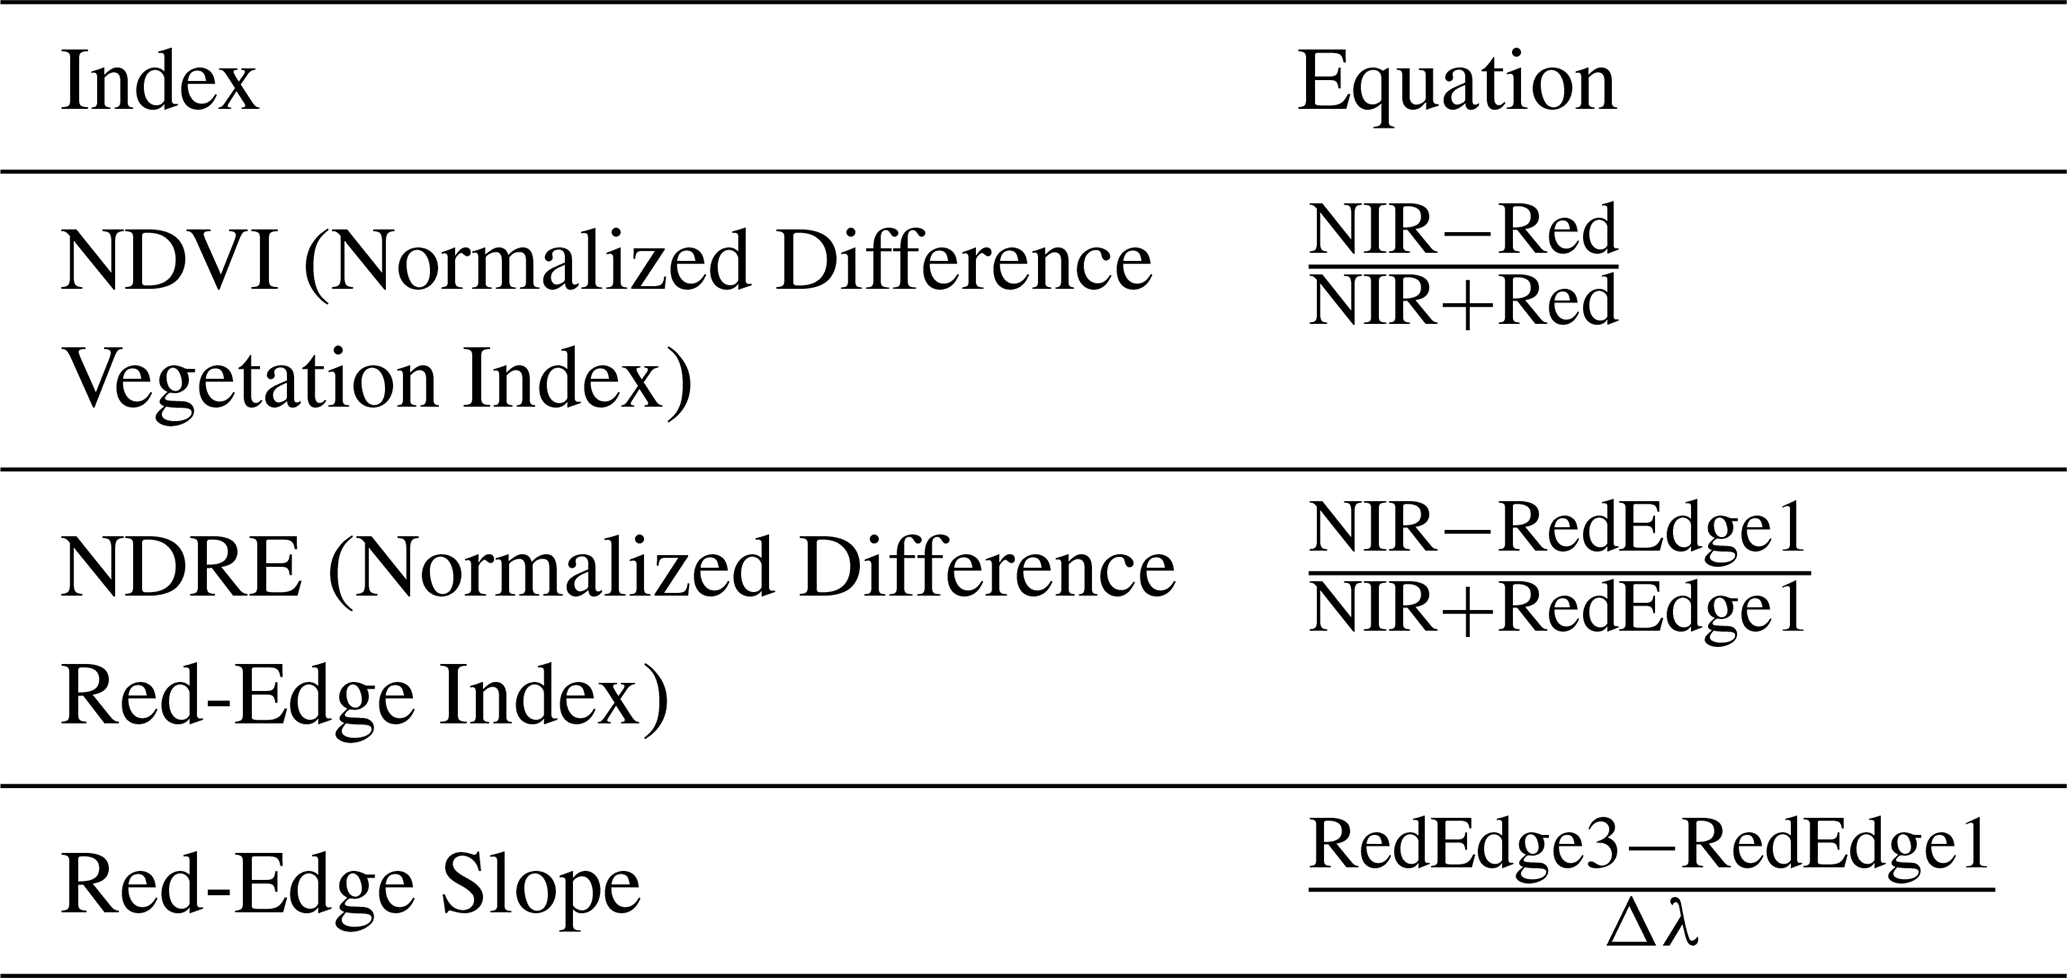
Orthophotography and satellite images of forests, in particular ensembles of trees of different height, may suffer from canopy shadowing (Xu et al., 2019). While we acknowledge recent advances in satellite imagery correction, to avoid incorrect calculations, overshadowed parts of canopies are masked. For each study site a specific mask is created and adjusted for each orthomosaic of each observation. This mask delineates the tree canopies of individuals that are instrumented with dendrometers at ground level. Vegetation indices such as the NDVI, NDRE and red-edge slope are calculated (see also Table 4) and averaged over each canopy from these pixels inside the canopy mask. The red-edge is the sharp change in leaf reflectance between 680 and 750 nm and has been measured on leaves of a variety of species by first derivative reflectance spectrophotometry. Compared to broad-band reflectance, red-edge measurements are particularly suitable for early stress detection (Horler et al., 1983).
Table 4Overview of the vegetation indices used and their equations.
This section presents the results of the in-situ monitoring and remote sensing observations collected within the DryTrees project. First, exemplary in-situ measurements are shown, focusing on the relationships between soil moisture, tree physiological responses, and growth dynamics. Subsequently, results derived from remote sensing are presented, highlighting spatial patterns and temporal developments in canopy condition. Together, these results provide a comprehensive view of the observed tree responses to varying environmental conditions.
4.1 In-situ monitoring data
4.1.1 Soil – stem growth
To analyse the relationship between soil moisture and tree growth, soil water content at 20 cm depth was compared with radial growth of beech and oak. The measurements are shown in Fig. 6.
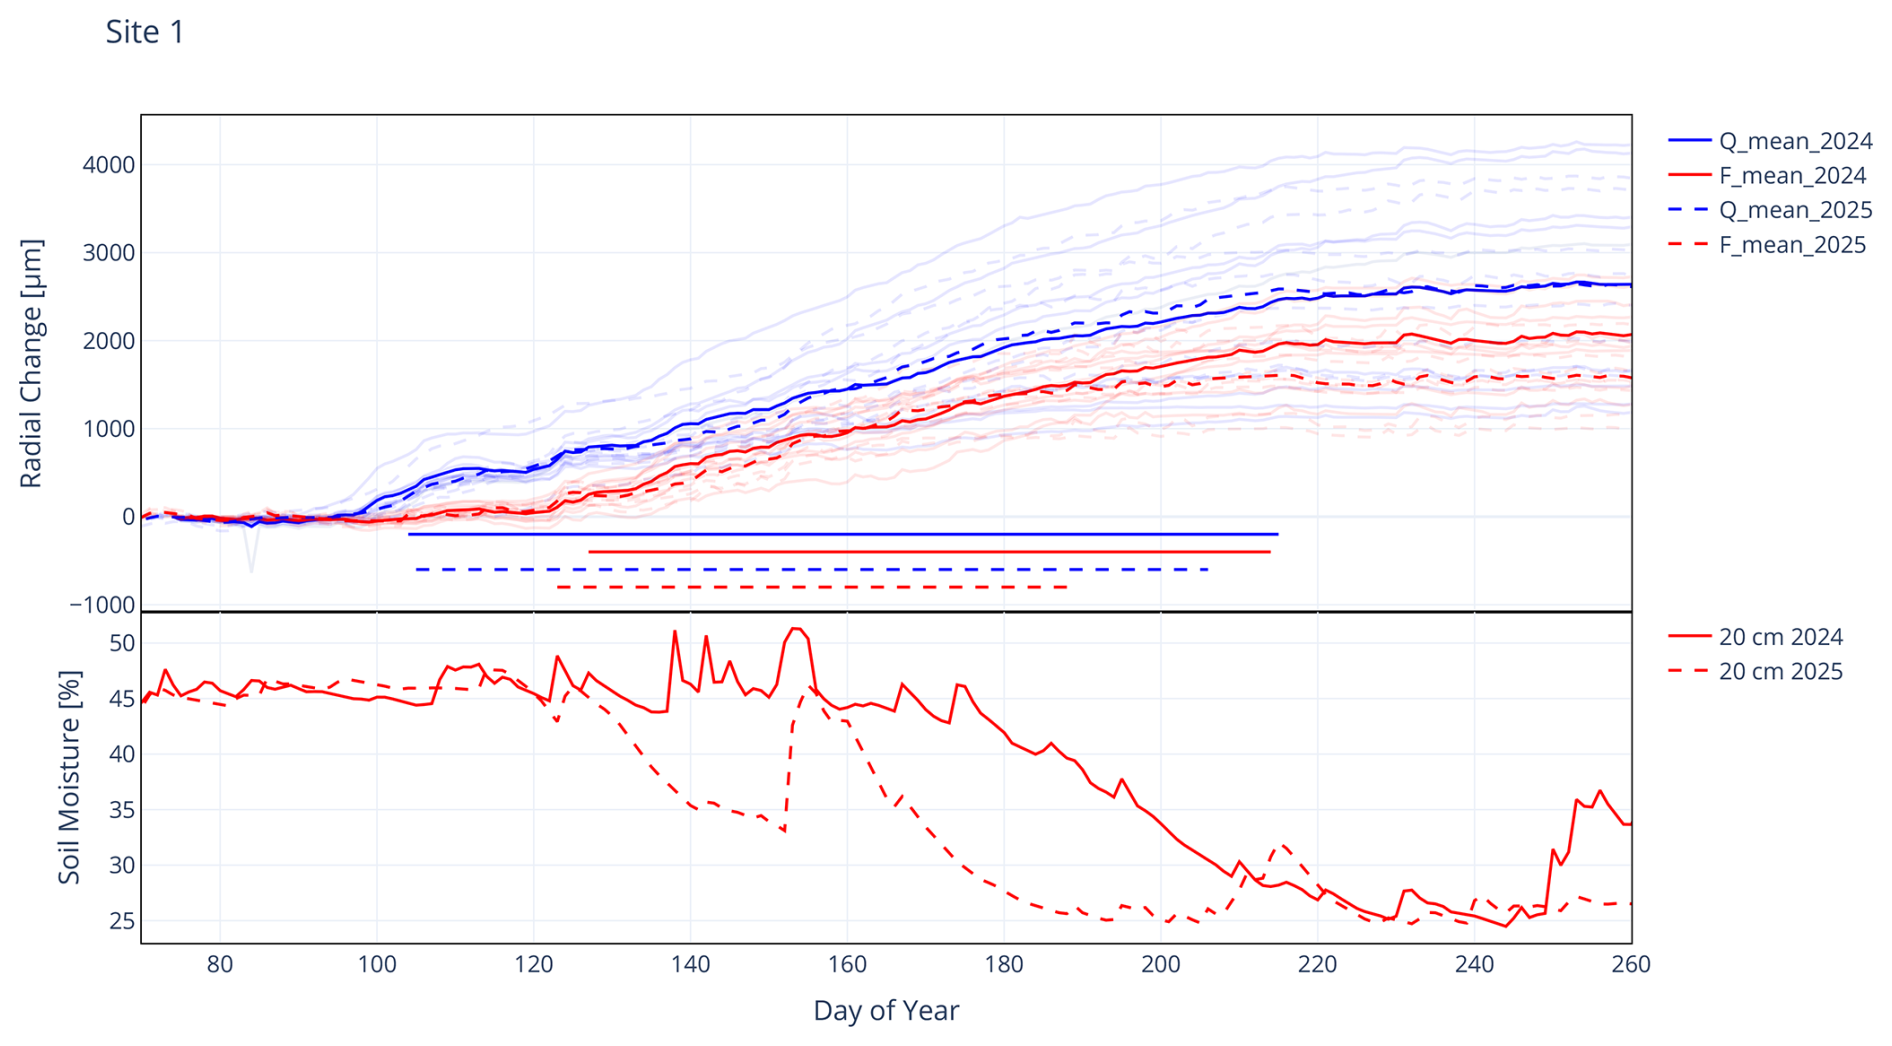
Figure 6Accumulative stem radial change of Quercus sp. (Q) and Fagus sylvaticus (F) during 2024 and 2025, together with the corresponding soil moisture in 20 cm soil depth. The horizontal lines in the upper panel indicate the estimated time span of growth.
In 2024, soil moisture remained relatively stable at around 45 % until approximately DOY 175 (23 June), followed by a gradual decline to about 25 % by DOY 230 (17 August). Correspondingly, radial growth in beech continued until around DOY 215 (2 August).
In contrast, 2025 was characterised by an earlier onset of soil drying. Soil moisture fell below 45 % before DOY 130 (10 May), showed a brief recovery around DOY 150 (30 May), and then declined again to approximately 25 % by DOY 190 (9 July). This earlier decrease in soil moisture was reflected in reduced growth, with beech trees ceasing radial growth already around DOY 190.
Oak trees exhibited a similar pattern, with growth stopping earlier in 2025 (around DOY 205, 24 July) compared to 2024, although the overall radial growth was comparable between the two years.
Overall, the earlier soil moisture decline in 2025 resulted in a shorter growing period, particularly for beech.
4.1.2 Soil – stem hydration
At levels below 20 % relative extractable water (REW), a stem water deficit begins to build up (Fig. 7). TWDnorm reaches higher values in 2025 than in 2024 for both species, and in beech even values higher than 1, i.e., significant drought stress.
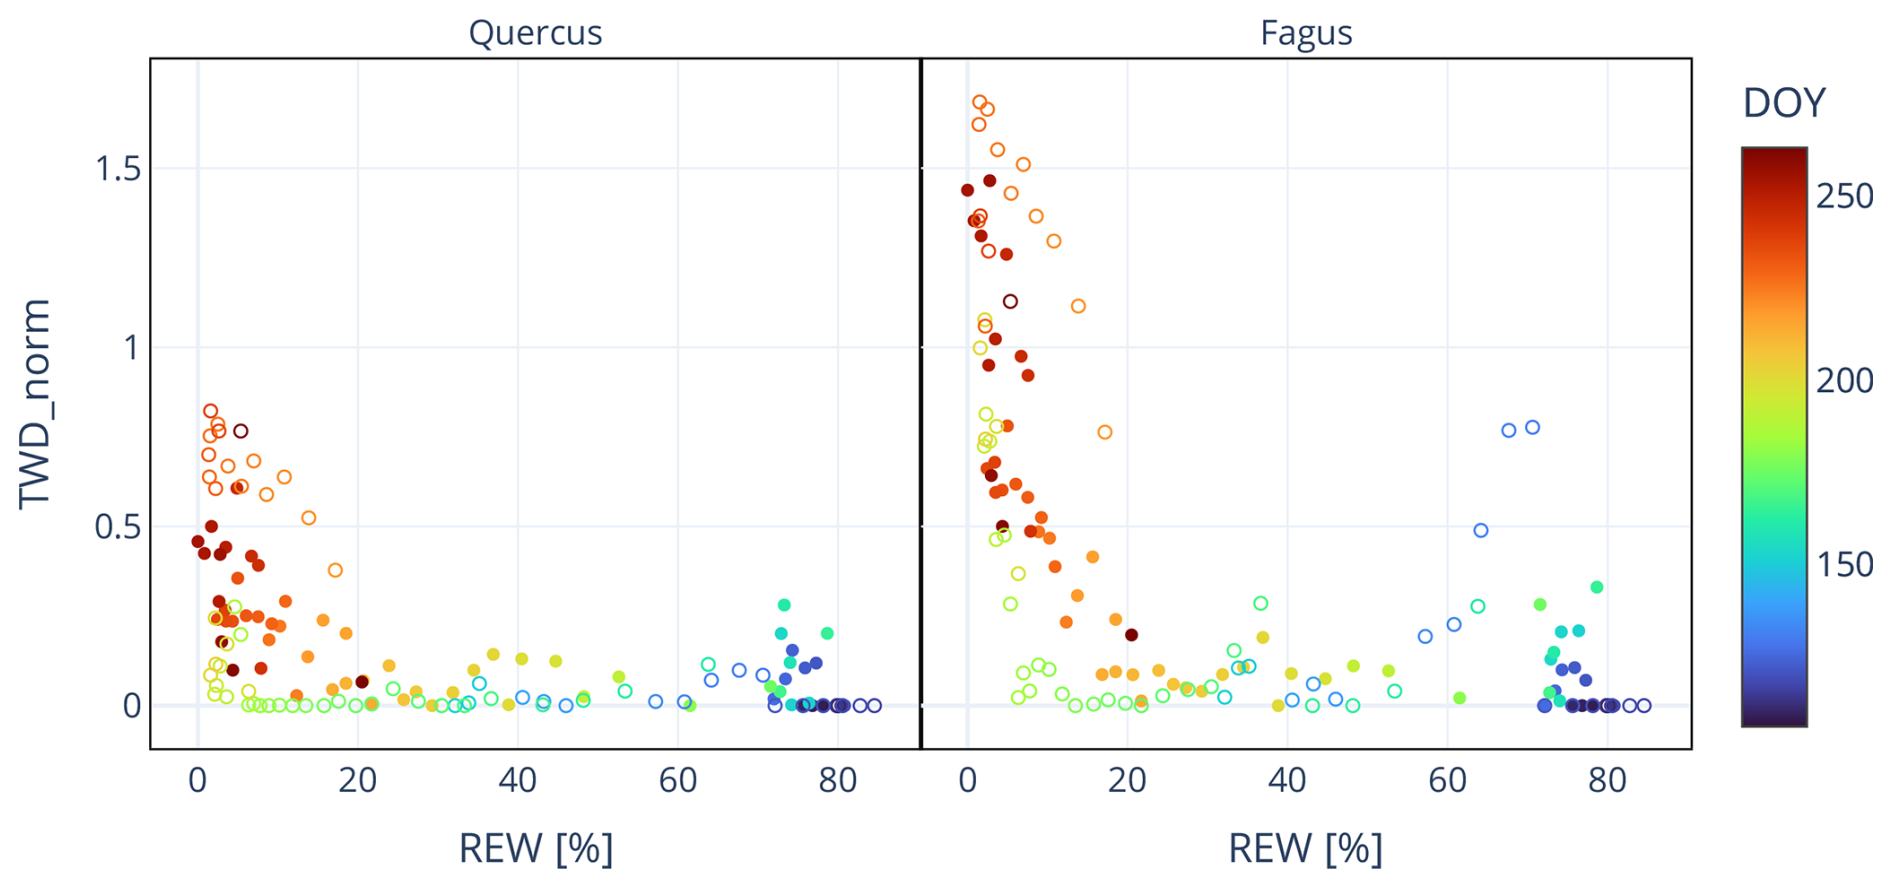
Figure 7Mean normalized tree water deficit (TWDnorm) of Oak and Beeach in relation to soil moisture expressed as relative extractable water (REW). Filled circles: 2024, open circles: 2025.
4.1.3 Stem water flow – crown bark resistance
The water flow in the xylem of a selected oak and beech tree synchronously follows a change in electrical resistance in the bark of the crown (Fig. 8). The measured water flow densities of the beech tree were slightly higher than those of the oak tree at noon on all three days, and on 10 July, they were almost twice as high before and after the midday overcast. The sap flow in the beech tree always started one to 2 h later than in the oak tree, but then rose steeply and ended earlier in the evening (except on 10 July). The changes in sap flow density follow the changes in resistance in the bark tissue of the crown with a delay of 1–1.5 h (second row panels, Fig. 8). The amplitudes and absolute electrical resistances were significantly higher in beech (7–14.4 kOhm) than in oak (2.6–4.3 kOhm). This delay between the resistance increase in the crown, which is related to the water content of the tissue, and the water flow in the trunk at a height of approximately 1.30 m is due, on the one hand, to the low temporal resolution of the electrical resistance measurement (2 h vs. 10 min for sap flow), but above all to the spatial distance. This also leads to the observed hysteresis between the two parameters (third row panels, Fig. 8).
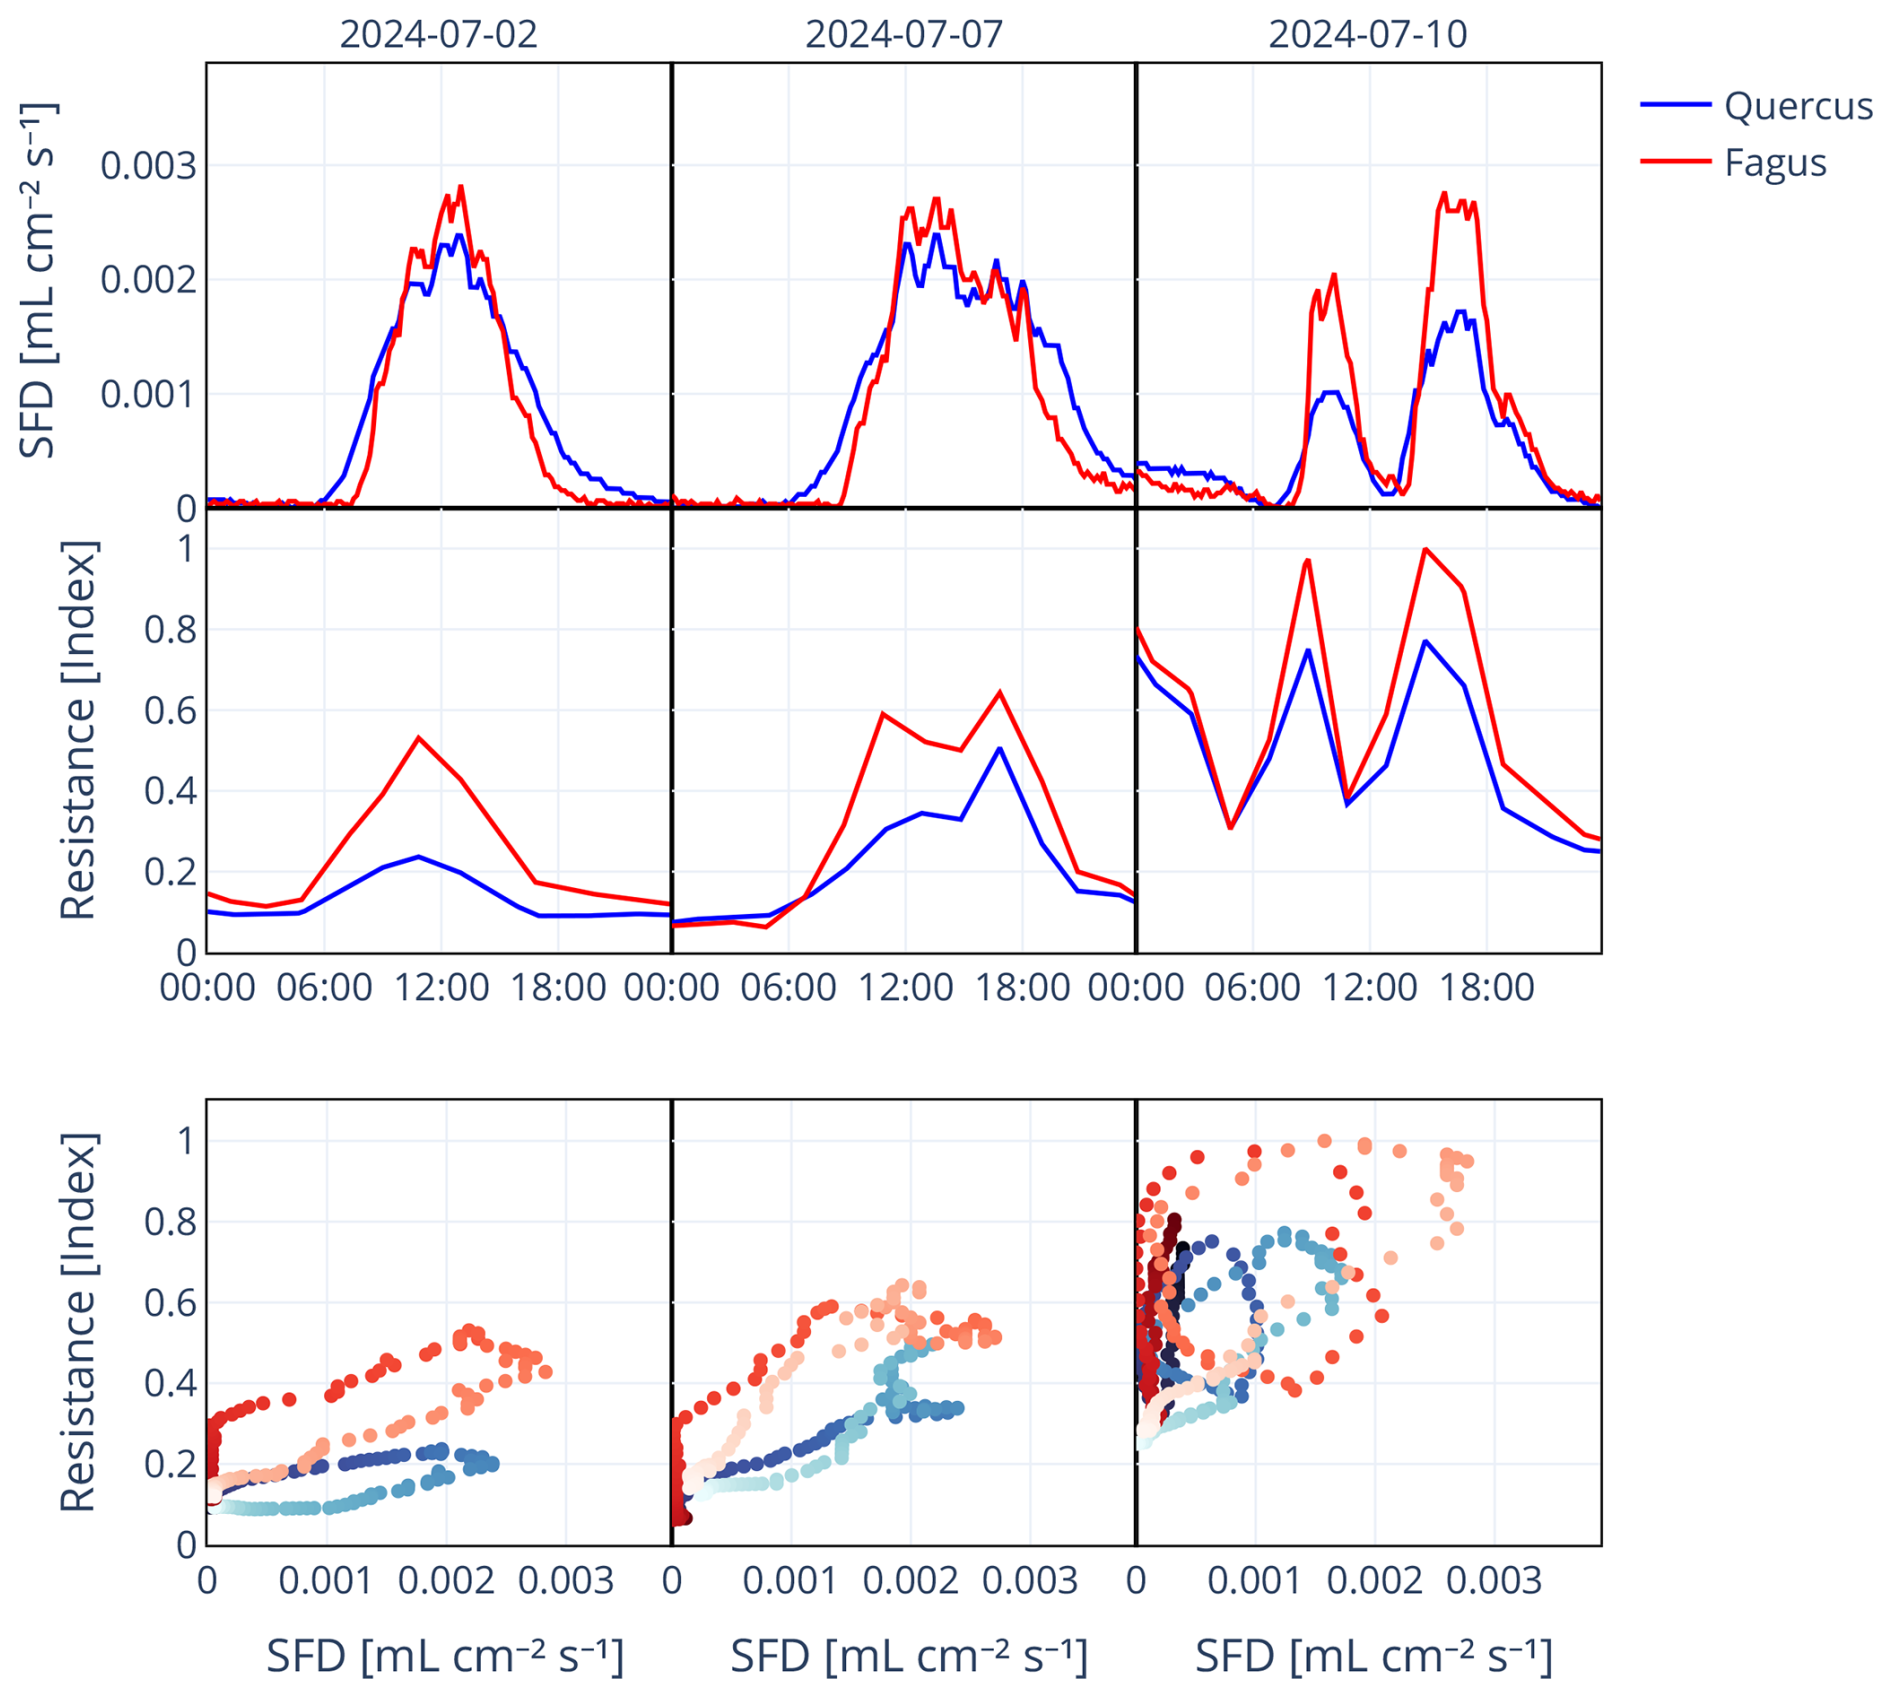
Figure 8Relationship between sap flow density (SFD, top) and the index of resistance of the TreeSense pulse crown vitality sensors (middle) of beech (F4, red) and oak (Q9, blue) at Site 1 on three sunny days in July 2024. The bottom panel illustrates the hysteresis between both parameters. Lighter coloured dots are later in the day. Note that the resistance was measured every 2 h and linearly interpolated to match the 10 min frequency of SFD.
4.2 Multispectral monitoring
In the presented project, the study sites are monitored by performing multispectral UAS photography flights at least once a month. The two upper subplots in Fig. 9 show NDVI and the NDRE derived from these measurement flights of beeches and oaks at all three locations, UAS1 being the observations at Site 1 and UAS2 and UAS3 the observations on Site 2 and 3 respectively. The NDVI, typically used to indicate vegetation vitality, remains relatively stable until autumn, when its values drop markedly. During the winter months, when trees are leafless, no measurement flights were conducted. With the onset of spring and the emergence of new foliage, NDVI values rise again.
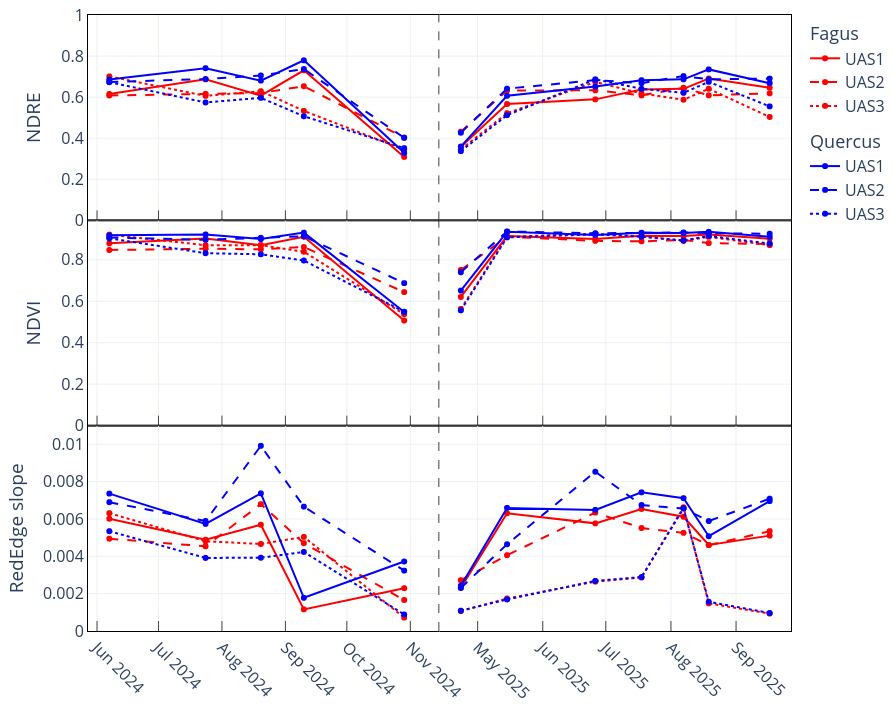
Figure 9Averaged NDVI, NDRE, and red-edge slope values for beech and oak trees at three test sites, derived from UAS measurements during the vegetation periods of 2024 and 2025.
The NDRE follows a similar seasonal trend; however, its variance is greater due to the direct use of the red-edge wavelength range. This range is closely correlated with the water content of tree foliage and is therefore more responsive to heat stress or to the drying phase that precedes leaf discolouration in autumn.
While NDVI and NDRE are dimensionless indices derived from reflectance ratios, a direct examination of the red-edge spectral information enables a more detailed assessment of leaf vitality. The red-edge region is closely associated with the water status and physiological condition of tree foliage, and thus provides greater sensitivity to stress factors such as drought or heat than vegetation indices alone (Boochs et al., 1990). The bottom panel in Fig. 9 illustrates the transition from summer to autumn with particular emphasis on the red-edge spectral range, using the red-edge slope (cf. Table 4). Notably, the red-edge slope reveals a decline in leaf vitality as early as September, whereas NDVI and NDRE reflect this drop only from October onwards. This earlier signal was consistently observed across all three study sites, underscoring the higher sensitivity of the red-edge slope to early signs of foliage stress.
4.3 Preliminary interpretation of results
The results presented in this study represent an initial assessment of the ongoing measurements and therefore only allow for a preliminary interpretation. Nevertheless, several consistent patterns can already be identified across the different datasets.
First observations indicate that tree growth varies systematically between the three study sites, with the highest growth rates occurring at the moistest site and the lowest growth rates at the driest site. This suggests that site-specific water availability plays a key role in controlling growth dynamics.
Furthermore, differences between the investigated tree species become apparent. Beech appears to respond more directly to changing environmental conditions than oak, showing a faster decline in growth during periods of low soil moisture, but also a more rapid recovery when conditions improve.
The influence of environmental drivers also seems to vary between sites. At the intermediate site, tree growth appears to be most strongly controlled by climatic variability. In contrast, growth at the moist site may be less limited by short-term fluctuations due to generally sufficient water availability, while trees at the driest site may exhibit a higher degree of adaptation to water-limited conditions.
Across all sites, soil moisture appears to have a stronger influence on growth dynamics than temperature. Periods of higher water availability are consistently associated with increased growth, highlighting the importance of water supply as a primary limiting factor.
These observations provide a first indication of species-specific and site-dependent responses to varying environmental conditions. However, further analyses based on longer time series and additional measurements are required to confirm these patterns and to better understand the underlying processes.
The presented work documents the measurement instruments employed in the project, provides example datasets, and illustrates selected cross-correlations. It is conceived as a reference paper that documents and harmonises established in-situ and remote-sensing approaches for tree vitality monitoring. The individual measurement techniques themselves are not novel, as many have been widely applied in environmental research and have proven to be robust and reliable. In this context, the most recent technological component is the use of uncrewed aircraft systems (UAS) to acquire high-resolution multispectral data.
At the outset of this study, the research questions guiding the project were defined. These questions aim, on the one hand, to enhance the climate resilience of beech and oak and, on the other hand, to strengthen forestry revenues in regions expected to be increasingly affected by climate change.
The project's results are intended to inform maintenance and thinning measures and to support decision-making in forestry practice. Beyond short-term management interventions, the findings aim to contribute to future planting recommendations by providing insights into the site-specific performance and drought resilience of beech and oak. In this context, the project addresses the question of whether sites currently suitable for these species will remain viable under future climatic conditions.
The novelty of this study does not lie in the development of individual measurement techniques, but in the integrative combination of all in-situ and remote-sensing approaches within a coherent monitoring framework. This integrated setup, as implemented in the DryTrees project, demonstrates the potential of combining multi-source observations across spatial and temporal scales.
The temporal, spatial, and spectral resolution of the measurement setup at the three study sites is considered sufficient to address the research questions defined at the beginning of the study.
A central objective is to assess the transferability and scalability of ground-based and UAS-derived observations to satellite data. Initial analyses indicate, however, that Sentinel-2 imagery does not reveal measurable drought-stress effects at tree scale at the study sites, even during the markedly dry years of 2018 and 2019. Consequently, future analyses will require alternative satellite products with higher spatial resolution. In this context, PlanetScope imagery, with a ground sampling distance of approximately 3 m, represents a promising option.
Based on sap flow measurements, stand-level water use will be quantified for our study sites as a function of soil moisture and be linked to remotely sensed data to upscale water-use estimates to larger scales.
In addition, interannual tree-ring width measurements will be analysed to assess growth responses to extreme drought years, which have occurred with increasing frequency in recent decades. Intra-annual stem radius measurements will be examined to investigate growth dynamics during pronounced drought phases.
Future research should focus on disentangling short-term physiological stress responses from longer-term structural vitality changes in beech and oak. In particular, the potential of PAR-related proxies (Gamon et al., 2023; D'Odorico et al., 2025) derived from multispectral UAS data should be systematically evaluated along environmental gradients such as elevation and site exposure.
A comparative analysis of PAR proxies, red-edge-based metrics (e.g. red-edge slope), and PRI may provide insights into their relative sensitivity to acute drought stress, heat events, and phenological changes. Coupling these remote-sensing indicators with high-frequency in-situ measurements (sap flow, electrical resistance) offers the opportunity to identify early-warning signals of tree stress and to quantify potential time lags between physiological responses and spectral changes.
Beyond univariate correlations, future work should aim to develop integrative vitality indices that combine multispectral UAS observations with ground-based measurements into a multivariate assessment framework. Such indices could support the definition of stress thresholds and vitality classes, potentially contributing to early detection of critical stress states and mortality risk.
Finally, the transferability of UAS-derived indicators to satellite-based observations should be further investigated. Given the limited sensitivity of Sentinel-2 at tree scale, higher-resolution satellite products such as PlanetScope represent a promising avenue for upscaling site-level monitoring to landscape-scale assessments.
The data collected is the property of the Baden-Württemberg Foundation and are not publicly available.
MM conceived and designed the study, drafted the manuscript, and coordinated contributions from all co-authors. SE and AN wrote specific sections and contributed key project-related content; GS, TS, and JS each prepared a dedicated section. AB, VH, and SH critically reviewed the manuscript, improving its clarity, structure, and overall coherence. VH also supervised the project and provided strategic guidance. All authors read and approved the final manuscript, contributing to the integrative perspective of the study.
The contact author has declared that none of the authors has any competing interests.
Publisher's note: Copernicus Publications remains neutral with regard to jurisdictional claims made in the text, published maps, institutional affiliations, or any other geographical representation in this paper. The authors bear the ultimate responsibility for providing appropriate place names. Views expressed in the text are those of the authors and do not necessarily reflect the views of the publisher.
We thank the Baden-Württemberg Foundation for funding this project. We also thank the town of Hechingen and the forestry department, who supported us in locating and providing the study sites. We acknowledge support from the Open Access Publication Fund of the University of Tübingen.
AI-based language assistance was used for stylistic editing and sentence structure refinement.
This research has been supported by the Baden-Württemberg Stiftung (grant no. KLR-024).
This open-access publication was funded by the Open Access Publication Fund of the University of Tübingen.
This paper was edited by Lev Eppelbaum and reviewed by three anonymous referees.
AG Boden: Bodenkundliche Kartieranleitung, 6th edn., Schweizerbart'sche Verlagsbuchhandlung, Stuttgart, ISBN 978-3-510-95920-4, 2024. a
Ahrens, C. W., Challis, A., Byrne, M., Leigh, A., Nicotra, A. B., Tissue, D., and Rymer, P.: Repeated extreme heatwaves result in higher leaf thermal tolerances and greater safety margins, New Phytol., 232, 1212–1225, https://doi.org/10.1111/nph.17640, 2021. a
Allen, C. D., Macalady, A. K., Chenchouni, H., Bachelet, D., McDowell, N., Vennetier, M., Kitzberger, T., Rigling, A., Breshears, D. D., Hogg, E. T., Gonzalez, P., Fensham, R., Zhang, Z., Castro, J., Demidova, N., Lim, J.-H., Allard, G., Running, S. W., Semerci, A., and Cobb, N.: A global overview of drought and heat-induced tree mortality reveals emerging climate change risks for forests, Forest Ecol. Manage., 259, 660–684, https://doi.org/10.1016/j.foreco.2009.09.001, 2010. a
Anev, S., Marinova, A., Tzvetkova, N., Panayotov, M., and Yurukov, S.: Stomatal control on photosynthesis in drought-treated subalpine pine saplings, Genetics and Plant Physiology, 6, 43–53, 2016. a
Arbeitskreis Standortkartierung: Forstliche Standortsaufnahme: Begriffe, Definitionen, Einteilungen, Kennzeichnungen, Erläuterungen, 7th edn., IHW-Verlag, Eching bei München, ISBN 9783930167807, 2016. a
Berdanier, A. B., Miniat, C. F., and Clark, J. S.: Predictive models for radial sap flux variation in coniferous, diffuse-porous and ring-porous temperate trees, Tree Physiol., 36, 932–941, https://doi.org/10.1093/treephys/tpw027, 2016. a
Boehm, W.: General Survey of Root-Study Methods, Springer Berlin Heidelberg, Berlin, Heidelberg, ISBN 978-3-642-67282-8, 2–4, https://doi.org/10.1007/978-3-642-67282-8_2, 1979. a
Boochs, F., Kupfer, G., Dockter, K., and Kühbauch, W.: Shape of the red edge as vitality indicator for plants, Int. J. Remote Sens., 11, 1741–1753, https://doi.org/10.1080/01431169008955127, 1990. a, b
Borchert, R.: Electric resistance as a measure of tree water status during seasonal drought in a tropical dry forest in Costa Rica, Tree Physiol., 14, 299–312, https://doi.org/10.1093/treephys/14.3.299, 1994. a
Bradford, J. B., Shriver, R. K., Robles, M. D., McCauley, L. A., Woolley, T. J., Andrews, C. A., Crimmins, M., and Bell, D. M.: Tree mortality response to drought-density interactions suggests opportunities to enhance drought resistance, J. Appl. Ecol., 59, 549–559, https://doi.org/10.1111/1365-2664.14073, 2022. a
Cassel, D. K. and Nielsen, D. R.: Field Capacity and Available Water Capacity, Chap. 36, John Wiley & Sons, Ltd, ISBN 9780891188643, 901–926, https://doi.org/10.2136/sssabookser5.1.2ed.c36, 1986. a
Deliry, S. I. and Avdan, U.: Accuracy evaluation of UAS photogrammetry and structure from motion in 3D modeling and volumetric calculations, J. Appl. Remote Sens., 17, https://doi.org/10.1117/1.JRS.17.024515, 2023. a, b, c, d, e, f, g
Delta-T Devices Ltd: DL2e Data Logger Hardware Reference, Delta-T Devices Ltd, Burwell, Cambridge, UK, document code: DL2-UM-05-03, https://www.labima.unifi.it/upload/sub/Strumentazione/Manuali/DL2e%20Logger%20Hardware%20Reference%20v3.0.pdf (last access: 13 April 2026), 2000. a, b
Deslauriers, A., Morin, H., Urbinati, C., and Carrer, M.: Daily weather response of balsam fir (Abies balsamea (L.) Mill.) stem radius increment from dendrometer analysis in the boreal forests of Québec (Canada), Trees, 17, 477–484, https://doi.org/10.1007/s00468-003-0260-4, 2003. a
D'Odorico, P., Fawcett, D., Peters, R., Steger, D., Zhorzel, T., Hoch, G., Basler, D., Ginzler, C., Eisenring, M., Glauser, G., Zweifel, R., Gessler, A., and Kahmen, A.: Deciphering tree drought responses across species: linking leaf water potentials with remote sensing greenness and photoprotection dynamics, Agr. Forest Meteorol., 375, 110856, https://doi.org/10.1016/j.agrformet.2025.110856, 2025. a
Downes, G., Beadle, C., Gensler, W., and Mummery, D.: Diurnal variation and radial growth of stems in young plantation eucalypts, Cabi Publishing, Cambridge, p. 85, ISBN 0851993125, 1999. a
Ecke, S., Stehr, F., Dempewolf, J., Frey, J., Klemmt, H.-J., Seifert, T., and Tiede, D.: Species-specific machine learning models for UAV-based forest health monitoring: Revealing the importance of the BNDVI, Int. J. Appl. Earth Obs., 135, 104257, https://doi.org/10.1016/j.jag.2024.104257, 2024. a
Gamon, J. A., Wang, R., and Russo, S. E.: Contrasting photoprotective responses of forest trees revealed using PRI light responses sampled with airborne imaging spectrometry, New Phytol., 238, 1318–1332, https://doi.org/10.1111/nph.18754, 2023. a
Gärtner, H. and Nievergelt, D.: The Core-Microtome: A New Tool for Surface Preparation on Cores and Time Series Analysis of Varying Cell Parameters, Dendrochronologia, 28, 85–92, https://doi.org/10.1016/j.dendro.2009.09.002, 2010. a
Gauthey, A., Kahmen, A., Limousin, J.-M., Vilagrosa, A., Didion-Gency, M., Mas, E., Milano, A., Tunas, A., and Grossiord, C.: High heat tolerance, evaporative cooling, and stomatal decoupling regulate canopy temperature and their safety margins in three European oak species, Glob. Change Biol., 30, e17439, https://doi.org/10.1111/gcb.17439, e17439 GCB-24-0465.R1, 2024. a
Goebel, M. and Iwaszczuk, D.: Spectral analysis of images of plants under stress using a close-range camera, Int. Arch. Photogramm. Remote Sens. Spatial Inf. Sci., XLVIII-1/W3-2023, 63–69, https://doi.org/10.5194/isprs-archives-XLVIII-1-W3-2023-63-2023, 2023. a
Goff, J. A. and Gratch, S.: Low-pressure properties of water from −160 to 212 °F, Transactions of the American Society of Heating and Ventilating Engineers, 95–122, 1946. a
Granier, A.: Une nouvelle méthode pour la mesure du flux de sève brute dans le tronc des arbres, Ann. For. Sci., 42, 193–200, https://doi.org/10.1051/forest:19850204, 1985. a, b
Granier, A.: Evaluation of transpiration in a Douglas-fir stand by means of sap flow measurements, Tree Physiol., 3, 309–320, https://doi.org/10.1093/treephys/3.4.309, 1987. a, b, c, d
Horler, D. N. H., Dockray, M., and Barber, J.: The red edge of plant leaf reflectance, Int. J. Remote Sens., 4, 273–288, https://doi.org/10.1080/01431168308948546, 1983. a
Iglhaut, J., Cabo, C., Puliti, S., Piermattei, L., O'Connor, J., and Rosette, J.: Structure from Motion Photogrammetry in Forestry: a Review, Current Forestry Reports, 5, 155–168, https://doi.org/10.1007/s40725-019-00094-3, 2019. a, b, c, d, e, f
IUSS Working Group WRB: World Reference Base for Soil Resources: International Soil Classification System for Naming Soils and Creating Legends for Soil Maps, 4th edn., International Union of Soil Sciences (IUSS), Vienna, Austria, ISBN 979-8-9862451-1-9, https://files.isric.org/public/documents/WRB_fourth_edition_2022-12-18.pdf (last access: 13 April 2026), 2022. a
Köcher, P., Horna, V., and Leuschner, C.: Environmental control of daily stem growth patterns in five temperate broad-leaved tree species, Tree Physiol., 32, 1021–1032, https://doi.org/10.1093/treephys/tps049, 2012. a
Kosola, K., Dickmann, D., Paul, E., and Parry, D.: Repeated insect defoliation effects on growth, nitrogen acquisition, carbohydrates, and root demography of poplars, Oecologia, 129, 65–74, https://doi.org/10.1007/s004420100694, 2001. a
Lloret, F., Keeling, E. G., and Sala, A.: Components of Tree Resilience: Effects of Successive Low-Growth Episodes in Old Ponderosa Pine Forests, Oikos, 120, 1909–1920, https://doi.org/10.1111/j.1600-0706.2011.19372.x, 2011. a
Lu, P., Urban, L., and Zhao, P.: Granier's thermal dissipation probe (TDP) method for measuring sap flow in trees: theory and practice, Acta Bot. Sin., 46, 631–646, 2004. a
Malhi, Y., Franklin, J., Seddon, N., Solan, M., Turner, M. G., Field, C. B., and Knowlton, N.: Climate change and ecosystems: threats, opportunities and solutions, Philos. T. Roy. Soc. B, 375, 20190104, https://doi.org/10.1098/rstb.2019.0104, 2020. a
Mancini, F., Dubbini, M., Gattelli, M., Stecchi, F., Fabbri, S., and Giovanni, G.: Using Unmanned Aerial Vehicles (UAV) for High-Resolution Reconstruction of Topography: The Structure from Motion Approach on Coastal Environments, Remote Sens., 5, 6880–6898, https://doi.org/10.3390/rs5126880, 2013. a, b, c
Martinez-Trinidad, T., Watson, W. T., Arnold, M. A., Lombardini, L., and Appel, D. N.: Comparing various techniques to measure tree vitality of live oaks, Urban For. Urban Gree., 9, 199–203, https://doi.org/10.1016/j.ufug.2010.02.003, 2010. a, b, c
Matasov, V., Belelli Marchesini, L., Yaroslavtsev, A., Sala, G., Fareeva, O., Seregin, I., Castaldi, S., Vasenev, V., and Valentini, R.: IoT Monitoring of Urban Tree Ecosystem Services: Possibilities and Challenges, Forests, 11, 775, https://doi.org/10.3390/f11070775, 2020. a
Maxwell, K. and Johnson, G. N.: Chlorophyll fluorescence – a practical guide, J. Exp. Bot., 51, 659–668, https://doi.org/10.1093/jxb/51.345.659, 2000. a
MEGATRON Elektronik GmbH & Co. KG: DS MM10 – Potentiometrischer Wegsensor, Datenblatt, https://www.megatron.de/fileadmin/user_upload/Datenblaetter/Wegsensoren/Potentiometrische/DS_MM10_dt.pdf (last access: 6 March 2026), 2026. a
Messaoud, Y.: Tree Growth in Relation to Climate Change: Understanding the Impact on Species Worldwide, Forests, 15, 1601, https://doi.org/10.3390/f15091601, 2024. a
METER Group, Inc.: TEROS 10 Soil Moisture Sensor, https://metergroup.com/de/products/teros-10/ (last access: 6 March 2026), 2026. a
Mlambo, R., Woodhouse, I., Gerard, F., and Anderson, K.: Structure from Motion (SfM) Photogrammetry with Drone Data: A Low Cost Method for Monitoring Greenhouse Gas Emissions from Forests in Developing Countries, Forests, 8, https://doi.org/10.3390/f8030068, 2017. a
Niessner, A., Ehekircher, S., Zimmermann, R., Horna, V., Reichle, D., Land, A., Spangenberg, G., and Hein, S.: Soil drought sets site specific limits to stem radial growth and sap flow of Douglas-fir across Germany, Front. Plant Sci., 15, https://doi.org/10.3389/fpls.2024.1401833, 2024. a, b, c
Niessner, A., Ehekircher, S., Spangenberg, G., Zimmermann, R., Land, A., and Hein, S.: Measured and simulated tree and stand water use of Douglas-fir along a climatic gradient across Germany, iForest, 18, 309–318, https://doi.org/10.3832/ifor4922-018, 2025. a, b, c
Ostrofsky, W. and Shortle, W.: Applications of the shigometer for assessing tree and forest health and wood product quality – A review, Trop. Plant Pathol., 6, 39–57, 1989. a
Peters, R. L., Basler, D., Zweifel, R., Steger, D. N., Zhorzel, T., Zahnd, C., Hoch, G., and Kahmen, A.: Normalized tree water deficit: an automated dendrometer signal to quantify drought stress in trees, New Phytol., 247, 1186–1198, https://doi.org/10.1111/nph.70266, 2025. a
Pfenninger, M., Langan, L., Feldmeyer, B., Eberhardt, L., Reuss, F., Hoffmann, J., Fussi, B., Seho, M., Mellert, K.-H., and Hickler, T.: Predicting Forest Tree Leaf Phenology Under Climate Change Using Satellite Monitoring and Population-Based Genomic Trait Association, Glob. Change Biol., 31, e70484, https://doi.org/10.1111/gcb.70484, 2025. a
Polade, S. D., Pierce, D. W., Cayan, D. R., Gershunov, A., and Dettinger, M. D.: The key role of dry days in changing regional climate and precipitation regimes, Sci. Rep., 4, 4364, https://doi.org/10.1038/srep04364, 2014. a
Roloff, A. (Ed.): Trockenstress bei Bäumen: Ursachen, Strategien, Praxis, Quelle & Meyer, Wiebelsheim, Deutschland, ISBN 978-3-494-01858-4, 2021. a
Shestakova, T. A., Voltas, J., Saurer, M., Berninger, F., Esper, J., Andreu-Hayles, L., Daux, V., Helle, G., Leuenberger, M., Loader, N. J., Masson-Delmotte, V., Saracino, A., Waterhouse, J. S., Schleser, G. H., Bednarz, Z., Boettger, T., Dorado-Liñán, I., Filot, M., Frank, D., Grabner, M., Haupt, M., Hilasvuori, E., Jungner, H., Kalela-Brundin, M., Krąpiec, M., Marah, H., Pawełczyk, S., Pazdur, A., Pierre, M., Planells, O., Pukienė, R., Reynolds-Henne, C. E., Rinne-Garmston (Rinne), K. T., Rita, A., Sonninen, E., Stiévenard, M., Switsur, V. R., Szychowska-Kra̧piec, E., Szymaszek, M., Todaro, L., Treydte, K., Vitas, A., Weigl, M., Wimmer, R., and Gutiérrez, E.: Spatio-temporal patterns of tree growth as related to carbon isotope fractionation in European forests under changing climate, Global Ecol. Biogeogr., 28, 1295–1309, https://doi.org/10.1111/geb.12933, 2019. a
Shigo, A. L.: Compartmentalization: A Conceptual Framework for Understanding How Trees Grow and Defend Themselves, Annu. Rev. Phytopathol., 22, 189–214, https://doi.org/10.1146/annurev.py.22.090184.001201, 1984. a
Spectrum Technologies, Inc.: WatchDog 2000 Series Weather Stations Product Manual (Models 2550, 2700, 2800, 2900ET), product manual, https://envcoglobal.com/wp-content/uploads/2014/10/2000-seriesweatherstations-manual-20081.pdf (last access: 6 March 2026), 2008. a
Sperlich, D., Chang, C. T., Peñuelas, J., and Sabaté, S.: Responses of photosynthesis and component processes to drought and temperature stress: are Mediterranean trees fit for climate change?, Tree Physiol., 39, 1783–1805, https://doi.org/10.1093/treephys/tpz089, 2019. a
Suomalainen, J., Oliveira, R. A., Hakala, T., Koivumäki, N., Markelin, L., Näsi, R., and Honkavaara, E.: Direct reflectance transformation methodology for drone-based hyperspectral imaging, Remote Sens. Environ., 266, 112691, https://doi.org/10.1016/j.rse.2021.112691, 2021. a
Treesense GmbH: White paper: Monitoring des Wasserstatus von Bäumen durch elektrische Impuls-Widerstandsmessungen, Tech. rep., https://share-eu1.hsforms.com/1c2dP3glsQdG8QVzaofeStgfgev5 (last access: 29 January 2023), 2020. a, b
Waes, C., Baert, J., Carlier, L., and Bockstaele, E.: A rapid determination of the total sugar content and the average inulin chain length in roots of chicory (Cichorium intybus L), J. Sci. Food Agr., 76, 107–110, https://doi.org/10.1002/(SICI)1097-0010(199801)76:1<107::AID-JSFA911>3.0.CO;2-6, 1998. a
Xu, N., Tian, J., Tian, Q., Xu, K., and Tang, S.: Analysis of Vegetation Red Edge with Different Illuminated/Shaded Canopy Proportions and to Construct Normalized Difference Canopy Shadow Index, Remote Sens., 11, https://doi.org/10.3390/rs11101192, 2019. a, b
Zweifel, R., Haeni, M., Buchmann, N., and Eugster, W.: Are trees able to grow in periods of stem shrinkage?, New Phytol., 211, 839–849, https://doi.org/10.1111/nph.13995, 2016. a